Attached files
| file | filename |
|---|---|
| 8-K - 8-K - EDISON INTERNATIONAL | eix-20210916x8k.htm |
Exhibit 99.1
| Business Update Supplement — SCE 2021 General Rate Case Decision and 2021 Earnings Guidance September 16, 2021 |
| 1 Statements contained in this presentation about future performance, including, without limitation, operating results, capital expenditures, rate base growth, dividend policy, financial outlook, and other statements that are not purely historical, are forward-looking statements. These forward-looking statements reflect our current expectations; however, such statements involve risks and uncertainties. Actual results could differ materially from current expectations. These forward-looking statements represent our expectations only as of the date of this presentation, and Edison International assumes no duty to update them to reflect new information, events or circumstances. Important factors that could cause different results include, but are not limited to the: • ability of SCE to recover its costs through regulated rates, including uninsured wildfire-related and debris flow-related costs, costs incurred to mitigate the risk of utility equipment causing future wildfires, costs incurred to implement SCE's new customer service system and costs incurred as a result of the COVID-19 pandemic; • ability of SCE to implement its Wildfire Mitigation Plan; • risks of regulatory or legislative restrictions that would limit SCE’s ability to implement Public Safety Power Shutoff (“PSPS”) when conditions warrant or would otherwise limit SCE’s operational PSPS practices; • risks associated with implementing PSPS, including regulatory fines and penalties, claims for damages and reputational harm; • ability of SCE to maintain a valid safety certification; • ability to obtain sufficient insurance at a reasonable cost, including insurance relating to SCE's nuclear facilities and wildfire-related claims, and to recover the costs of such insurance or, in the event liabilities exceed insured amounts, the ability to recover uninsured losses from customers or other parties; • extreme weather-related incidents (including events caused, or exacerbated, by climate change, such as wildfires, debris flows, droughts, high wind events and extreme heat events) and other natural disasters (such as earthquakes), which could cause, among other things, public safety issues, property damage, operational issues (such as rotating outages and issues due to damaged infrastructure), PSPS activations and unanticipated costs; • risks associated with California Assembly Bill 1054 (“AB 1054”) effectively mitigating the significant risk faced by California investor-owned utilities related to liability for damages arising from catastrophic wildfires where utility facilities are alleged to be a substantial cause, including the longevity of the Wildfire Insurance Fund and the CPUC's interpretation of and actions under AB 1054, including its interpretation of the new prudency standard established under AB 1054; • ability of SCE to effectively manage its workforce, including its contract workers; • decisions and other actions by the California Public Utilities Commission, the Federal Energy Regulatory Commission, the Nuclear Regulatory Commission and other governmental authorities, including decisions and actions related to nationwide or statewide crisis, determinations of authorized rates of return or return on equity, the recoverability of wildfire-related and debris-flow-related costs, issuance of SCE's wildfire safety certification, wildfire mitigation efforts, and delays in executive, regulatory and legislative actions; • ability of Edison International or SCE to borrow funds and access bank and capital markets on reasonable terms; • risks associated with the decommissioning of San Onofre, including those related to worker and public safety, public opposition, permitting, governmental approvals, on- site storage of spent nuclear fuel, delays, contractual disputes, and cost overruns; • pandemics, such as COVID-19, and other events that cause regional, statewide, national or global disruption, which could impact, among other things, Edison International's and SCE's business, operations, cash flows, liquidity and/or financial results and cause Edison International and SCE to incur unanticipated costs; • physical security of Edison International's and SCE's critical assets and personnel and the cybersecurity of Edison International's and SCE's critical information technology systems for grid control, and business, employee and customer data; • risks associated with cost allocation resulting in higher rates for utility bundled service customers because of possible customer bypass or departure for other electricity providers such as Community Choice Aggregators (“CCA,” which are cities, counties, and certain other public agencies with the authority to generate and/or purchase electricity for their local residents and businesses) and Electric Service Providers (entities that offer electric power and ancillary services to retail customers, other than electrical corporations (like SCE) and CCAs); • risks inherent in SCE's transmission and distribution infrastructure investment program, including those related to project site identification, public opposition, environmental mitigation, construction, permitting, power curtailment costs (payments due under power contracts in the event there is insufficient transmission to enable acceptance of power delivery), changes in the California Independent System Operator’s transmission plans, and governmental approvals; and • risks associated with the operation of transmission and distribution assets and power generating facilities, including worker and public safety issues, the risk of utility assets causing or contributing to wildfires, failure, availability, efficiency, and output of equipment and facilities, and availability and cost of spare parts. Other important factors are discussed under the headings “Forward-Looking Statements”, “Risk Factors” and “Management’s Discussion and Analysis” in Edison International’s Form 10-K and other reports filed with the Securities and Exchange Commission, which are available on our website: www.edisoninvestor.com. These filings also provide additional information on historical and other factual data contained in this presentation. Forward-Looking Statements September 16, 2021 |
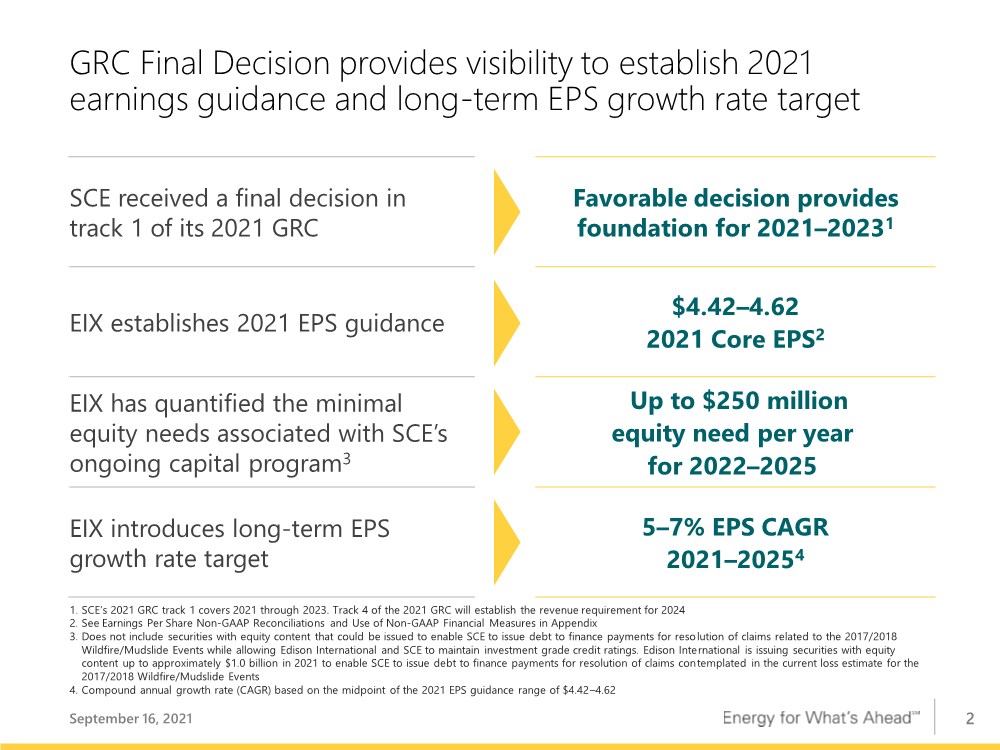
| 2 GRC Final Decision provides visibility to establish 2021 earnings guidance and long-term EPS growth rate target SCE received a final decision in track 1 of its 2021 GRC Favorable decision provides foundation for 2021–20231 EIX establishes 2021 EPS guidance $4.42–4.62 2021 Core EPS2 EIX has quantified the minimal equity needs associated with SCE’s ongoing capital program3 Up to $250 million equity need per year for 2022–2025 EIX introduces long-term EPS growth rate target 5–7% EPS CAGR 2021–20254 1. SCE’s 2021 GRC track 1 covers 2021 through 2023. Track 4 of the 2021 GRC will establish the revenue requirement for 2024 2. See Earnings Per Share Non-GAAP Reconciliations and Use of Non-GAAP Financial Measures in Appendix 3. Does not include securities with equity content that could be issued to enable SCE to issue debt to finance payments for resolution of claims related to the 2017/2018 Wildfire/Mudslide Events while allowing Edison International and SCE to maintain investment grade credit ratings. Edison International is issuing securities with equity content up to approximately $1.0 billion in 2021 to enable SCE to issue debt to finance payments for resolution of claims contemplated in the current loss estimate for the 2017/2018 Wildfire/Mudslide Events 4. Compound annual growth rate (CAGR) based on the midpoint of the 2021 EPS guidance range of $4.42–4.62 September 16, 2021 |
| 3 2021 GRC track 1: CPUC’s final decision supports critical investments and provides foundation through 2023 September 16, 2021 On August 19, CPUC issued a final decision in track 1 of SCE’s 2021 GRC, focused on balancing necessary spending on safety and reliability with affordability One of the first rate cases to consider a broad range of wildfire mitigations, including large deployment of covered conductor in SCE’s high fire risk areas Authorizes $6.9 billion base revenue, ~90% of request Primary O&M reductions to wildfire insurance premiums and vegetation management costs; however, not expected to materially affect earnings or execution because of balancing and memo accounts for costs above authorized Final decision increased scope of Wildfire Covered Conductor Program to 4,500 miles, while allowing additional spending to be tracked in a memo account Approves ~98% of non-wildfire mitigation-related capital, providing funding for safety and reliability, and continued implementation of California’s public policy goals |
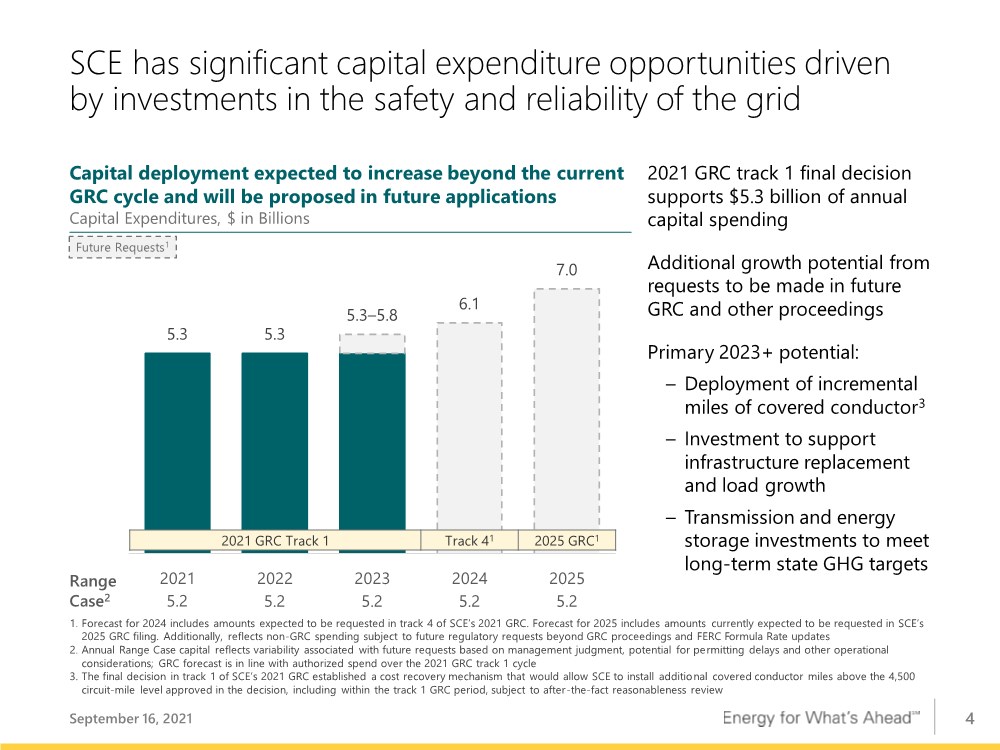
| 4 Range Case2 5.2 5.2 5.2 5.2 5.2 5.3 5.3 5.3–5.8 6.1 7.0 2021 2022 2023 2024 2025 SCE has significant capital expenditure opportunities driven by investments in the safety and reliability of the grid September 16, 2021 Capital deployment expected to increase beyond the current GRC cycle and will be proposed in future applications Capital Expenditures, $ in Billions 2021 GRC track 1 final decision supports $5.3 billion of annual capital spending Additional growth potential from requests to be made in future GRC and other proceedings Primary 2023+ potential: – Deployment of incremental miles of covered conductor3 – Investment to support infrastructure replacement and load growth – Transmission and energy storage investments to meet long-term state GHG targets 1. Forecast for 2024 includes amounts expected to be requested in track 4 of SCE’s 2021 GRC. Forecast for 2025 includes amounts currently expected to be requested in SCE’s 2025 GRC filing. Additionally, reflects non-GRC spending subject to future regulatory requests beyond GRC proceedings and FERC Formula Rate updates 2. Annual Range Case capital reflects variability associated with future requests based on management judgment, potential for permitting delays and other operational considerations; GRC forecast is in line with authorized spend over the 2021 GRC track 1 cycle 3. The final decision in track 1 of SCE’s 2021 GRC established a cost recovery mechanism that would allow SCE to install additional covered conductor miles above the 4,500 circuit-mile level approved in the decision, including within the track 1 GRC period, subject to after-the-fact reasonableness review Future Requests1 2021 GRC Track 1 Track 41 2025 GRC1 |
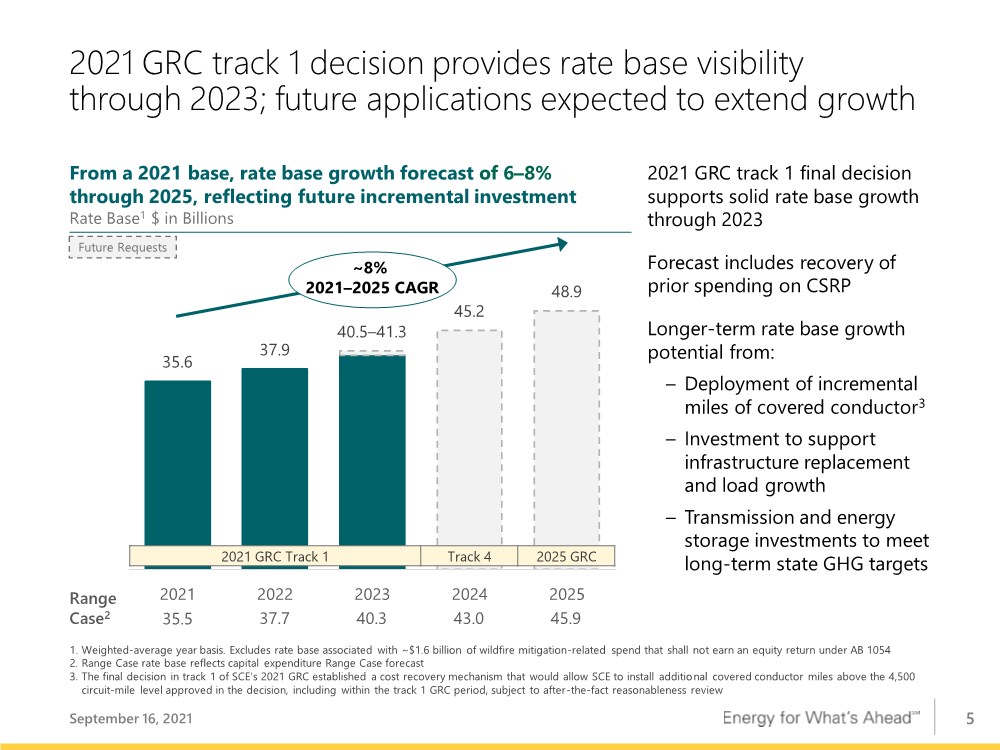
| 5 Range Case2 35.5 37.7 40.3 43.0 45.9 2021 GRC track 1 decision provides rate base visibility through 2023; future applications expected to extend growth September 16, 2021 1. Weighted-average year basis. Excludes rate base associated with ~$1.6 billion of wildfire mitigation-related spend that shall not earn an equity return under AB 1054 2. Range Case rate base reflects capital expenditure Range Case forecast 3. The final decision in track 1 of SCE’s 2021 GRC established a cost recovery mechanism that would allow SCE to install additional covered conductor miles above the 4,500 circuit-mile level approved in the decision, including within the track 1 GRC period, subject to after-the-fact reasonableness review From a 2021 base, rate base growth forecast of 6–8% through 2025, reflecting future incremental investment Rate Base1 $ in Billions 2021 GRC track 1 final decision supports solid rate base growth through 2023 Forecast includes recovery of prior spending on CSRP Longer-term rate base growth potential from: – Deployment of incremental miles of covered conductor3 – Investment to support infrastructure replacement and load growth – Transmission and energy storage investments to meet long-term state GHG targets 35.6 37.9 40.5–41.3 45.2 48.9 2021 2022 2023 2024 2025 ~8% 2021–2025 CAGR 2021 GRC Track 1 Track 4 2025 GRC Future Requests |
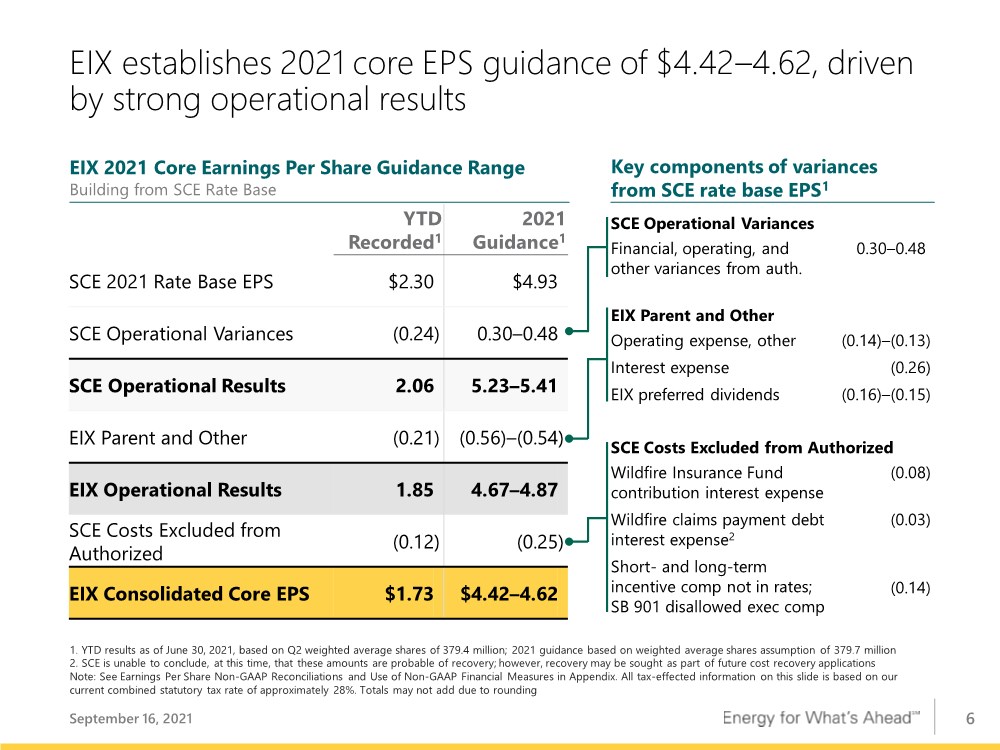
| 6 EIX establishes 2021 core EPS guidance of $4.42–4.62, driven by strong operational results September 16, 2021 YTD Recorded1 2021 Guidance1 SCE 2021 Rate Base EPS $2.30 $4.93 SCE Operational Variances (0.24) 0.30–0.48 SCE Operational Results 2.06 5.23–5.41 EIX Parent and Other (0.21)(0.56)–(0.54) EIX Operational Results 1.85 4.67–4.87 SCE Costs Excluded from Authorized (0.12)(0.25) EIX Consolidated Core EPS $1.73 $4.42–4.62 1. YTD results as of June 30, 2021, based on Q2 weighted average shares of 379.4 million; 2021 guidance based on weighted average shares assumption of 379.7 million 2. SCE is unable to conclude, at this time, that these amounts are probable of recovery; however, recovery may be sought as part of future cost recovery applications Note: See Earnings Per Share Non-GAAP Reconciliations and Use of Non-GAAP Financial Measures in Appendix. All tax-effected information on this slide is based on our current combined statutory tax rate of approximately 28%. Totals may not add due to rounding EIX 2021 Core Earnings Per Share Guidance Range Building from SCE Rate Base Key components of variances from SCE rate base EPS1 SCE Operational Variances Financial, operating, and other variances from auth. 0.30–0.48 EIX Parent and Other Operating expense, other (0.14)–(0.13) Interest expense (0.26) EIX preferred dividends (0.16)–(0.15) SCE Costs Excluded from Authorized Wildfire Insurance Fund contribution interest expense (0.08) Wildfire claims payment debt interest expense2 (0.03) Short- and long-term incentive comp not in rates; SB 901 disallowed exec comp (0.14) |
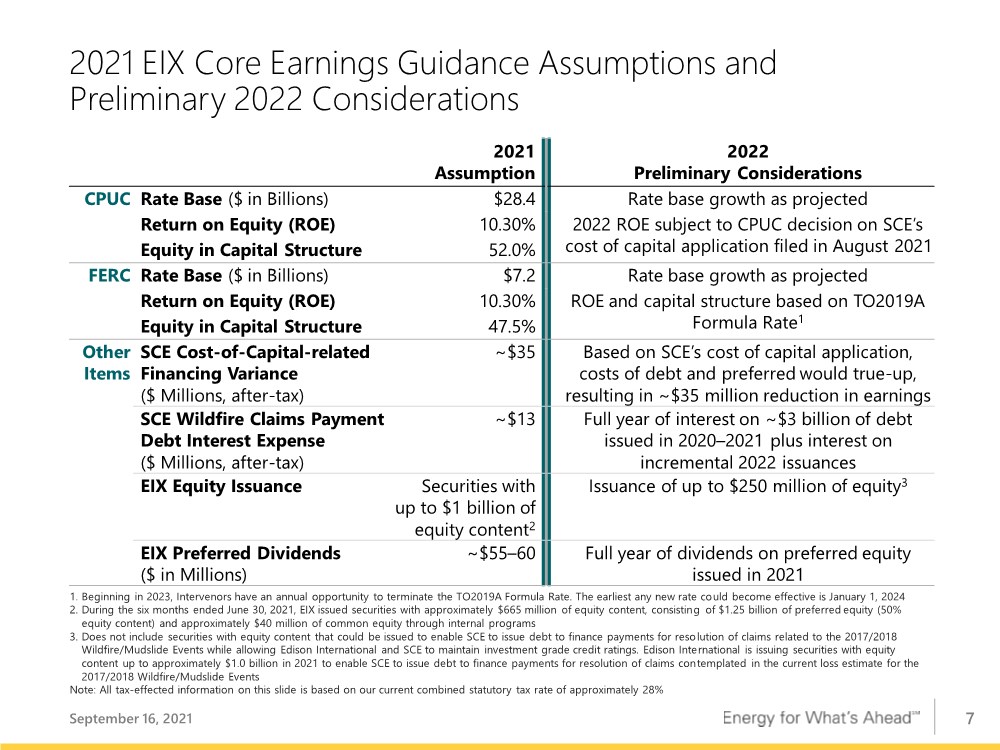
| 7 2021 EIX Core Earnings Guidance Assumptions and Preliminary 2022 Considerations September 16, 2021 1. Beginning in 2023, Intervenors have an annual opportunity to terminate the TO2019A Formula Rate. The earliest any new rate could become effective is January 1, 2024 2. During the six months ended June 30, 2021, EIX issued securities with approximately $665 million of equity content, consisting of $1.25 billion of preferred equity (50% equity content) and approximately $40 million of common equity through internal programs 3. Does not include securities with equity content that could be issued to enable SCE to issue debt to finance payments for resolution of claims related to the 2017/2018 Wildfire/Mudslide Events while allowing Edison International and SCE to maintain investment grade credit ratings. Edison International is issuing securities with equity content up to approximately $1.0 billion in 2021 to enable SCE to issue debt to finance payments for resolution of claims contemplated in the current loss estimate for the 2017/2018 Wildfire/Mudslide Events Note: All tax-effected information on this slide is based on our current combined statutory tax rate of approximately 28% 2021 Assumption 2022 Preliminary Considerations CPUC Rate Base ($ in Billions) $28.4 Rate base growth as projected Return on Equity (ROE) 10.30% 2022 ROE subject to CPUC decision on SCE’s cost of capital application filed in August 2021 Equity in Capital Structure 52.0% FERC Rate Base ($ in Billions) $7.2 Rate base growth as projected Return on Equity (ROE) 10.30% ROE and capital structure based on TO2019A Formula Rate1 Equity in Capital Structure 47.5% Other Items SCE Cost-of-Capital-related Financing Variance ($ Millions, after-tax) ~$35 Based on SCE’s cost of capital application, costs of debt and preferred would true-up, resulting in ~$35 million reduction in earnings SCE Wildfire Claims Payment Debt Interest Expense ($ Millions, after-tax) ~$13 Full year of interest on ~$3 billion of debt issued in 2020–2021 plus interest on incremental 2022 issuances EIX Equity Issuance Securities with up to $1 billion of equity content2 Issuance of up to $250 million of equity3 EIX Preferred Dividends ($ in Millions) ~$55–60 Full year of dividends on preferred equity issued in 2021 |
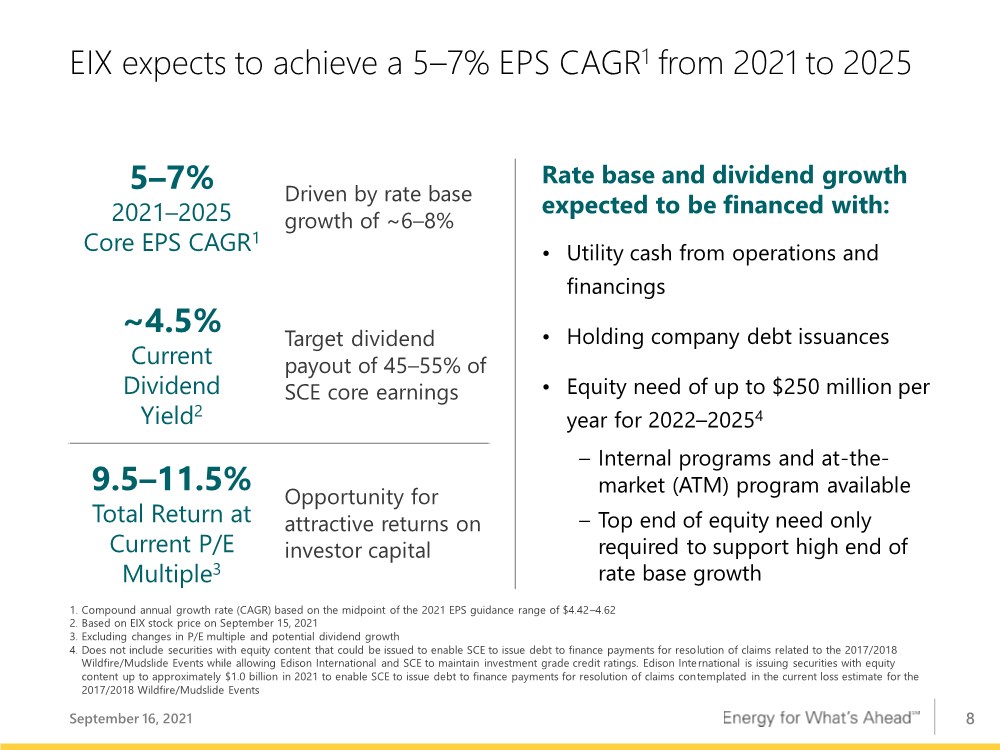
| 8 EIX expects to achieve a 5–7% EPS CAGR1 from 2021 to 2025 September 16, 2021 Rate base and dividend growth expected to be financed with: • Utility cash from operations and financings • Holding company debt issuances • Equity need of up to $250 million per year for 2022–20254 – Internal programs and at-the- market (ATM) program available – Top end of equity need only required to support high end of rate base growth 5–7% 2021–2025 Core EPS CAGR1 Driven by rate base growth of ~6–8% ~4.5% Current Dividend Yield2 Target dividend payout of 45–55% of SCE core earnings 9.5–11.5% Total Return at Current P/E Multiple3 Opportunity for attractive returns on investor capital 1. Compound annual growth rate (CAGR) based on the midpoint of the 2021 EPS guidance range of $4.42–4.62 2. Based on EIX stock price on September 15, 2021 3. Excluding changes in P/E multiple and potential dividend growth 4. Does not include securities with equity content that could be issued to enable SCE to issue debt to finance payments for resolution of claims related to the 2017/2018 Wildfire/Mudslide Events while allowing Edison International and SCE to maintain investment grade credit ratings. Edison International is issuing securities with equity content up to approximately $1.0 billion in 2021 to enable SCE to issue debt to finance payments for resolution of claims contemplated in the current loss estimate for the 2017/2018 Wildfire/Mudslide Events |
| Appendix |

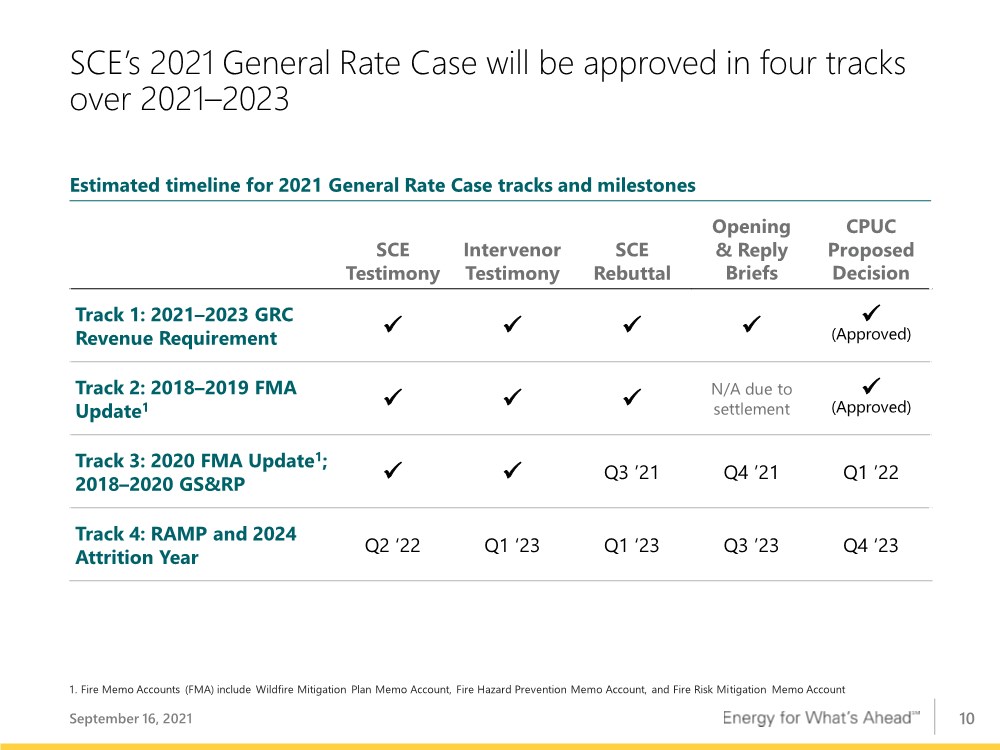
| 10 SCE’s 2021 General Rate Case will be approved in four tracks over 2021–2023 SCE Testimony Intervenor Testimony SCE Rebuttal Opening & Reply Briefs CPUC Proposed Decision Track 1: 2021–2023 GRC Revenue Requirement ✓ ✓ ✓ ✓ ✓ (Approved) Track 2: 2018–2019 FMA Update1 ✓ ✓ ✓ N/A due to settlement ✓ (Approved) Track 3: 2020 FMA Update1; 2018–2020 GS&RP ✓ ✓ Q3 ’21 Q4 ’21 Q1 ’22 Track 4: RAMP and 2024 Attrition Year Q2 ‘22 Q1 ‘23 Q1 ‘23 Q3 ’23 Q4 ‘23 1. Fire Memo Accounts (FMA) include Wildfire Mitigation Plan Memo Account, Fire Hazard Prevention Memo Account, and Fire Risk Mitigation Memo Account September 16, 2021 Estimated timeline for 2021 General Rate Case tracks and milestones |
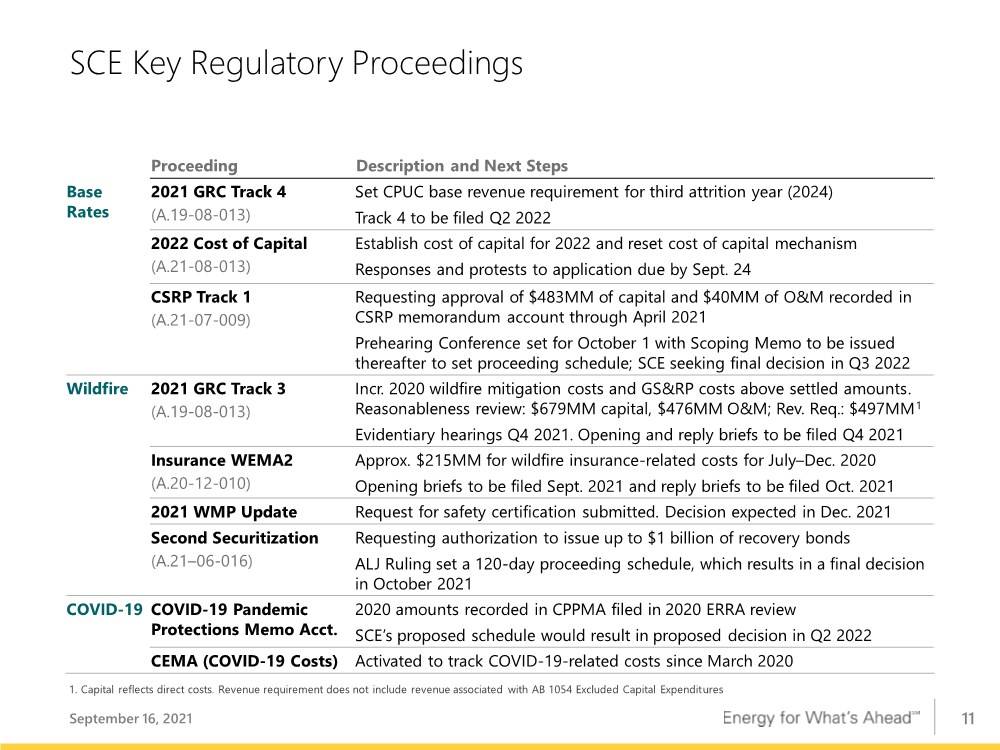
| 11 SCE Key Regulatory Proceedings Proceeding Description and Next Steps Base Rates 2021 GRC Track 4 (A.19-08-013) Set CPUC base revenue requirement for third attrition year (2024) Track 4 to be filed Q2 2022 2022 Cost of Capital (A.21-08-013) Establish cost of capital for 2022 and reset cost of capital mechanism Responses and protests to application due by Sept. 24 CSRP Track 1 (A.21-07-009) Requesting approval of $483MM of capital and $40MM of O&M recorded in CSRP memorandum account through April 2021 Prehearing Conference set for October 1 with Scoping Memo to be issued thereafter to set proceeding schedule; SCE seeking final decision in Q3 2022 Wildfire 2021 GRC Track 3 (A.19-08-013) Incr. 2020 wildfire mitigation costs and GS&RP costs above settled amounts. Reasonableness review: $679MM capital, $476MM O&M; Rev. Req.: $497MM1 Evidentiary hearings Q4 2021. Opening and reply briefs to be filed Q4 2021 Insurance WEMA2 (A.20-12-010) Approx. $215MM for wildfire insurance-related costs for July–Dec. 2020 Opening briefs to be filed Sept. 2021 and reply briefs to be filed Oct. 2021 2021 WMP Update Request for safety certification submitted. Decision expected in Dec. 2021 Second Securitization (A.21–06-016) Requesting authorization to issue up to $1 billion of recovery bonds ALJ Ruling set a 120-day proceeding schedule, which results in a final decision in October 2021 COVID-19 COVID-19 Pandemic Protections Memo Acct. 2020 amounts recorded in CPPMA filed in 2020 ERRA review SCE’s proposed schedule would result in proposed decision in Q2 2022 CEMA (COVID-19 Costs) Activated to track COVID-19-related costs since March 2020 September 16, 2021 1. Capital reflects direct costs. Revenue requirement does not include revenue associated with AB 1054 Excluded Capital Expenditures |
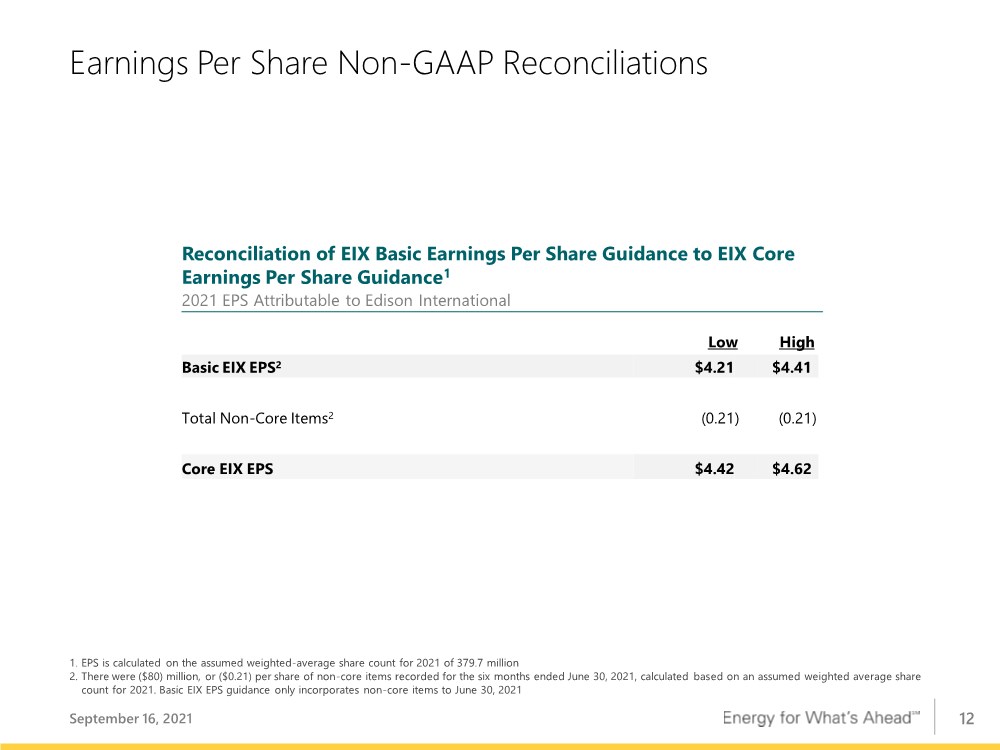
| 12 Low High Basic EIX EPS2 $4.21 $4.41 Total Non-Core Items2 (0.21)(0.21) Core EIX EPS $4.42 $4.62 1. EPS is calculated on the assumed weighted-average share count for 2021 of 379.7 million 2. There were ($80) million, or ($0.21) per share of non-core items recorded for the six months ended June 30, 2021, calculated based on an assumed weighted average share count for 2021. Basic EIX EPS guidance only incorporates non-core items to June 30, 2021 Earnings Per Share Non-GAAP Reconciliations September 16, 2021 Reconciliation of EIX Basic Earnings Per Share Guidance to EIX Core Earnings Per Share Guidance1 2021 EPS Attributable to Edison International |
| 13 Edison International's earnings are prepared in accordance with generally accepted accounting principles used in the United States. Management uses core earnings (losses) internally for financial planning and for analysis of performance. Core earnings (losses) are also used when communicating with investors and analysts regarding Edison International's earnings results to facilitate comparisons of the company's performance from period to period. Core earnings (losses) are a non-GAAP financial measure and may not be comparable to those of other companies. Core earnings (losses) are defined as earnings attributable to Edison International shareholders less non-core items. Non- core items include income or loss from discontinued operations and income or loss from significant discrete items that management does not consider representative of ongoing earnings, such as write downs, asset impairments and other income and expense related to changes in law, outcomes in tax, regulatory or legal proceedings, and exit activities, including sale of certain assets and other activities that are no longer continuing. A reconciliation of Non-GAAP information to GAAP information is included either on the slide where the information appears or on another slide referenced in this presentation. EIX Investor Relations Contact Sam Ramraj, Vice President (626) 302-2540 sam.ramraj@edisonintl.com Use of Non-GAAP Financial Measures September 16, 2021 |