Attached files
| file | filename |
|---|---|
| 8-K - 8-K - EAGLE BANCORP INC | gnw-20210913.htm |

Investor Presentation Ticker: EGBN EagleBankCorp.com September 2021
Forward Looking Statements 2 This presentation contains forward looking statements within the meaning of the Securities and Exchange Act of 1934, as amended, including statements of goals, intentions, and expectations as to future trends, plans, events or results of Company operations and policies and regarding general economic conditions. In some cases, forward-looking statements can be identified by use of words such as “may,” “will,” “anticipates,” “believes,” “expects,” “plans,” “estimates,” “potential,” “continue,” “should,” and similar words or phrases. These statements are based upon current and anticipated economic conditions, nationally and in the Company’s market, interest rates and interest rate policy, competitive factors and other conditions which by their nature, are not susceptible to accurate forecast and are subject to significant uncertainty. For details on factors that could affect these expectations, see the risk factors and other cautionary language included in the Company’s Quarterly Report on Form 10-Q for the quarter ended June 30, 2021, Annual Report on Form 10-K and other periodic and current reports filed with the SEC. Because of these uncertainties and the assumptions on which this discussion and the forward-looking statements are based, actual future operations and results in the future may differ materially from those indicated herein. Readers are cautioned against placing undue reliance on any such forward-looking statements. The Company’s past results are not necessarily indicative of future performance. The Company does not undertake to publicly revise or update forward-looking statements in this presentation to reflect events or circumstances that arise after the date of this presentation, except as may be required under applicable law. This presentation was delivered digitally. The Company makes no representation that subsequent to delivery of the presentation it was not altered. For the most current, accurate information, please refer to www.eaglebankcorp.com and go to the Investor Relations tab. For further information on the Company please contact: David G. Danielson P 240-552-9534 E ddanielson@eaglebankcorp.com

Experienced Senior Management Team 3 Susan Riel CEO & President, Eagle Bancorp & EagleBank 45 years in banking 24 years with EGBN Charles Levingston EVP & Chief Financial Officer, Eagle Bancorp & EagleBank 21 years in banking 9 years with EGBN Executive Vice President and Chief Financial Officer of the Bank and Company as of April 2017, most recently served as Executive Vice President of Finance at the Bank. Mr. Levingston, a CPA, served in various financial and senior management roles at the bank prior to his current role. Mr. Levingston joined the bank in January 2012, and previously worked at the Federal Reserve Banks of Atlanta and Philadelphia as a commissioned Bank Examiner, and at PriceWaterhouseCoopers as a Manager in the Advisory practice. Chief Executive Officer of the Bank and Company, and formerly Chief Operating Officer. She previously served as Executive Vice President - Chief Operating Officer of Columbia First Bank, FSB from 1989 until that institution’s acquisition by First Union Bancorp in 1995. She is one of the founding officers of EagleBank. Ms. Riel was recently included in the Bisnow 2017 Power Series: Women of Influence in Commercial Real Estate. Janice Williams EVP, Eagle Bancorp; Senior EVP & Chief Credit Officer, EagleBank 27 years in banking 18 years with EGBN Executive Vice President and Chief Credit Officer of the Bank, has served the Bank as Credit Officer, Senior Credit Officer and Chief Credit Officer. Prior to employment with the Bank, Ms. Williams was with Capital Bank, Sequoia Bank, and American Security Bank. Additionally, Ms. Williams, a graduate of Georgetown University Law Center and a Member of the Maryland Bar, was previously employed in the private practice of law in Maryland.

Experienced Senior Management Team 4 Joined EagleBank in June 2020 as the Chief Risk Officer. Prior to this, he was Managing Director for the Risk and Finance Advisory Practice in Deloitte’s Banking and Capital Markets Group, where he focused on the development of ERM and risk-category-specific governance structures and management frameworks. He also served as Managing Director at FTI Consulting. He holds a B.S. in Finance and Accounting and an M.S. in Finance-Investments and Capital Markets from the University of Wisconsin, Madison. Joined EagleBank in January 2020 as the Chief Legal Officer. He is responsible for all legal and compliance oversight at the bank. Mr. Saltzman was recently a Partner in the Banking and Financial Institutions Advisory Practice at White & Case and Vice Chairman at Deutsche Bank, where he helped lead capital stress testing, regulatory remediation and transaction banking in the Americas region. He holds a B.A. from Clark University and a J.D. from Boston University School of Law. Jeff Curry EVP & Chief Risk Officer, Eagle Bancorp & EagleBank 43 years in financial services 1 year with EGBN Paul Saltzman EVP & Chief Legal Officer, Eagle Bancorp & EagleBank 36 years in financial services 1 year with EGBN Lindsey Rheaume EVP, Eagle Bancorp; EVP & Chief Commercial & Industrial Lending Officer, EagleBank 36 years in banking 6 years with EGBN Antonio Marquez EVP, Eagle Bancorp; Senior EVP & President of Commercial Banking, EagleBank 36 years in banking 10 years with EGBN Joined EagleBank in 2011 as the Chief Real Estate Lender. Prior to joining EagleBank, he established the real estate lending franchise for HSBC for the Washington, DC market Earlier he was the head of Commercial Real Estate lending at Chevy Chase Bank from 1999 to 2005 and prior to that held various lending positions at Chase Manhattan Bank in New York and The Riggs National Bank in Washington, D.C. Joined EagleBank as Chief C&I Lending Officer in December 2014. Prior to this, he served as relationship executive for JP Morgan Chase, responsible for business development in the DC, suburban Maryland and Northern Virginia market. Previously, he served as executive vice president and commercial lending manager at Virginia Commerce Bank where he managed the bank’s entire commercial and industrial lending activities. Earlier in his career, he held senior commercial lending and credit positions with SunTrust Bank, GE Capital and Bank of America. Joe Clarke EVP & Chief Operating Officer, EagleBank 28 years in financial services 13 years with EGBN Joined EagleBank in 2008. Previously, he held various operational and sales roles at EagleBank including Chief Deposit Sales Officer, Chief Deposit & Treasury Services Officer, Strategic Initiatives Officer, Assistant to the Chief Operating Officer and Retail Banking Manager. In addition to representing the Bank as a Board Member of the Maryland Bankers Association, he is a member of EagleBank's Diversity, Equity & Inclusion Council. He is very active in the local Washington, DC community and serves as Board Chair for Hope Connections for Cancer Support.

Board Focused on Vision and Oversight 5 Norman Pozez Executive Chair - Board of Directors 13 years with EGBN Kathy Raffa Director, Chair - Audit Committee 6 years with EGBN Leslie Ludwig Director, Chair - Compensation Committee 4 years with EGBN Theresa LaPlaca Director, Chair - Risk Committee 2 years with EGBN Susan Riel Director, President & CEO 24 years with EGBN Matthew Brockwell Director, Chair – Governance & Nominating Committee 1 year with EGBN Former Audit Partner at PricewaterhouseCoopers LLP (PwC). His practice included both SEC registered and privately held companies, Chairman & CEO of the Uniwest Companies which is comprised of four operating companies related to the real estate and construction industry. Former EVP and Head of the Conduct Risk Management Group and a member of the Management Committee at Wells Fargo & Co. Prior to that she was the CFO of Wells Fargo’s Wealth and Investment Management businesses. President of Raffa, PC, a top 100 accounting firm based in Washington, D.C., until its 2018 merger with Marcum, LLP. She currently serves as the Office Managing Partner for Marcum’s Washington, D.C. region offices. Prior to becoming CEO in 2019, was a Sr. EVP/COO of the Bank, and EVP of the Company. Joined the Company in 1998, and has been a member of the Company Board of Directors since 2017. Co-founder of L&L Advisors, a commercial real estate consulting firm, and retired Partner and Chair of the Management Committee at JBG Smith (formerly JBG Companies) Steve Freidkin Director <1 years with EGBN Ernie Jarvis Director <1 years with EGBN Managing Principal of Jarvis Commercial Real Estate, Previously, Jarvis was with First Potomac Realty Trust and CBRE. CEO/founder of Ntiva, Inc., a technology firm that provides businesses with advanced technology expertise and support. James Soltesz Director 14 years with EGBN Chief Executive Officer of Soltesz, Inc., an engineering and consulting firm, since 2006. Benjamin Soto Director 14 years with EGBN Principal of Premium Title and Escrow, LLC, a Washington, D.C.-based full service title company and is a real estate transactions attorney.
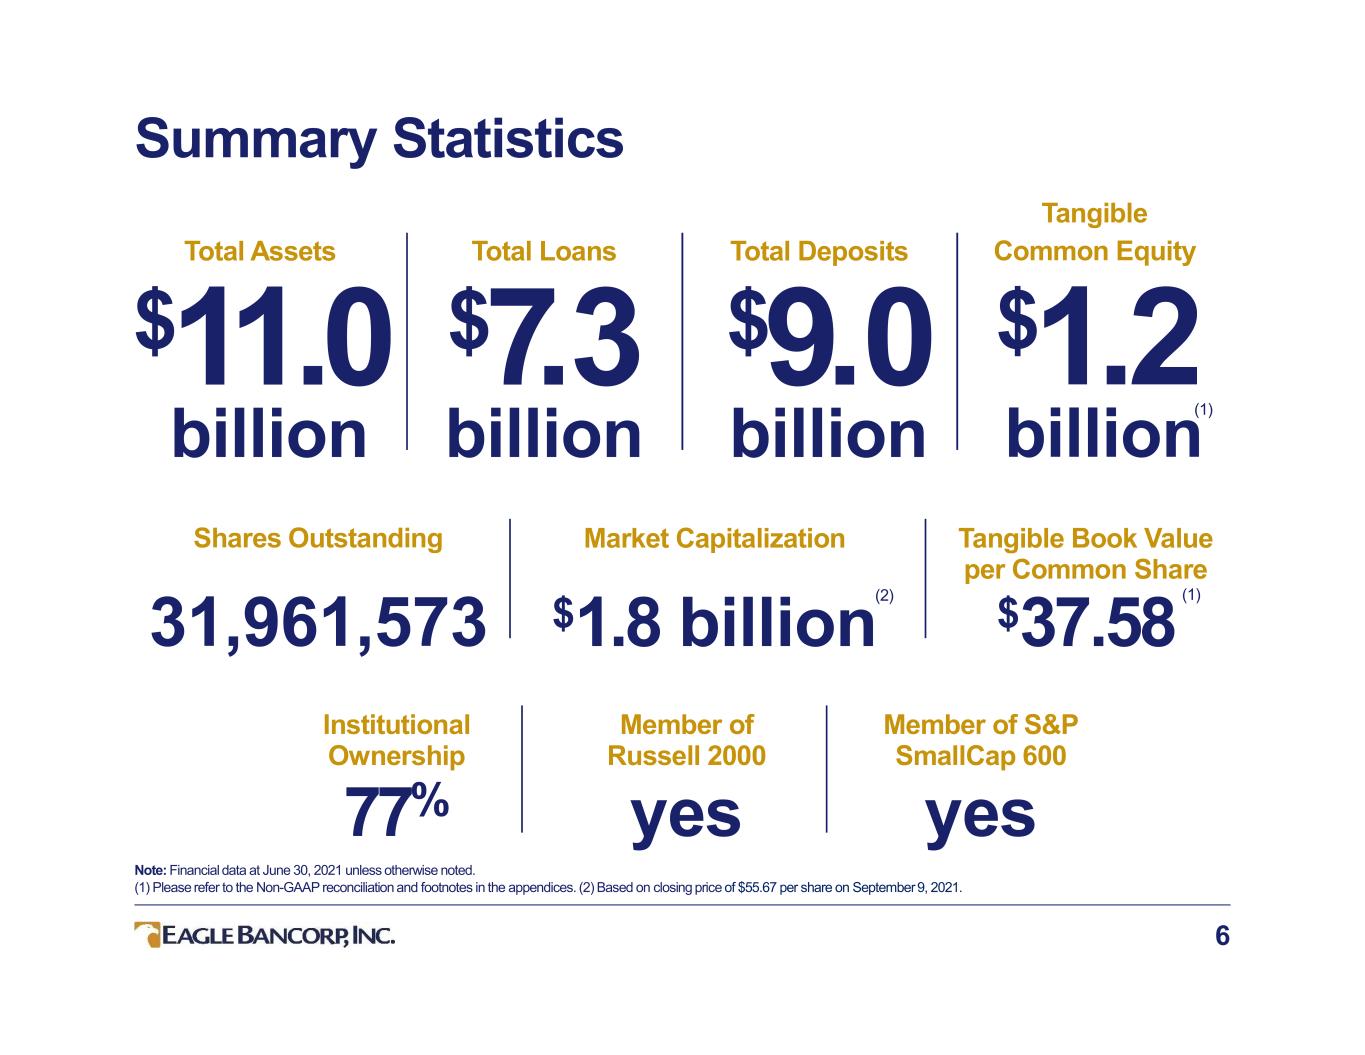
Summary Statistics 6 Total Assets $ billion Total Loans $ billion Total Deposits $ billion Tangible Common Equity $ billion Shares Outstanding 31,961,573 Market Capitalization $1.8 billion Tangible Book Value per Common Share $37.58 Institutional Ownership 77% Member of Russell 2000 yes Member of S&P SmallCap 600 yes Note: Financial data at June 30, 2021 unless otherwise noted. (1) Please refer to the Non-GAAP reconciliation and footnotes in the appendices. (2) Based on closing price of $55.67 per share on September 9, 2021. (1) (1) (2)
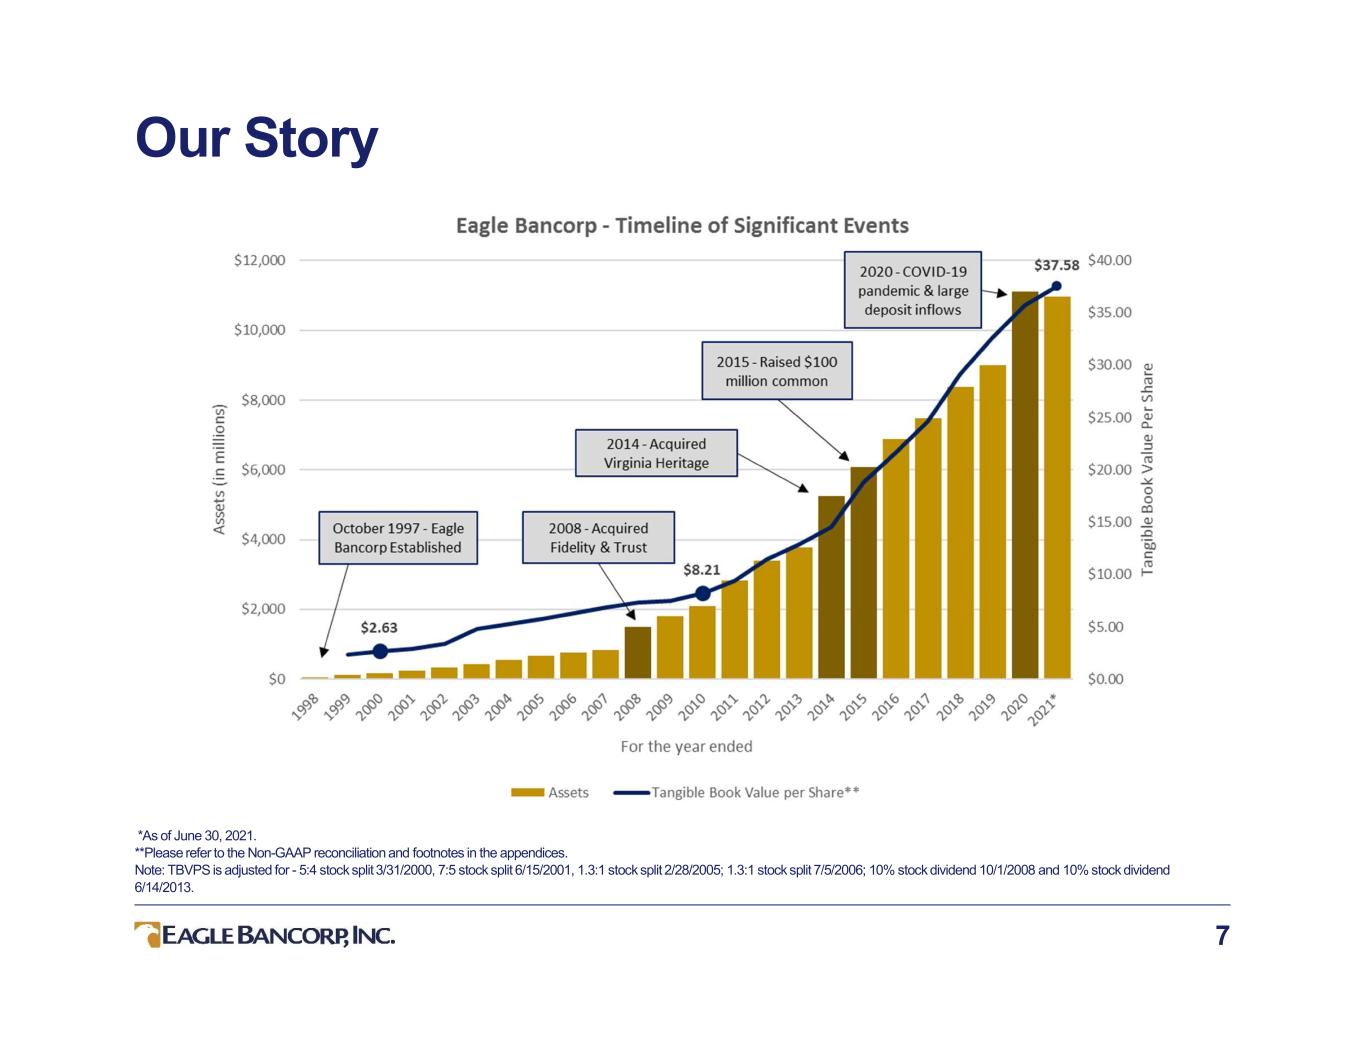
Our Story 7 *As of June 30, 2021. **Please refer to the Non-GAAP reconciliation and footnotes in the appendices. Note: TBVPS is adjusted for - 5:4 stock split 3/31/2000, 7:5 stock split 6/15/2001, 1.3:1 stock split 2/28/2005; 1.3:1 stock split 7/5/2006; 10% stock dividend 10/1/2008 and 10% stock dividend 6/14/2013.
Investment Rationale 8 Solid capitalization and conservative capital management Well-managed asset quality Above average peer returns (ROAA) Superior efficiency with limited branch network Recognized expertise in CRE, C&I and residential mortgage lending Strategically positioned in one of the most attractive markets in the U.S. Dedicated, diverse and experienced Board focused on vision and governance
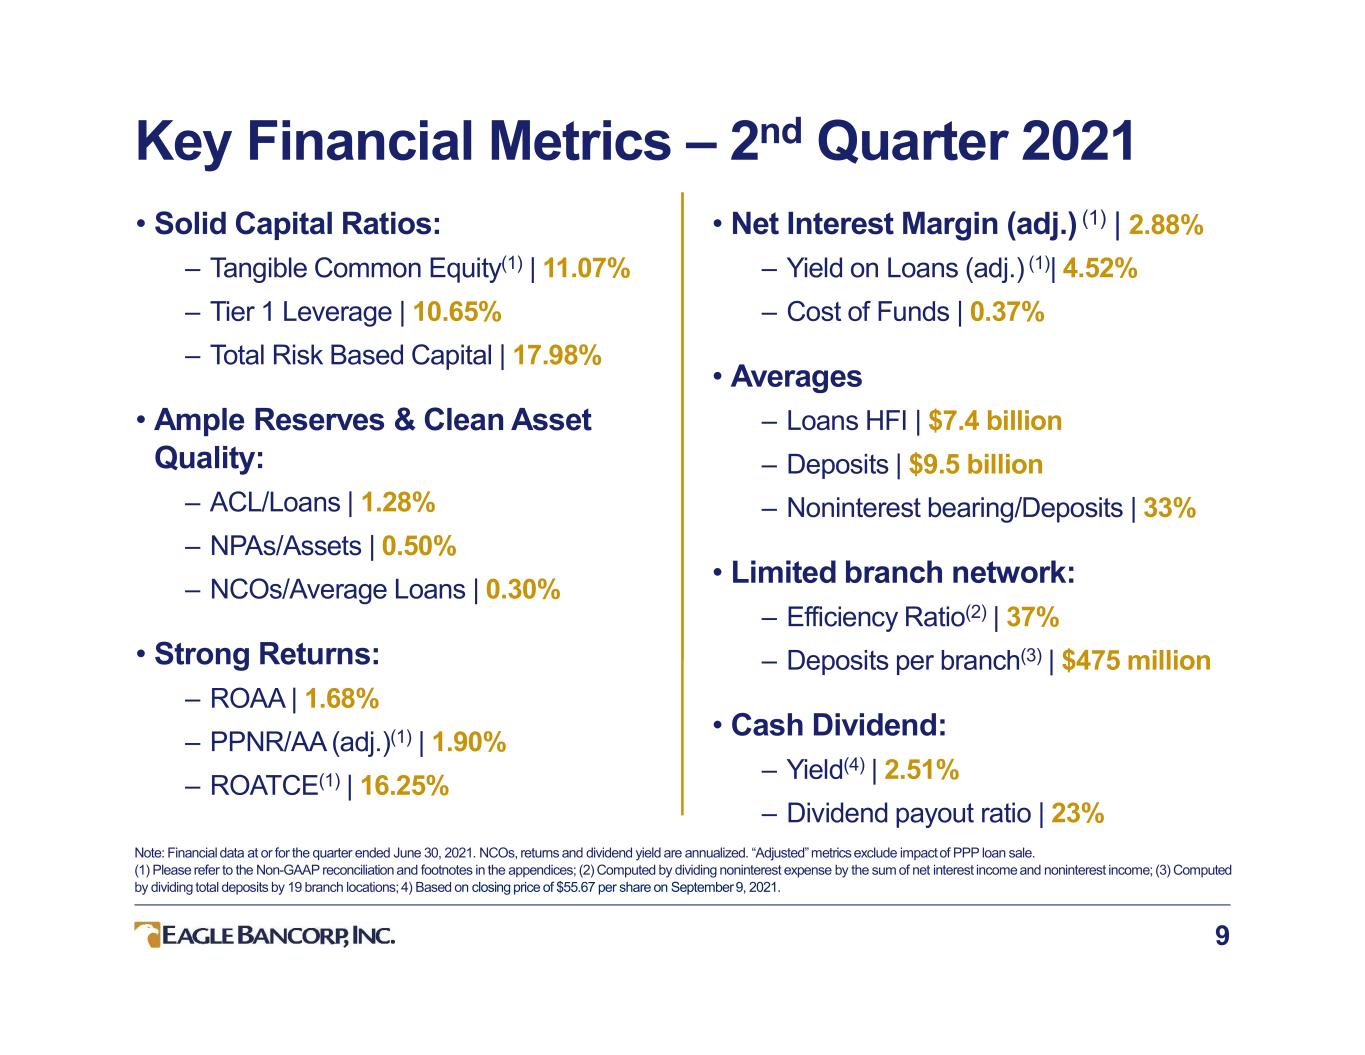
Key Financial Metrics – 2nd Quarter 2021 9 • Solid Capital Ratios: – Tangible Common Equity(1) | 11.07% – Tier 1 Leverage | 10.65% – Total Risk Based Capital | 17.98% • Ample Reserves & Clean Asset Quality: – ACL/Loans | 1.28% – NPAs/Assets | 0.50% – NCOs/Average Loans | 0.30% • Strong Returns: – ROAA | 1.68% – PPNR/AA (adj.)(1) | 1.90% – ROATCE(1) | 16.25% Note: Financial data at or for the quarter ended June 30, 2021. NCOs, returns and dividend yield are annualized. “Adjusted” metrics exclude impact of PPP loan sale. (1) Please refer to the Non-GAAP reconciliation and footnotes in the appendices; (2) Computed by dividing noninterest expense by the sum of net interest income and noninterest income; (3) Computed by dividing total deposits by 19 branch locations; 4) Based on closing price of $55.67 per share on September 9, 2021. • Net Interest Margin (adj.) (1) | 2.88% – Yield on Loans (adj.) (1)| 4.52% – Cost of Funds | 0.37% • Averages – Loans HFI | $7.4 billion – Deposits | $9.5 billion – Noninterest bearing/Deposits | 33% • Limited branch network: – Efficiency Ratio(2) | 37% – Deposits per branch(3) | $475 million • Cash Dividend: – Yield(4) | 2.51% – Dividend payout ratio | 23%

Attractive & Resilient Market 10 • Washington DC MSA – Market is the 6th largest in the U.S. – Population of 6.3 million with a projected annual growth rate of 0.8% through 2026 – Workforce of 3.4 million – 2021 median household income of $109,000 vs. $68,000 U.S. – Unemployment of 5.4% in June 2021, down from 5.6% in March 2021; and lower than nationwide 5.9% in June 2021 • Business strength of market – Two largest industries less impacted by COVID ▪ Federal government & government contracting ▪ Professional services – Major presence by technology, medical and educational institutions – Home to 17 Fortune 500 companies – Ongoing large construction projects – Top 25 projects total estimated cost of $14.5 billion (up from $12.6 billion prior year)* – #1 location for data centers (Dulles corridor) *Washington Business Journal 8/6/2021 and 8/7/2020. Sources: US Bureau of Labor Statistics, S&P Global Market Intelligence, Washington Business Journal Book of Lists, Washington Post, Fortune .

295 495 95 495 495 270 395 66 66 Bethesda Lanham Chevy Chase Twinbrook Rockville Shady Grove Rosslyn Ballston Silver Spring Park Potomac Merrifield Alexandria Fairfax Tysons Corner Reston Dulles Town Center Chantilly HQ RHQ RHQ MONTGOMERY COUNTY PRINCE GEORGE’S COUNTY FAIRFAX COUNTY ARLINGTON COUNTY LOUDOUN COUNTY DC MD MDVA Corporate Headquarters Regional Headquarters Loan Office Branch Branch System Lending Office Virginia 9 Maryland 6 2 Washington, DC 5 Total 20 2 Limited Network of Offices 11 Lending Offices include the Corporate Headquarters and two Regional headquarters. Branch Lendi Offices Offices Virginia 8 1 Maryland 6 3 Washington, DC 5 1 tal 19 5
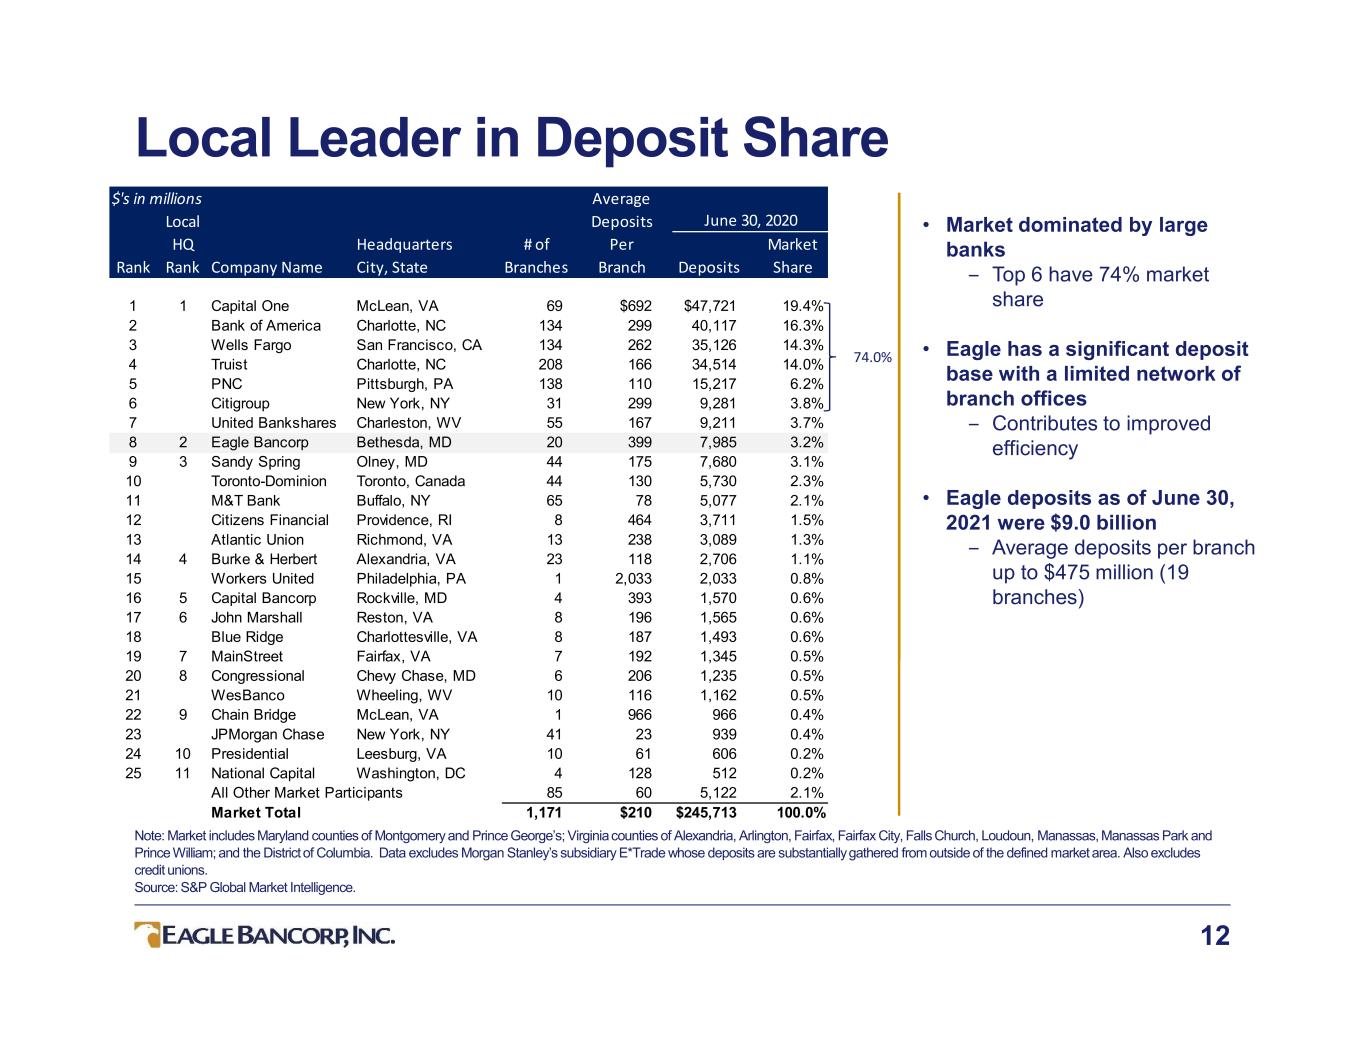
Local Leader in Deposit Share 12 Note: Market includes Maryland counties of Montgomery and Prince George’s; Virginia counties of Alexandria, Arlington, Fairfax, Fairfax City, Falls Church, Loudoun, Manassas, Manassas Park and Prince William; and the District of Columbia. Data excludes Morgan Stanley’s subsidiary E*Trade whose deposits are substantially gathered from outside of the defined market area. Also excludes credit unions. Source: S&P Global Market Intelligence. • Market dominated by large banks ‒ Top 6 have 74% market share • Eagle has a significant deposit base with a limited network of branch offices ‒ Contributes to improved efficiency • Eagle deposits as of June 30, 2021 were $9.0 billion ‒ Average deposits per branch up to $475 million (19 branches) 74.0% $'s in millions Average Local Deposits HQ Headquarters # of Per Market Rank Rank Company Name City, State Branches Branch Deposits Share 1 1 Capital One McLean, VA 69 $692 $47,721 19.4% 2 Bank of America Charlotte, NC 134 299 40,117 16.3% 3 Wells Fargo San Francisco, CA 134 262 35,126 14.3% 4 Truist Charlotte, NC 208 166 34,514 14.0% 5 PNC Pittsburgh, PA 138 110 15,217 6.2% 6 Citigroup New York, NY 31 299 9,281 3.8% 7 United Bankshares Charleston, WV 55 167 9,211 3.7% 8 2 Eagle Bancorp Bethesda, MD 20 399 7,985 3.2% 9 3 Sandy Spring Olney, MD 44 175 7,680 3.1% 10 Toronto-Dominion Toronto, Canada 44 130 5,730 2.3% 11 M&T Bank Buffalo, NY 65 78 5,077 2.1% 12 Citizens Financial Providence, RI 8 464 3,711 1.5% 13 Atlantic Union Richmond, VA 13 238 3,089 1.3% 14 4 Burke & Herbert Alexandria, VA 23 118 2,706 1.1% 15 Workers United Philadelphia, PA 1 2,033 2,033 0.8% 16 5 Capital Bancorp Rockville, MD 4 393 1,570 0.6% 17 6 John Marshall Reston, VA 8 196 1,565 0.6% 18 Blue Ridge Charlottesville, VA 8 187 1,493 0.6% 19 7 MainStreet Fairfax, VA 7 192 1,345 0.5% 20 8 Congressional Chevy Chase, MD 6 206 1,235 0.5% 21 WesBanco Wheeling, WV 10 116 1,162 0.5% 22 9 Chain Bridge McLean, VA 1 966 966 0.4% 23 JPMorgan Chase New York, NY 41 23 939 0.4% 24 10 Presidential Leesburg, VA 10 61 606 0.2% 25 11 National Capital Washington, DC 4 128 512 0.2% All Other Market Participants 85 60 5,122 2.1% Market Total 1,171 $210 $245,713 100.0% June 30, 2020

ESG - Social 13 Diversity of Board & Senior Management • Board of 10 includes 4 women (including the CEO) and 2 men who identify as minorities • Senior Management of 8 includes 2 women and 1 man who identifies as a minority Diversity, Equity & Inclusion Council established in 2020 • 16 diverse employees from across the company • Council head is a man who identifies as minority • Executive sponsor is the CEO • Two board members, a woman and a man who identifies as a minority, act as liaison to the Council Example of affordable housing loan • 2nd quarter 2021, Eagle announced $81.2 million in fixed rate acquisition financing to support a key affordable housing project. Bradley Crossing LLC, controlled by the Housing Opportunities Commission of Montgomery County (HOC)
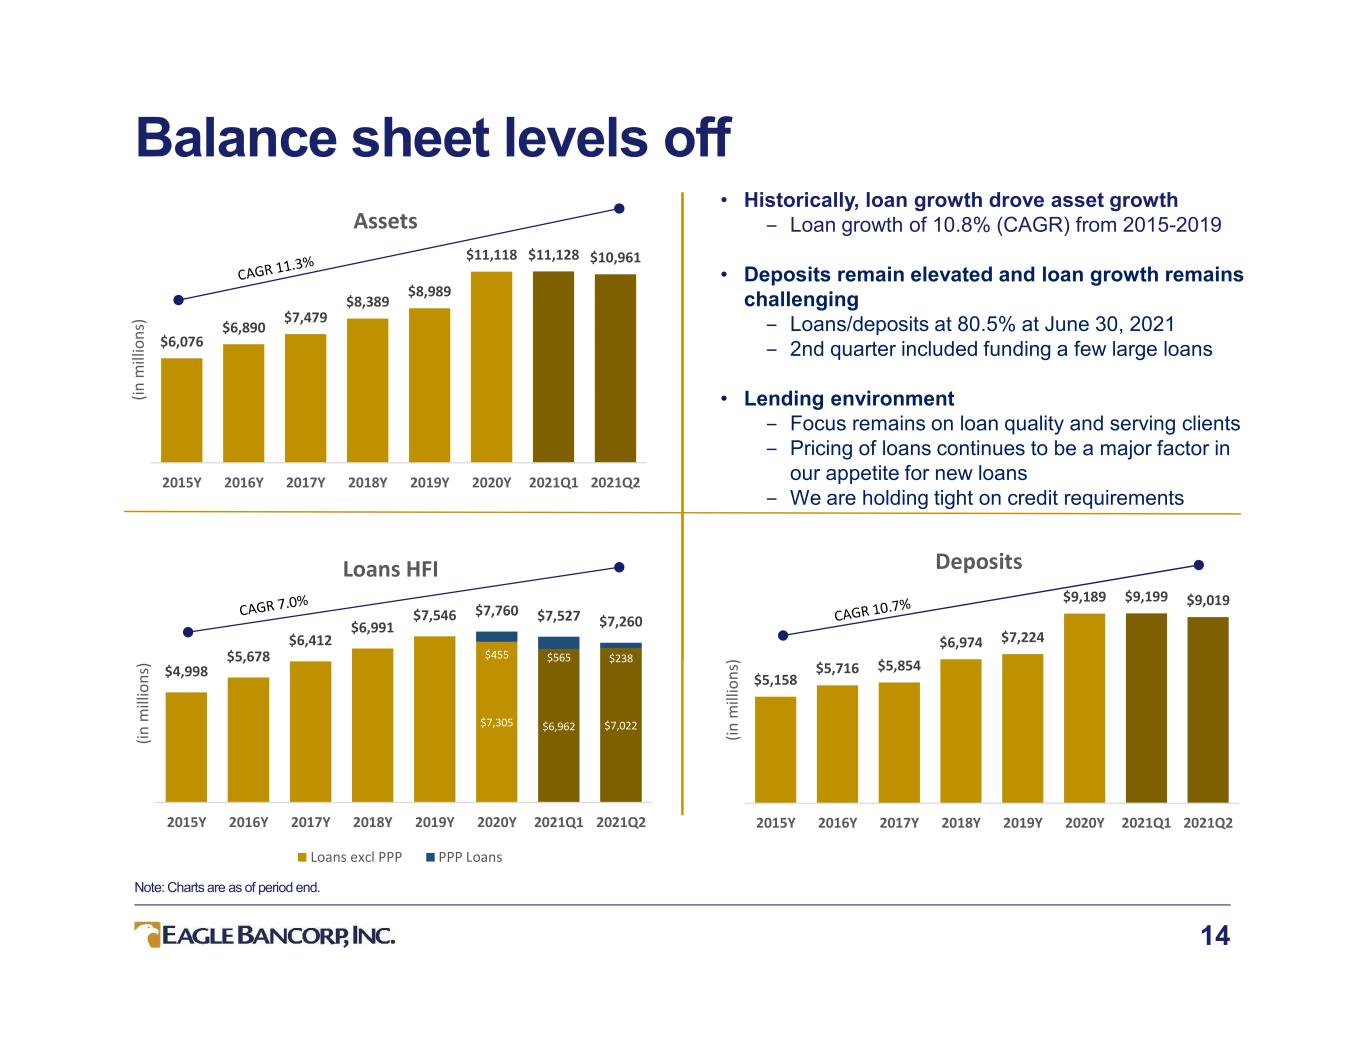
$7,305 $6,962 $7,022 $455 $565 $238 $4,998 $5,678 $6,412 $6,991 $7,546 $7,760 $7,527 $7,260 2015Y 2016Y 2017Y 2018Y 2019Y 2020Y 2021Q1 2021Q2 (in m ill io ns ) Loans HFI Loans excl PPP PPP Loans $5,158 $5,716 $5,854 $6,974 $7,224 $9,189 $9,199 $9,019 2015Y 2016Y 2017Y 2018Y 2019Y 2020Y 2021Q1 2021Q2 (in m ill io ns ) Deposits $6,076 $6,890 $7,479 $8,389 $8,989 $11,118 $11,128 $10,961 2015Y 2016Y 2017Y 2018Y 2019Y 2020Y 2021Q1 2021Q2 (in m ill io ns ) Assets Balance sheet levels off 14 • Historically, loan growth drove asset growth ‒ Loan growth of 10.8% (CAGR) from 2015-2019 • Deposits remain elevated and loan growth remains challenging ‒ Loans/deposits at 80.5% at June 30, 2021 ‒ 2nd quarter included funding a few large loans • Lending environment ‒ Focus remains on loan quality and serving clients ‒ Pricing of loans continues to be a major factor in our appetite for new loans ‒ We are holding tight on credit requirements Note: Charts are as of period end.
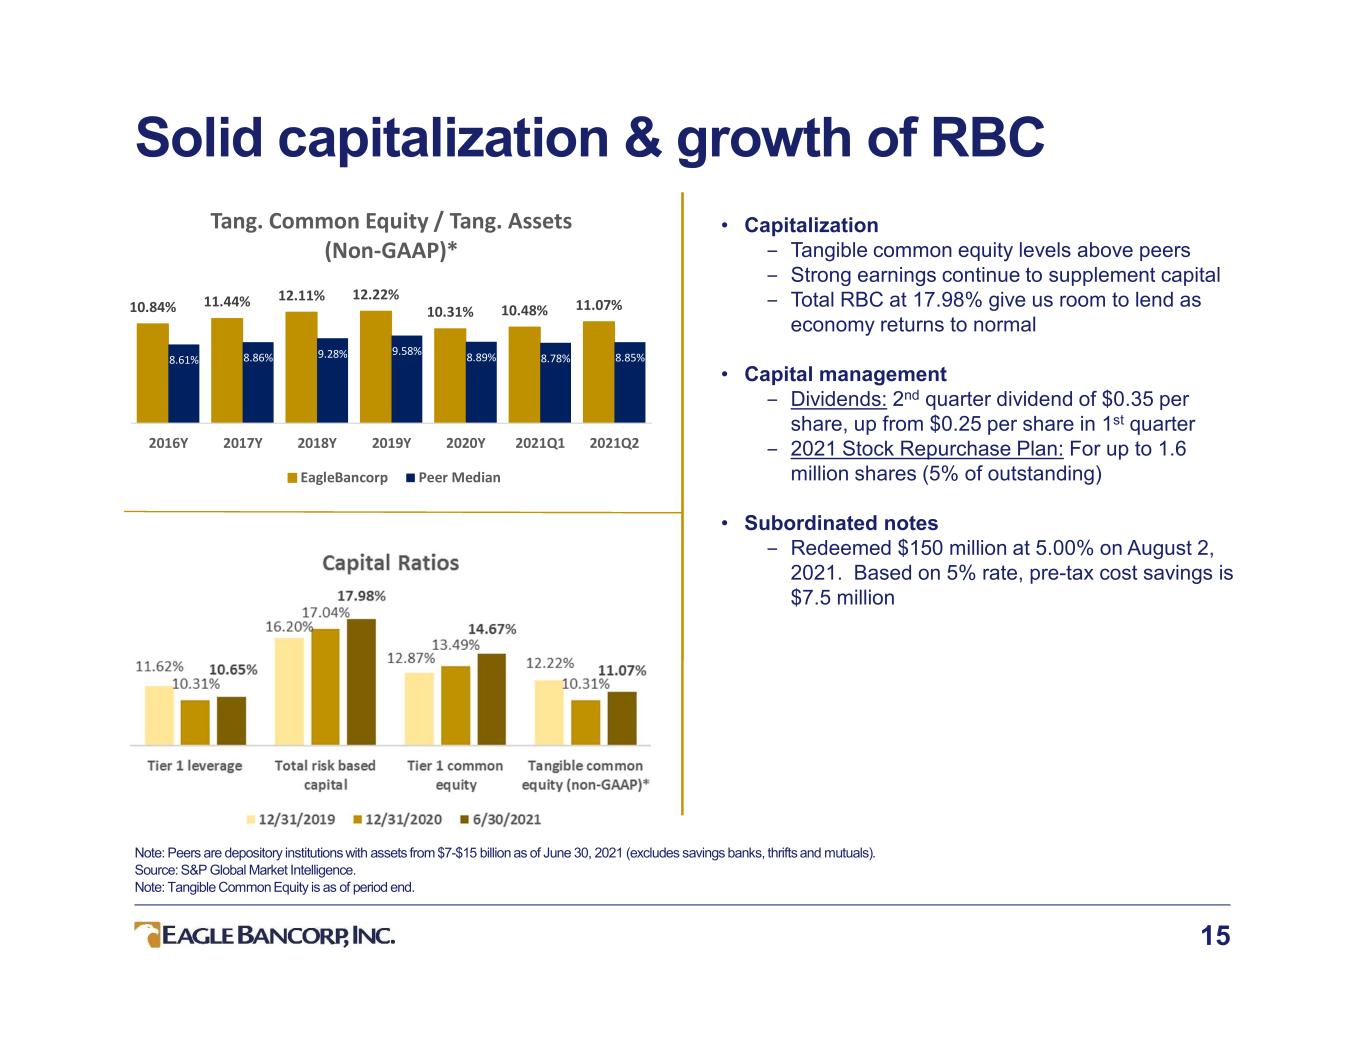
Solid capitalization & growth of RBC 15 Note: Peers are depository institutions with assets from $7-$15 billion as of June 30, 2021 (excludes savings banks, thrifts and mutuals). Source: S&P Global Market Intelligence. Note: Tangible Common Equity is as of period end. • Capitalization ‒ Tangible common equity levels above peers ‒ Strong earnings continue to supplement capital ‒ Total RBC at 17.98% give us room to lend as economy returns to normal • Capital management ‒ Dividends: 2nd quarter dividend of $0.35 per share, up from $0.25 per share in 1st quarter ‒ 2021 Stock Repurchase Plan: For up to 1.6 million shares (5% of outstanding) • Subordinated notes ‒ Redeemed $150 million at 5.00% on August 2, 2021. Based on 5% rate, pre-tax cost savings is $7.5 million 10.84% 11.44% 12.11% 12.22% 10.31% 10.48% 11.07% 8.61% 8.86% 9.28% 9.58% 8.89% 8.78% 8.85% 2016Y 2017Y 2018Y 2019Y 2020Y 2021Q1 2021Q2 Tang. Common Equity / Tang. Assets (Non-GAAP)* EagleBancorp Peer Median

Efficiency continues to be a strength 16 • Efficiency much better than peers ‒ Focus on higher value business relationships ‒ Branches focused on commercial sub-markets ‒ Average deposits per branch of $475 million • Efficiency components ‒ Net interest income benefitted from large increase in assets in 2020 ‒ Non interest income continues to be driven by mortgage division ‒ Non interest expense relatively flat Note: Peers are depository institutions with assets from $7-$15 billion as of June 30, 2021 (excludes savings banks, thrifts and mutuals). Source: S&P Global Market Intelligence. *Computed by dividing non interest expense by the sum of net interest income and noninterest income; 2020Y components are rounded and may not add to yearly total. 40.3% 37.8% 37.3% 40.0% 39.3% 40.7% 37.1% 60.5% 58.7% 56.9% 57.7% 57.1% 54.0% 54.9% 2016Y 2017Y 2018Y 2019Y 2020Y 2021Q1 2021Q2 Efficiency Ratio* EagleBancorp Peer Median $83 $85 $258 $284 $317 $324 $322 $167 2016Y 2017Y 2018Y 2019Y 2020Y 2021 YTD (in m ill io ns ) Net Interest Income Full year Q1 2021 Q2 2021 $38 $35 $115 $119 $127 $140 $144 $73 2016Y 2017Y 2018Y 2019Y 2020Y 2021 YTD (in m ill io ns ) Non Interest Expense Full year Q1 2021 Q2 2021 $11 $11 $27 $29 $23 $26 $46 $22 2016Y 2017Y 2018Y 2019Y 2020Y 2021 YTD (in m ill io ns ) Non Interest Income Full year 1Q 2021 2Q 2021

1.52% 1.41% 1.91% 1.61% 1.28% 1.61% 1.01% 0.95% 1.22% 1.22% 0.90% 1.40% 2016Y 2017Y 2018Y 2019Y 2020Y 2021 YTD** Return on Average Assets EagleBancorp Peer Median Strong returns 17 • Return on tangible common equity (non-GAAP) negatively impacted by a higher level of capitalization (TCE/TA 11.07% vs. 8.83% peer median) • Return on average assets continues to outpace peers • PPNR/AA is down in 2021 YTD (1.92%) on much higher average assets (up $1.1 billion higher than 2020Y) *Please refer to the Non-GAAP reconciliation and footnotes in the appendices. **For the six months ended June 30, 2021, annualized. Note: Peers are depository institutions with assets from $7-$15 billion as of December 31, 2020 (excludes savings banks, thrifts and mutuals). Source: S&P Global Market Intelligence. 14.19% 12.54% 16.63% 13.40% 12.03% 15.80% 11.29% 11.34% 14.14% 13.60% 10.60% 16.35% 2016Y 2017Y 2018Y 2019Y 2020Y 2021 YTD** Return on Average Tangible Common Equity (Non-GAAP)* EagleBancorp Peer Median

$18.83 $21.61 $24.67 $29.17 $32.67 $35.74 $36.16 $37.58 2015Y 2016Y 2017Y 2018Y 2019Y 2020Y 2021Q1 2021Q2 Tangible Book Value Per Share Tangible book builds, increased dividend 18 • Tangible book continues to rise ‒ TBVPS growth of 13.4% (CAGR) from 2015 through the first half of 2021 • Dividend increased ‒ Raised quarterly dividend to $0.35 per share ‒ Dividend yield of 2.51% competitive with peers ‒ 2nd quarter payout ratio 23.3% $1.36 $1.50 $2.86 $2.92 $4.42 $4.18 $4.09 $2.86 2016Y 2017Y 2018Y 2019Y 2020Y 2021 YTD Earnings per Share (diluted) Full year 1Q 2021 2Q 2021 $0.25 $0.35 $- $- $- $0.66 $0.88 $0.60 2016Y 2017Y 2018Y 2019Y 2020Y 2020 YTD Common Dividends Per Share Full year 1Q 2021 2Q 2021 Note: Chart for Tangible Book Value Per Share is as of period end.

0.30% 0.20% 0.21% 0.56% 0.59% 0.51% 0.50% 2016Y 2017Y 2018Y 2019Y 2020Y 2021Q1 2021Q2 NPAs** / Assets 0.09% 0.06% 0.05% 0.13% 0.26% 0.27% 0.30% 2016Y 2017Y 2018Y 2019Y 2020Y 2021Q1 2021Q2 NCO / Average Loans Asset quality steady, reserves released 19 *For the six months ended June 30, 2021. **NPAs include loans 90 days past due and still accruing. : Note: CECL adoption on January 1, 2020 led to an initial adjustment to the allowance for credit losses of $10.6 million. Charts for Allowance for Credit Losses and NPAs are as of period end. Net Charge Offs (“NCO”) are annualized for periods of less than a year. • Credit quality remained strong in 1st half of 2021 ‒ NPAs and charge-offs remain low ‒ Reserve releases in 1st and 2nd quarters 1.04% 1.01% 1.00% 0.98% 1.41% 1.36% 1.28% 2016Y 2017Y 2018Y 2019Y 2020Y 2021Q1 2021Q2 Allowance for Credit Losses / Loans HFI $35.0 $10.6 $11.3 $9.0 $8.7 $13.1 $45.6 ($6.2) 2016Y 2017Y 2018Y 2019Y 2020Y 2021 YTD* (in m ill io ns ) Provision for Credit Losses Full year Q1 2021 Q2 2021 Day One CECL

20 Margin impacted by deposit inflows • Large deposit inflows in 2020 lowered margins ‒ Asset mix changed as average loans to average assets moved down to 64.5% ‒ In 2Q, average loans $2.1 billion more than average deposits ‒ 2Q NIM absent PPP loan sale was 2.88%* $5.3 $5.9 $6.6 $7.3 $7.9 $7.7 $7.4 $5.4 $5.8 $6.4 $7.2 $8.5 $9.6 $9.5 $3.0 $4.0 $5.0 $6.0 $7.0 $8.0 $9.0 $10.0 2016Y 2017Y 2018Y 2019Y 2020Y 2021Q1 2021Q2 (in b ill io ns ) Average Loans & Average Deposits Average Loans Average Deposits 2.88% 4.16% 4.15% 4.10% 3.77% 3.19% 2.98% 3.04% 2016Y 2017Y 2018Y 2019Y 2020Y 2021Q1 2021Q2 Net Interest Margin PPP loan sale Net interest margin *Please refer to the Non-GAAP reconciliation and footnotes in the appendices. Note: Charts for Net interest Margin and Asset Mix are as of period end.
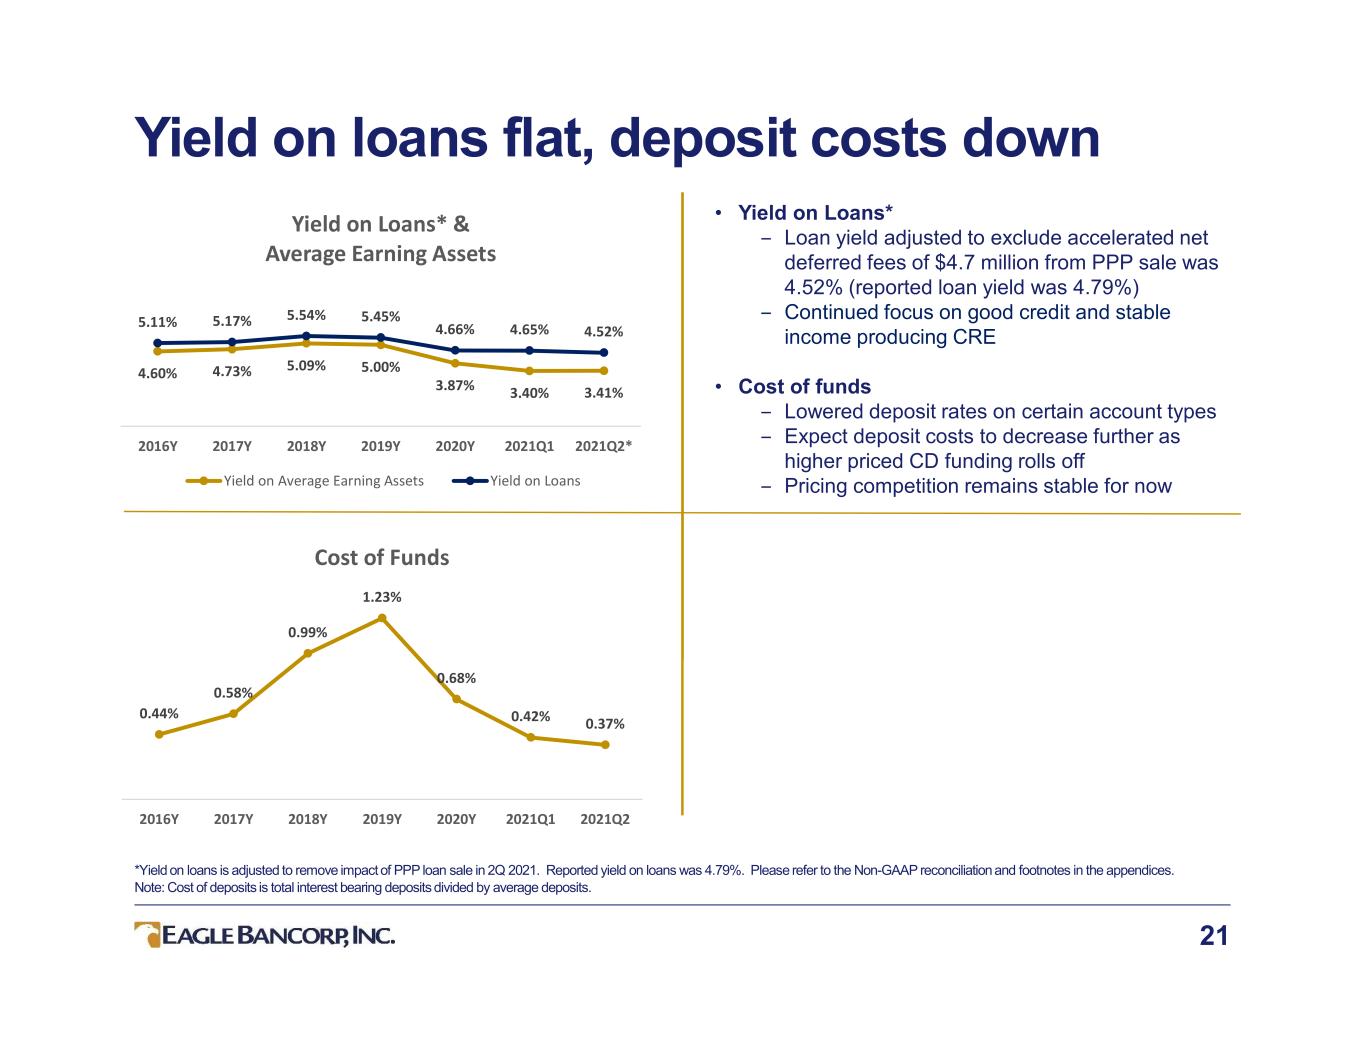
21 Yield on loans flat, deposit costs down • Yield on Loans* ‒ Loan yield adjusted to exclude accelerated net deferred fees of $4.7 million from PPP sale was 4.52% (reported loan yield was 4.79%) ‒ Continued focus on good credit and stable income producing CRE • Cost of funds ‒ Lowered deposit rates on certain account types ‒ Expect deposit costs to decrease further as higher priced CD funding rolls off ‒ Pricing competition remains stable for now *Yield on loans is adjusted to remove impact of PPP loan sale in 2Q 2021. Reported yield on loans was 4.79%. Please refer to the Non-GAAP reconciliation and footnotes in the appendices. Note: Cost of deposits is total interest bearing deposits divided by average deposits. 0.44% 0.58% 0.99% 1.23% 0.68% 0.42% 0.37% 2016Y 2017Y 2018Y 2019Y 2020Y 2021Q1 2021Q2 Cost of Funds 4.60% 4.73% 5.09% 5.00% 3.87% 3.40% 3.41% 5.11% 5.17% 5.54% 5.45% 4.66% 4.65% 4.52% 2016Y 2017Y 2018Y 2019Y 2020Y 2021Q1 2021Q2* Yield on Loans* & Average Earning Assets Yield on Average Earning Assets Yield on Loans
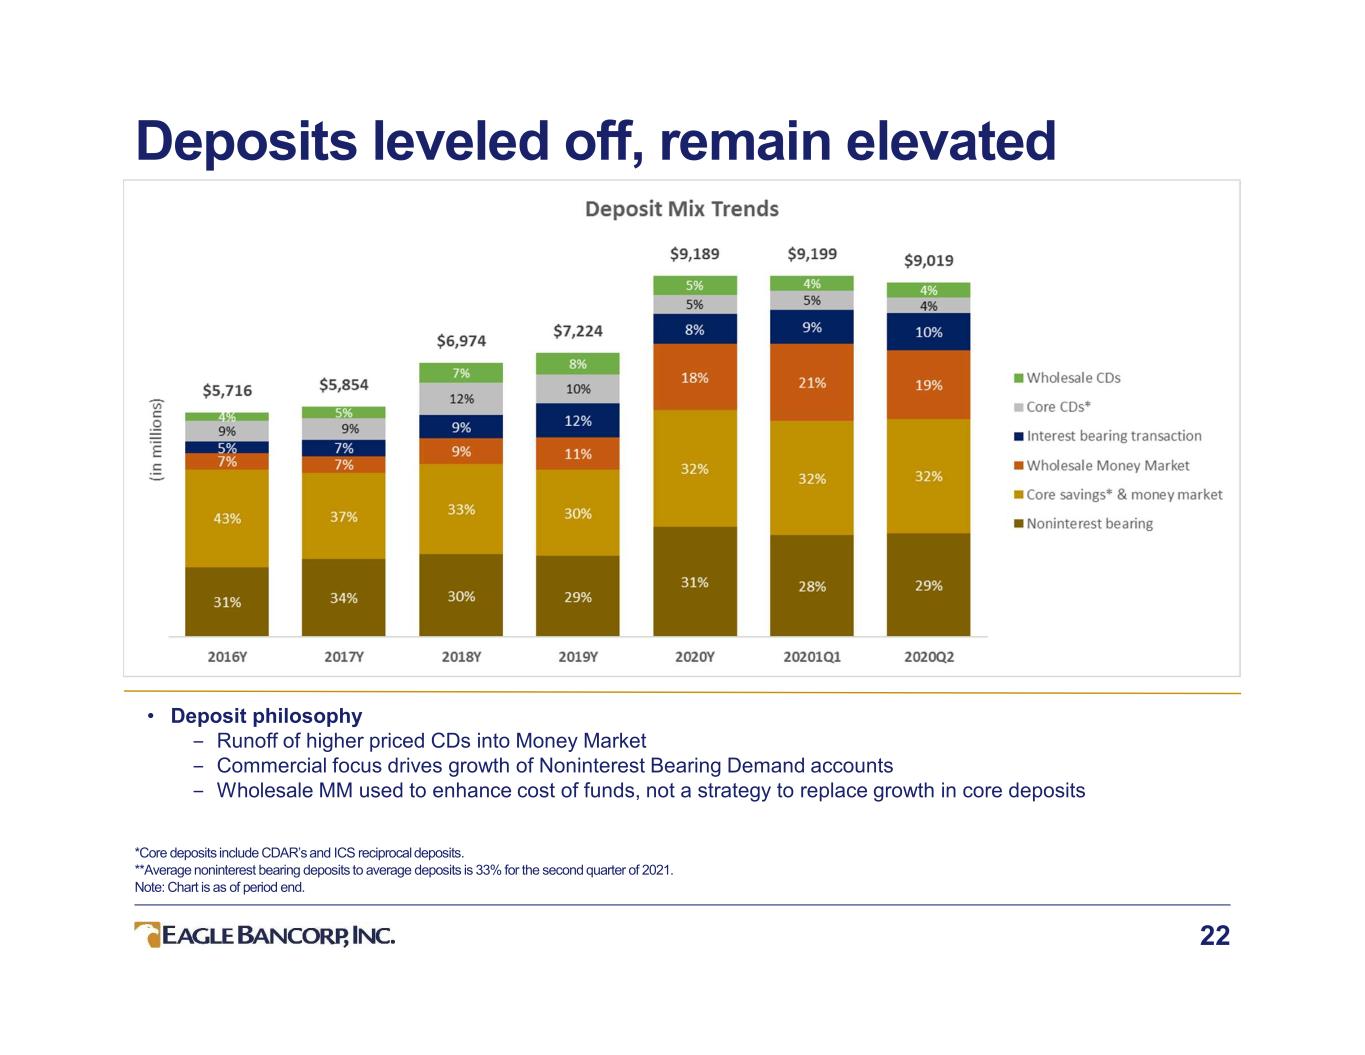
Deposits leveled off, remain elevated 22 *Core deposits include CDAR’s and ICS reciprocal deposits. **Average noninterest bearing deposits to average deposits is 33% for the second quarter of 2021. Note: Chart is as of period end. • Deposit philosophy ‒ Runoff of higher priced CDs into Money Market ‒ Commercial focus drives growth of Noninterest Bearing Demand accounts ‒ Wholesale MM used to enhance cost of funds, not a strategy to replace growth in core deposits
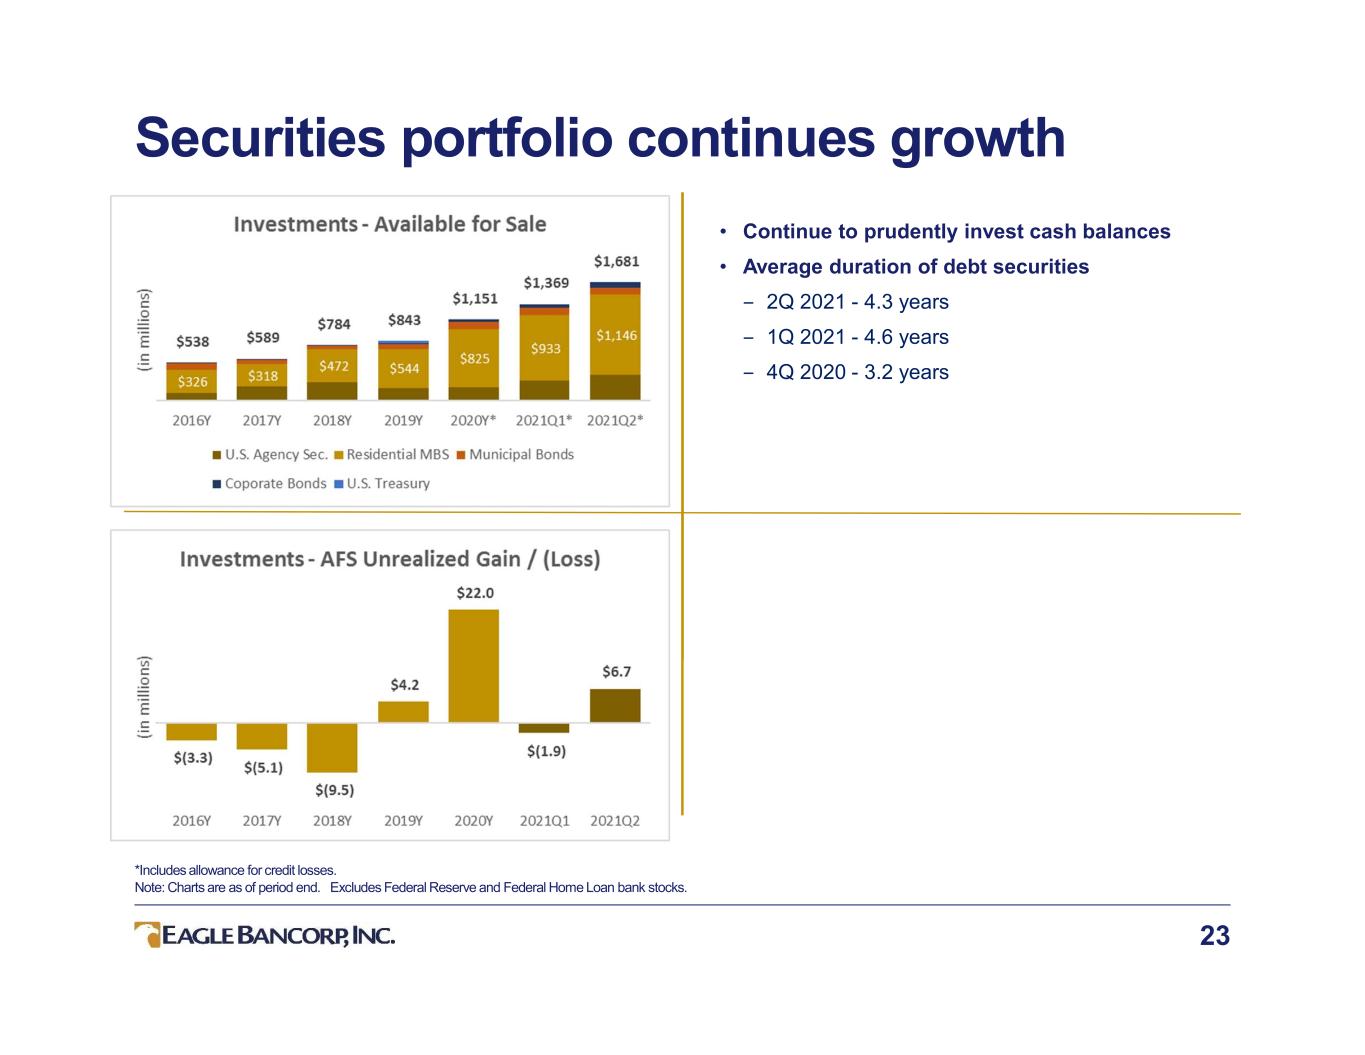
Securities portfolio continues growth 23 • Continue to prudently invest cash balances • Average duration of debt securities ‒ 2Q 2021 - 4.3 years ‒ 1Q 2021 - 4.6 years ‒ 4Q 2020 - 3.2 years *Includes allowance for credit losses. Note: Charts are as of period end. Excludes Federal Reserve and Federal Home Loan bank stocks.

Loan growth still challenging 24 • Loan commentary – C&I/Owner Occupied CRE at 32.4% of portfolio is more of a focus than other local banks – C&I Loan Portfolio is predominantly variable rate loans – Owner Occupied Loans are key to small and mid-market relationships – DDA Operating Accounts of C&I relationships are a critical component of deposit composition strategy 32.4% Note: Chart is as of period end.
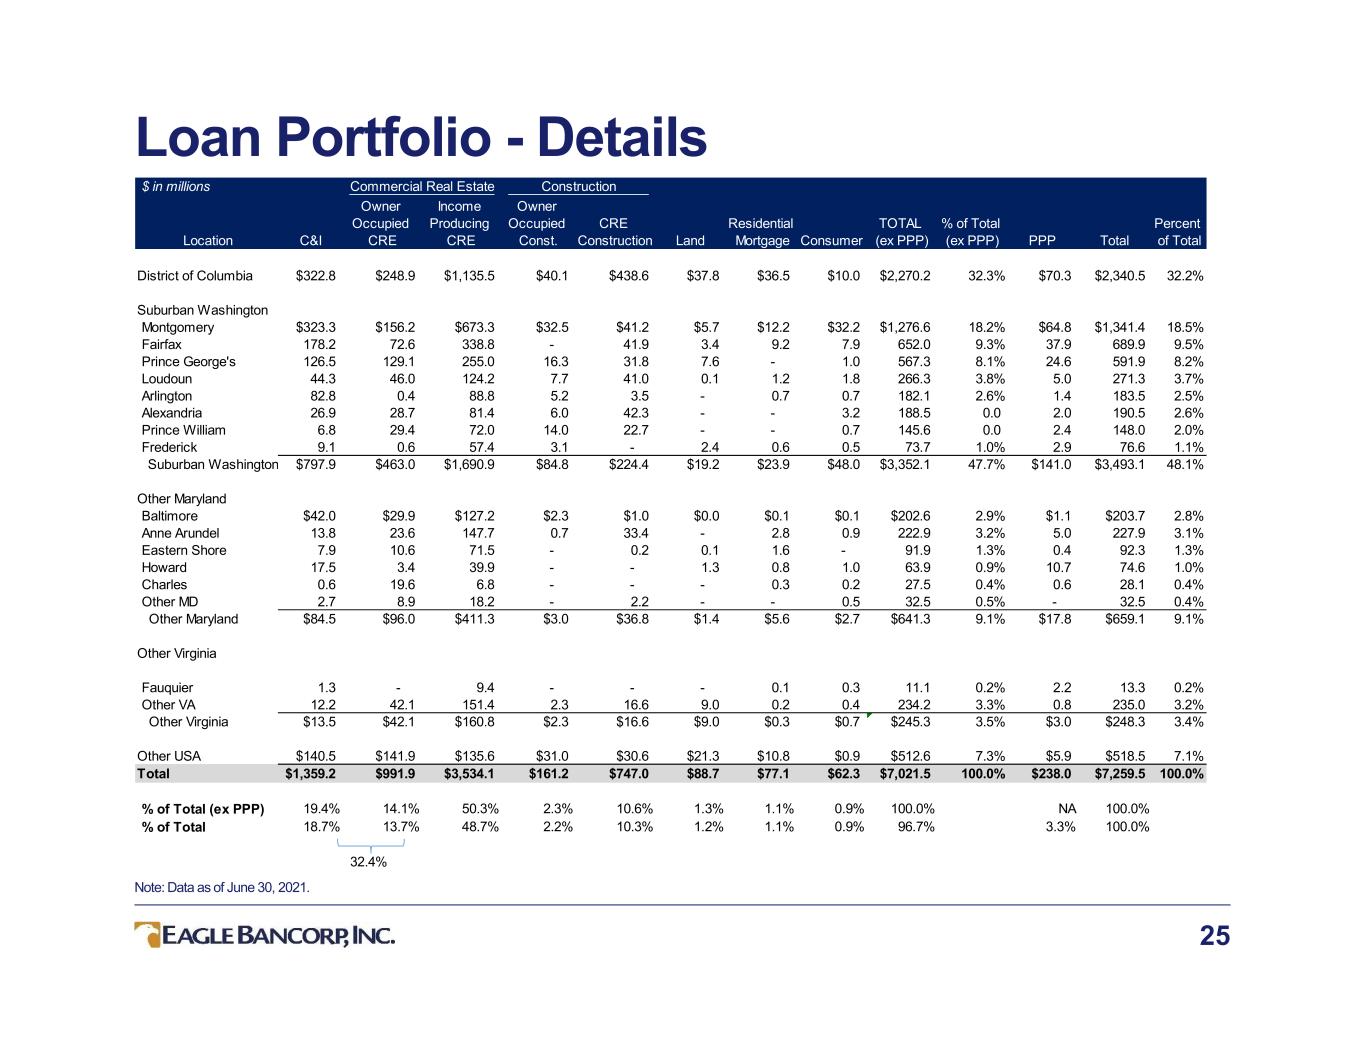
Loan Portfolio - Details 25 Note: Data as of June 30, 2021. $ in millions Location C&I Owner Occupied CRE Income Producing CRE Owner Occupied Const. CRE Construction Land Residential Mortgage Consumer TOTAL (ex PPP) % of Total (ex PPP) PPP Total Percent of Total District of Columbia $322.8 $248.9 $1,135.5 $40.1 $438.6 $37.8 $36.5 $10.0 $2,270.2 32.3% $70.3 $2,340.5 32.2% Suburban Washington Montgomery $323.3 $156.2 $673.3 $32.5 $41.2 $5.7 $12.2 $32.2 $1,276.6 18.2% $64.8 $1,341.4 18.5% Fairfax 178.2 72.6 338.8 - 41.9 3.4 9.2 7.9 652.0 9.3% 37.9 689.9 9.5% Prince George's 126.5 129.1 255.0 16.3 31.8 7.6 - 1.0 567.3 8.1% 24.6 591.9 8.2% Loudoun 44.3 46.0 124.2 7.7 41.0 0.1 1.2 1.8 266.3 3.8% 5.0 271.3 3.7% Arlington 82.8 0.4 88.8 5.2 3.5 - 0.7 0.7 182.1 2.6% 1.4 183.5 2.5% Alexandria 26.9 28.7 81.4 6.0 42.3 - - 3.2 188.5 0.0 2.0 190.5 2.6% Prince William 6.8 29.4 72.0 14.0 22.7 - - 0.7 145.6 0.0 2.4 148.0 2.0% Frederick 9.1 0.6 57.4 3.1 - 2.4 0.6 0.5 73.7 1.0% 2.9 76.6 1.1% Suburban Washington $797.9 $463.0 $1,690.9 $84.8 $224.4 $19.2 $23.9 $48.0 $3,352.1 47.7% $141.0 $3,493.1 48.1% Other Maryland Baltimore $42.0 $29.9 $127.2 $2.3 $1.0 $0.0 $0.1 $0.1 $202.6 2.9% $1.1 $203.7 2.8% Anne Arundel 13.8 23.6 147.7 0.7 33.4 - 2.8 0.9 222.9 3.2% 5.0 227.9 3.1% Eastern Shore 7.9 10.6 71.5 - 0.2 0.1 1.6 - 91.9 1.3% 0.4 92.3 1.3% Howard 17.5 3.4 39.9 - - 1.3 0.8 1.0 63.9 0.9% 10.7 74.6 1.0% Charles 0.6 19.6 6.8 - - - 0.3 0.2 27.5 0.4% 0.6 28.1 0.4% Other MD 2.7 8.9 18.2 - 2.2 - - 0.5 32.5 0.5% - 32.5 0.4% Other Maryland $84.5 $96.0 $411.3 $3.0 $36.8 $1.4 $5.6 $2.7 $641.3 9.1% $17.8 $659.1 9.1% Other Virginia Fauquier 1.3 - 9.4 - - - 0.1 0.3 11.1 0.2% 2.2 13.3 0.2% Other VA 12.2 42.1 151.4 2.3 16.6 9.0 0.2 0.4 234.2 3.3% 0.8 235.0 3.2% Other Virginia $13.5 $42.1 $160.8 $2.3 $16.6 $9.0 $0.3 $0.7 $245.3 3.5% $3.0 $248.3 3.4% Other USA $140.5 $141.9 $135.6 $31.0 $30.6 $21.3 $10.8 $0.9 $512.6 7.3% $5.9 $518.5 7.1% Total $1,359.2 $991.9 $3,534.1 $161.2 $747.0 $88.7 $77.1 $62.3 $7,021.5 100.0% $238.0 $7,259.5 100.0% % of Total (ex PPP) 19.4% 14.1% 50.3% 2.3% 10.6% 1.3% 1.1% 0.9% 100.0% NA 100.0% % of Total 18.7% 13.7% 48.7% 2.2% 10.3% 1.2% 1.1% 0.9% 96.7% 3.3% 100.0% 32.4% Commercial Real Estate Construction

ADC & CRE Concentration 26 Note: ADC and CRE concentration ratios represents concentration as a percentage of consolidated risk-based capital. CRE excludes owner occupied. Charts and data are as of period end. CRE Details ADC Details $ in millions 2020Y 2021 Q1 2021 Q2 Total ADC portfolio $1,378 $1,341 $1,421 ADC/Total Loans 17.8% 17.8% 19.6% NPLs/Total ADC 0.60% 0.80% 1.02% NCOs/Total ADC* 0.21% 0.06% 0.03% *Periods of less than one year are annualized. $ in millions 2020Y 2021 Q1 2021 Q2 Total CRE portfolio $4,618 $4,342 $4,427 CRE/Total Loans 59.5% 57.7% 61.0% NPLs/Total CRE 0.70% 0.54% 0.55% NCOs/Total CRE* 0.12% 0.10% 0.20% *Periods of less than one year are annualized.

Loan Quality – COVID 19 and Other Metrics 27 • COVID-19 Migration ‒ Beginning in the third quarter of 2020, all loans receiving a second COVID-19 deferral or payment deferral were downgraded to a watch rating, if not already rated as such. ‒ This was done to raise the visibility of these loans within the loan portfolio. After these COVID-19 deferred or modified loans demonstrate six months of payments and sustained performance, they may be considered for removal as a watch rated loan. $ in millions 6/30/2020 9/30/2020 12/31/2020 3/31/2021 6/30/2021 COVID-19 Deferrals and Modifications Loan Balance $1,630 $851 $72 $143 $72 Number of Notes 708 321 36 58 31 Percent of Loans HFI 20.3% 10.8% 0.9% 1.9% 1.0% Other Loan Metrics Watch rated loans $96 $602 $681 $568 $545 30-89 Days Past Due $20 $26 $104 $72 $4 Total loans HFI $8,022 $7,880 $7,760 $7,527 $7,260

Mortgages, FHA & SBA 28 • Mortgages ‒ Locked loans in 2021 were $552 million ‒ 1Q 2021 about 80% re-fi ‒ 2Q 2021 about 55%-60% re-fi • FHA Multi-Family ‒ 5 dedicated FTE’s ‒ Group started in 2016 ‒ $3.2 million of trade premiums in 1st half of 2021 • SBA ‒ 9/30/2020 - Over 1,400 PPP loans totaled $456 million ‒ 5/3/2021 - Sold 849 PPP loans for a purchase price of $169 million ‒ 6/30/2021 - 537 PPP loans totaled $238 million *Locked loans are loans for which an application is received and an interest rate is locked between the prospective borrower and the bank. Not all locked loans close.

Appendices 29
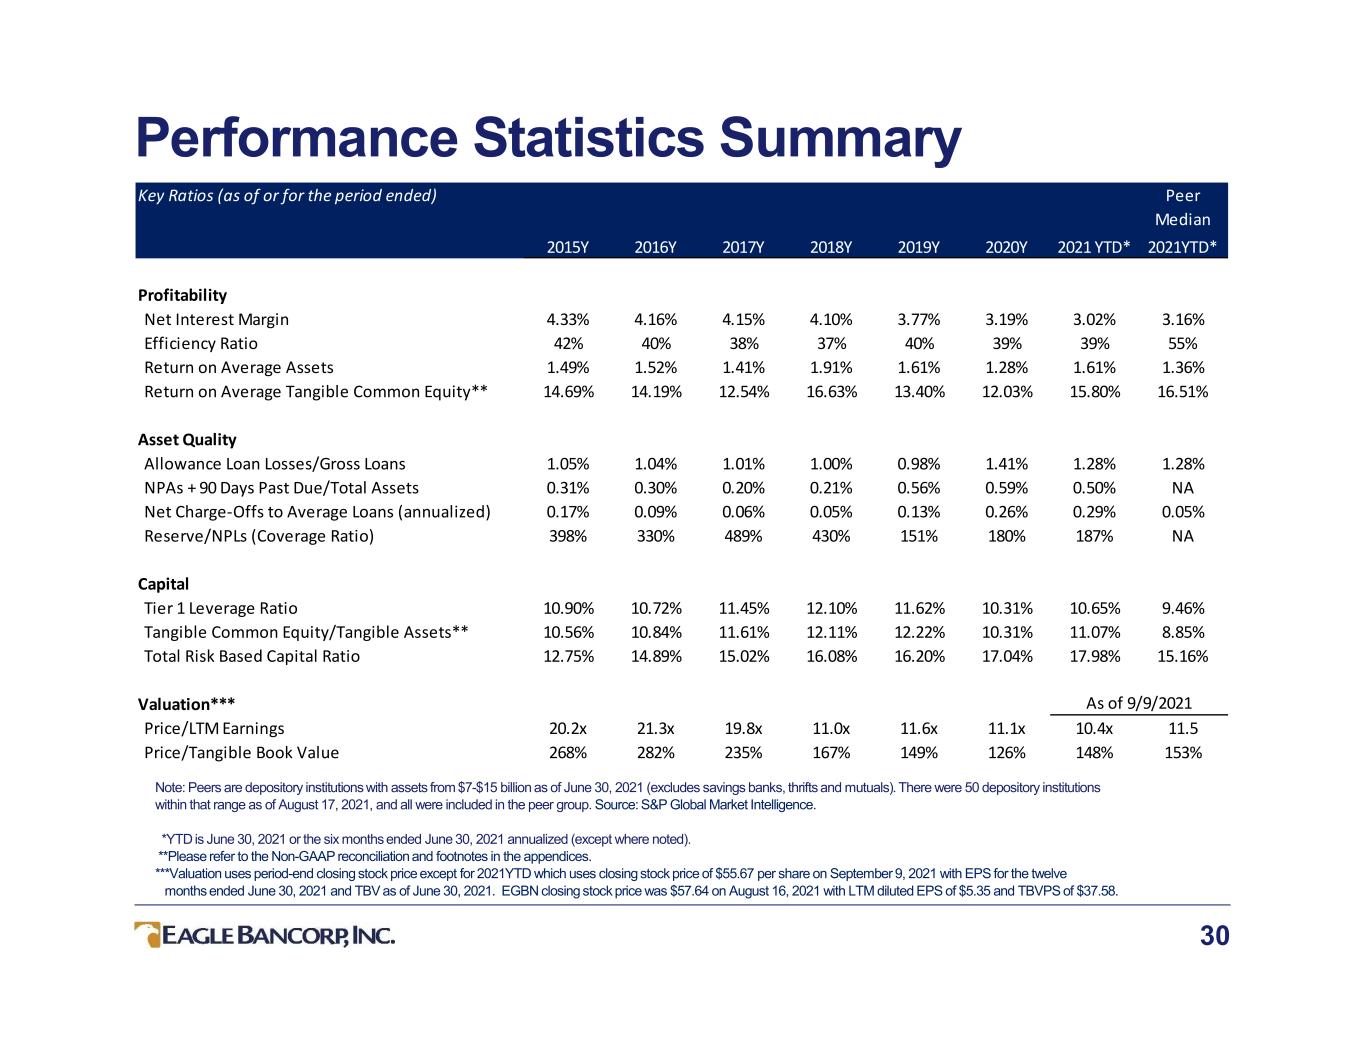
Performance Statistics Summary 30 Note: Peers are depository institutions with assets from $7-$15 billion as of June 30, 2021 (excludes savings banks, thrifts and mutuals). There were 50 depository institutions within that range as of August 17, 2021, and all were included in the peer group. Source: S&P Global Market Intelligence. *YTD is June 30, 2021 or the six months ended June 30, 2021 annualized (except where noted). **Please refer to the Non-GAAP reconciliation and footnotes in the appendices. ***Valuation uses period-end closing stock price except for 2021YTD which uses closing stock price of $55.67 per share on September 9, 2021 with EPS for the twelve months ended June 30, 2021 and TBV as of June 30, 2021. EGBN closing stock price was $57.64 on August 16, 2021 with LTM diluted EPS of $5.35 and TBVPS of $37.58. Key Ratios (as of or for the period ended) Peer Median 2015Y 2016Y 2017Y 2018Y 2019Y 2020Y 2021 YTD* 2021YTD* Profitability Net Interest Margin 4.33% 4.16% 4.15% 4.10% 3.77% 3.19% 3.02% 3.16% Efficiency Ratio 42% 40% 38% 37% 40% 39% 39% 55% Return on Average Assets 1.49% 1.52% 1.41% 1.91% 1.61% 1.28% 1.61% 1.36% Return on Average Tangible Common Equity** 14.69% 14.19% 12.54% 16.63% 13.40% 12.03% 15.80% 16.51% Asset Quality Allowance Loan Losses/Gross Loans 1.05% 1.04% 1.01% 1.00% 0.98% 1.41% 1.28% 1.28% NPAs + 90 Days Past Due/Total Assets 0.31% 0.30% 0.20% 0.21% 0.56% 0.59% 0.50% NA Net Charge-Offs to Average Loans (annualized) 0.17% 0.09% 0.06% 0.05% 0.13% 0.26% 0.29% 0.05% Reserve/NPLs (Coverage Ratio) 398% 330% 489% 430% 151% 180% 187% NA Capital Tier 1 Leverage Ratio 10.90% 10.72% 11.45% 12.10% 11.62% 10.31% 10.65% 9.46% Tangible Common Equity/Tangible Assets** 10.56% 10.84% 11.61% 12.11% 12.22% 10.31% 11.07% 8.85% Total Risk Based Capital Ratio 12.75% 14.89% 15.02% 16.08% 16.20% 17.04% 17.98% 15.16% Valuation*** Price/LTM Earnings 20.2x 21.3x 19.8x 11.0x 11.6x 11.1x 10.4x 11.5 Price/Tangible Book Value 268% 282% 235% 167% 149% 126% 148% 153% As of 9/9/2021
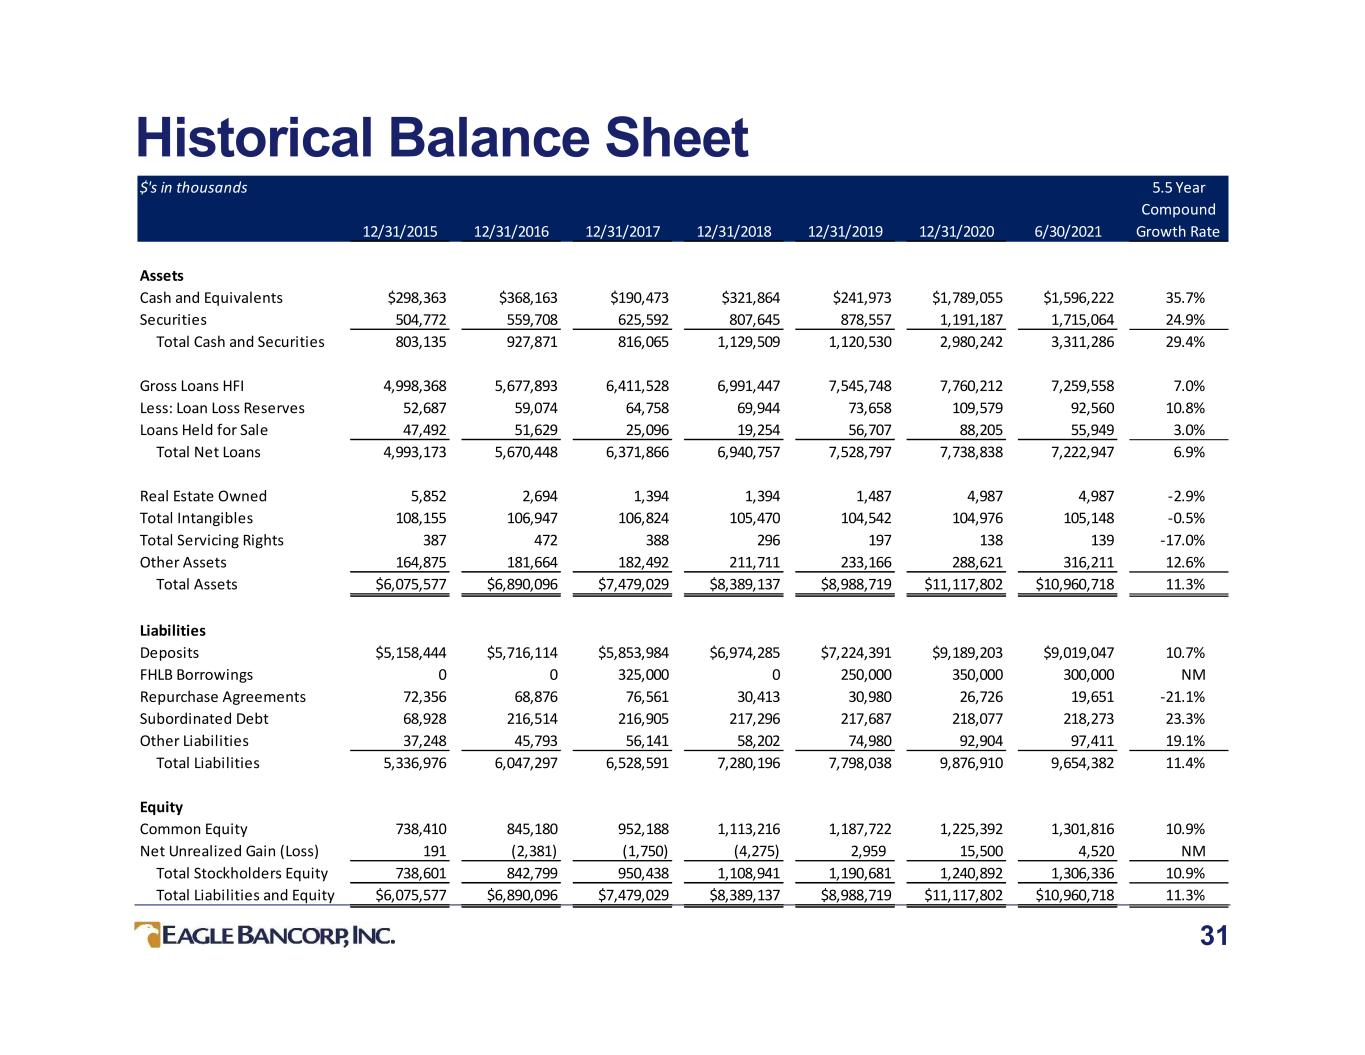
Historical Balance Sheet 31 $'s in thousands 12/31/2015 12/31/2016 12/31/2017 12/31/2018 12/31/2019 12/31/2020 6/30/2021 5.5 Year Compound Growth Rate Assets Cash and Equivalents $298,363 $368,163 $190,473 $321,864 $241,973 $1,789,055 $1,596,222 35.7% Securities 504,772 559,708 625,592 807,645 878,557 1,191,187 1,715,064 24.9% Total Cash and Securities 803,135 927,871 816,065 1,129,509 1,120,530 2,980,242 3,311,286 29.4% Gross Loans HFI 4,998,368 5,677,893 6,411,528 6,991,447 7,545,748 7,760,212 7,259,558 7.0% Less: Loan Loss Reserves 52,687 59,074 64,758 69,944 73,658 109,579 92,560 10.8% Loans Held for Sale 47,492 51,629 25,096 19,254 56,707 88,205 55,949 3.0% Total Net Loans 4,993,173 5,670,448 6,371,866 6,940,757 7,528,797 7,738,838 7,222,947 6.9% Real Estate Owned 5,852 2,694 1,394 1,394 1,487 4,987 4,987 -2.9% Total Intangibles 108,155 106,947 106,824 105,470 104,542 104,976 105,148 -0.5% Total Servicing Rights 387 472 388 296 197 138 139 -17.0% Other Assets 164,875 181,664 182,492 211,711 233,166 288,621 316,211 12.6% Total Assets $6,075,577 $6,890,096 $7,479,029 $8,389,137 $8,988,719 $11,117,802 $10,960,718 11.3% Liabilities Deposits $5,158,444 $5,716,114 $5,853,984 $6,974,285 $7,224,391 $9,189,203 $9,019,047 10.7% FHLB Borrowings 0 0 325,000 0 250,000 350,000 300,000 NM Repurchase Agreements 72,356 68,876 76,561 30,413 30,980 26,726 19,651 -21.1% Subordinated Debt 68,928 216,514 216,905 217,296 217,687 218,077 218,273 23.3% Other Liabilities 37,248 45,793 56,141 58,202 74,980 92,904 97,411 19.1% Total Liabilities 5,336,976 6,047,297 6,528,591 7,280,196 7,798,038 9,876,910 9,654,382 11.4% Equity Common Equity 738,410 845,180 952,188 1,113,216 1,187,722 1,225,392 1,301,816 10.9% Net Unrealized Gain (Loss) 191 (2,381) (1,750) (4,275) 2,959 15,500 4,520 NM Total Stockholders Equity 738,601 842,799 950,438 1,108,941 1,190,681 1,240,892 1,306,336 10.9% Total Liabilities and Equity $6,075,577 $6,890,096 $7,479,029 $8,389,137 $8,988,719 $11,117,802 $10,960,718 11.3%

Historical Income Statement 32 *YTD is the six months ended June 30, 2021. **Compounded growth rate uses 2016Y to the six months ended June 30, 2021 annualized. $ in thousands, except per share data 2016Y 2017Y 2018Y 2019Y 2020Y 2021 YTD* Compound Growth Rate 2016 to 6/30/2021** Total Interest Income $285,805 $324,034 $393,286 $429,630 $389,986 $189,114 5.2% Total Interest Expense 27,641 40,147 76,293 105,585 68,424 21,831 8.7% Net Interest Income 258,164 283,887 316,993 324,045 321,562 167,283 4.8% Provision for Credit Losses 11,331 8,971 8,660 13,091 45,571 (6,206) NM Provision for Unfunded Commitments - - - - 1,380 (1,203) NM Service Charges on Deposits 5,821 6,364 7,014 6,247 4,416 2,099 -5.8% Gain/Loss on Sale of Loans 11,563 9,276 5,963 8,474 22,089 8,656 7.6% Gain/Loss on Sale of Securities 1,194 542 97 1,517 1,815 539 -1.8% BOLI Revenue 1,554 1,466 1,507 1,703 2,071 787 0.2% Other Noninterest Income 7,152 11,725 8,005 7,758 15,305 9,431 19.3% Total Noninterest Income 27,284 29,373 22,586 25,699 45,696 21,512 8.6% Salaries and Employee Benefits 67,010 67,129 67,734 79,842 74,440 41,645 4.0% Premises and Equipment Expenses 15,118 15,632 15,660 14,387 15,715 7,262 -0.7% Marketing and Advertising 3,495 4,095 4,566 4,826 4,278 1,866 1.2% Data Processing 7,747 8,220 9,714 9,412 10,702 5,565 6.8% Legal, Accounting and Professional Fees 3,673 5,053 9,742 12,195 16,406 6,502 25.8% FDIC Insurance 2,718 2,554 3,512 3,206 7,941 4,037 21.9% Other Noninterest Expenses 15,254 15,869 15,783 15,994 14,680 6,604 -2.6% Total Noninterest Expense 115,015 118,552 126,711 139,862 144,162 73,481 4.6% Net Income Before taxes 159,102 185,736 204,208 196,791 176,145 122,723 8.2% Income taxes 61,395 85,504 51,932 53,848 43,928 31,261 0.3% Net Income $97,707 100,232 $152,276 $142,943 $132,217 $91,462 12.1% Earnings per Share - Diluted $2.86 $2.92 $4.42 $4.18 $4.08 $2.86

Loan Portfolio – Income Producing CRE 33 Note: Data as of June 30, 2021 $ in millions Office Family & Hotel/ Mixed Multi- & Office Res. % of Location Motel Industrial Use Family Condo Retail Condo Other Total Total District of Columbia $185.5 $14.4 $256.7 $235.1 $106.0 $85.6 $80.8 $171.4 $1,135.5 32.1% Suburban Washington Montgomery $44.0 $16.2 $71.3 $154.6 $303.9 $11.1 $8.6 $63.6 $673.3 19.1% Fairfax - 0.3 12.8 1.0 168.7 64.5 10.2 81.3 338.8 9.6% Prince George's 76.6 2.2 3.6 8.2 46.3 64.7 2.1 51.3 255.0 7.2% Loudoun - 14.6 - - 37.3 5.5 1.6 65.2 124.2 3.5% Arlington 46.4 - - 0.2 37.1 - 5.1 - 88.8 2.5% Alexandria - - 7.4 - 54.4 17.7 0.8 1.1 81.4 2.3% Prince William 26.8 3.5 - - 5.9 10.3 1.2 24.3 72.0 2.0% Frederick - 2.1 0.5 - 5.8 39.3 1.2 8.5 57.4 1.6% Suburban Washington $193.8 $38.9 $95.6 $164.0 $659.4 $213.1 $30.8 $295.3 $1,690.9 47.8% Other Maryland Baltimore $15.0 $1.1 $82.3 $1.0 $6.4 $5.2 $1.8 $14.4 $127.2 3.6% Anne Arundel 9.7 23.5 29.4 48.1 1.9 7.2 - 27.9 147.7 4.2% Eastern Shore 57.0 - - 7.1 1.8 0.5 2.5 2.6 71.5 2.0% Howard - 6.4 - - 2.1 9.2 3.5 18.7 39.9 1.1% Charles - - - - 6.2 0.6 - - 6.8 0.2% Other MD - 15.5 0.1 1.3 - 1.3 - - 18.2 0.5% Other Maryland $81.7 $46.5 $111.8 $57.5 $18.4 $24.0 $7.8 $63.6 $411.3 11.6% Other Virginia Fauquier - - - - $6.4 $3.0 - - $9.4 0.3% Other VA 0.8 0.2 5.5 38.3 50.4 37.4 6.9 11.9 151.4 4.3% Other Virginia 0.8 $0.2 $5.5 $38.3 $56.8 $40.4 $6.9 $11.9 $160.8 4.5% Other USA 2.9 - 0.4 78.5 3.6 8.1 5.1 37.0 135.6 3.8% Total $464.7 $100.0 $470.0 $573.4 $844.2 $371.2 $131.4 $579.2 $3,534.1 100.0% % of Total 13.1% 2.8% 13.3% 16.2% 23.9% 10.5% 3.7% 16.4% 100.0%

Loan Portfolio – CRE Construction 34 Note: Data as of June 30, 2021 $ in millions Office Single & Multi- & Office Hotel/ Mixed Residential % of Location 1-4 Family Family Condo Motel Use Retail Condo Other Total Total District of Columbia $36.2 $243.6 $53.5 $0.0 $51.4 $3.1 $33.7 $17.1 $438.6 58.7% Suburban Washington Montgomery $14.8 $6.2 $19.4 $0.0 $0.0 $0.0 $0.4 $0.4 $41.2 5.5% Fairfax 27.9 - - - 3.4 - - 10.6 41.9 5.6% Prince George's 4.8 9.5 - 12.5 - - - 5.0 31.8 4.3% Loudoun - - - - 3.0 - 4.0 34.0 41.0 5.5% Arlington 3.5 - - - - - - - 3.5 0.5% Alexandria 1.0 28.5 - 4.0 - - 8.8 - 42.3 5.7% Prince William 1.0 - - - - - - 21.7 22.7 3.0% Frederick - - - - - - - - - 0.0% Suburban Washington $53.0 $44.2 $19.4 $16.5 $6.4 $0.0 $13.2 $71.7 $224.4 30.0% Other Maryland Baltimore $1.0 $0.0 $0.0 $0.0 $0.0 $0.0 $0.0 $0.0 $1.0 0.1% Anne Arundel - - - - 29.4 - - 4.0 33.4 4.5% Eastern Shore 0.2 - - - - - - - 0.2 0.0% Howard - - - - - - - - - 0.0% Charles - - - - - - - - - 0.0% Other MD - - - - 2.2 - - - 2.2 0.3% Other Maryland $1.2 $0.0 $0.0 $0.0 $31.6 $0.0 $0.0 $4.0 $36.8 4.9% Other Virginia Fauquier - - - - - - - 0.0% Other VA 16.6 - - - - - - - 16.6 2.2% Other Virginia $16.6 $0.0 $0.0 $0.0 $0.0 $0.0 $0.0 $0.0 $16.6 2.2% Other USA 2.0 - - 15.5 - - - 13.1 30.6 4.1% Total $109.0 $287.8 $72.9 $32.0 $89.4 $3.1 $46.9 $105.9 $747.0 100.0% % of Total 14.6% 38.5% 9.8% 4.3% 12.0% 0.4% 6.3% 14.2% 100.0% Renovation $27.3 $51.0 $23.4 $0.0 $13.9 $0.0 $5.7 $16.4 $137.7 Ground-Up 81.7 236.8 49.5 32.0 75.5 3.1 41.2 89.5 609.3
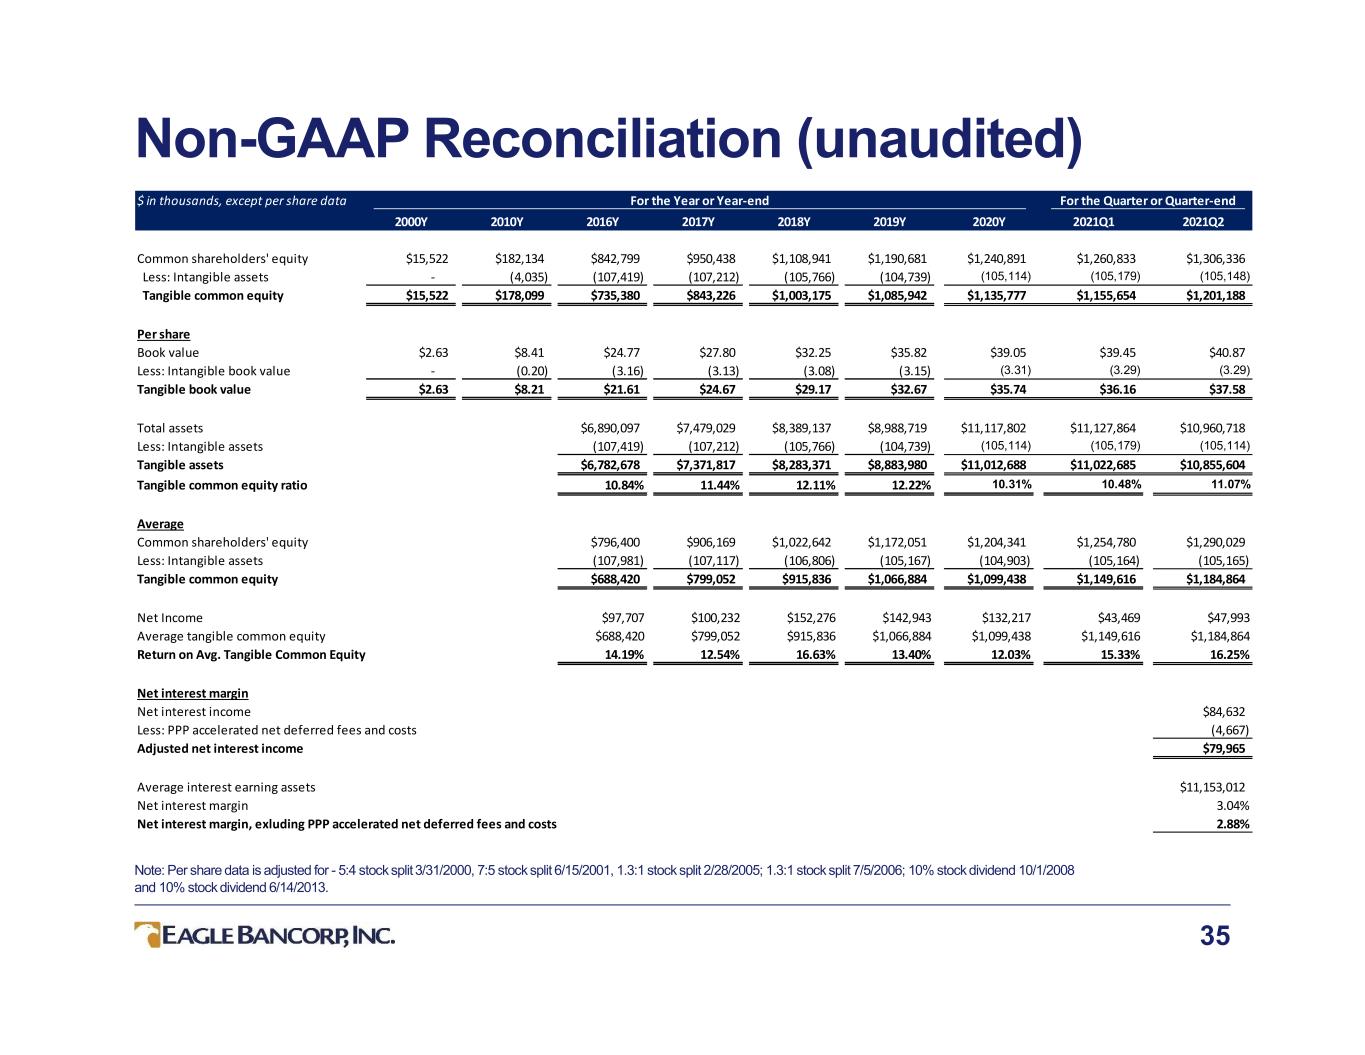
35 Non-GAAP Reconciliation (unaudited) Note: Per share data is adjusted for - 5:4 stock split 3/31/2000, 7:5 stock split 6/15/2001, 1.3:1 stock split 2/28/2005; 1.3:1 stock split 7/5/2006; 10% stock dividend 10/1/2008 and 10% stock dividend 6/14/2013. $ in thousands, except per share data 2000Y 2010Y 2016Y 2017Y 2018Y 2019Y 2020Y 2021Q1 2021Q2 Common shareholders' equity $15,522 $182,134 $842,799 $950,438 $1,108,941 $1,190,681 $1,240,891 $1,260,833 $1,306,336 Less: Intangible assets - (4,035) (107,419) (107,212) (105,766) (104,739) (105,114) (105,179) (105,148) Tangible common equity $15,522 $178,099 $735,380 $843,226 $1,003,175 $1,085,942 $1,135,777 $1,155,654 $1,201,188 Per share Book value $2.63 $8.41 $24.77 $27.80 $32.25 $35.82 $39.05 $39.45 $40.87 Less: Intangible book value - (0.20) (3.16) (3.13) (3.08) (3.15) (3.31) (3.29) (3.29) Tangible book value $2.63 $8.21 $21.61 $24.67 $29.17 $32.67 $35.74 $36.16 $37.58 Total assets $6,890,097 $7,479,029 $8,389,137 $8,988,719 $11,117,802 $11,127,864 $10,960,718 Less: Intangible assets (107,419) (107,212) (105,766) (104,739) (105,114) (105,179) (105,114) Tangible assets $6,782,678 $7,371,817 $8,283,371 $8,883,980 $11,012,688 $11,022,685 $10,855,604 Tangible common equity ratio 10.84% 11.44% 12.11% 12.22% 10.31% 10.48% 11.07% Average Common shareholders' equity $796,400 $906,169 $1,022,642 $1,172,051 $1,204,341 $1,254,780 $1,290,029 Less: Intangible assets (107,981) (107,117) (106,806) (105,167) (104,903) (105,164) (105,165) Tangible common equity $688,420 $799,052 $915,836 $1,066,884 $1,099,438 $1,149,616 $1,184,864 Net Income $97,707 $100,232 $152,276 $142,943 $132,217 $43,469 $47,993 Average tangible common equity $688,420 $799,052 $915,836 $1,066,884 $1,099,438 $1,149,616 $1,184,864 Return on Avg. Tangible Common Equity 14.19% 12.54% 16.63% 13.40% 12.03% 15.33% 16.25% Net interest margin Net interest income $84,632 Less: PPP accelerated net deferred fees and costs (4,667) Adjusted net interest income $79,965 Average interest earning assets $11,153,012 Net interest margin 3.04% Net interest margin, exluding PPP accelerated net deferred fees and costs 2.88% For the Year or Year-end For the Quarter or Quarter-end
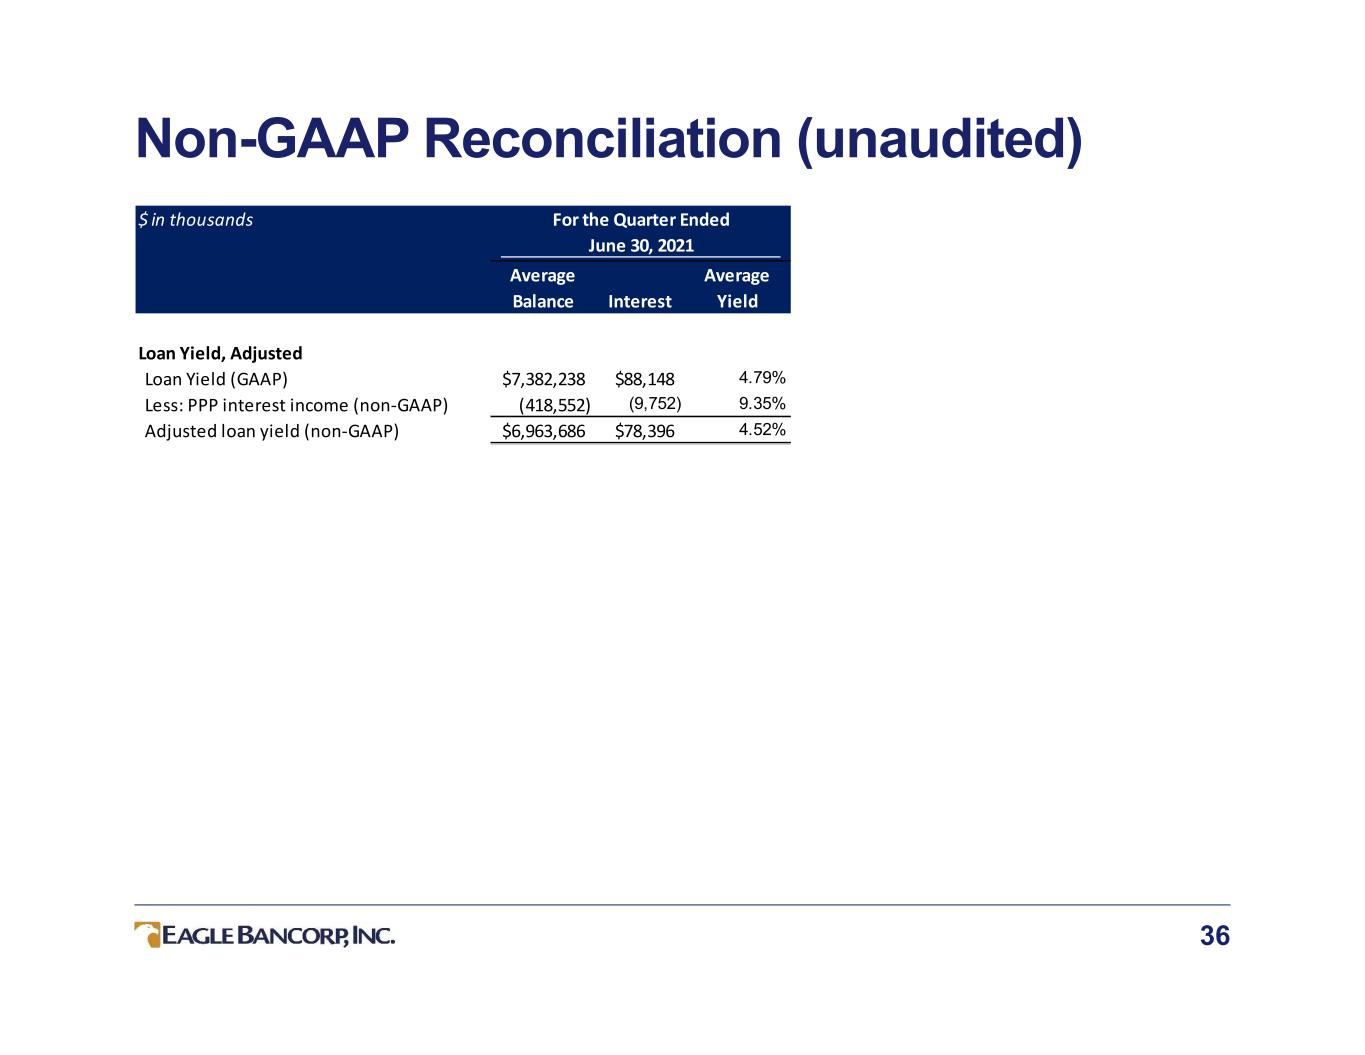
36 Non-GAAP Reconciliation (unaudited) $ in thousands Average Average Balance Interest Yield Loan Yield, Adjusted Loan Yield (GAAP) $7,382,238 $88,148 4.79% Less: PPP interest income (non-GAAP) (418,552) (9,752) 9.35% Adjusted loan yield (non-GAAP) $6,963,686 $78,396 4.52% June 30, 2021 For the Quarter Ended
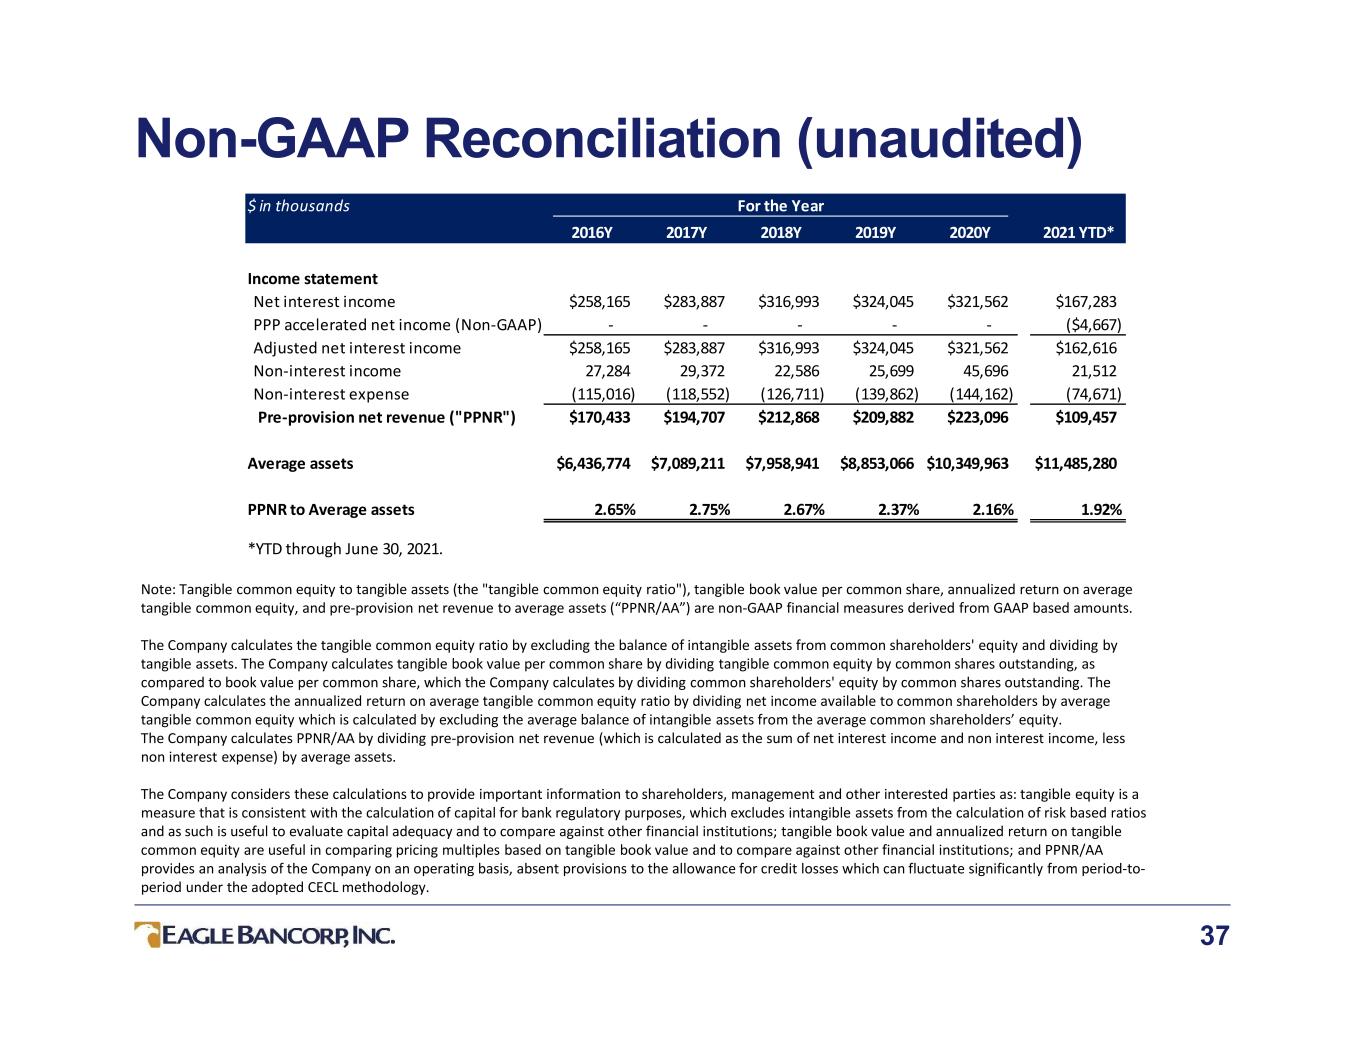
37 Non-GAAP Reconciliation (unaudited) Note: Tangible common equity to tangible assets (the "tangible common equity ratio"), tangible book value per common share, annualized return on average tangible common equity, and pre-provision net revenue to average assets (“PPNR/AA”) are non-GAAP financial measures derived from GAAP based amounts. The Company calculates the tangible common equity ratio by excluding the balance of intangible assets from common shareholders' equity and dividing by tangible assets. The Company calculates tangible book value per common share by dividing tangible common equity by common shares outstanding, as compared to book value per common share, which the Company calculates by dividing common shareholders' equity by common shares outstanding. The Company calculates the annualized return on average tangible common equity ratio by dividing net income available to common shareholders by average tangible common equity which is calculated by excluding the average balance of intangible assets from the average common shareholders’ equity. The Company calculates PPNR/AA by dividing pre-provision net revenue (which is calculated as the sum of net interest income and non interest income, less non interest expense) by average assets. The Company considers these calculations to provide important information to shareholders, management and other interested parties as: tangible equity is a measure that is consistent with the calculation of capital for bank regulatory purposes, which excludes intangible assets from the calculation of risk based ratios and as such is useful to evaluate capital adequacy and to compare against other financial institutions; tangible book value and annualized return on tangible common equity are useful in comparing pricing multiples based on tangible book value and to compare against other financial institutions; and PPNR/AA provides an analysis of the Company on an operating basis, absent provisions to the allowance for credit losses which can fluctuate significantly from period-to- period under the adopted CECL methodology. $ in thousands 2016Y 2017Y 2018Y 2019Y 2020Y 2021 YTD* Income statement Net interest income $258,165 $283,887 $316,993 $324,045 $321,562 $167,283 PPP accelerated net income (Non-GAAP) - - - - - ($4,667) Adjusted net interest income $258,165 $283,887 $316,993 $324,045 $321,562 $162,616 Non-interest income 27,284 29,372 22,586 25,699 45,696 21,512 Non-interest expense (115,016) (118,552) (126,711) (139,862) (144,162) (74,671) Pre-provision net revenue ("PPNR") $170,433 $194,707 $212,868 $209,882 $223,096 $109,457 Average assets $6,436,774 $7,089,211 $7,958,941 $8,853,066 $10,349,963 $11,485,280 PPNR to Average assets 2.65% 2.75% 2.67% 2.37% 2.16% 1.92% *YTD through June 30, 2021. For the Year
