Attached files
| file | filename |
|---|---|
| 8-K - 8-K - WABASH NATIONAL Corp | wnc-20210825.htm |

WABASH NATIONAL CORPORATION Raymond James Industrials Conference August 25, 2021

2 2 Safe Harbor Statement & Non-GAAP Financial Measures This presentation contains certain forward-looking statements as defined by the Private Securities Litigation Reform Act of 1995. Forward-looking statements convey Wabash National Corporation's (the "Company") current expectations or forecasts of future events. All statements contained in this presentation other than statements of historical fact are forward-looking statements. These forward-looking statements include, among other things, all statements regarding our ability to effectively manage and operate our business given the ongoing uncertainty caused by the COVID-19 pandemic; the highly cyclical nature of our business; demand for our products; the relative strength or weakness of the overall economy; our expected revenues, income or loss; our ability to achieve sustained profitability; dependence on industry trends; our strategic plan and plans for future operations; availability and pricing of raw materials, including the impact of tariffs or other international trade developments; the level of competition that we face; reliance on certain customers, suppliers and corporate relationships; our ability to develop and commercialize new products; acceptance of new technologies and products; export sales and new markets; engineering and manufacturing capabilities and capacity, including our ability to attract and retain qualified personnel; government regulations; the outcome of any pending litigation or notice of environmental dispute; the risks associated with climate change and related government regulation; availability of capital and financing, including for working capital and capital expenditures; our ability to manage our indebtedness; our ability to effectively integrate Supreme and realize expected synergies and benefits from the Supreme acquisition; and assumptions relating to the foregoing. Readers should review and consider the various disclosures made by the Company in this presentation and in the Company’s reports to its stockholders and periodic reports on Forms 10-K and 10-Q. We cannot give assurance that the expectations reflected in our forward-looking statements will prove to be correct. Our actual results could differ materially from those anticipated in these forward-looking statements. All written and oral forward-looking statements attributable to us are expressly qualified in their entirety by the factors we disclose that could cause our actual results to differ materially from our expectations. In addition to disclosing financial results calculated in accordance with United States generally accepted accounting principles (GAAP), the financial information included in this presentation contains non-GAAP financial measures, including free cash flow, adjusted operating income (loss), adjusted net income (loss), and adjusted earnings per share. These non-GAAP measures should not be considered a substitute for, or superior to, financial measures and results calculated in accordance with GAAP, including net (loss) income, and reconciliations to GAAP financial statements should be carefully evaluated. Free cash flow is defined as net cash provided by (used in) operating activities minus capital expenditures. Management believes providing free cash flow is useful for investors to understand the Company’s performance and results of cash generation period to period with the exclusion of the item identified above. Management believes the presentation of free cash flow, when combined with the GAAP presentations of cash provided by operating activities, is beneficial to an investor’s understanding of the Company’s operating performance. A reconciliation of free cash flow to cash provided by (used in) operating activities is included in the appendix to this presentation. Adjusted operating income (loss), a non-GAAP financial measure, excludes certain costs, expenses, other charges, gains or income that are included in the determination of operating income (loss) under U.S. GAAP, but that management would not consider important in evaluating the quality of the Company’s operating results as they are not indicative of the Company’s core operating results or may obscure trends useful in evaluating the Company’s continuing activities. Accordingly, the Company presents adjusted operating income (loss) excluding these special items to help investors evaluate our operating performance and trends in our business consistent with how management evaluates such performance and trends. Further, the Company presents adjusted operating income (loss) to provide investors with a better understanding of the Company’s view of our results as compared to prior periods. A reconciliation of adjusted operating income (loss) to operating income (loss), the most comparable GAAP financial measure, is included in the appendix to this presentation. Adjusted net income and adjusted earnings per diluted share each reflect adjustments for sale of assets, non-cash impairment and debt transactions, and the related tax effects of these adjustments. Management believes providing adjusted measures and excluding certain items facilitates comparisons to the Company’s prior year periods and, when combined with the GAAP presentation of net income (loss) and diluted net income (loss) per share, is beneficial to an investor’s understanding of the Company’s performance. A reconciliation of adjusted net income and adjusted earnings per diluted share to net income (loss) and net income (loss) per diluted share is included in the appendix to this presentation.

3 3 Wabash National – Changing How the World Reaches You Key Messages ▪ Wabash National is the leader in transportation solutions with a portfolio of equipment spanning from First to Final Mile. ▪ Refreshed vision, mission & purpose pair with organizational realignment to support strategy ▪ Focus on Parts & Services to drive higher margin growth beyond the equipment cycle ▪ New level of financial performance through difficult operating environments evident in 2020 and 2021 ▪ Expect significant increase in 2022 EPS ▪ Opportunity for 2023 revenue, operating margin and EPS accretion driven by strategic capacity addition and exciting product innovations

4 4 Wabash at a Glance (NYSE: WNC) 4 Leveraging the Industry’s Broadest Portfolio Across All Phases of Transportation 1985 Lafayette, IN ~$700M1 ~5,800 16 $1.5B 1.5% $104M Founded Headquarters Market-cap Global Employees Manufacturing Locations 2020 Revenue 2020 Adjusted Operating Margin² 2020 Free Cash Flow 1 As of 07/30/2021 ² 2020 Operating Income adjusted for non-cash impairment, debt transactions, and the impact of sale and divestiture. FIRST MILE MIDDLE MILE FINAL MILE ▪ Delivery of goods to home or final destination ▪ Driven by strong growth in e-Commerce ▪ Long-haul routes of goods ▪ Driven by freight activity ▪ Products moved into or redistributed among fulfillment centers ▪ Driven by strategic positioning of goods to allow for 2-day delivery or less

5 5 Purpose To change how the world reaches you Vision To be the innovation leader of engineered solutions for the transportation, logistics and distribution industries Mission To enable our customers to succeed with breakthrough ideas and solutions that help them move everything from first to final mile Our Future Will be Built as One Wabash Refreshed Purpose, Vision, Mission Drive Alignment with Strategic Plan

6 6 2019 2020 thru 2022 Customers Employees Shareholders • Streamlined commercial structure to facilitate ease of interaction • Enhanced ability to innovate to support rapidly changing transportation needs • Strategic partner with a diverse portfolio of transportation equipment • Improved cost structure ($20M cost-out) through elimination of redundancies • Accelerating growth through greater customer intimacy increasing share of wallet • Enhanced focus on margin accretive Parts & Service initiative • Broader span of control, reducing organizational complexity • Stronger company with greater focus on innovation and exciting growth markets • Opportunities for career development across diverse transportation equipment products New Organizational Structure Benefits All Stakeholders

7 7 2019 2020 thru 2022 Cold Chain eCommerce & Logistics Disruption Parts & Services • Expand share in markets driven by movement of goods through the temperature- controlled cold chain • Bring differentiated solutions to create customer value by leveraging innovative technology offerings (Molded Structural Composite, eNow, Gruau refrigerated inserts) • Organic growth opportunities within trailer repair and truck body upfitting • Unify historically disparate parts & services revenue streams to drive alignment and growth focus • Grow within the rapidly expanding market for home delivery of goods • Augment truck body with refreshed product offerings • Leverage portfolio of lighter-weight composite technology to partner with electric chassis manufacturers Strategic Platforms to Facilitate Growth Beyond Cycle

8 8 2019 2020 thru 2022 Wabash National 2020 Performance Highlights 61 110 73 111 158 118 78 109 104 2012 2013 2014 2015 2016 2017 2018 2019 2020 Free Cash Flow ($M) Revenue has experienced cycles, but Free Cash Flow has been stable • Rapid action on cost control resulted in 2020 decremental margin of 14 percent • 2020 trough free cash flow generation consistent with peak years • Maintained dividend throughout crisis as a sign of more resilient portfolio and strong free cash flow profile

9 9 2019 2020 thru 2022 Wabash National Outlook Highlights Ramp in ‘21 to Facilitate Strong Run-Rates into ’22. ’23 to Benefit from Increased Capacity ▪ Revenue up 30%+ to $1.95 billion ▪ Adjusted Operating Margin¹ up 240bps to 3.9 percent • $20M annualized run-rate cost savings from organizational realignment in 2020 to be sustained ▪ Adjusted Diluted EPS² up 400% to $0.72 ▪ 2021 Incremental margins in the low-teens on material cost and labor ramp-up ▪ Anticipate 20 percent incremental margin from ’21 to ’22 ▪ 2023 revenue, operating margin and EPS to benefit from strategic capacity addition ¹ 2021 Operating Income adjusted for gain on the divestiture of Extract Technology. 2020 Operating Income adjusted for non-cash impairment, debt transactions, and the impact of sale and divestiture. ² 2021 Earnings Per Diluted Share adjusted for the loss on debt extinguishment and gain on the divestiture of Extract Technology and the related tax effects of these adjustments. 2020 Earnings Per Diluted Share adjusted for non-cash impairment, debt transactions, the impact of sale and divestiture, and the related tax effects of these adjustments.

10 10 Future State: Dry Vans Past State Demand Evolution • Ramping down refrigerated van capacity to retool for dry van production • Modified capacity to produce additional 10,000 dry vans annually beginning 2023 • 20% capacity increase for WNC, only 5% for industry total • $20M of capex investment in 2021 to create highly efficient capacity; workforce already installed Future State: Reefer Vans • Transitioning conventional refrigerated van product to Molded Structural Composite technology • MSC features improved thermal efficiency, lighter-weight design • Will follow-up with announcement of enhanced MSC refrigerated van capacity in coming quarters • Demand frequently exceeded physical capacity • Overtime and weekend work required from workforce • Unable to fully satisfy customer requirements • Long-term trend of trailer demand growth as carriers use assets to maximize driver time • Strengthened indirect channel • Organizational restructuring to One Wabash commercial organization Strategic Capacity Addition Capacity Actions Create Opportunity for Meaningful 2023 EPS Growth

11 11 2020 thru 2022 Extending our Materials-based Competitive Advantage Our Innovative Products Provide Customers with Operating Efficiency and Reduced Environmental Impact ▪ Molded Structural Composite (MSC) Refrigerated Van • Transformative design features lighter-weight and improved thermal efficiency • New refrigerated assembly capacity will prioritize MSC ▪ DuraPlate Dry Van • DuraPlate Cell Core is the lightest dry van in the industry • R&D focus on removing additional weight while maintaining structural integrity MSC Refrigerated Trailer DuraPlate Cell Core Dry Van

12 12 Appendix

13 13 Reconciliation of Adjusted Segment Operating Income (Loss)1 Unaudited - dollars in thousands Twelve Months Ended December 31, 2020 2019 Commercial Trailer Products Income from operations $ 79,662 $ 145,877 Adjustments: Impairment 377 — Gain on sale of Columbus branch (2,257) — Adjusted operating income 77,782 145,877 Diversified Products Income from operations 1,563 29,748 Adjustments: Impairment 10,971 — Loss on divestiture of Beall brand 2,119 — Adjusted operating income 14,653 29,748 Final Mile Products Income (loss) from operations (123,585) 9,804 Adjustments: Impairment 95,766 — Adjusted operating (loss) income (27,819) 9,804 Corporate Loss from operations (43,248) (42,643) Adjustments: Debt transactions 1,156 — Adjusted operating loss (42,092) (42,643) Consolidated Income (loss) from operations (85,608) 142,786 Adjustments: Impairment 107,114 — Debt transactions 1,156 — Gain on sale of Columbus branch (2,257) — Loss on divestiture of Beall brand 2,119 — Adjusted operating income $ 22,524 $ 142,786 1 Adjusted operating income (loss), a non-GAAP financial measure, excludes certain costs, expenses, other charges, gains or income that are included in the determination of operating income (loss) under U.S. GAAP, but that management would not consider important in evaluating the quality of the Company’s operating results as they are not indicative of the Company’s core operating results or may obscure trends useful in evaluating the Company’s continuing activities. Accordingly, the Company presents adjusted operating income (loss) excluding these special items to help investors evaluate our operating performance and trends in our business consistent with how management evaluates such performance and trends. Further, the Company presents adjusted operating income (loss) to provide investors with a better understanding of the Company’s view of our results as compared to prior periods.

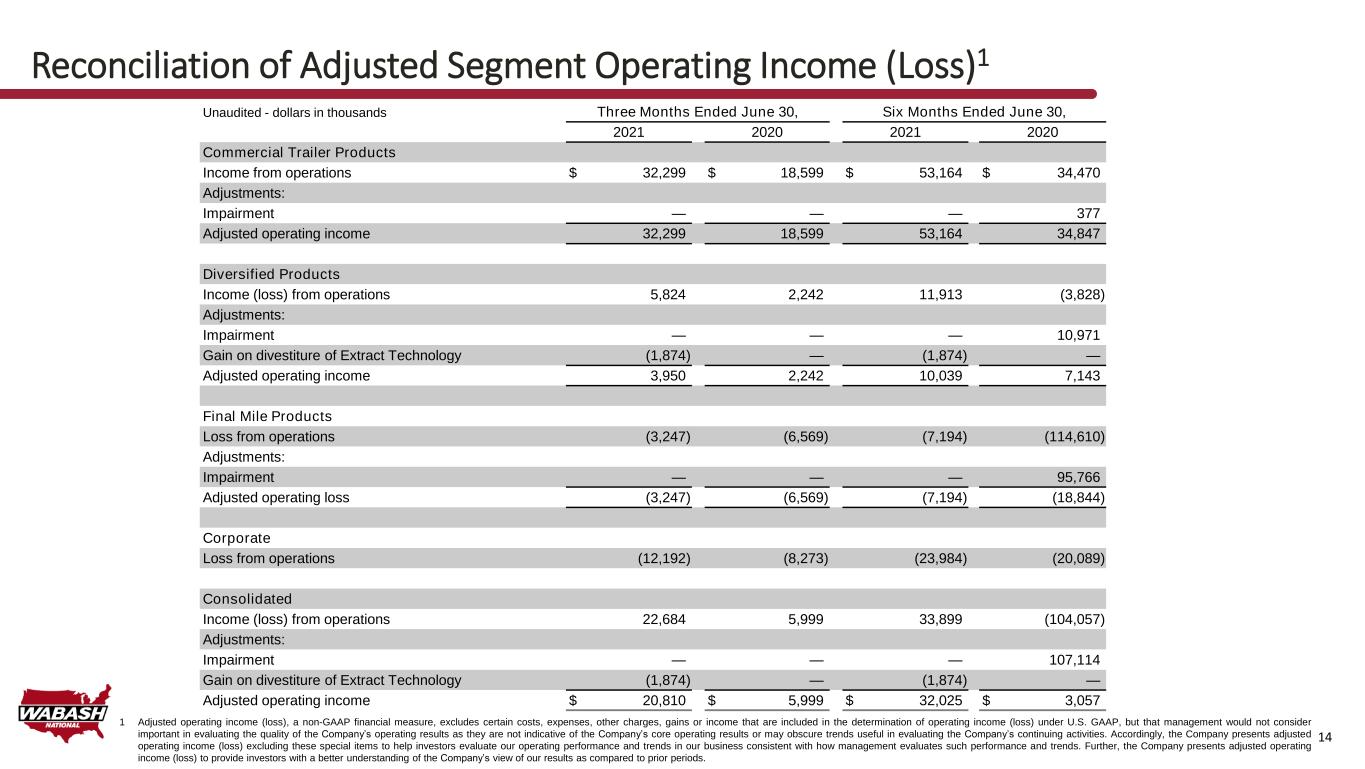
14 14 Reconciliation of Adjusted Segment Operating Income (Loss)1 Unaudited - dollars in thousands Three Months Ended June 30, Six Months Ended June 30, 2021 2020 2021 2020 Commercial Trailer Products Income from operations $ 32,299 $ 18,599 $ 53,164 $ 34,470 Adjustments: Impairment — — — 377 Adjusted operating income 32,299 18,599 53,164 34,847 Diversified Products Income (loss) from operations 5,824 2,242 11,913 (3,828) Adjustments: Impairment — — — 10,971 Gain on divestiture of Extract Technology (1,874) — (1,874) — Adjusted operating income 3,950 2,242 10,039 7,143 Final Mile Products Loss from operations (3,247) (6,569) (7,194) (114,610) Adjustments: Impairment — — — 95,766 Adjusted operating loss (3,247) (6,569) (7,194) (18,844) Corporate Loss from operations (12,192) (8,273) (23,984) (20,089) Consolidated Income (loss) from operations 22,684 5,999 33,899 (104,057) Adjustments: Impairment — — — 107,114 Gain on divestiture of Extract Technology (1,874) — (1,874) — Adjusted operating income $ 20,810 $ 5,999 $ 32,025 $ 3,057 1 Adjusted operating income (loss), a non-GAAP financial measure, excludes certain costs, expenses, other charges, gains or income that are included in the determination of operating income (loss) under U.S. GAAP, but that management would not consider important in evaluating the quality of the Company’s operating results as they are not indicative of the Company’s core operating results or may obscure trends useful in evaluating the Company’s continuing activities. Accordingly, the Company presents adjusted operating income (loss) excluding these special items to help investors evaluate our operating performance and trends in our business consistent with how management evaluates such performance and trends. Further, the Company presents adjusted operating income (loss) to provide investors with a better understanding of the Company’s view of our results as compared to prior periods.

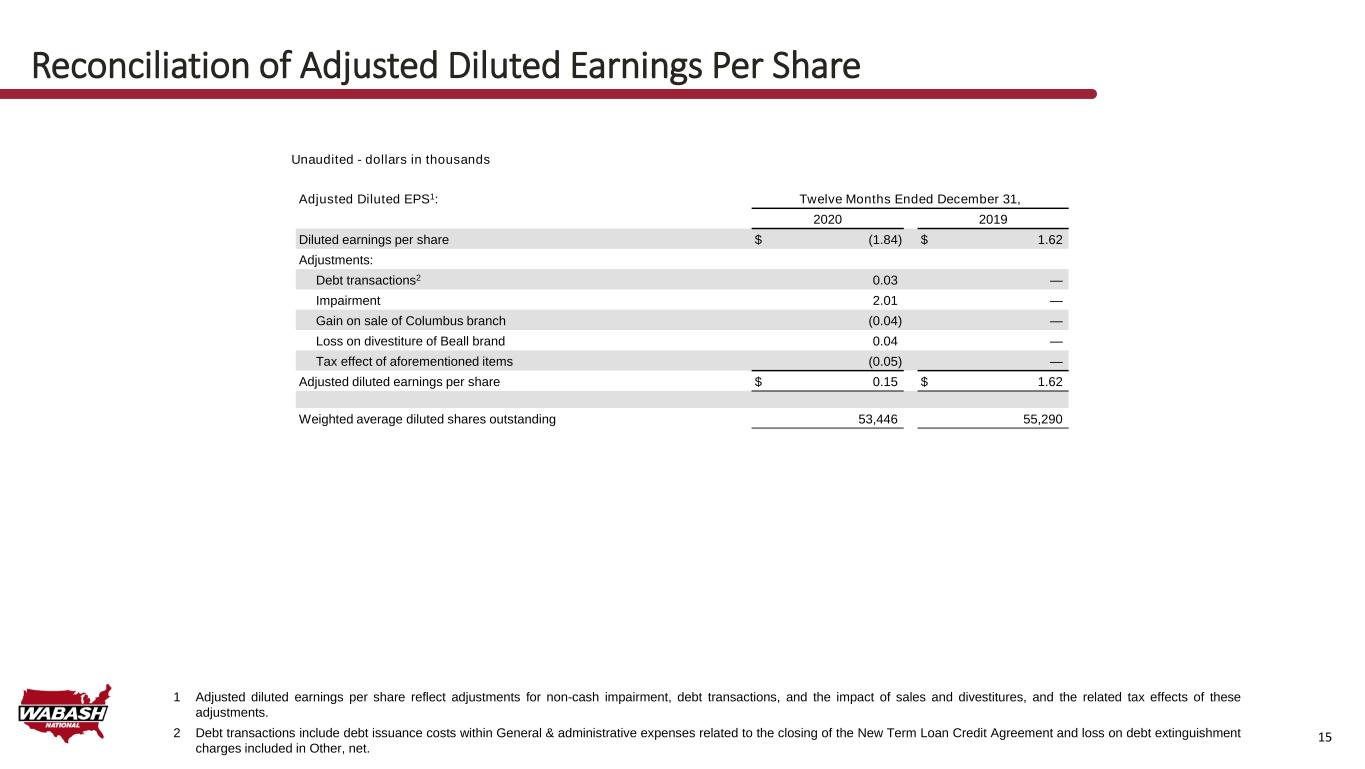
15 15 Reconciliation of Adjusted Diluted Earnings Per Share Adjusted Diluted EPS1: Twelve Months Ended December 31, 2020 2019 Diluted earnings per share $ (1.84) $ 1.62 Adjustments: Debt transactions2 0.03 — Impairment 2.01 — Gain on sale of Columbus branch (0.04) — Loss on divestiture of Beall brand 0.04 — Tax effect of aforementioned items (0.05) — Adjusted diluted earnings per share $ 0.15 $ 1.62 Weighted average diluted shares outstanding 53,446 55,290 Unaudited - dollars in thousands 1 Adjusted diluted earnings per share reflect adjustments for non-cash impairment, debt transactions, and the impact of sales and divestitures, and the related tax effects of these adjustments. 2 Debt transactions include debt issuance costs within General & administrative expenses related to the closing of the New Term Loan Credit Agreement and loss on debt extinguishment charges included in Other, net.

16 16 Unaudited - dollars in thousands Adjusted Net Income (Loss)1: Three Months Ended June 30, Six Months Ended June 30, 2021 2020 2021 2020 Net income (loss) $ 12,252 $ (146) $ 15,469 $ (106,793) Adjustments: Loss on debt extinguishment 452 — 452 — Impairment — — — 107,114 Gain on divestiture of Extract Technology (1,874) — (1,874) — Tax effect of aforementioned items 327 — 327 (2,786) Adjusted net income (loss) $ 11,157 $ (146) $ 14,374 $ (2,465) Adjusted Diluted (2021) and Basic (2020) Earnings Per Share1: Three Months Ended June 30, Six Months Ended June 30, 2021 2020 2021 2020 Diluted (2021) and basic (2020) earnings per share $ 0.24 $ 0.00 $ 0.29 $ (2.01) Adjustments: Loss on debt extinguishment 0.01 — 0.01 — Impairment — — — 2.01 Gain on divestiture of Extract Technology (0.04) — (0.04) — Tax effect of aforementioned items — — 0.01 (0.05) Adjusted diluted (2021) and basic (2020) earnings per share $ 0.21 $ 0.00 $ 0.27 $ (0.05) Weighted average diluted (2021) and basic (2020) shares outstanding (in thousands) 51,989 52,874 52,472 53,015 1 Adjusted net income (loss) and adjusted earnings per diluted (2021) and basic (2020) share reflect adjustments for the impact of sales and divestitures, debt transactions, and non-cash impairment, and the related tax effects of these adjustments. Management believes providing adjusted measures and excluding certain items facilitates comparisons to the Company’s prior year periods and, when combined with the GAAP presentation of net income (loss) and diluted (2021) and basic (2020) net income (loss) per share, is beneficial to an investor’s understanding of the Company’s performance. Reconciliation of Adjusted Diluted Earnings Per Share

17 17 Other Non-GAAP Reconciliations Unaudited - dollars in millions ¹ Totals for Adjusted Net Income and Free Cash Flow may not foot due to rounding of individual items to nearest million. Adjusted Net Income (1): 2012 2013 2014 2015 2016 2017 2018 2019 2020 Net income (loss) 106$ 47$ 61$ 104$ 119$ 111$ 69$ 90$ (97)$ Adjustments: Facility transactions - - - (8) - (7) (10) - (2) Acquisition expenses and related charges 14 - - - - 15 1 - - Impact of acquired profit in inventories and short term intangible amortizatoin 4 - - - - - - - - Debt transactions - 1 1 6 2 1 - - 1 Impairment - - - 1 2 - 25 - 107 Loss on divestiture of Beall brand - - - - - - - 2 Tax effect of aforementioned items - - - - (1) (3) (4) - (3) Other discrete tax adjustments (59) - 1 - - (31) 3 - - Adjusted net income $ 65 $ 48 $ 63 $ 103 $ 122 $ 86 $ 84 $ 90 8$ Free Cash Flow (1): 2012 2013 2014 2015 2016 2017 2018 2019 2020 Net cash provided by (used in) operating activities 76$ 129$ 93$ 132$ 179$ 144$ 112$ 146$ 124$ Capital expenditures (15) (18) (20) (21) (20) (26) (34) (38) (20) Free cash flow 61$ 110$ 73$ 111$ 158$ 118$ 78$ 109$ 104$
