Attached files
| file | filename |
|---|---|
| EX-99.1 - EXHIBIT 99.1 - PHOTRONICS INC | brhc10028318_ex99-1.htm |
| EX-99.4 - EXHIBIT 99.4 - PHOTRONICS INC | brhc10028318_ex99-4.htm |
| EX-99.3 - EXHIBIT 99.3 - PHOTRONICS INC | brhc10028318_ex99-3.htm |
| EX-99.2 - EXHIBIT 99.2 - PHOTRONICS INC | brhc10028318_ex99-2.htm |
| 8-K - 8-K - PHOTRONICS INC | brhc10028318_8k.htm |
Exhibit 99.5

Q3 2021 Financial Results Conference CallAugust 25, 2021 Photronics, Inc.
Safe Harbor Statement This presentation and some of our comments may contain projections or other
forward-looking statements regarding future events, our future financial performance and/or the future performance of the industry. These statements are predictions, and contain risks and uncertainties. Actual events or results may differ
materially from those presented. These statements include words like “anticipate”, “believe”, “estimate”, “expect”, “forecast”, “may”, “plan”, “project”, “in our view” or the negative thereto. We cannot guarantee the accuracy of any forecasts
or estimates, and we are not obligated to update any forward-looking statements if our expectations change. If you would like more information on the risks involved in forward-looking statements, please see the documents we file from time to
time with the Securities and Exchange Commission. 8/25/2021 2

Q3 2021 Summary Revenue was a record $170.6M, up 7% Q/Q and 8% Y/YIC and FPD both achieved record
revenueRecord revenue to China, up 9% Q/Q and 22% Y/YNet income attributable to Photronics, Inc. shareholders of $17.1M ($0.28/share)Cash balance $283M$55M generated from operating activity$19M invested in capex$13M returned to investors
through share repurchasesFPD capacity expansion finished ahead of planInvesting to expand mainstream IC capacity 8/25/2021 3 Strategic investments driving long-term, profitable growth

Income Statement Summary $M (except EPS) Q321 Q221 Q/Q Q320 Y/Y Revenue $ 170.6 $ 159.8 7% $
157.9 8% Gross Profit $ 45.3 $ 39.2 15% $ 37.7 20% Gross Margin 26.6% 24.6% 200 bps 23.9% 270 bps Operating Income $ 28.5 $ 20.8 37% $ 19.9 43% Operating Margin 16.7% 13.0% 370 bps 12.6% 410 bps Other non-operating
income (expense) $ 3.7 ($ 0.8) $ 4.5 ($ 2.1) $ 5.9 Income tax provision $ 7.8 $ 3.7 $ 4.1 $ 4.9 $ 2.9 Minority interest $ 7.3 $ 5.8 $ 1.5 $ 2.1 $ 5.2 Net Income* $ 17.1 $ 10.5 62% $ 10.8 58% Diluted EPS* $ 0.28 $
0.17 $ 0.11 $ 0.17 $ 0.11 Days in quarter 91 91 - 91 - Margins improved on higher revenue and better mainstream IC ASPOperating income includes $3.5M gain on sale of fixed asset ($0.06 per share)Other non-operating income (expense)
primarily due to FX gain (loss); Q221 includes China interest expense subsidyMinority interest from IC JVs in Taiwan and China 8/25/2021 4 *Net income attributable to Photronics, Inc. shareholders
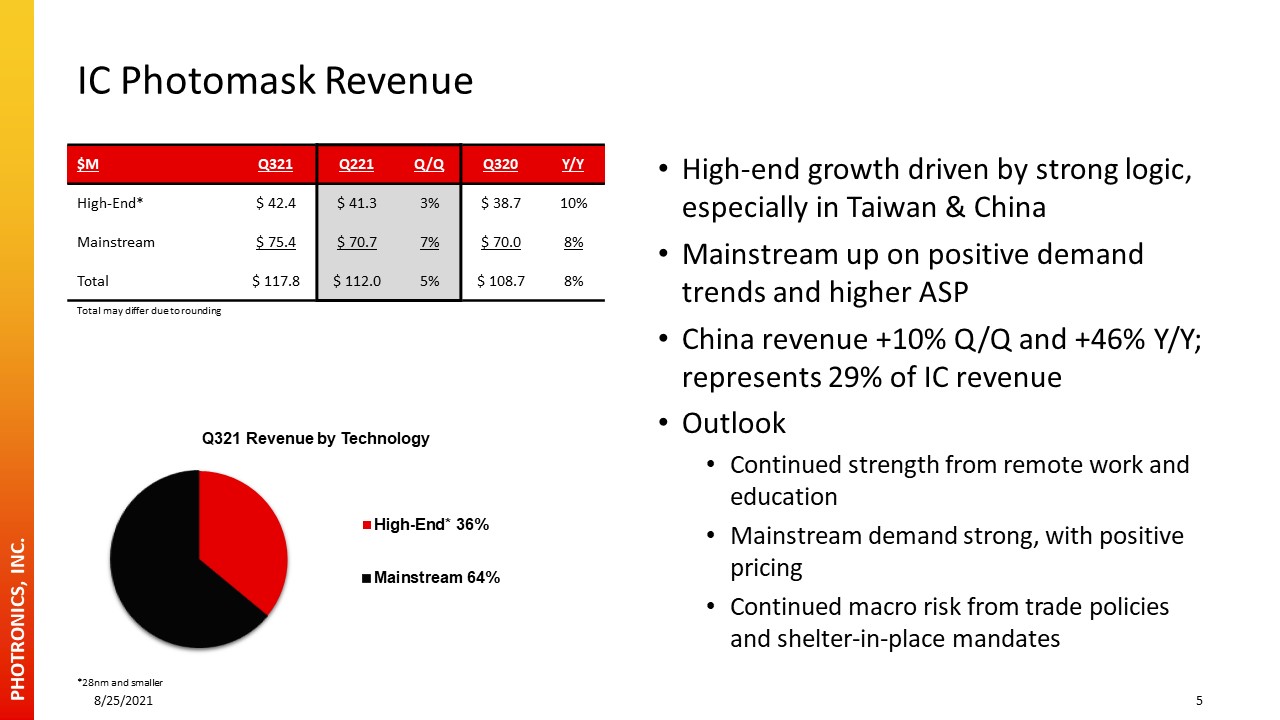
$M Q321 Q221 Q/Q Q320 Y/Y High-End* $ 42.4 $ 41.3 3% $ 38.7 10% Mainstream $ 75.4 $
70.7 7% $ 70.0 8% Total $ 117.8 $ 112.0 5% $ 108.7 8% IC Photomask Revenue 8/25/2021 5 High-end growth driven by strong logic, especially in Taiwan & ChinaMainstream up on positive demand trends and higher ASPChina revenue
+10% Q/Q and +46% Y/Y; represents 29% of IC revenueOutlookContinued strength from remote work and educationMainstream demand strong, with positive pricingContinued macro risk from trade policies and shelter-in-place mandates *28nm and
smaller Total may differ due to rounding

FPD Photomask Revenue 8/25/2021 6 High-end improved on AMOLED mobile demand; G10.5+ up Q/QMainstream
recovered Q/QChina revenue +9% Q/Q and +2% Y/Y; represents 53% of FPD revenueOutlookDynamic market environmentMobile demand strength expected to continueFurther benefit from new capacityTechnology development drives demand for higher-value
masks *≥G10.5, AMOLED and LTPS $M Q321 Q221 Q/Q Q320 Y/Y High-End* $ 40.6 $ 39.4 3% $ 36.7 11% Mainstream $ 12.2 $ 8.4 46% $ 12.6 (3%) Total $ 52.9 $ 47.8 11% $ 49.2 7% Total may differ due to rounding
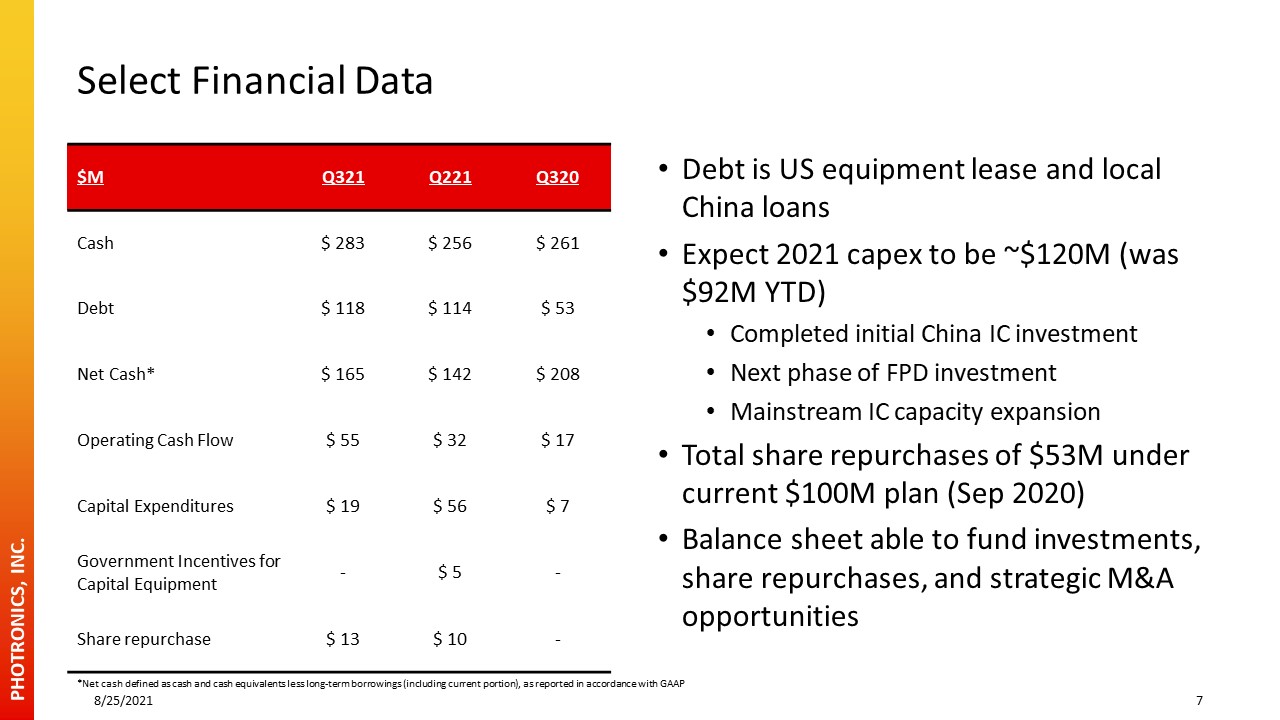
Select Financial Data $M Q321 Q221 Q320 Cash $ 283 $ 256 $ 261 Debt $ 118 $ 114 $ 53 Net
Cash* $ 165 $ 142 $ 208 Operating Cash Flow $ 55 $ 32 $ 17 Capital Expenditures $ 19 $ 56 $ 7 Government Incentives for Capital Equipment - $ 5 - Share repurchase $ 13 $ 10 - Debt is US equipment lease and local China
loansExpect 2021 capex to be ~$120M (was $92M YTD)Completed initial China IC investmentNext phase of FPD investmentMainstream IC capacity expansionTotal share repurchases of $53M under current $100M plan (Sep 2020)Balance sheet able to fund
investments, share repurchases, and strategic M&A opportunities 8/25/2021 7 *Net cash defined as cash and cash equivalents less long-term borrowings (including current portion), as reported in accordance with GAAP
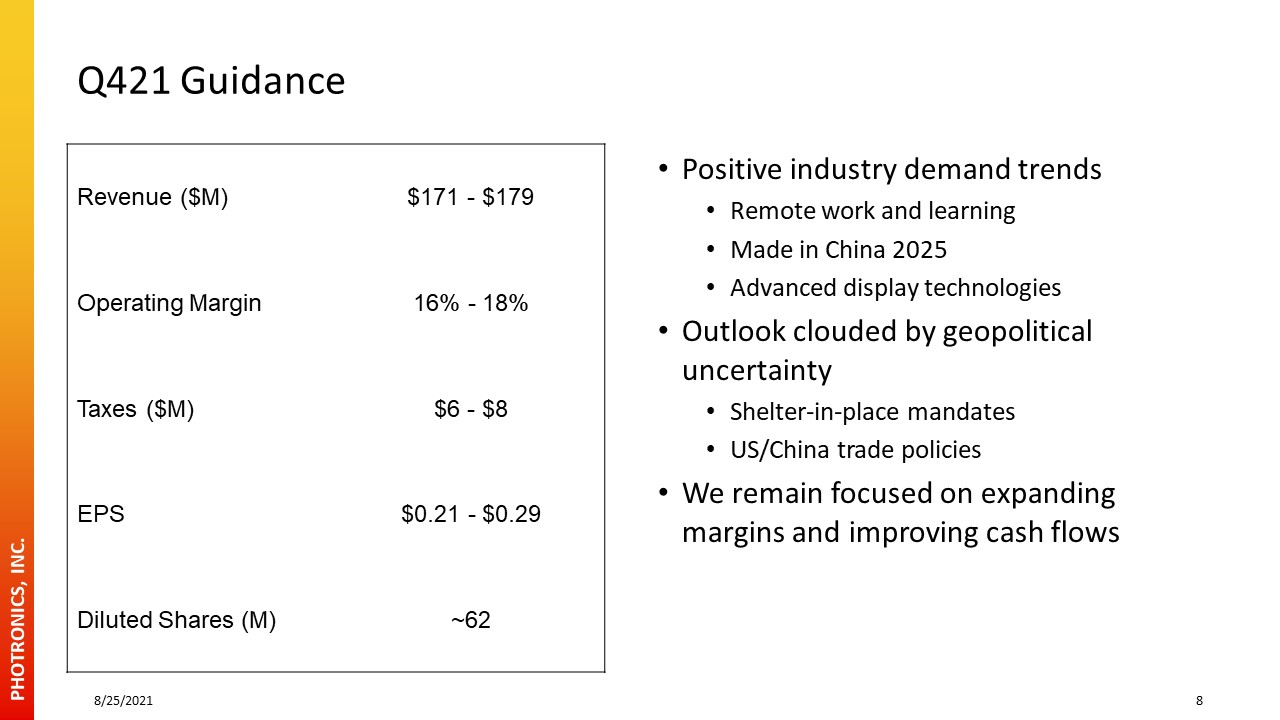
Q421 Guidance Revenue ($M) $171 - $179 Operating Margin 16% - 18% Taxes ($M) $6 - $8 EPS $0.21
- $0.29 Diluted Shares (M) ~62 Positive industry demand trendsRemote work and learningMade in China 2025Advanced display technologiesOutlook clouded by geopolitical uncertaintyShelter-in-place mandatesUS/China trade policiesWe remain
focused on expanding margins and improving cash flows 8/25/2021 8

For Additional Information:R. Troy Dewar, CFAVice President, Investor
Relations203.740.5610tdewar@photronics.com Thank you for your interest!

Appendix

Total Revenue 8/25/2021 11 IC FPD Total may differ due to rounding

IC Photomask Revenue 8/25/2021 12 Mainstream High-End High-End: 28nm and smaller; total may
differ due to rounding
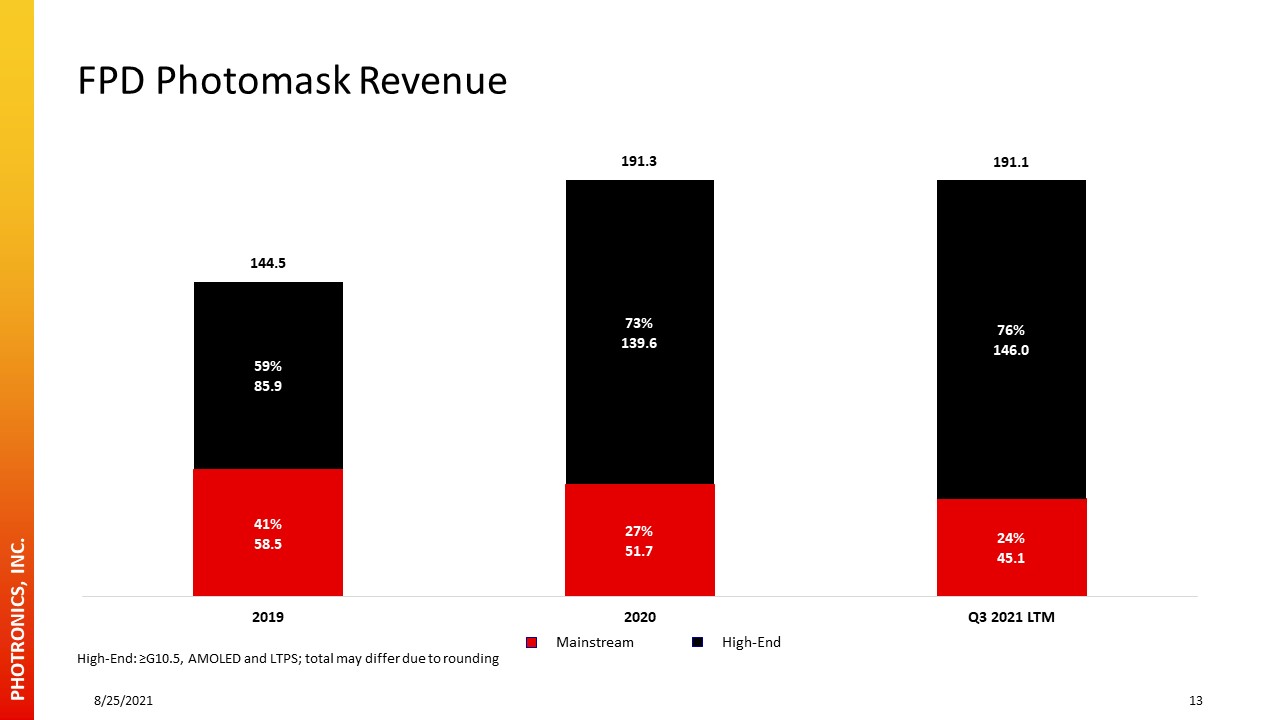
FPD Photomask Revenue 8/25/2021 13 Mainstream High-End High-End: ≥G10.5, AMOLED and LTPS;
total may differ due to rounding