Attached files
| file | filename |
|---|---|
| 8-K - FORM 8-K - CRAWFORD & CO | tm2125503d1_8k.htm |
Exhibit 99.1

CRD - A & CRD - B (NYSE) Investor Presentation August 2021
2 Forward - Looking Statements and Additional Information Forward - Looking Statements This presentation contains forward - looking statements, including statements about the expected future financial condition, resul ts of operations and earnings outlook of Crawford & Company. Statements, both qualitative and quantitative, that are not statements of historical fact may be "forward - looking statements" as defined in the Private Securitie s Litigation Reform Act of 1995 and other securities laws. Forward - looking statements involve a number of risks and uncertainties that could cause actual results to differ materially from historical experience or Crawford & Company's pre sen t expectations. Accordingly, no one should place undue reliance on forward - looking statements, which speak only as of the date on which they are made. Crawford & Company does not undertake to update forward - looking statements to reflec t the impact of circumstances or events that may arise or not arise after the date the forward - looking statements are made. Results for any interim period presented herein are not necessarily indicative of results to be expected fo r the full year or for any other future period. For further information regarding Crawford & Company, and the risks and uncertainties involved in forward - looking statements, please read Crawford & Company's reports filed with the Securiti es and Exchange Commission and available at www.sec.gov or in the Investor Relations portion of Crawford & Company's website at https://ir.crawco.com. The volume of claim referrals to us is a key driver of our revenues. We cannot predict the future trend of case volumes for a nu mber of reasons, including the frequency and severity of weather - related cases and the occurrence of natural and man - made disasters, which are a significant source of cases for us and are not subject to accurate forecasting, as well as t he economic impact that COVID - 19 may have on global case volumes and the duration of any such impact Revenues Before Reimbursements ("Revenues") Revenues Before Reimbursements are referred to as "Revenues" in both consolidated and segment charts, bullets and tables thro ugh out this presentation. Segment and Consolidated Operating Earnings Under the Financial Accounting Standards Board's Accounting Standards Codification ("ASC") Topic 280, "Segment Reporting," th e C ompany has defined segment operating earnings as the primary measure used by the Company to evaluate the results of each of its three operating segments. Segment operating earnings represent segment earnings, includin g t he direct and indirect costs of certain administrative functions required to operate our business, but excludes unallocated corporate and shared costs and credits, net corporate interest expense, stock option expense, amortizati on of customer - relationship intangible assets, loss on disposition of business, income taxes and net income or loss attributable to noncontrolling interests and redeemable noncontrolling interests. Earnings Per Share The Company's two classes of stock are substantially identical, except with respect to voting rights and the Company's abilit y t o pay greater cash dividends on the non - voting Class A Common Stock than on the voting Class B Common Stock, subject to certain limitations. In addition, with respect to mergers or similar transactions, holders of Class A Commo n S tock must receive the same type and amount of consideration as holders of Class B Common Stock, unless different consideration is approved by the holders of 75% of the Class A Common Stock, voting as a class. In certain periods, the Company has paid a higher dividend on CRD - A than on CRD - B. This may result in a different earnings per s hare ("EPS") for each class of stock due to the two - class method of computing EPS as required by ASC Topic 260 - "Earnings Per Share". The two - class method is an earnings allocation method under which EPS is calculated for each class o f common stock considering both dividends declared and participation rights in undistributed earnings as if all such earnings had been distributed during the period. Segment Gross Profit Segment gross profit is defined as revenues, less direct costs, which exclude indirect centralized administrative support cos ts allocated to the business. Indirect expenses consist of centralized administrative support costs, regional and local shared services that are allocated to each segment based on usage. Non - GAAP Financial Information For additional information about certain non - GAAP financial information presented herein, see the Appendix following this presen tation.
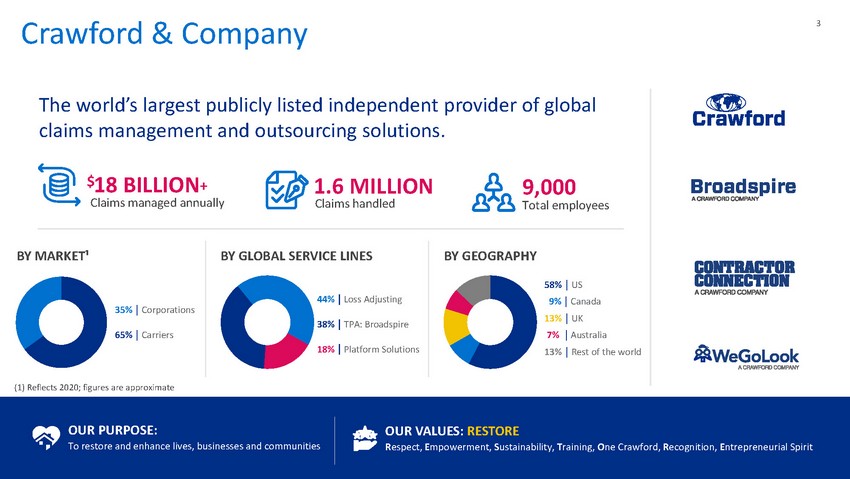
3 $ 18 BILLION + Claims managed annually 1.6 MILLION Claims handled 3 The world’s largest publicly listed independent provider of global claims management and outsourcing solutions. BY GLOBAL SERVICE LINES BY GEOGRAPHY 44% ⎹ Loss Adjusting 38% ⎹ TPA: Broadspire 18% ⎹ Platform Solutions 58% ⎹ US 9% ⎹ Canada 13% ⎹ UK 7% ⎹ Australia 13% ⎹ Rest of the world OUR PURPOSE: To restore and enhance lives, businesses and communities OUR VALUES: RESTORE R espect, E mpowerment, S ustainability, T raining, O ne Crawford, R ecognition, E ntrepreneurial Spirit 9,000 Total employees BY MARKET ¹ (1) Reflects 2020; figures are approximate 35% ⎹ Corporations 65% ⎹ Carriers Crawford & Company

4 (1) As of 7/30/2021 ( 2 ) See appendix for non - GAAP explanation and reconciliation of non - GAAP measures OVERVIEW Q2 2021 GAAP Q2 2021 NON - GAAP 2 ~$ 500 MILLION Market capitalization¹ Financial Snapshot $ 80 MILLION Net debt $ 20 MILLION Operating earnings $ 268 MILLION Revenues before reimbursements $ 12 MILLION Net income $ 29 MILLION Adjusted EBITDA CRD - A & CRD - B NYSE ticker $ 0.06 Per share quarterly dividends for CRD - A & CRD - B $ 0.25 $ 0.26 EPS CRD - A EPS CRD - B

5 5 BY GLOBAL SERVICE LINES 44% ⎹ Loss Adjusting 38% ⎹ TPA: Broadspire 18% ⎹ Platform Solutions The Crawford brands offer high - quality and technologically advanced solutions to clients : Market Leading Solutions LOSS ADJUSTING TPA: BROADSPIRE PLATFORM SOLUTIONS • Loss Adjusting (Property / Auto / Liability) • Vehicle & Heavy Equipment Inspections • Casualty Large & Complex • Property Large & Complex • Specialty Loss Adjusting • Managed Repair • Catastrophe Response • Temporary Staffing • On - Demand Services • SaaS Platform • Workers Compensation • Disability & Leave Management • Auto / Motor • General Liability • Accident & Health • Affinity / Warranty • Legal Services / Recoveries We bring together thoughtful experts from around the world to offer comprehensive, intelligent solutions to our customers.

6 Strategic Pillars Our Purpose Restoring and enhancing lives, businesses and communities. Our Values Our purpose is embedded in our values – to RESTORE is part of everything we do. espect mpowerment ustainability raining ne Crawford ecognition ntrepreneurial Spirit
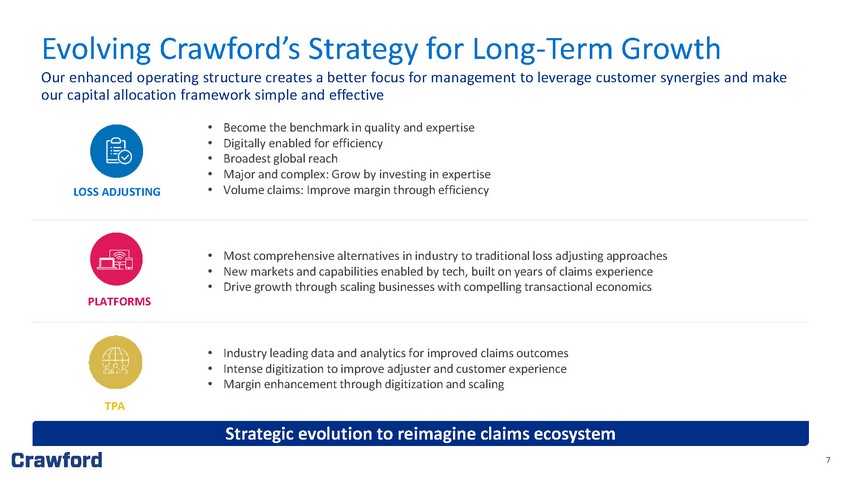
7 Evolving Crawford’s Strategy for Long - Term Growth • Become the benchmark in quality and expertise • Digitally enabled for efficiency • Broadest global reach • Major and complex: Grow by investing in expertise • Volume claims: Improve margin through efficiency • Most comprehensive alternatives in industry to traditional loss adjusting approaches • New markets and capabilities enabled by tech, built on years of claims experience • Drive growth through scaling businesses with compelling transactional economics • Industry leading data and analytics for improved claims outcomes • Intense digitization to improve adjuster and customer experience • Margin enhancement through digitization and scaling Strategic evolution to reimagine claims ecosystem LOSS ADJUSTING TPA PLATFORMS Our enhanced operating structure creates a better focus for management to leverage customer synergies and make our capital allocation framework simple and effective

8 8 Attractive investment profile Strategically positioned in a rapidly changing industry Investing to drive innovation and accelerate growth Committed to environmental, social and governance initiatives Financial strength and flexibility Experienced leadership team Why Invest in Crawford? Crawford’s leading market position in an evolving landscape provides a compelling investment narrative

9 9 Industry is looking to leverage technology and seek new cost - efficient solutions to improve profitability Increasing claims severity and complexity Carriers move to improve margins by cutting fixed costs and outsourcing the claims process Consolidation of TPA and independent claims management providers Technological advancements provide new opportunities to offer a differentiated value proposition to customers COVID - 19 has caused a global decline in claims frequency primarily in auto and workers compensation, while weather activity should contribute to an increase in claims volume P&C industry embracing virtual desk adjusting and network solutions that are technology enabled that help reduce allocated loss adjustment expense Strategically Positioned in a Rapidly Changing Industry Crawford improves the claims journey via workflow automation, enhanced data and analytics, reduced cycle times and superior q ual ity

10 10 Solutions Addressing Customer and Industry Challenges Focus on Speed & Simplicity Strengthen Knowledge Disruptive Technology Innovative Solutions Continuous Quality Claims processing is evolving with customer expectations for on - demand, simplified products and services Data analytics are changing how insurers understand and determine risk with increased visibility Insurtech will fast track claims to facilitate virtual claims handling and elevate date analytics capture On - demand Inspections, managed repair networks and IoT will streamline the claims cycle and cut insurer costs The insurance industry is in the midst of digital transformation and automation in claim processing and quality assurance are at the forefront of initiatives

11 11 More Frequent and Destructive CAT Events Leading to Heightened Insured Losses (1) SwissRe Industry seeks cost effective solutions to address volatility and surge events that exceed their capacity with reduced claims staff. Virtual desk integrated with technology enabled networks will be solution. Catastrophe - related insured losses (1970 - 2020) 1

12 12 2 % 63 % 6% 22% 92% 15% # of Carriers Total Premium Medium: $1B - $5B Small: Less than $1B Large: Greater than $5B 1. ~98% of carriers are small to medium sized¹ 2. They have limited financial capacity¹ • Insurance carriers currently operate with a large operating expense base, which is unsustainable long term • Technology would play a key role in reducing this expense base 65% 15% 17% Losses 1 Commission Premium Taxes Other Expenses Investment in technology Distribution Corporate Functions Underwriting Underwriting Margin Carriers with less than $1B have limited capacity and scale to invest in innovation 10% 7% • Lack of geographic spread means more dependence on outsourced capabilities • Inabilities to drive technology innovation • Severe talent and expertise gap Targeting National and Regional Players (1) Based on 2017: Industry Loss Reserves reported in AM Best 3%

13 Inclusion and Diversity Established Employee Resource Groups and an Employee Advisory Council aligned with our purpose to foster a safe and inclusive working environment Human Capital Development Promote an environment where employees are empowered to grow, emboldened to act, and inspired to innovate through internal programs and initiatives Environment Ensure processes are efficient and sustainable, and incorporate sustainability criteria into purchasing policies Community Involvement Give back to the communities we serve and responsibly steward our resources through donations to causes aligned with our purpose Corporate Governance Committed to good corporate governance and maintaining the trust of our investors and other stakeholders, including our employees, clients and vendors We are continuing to look for opportunities across our enterprise to become more socially responsible and are increasingly integrating ESG best practices into our operations Environmental, Social and Governance Data Privacy & Security Human Capital Management & Diversity Professional Integrity & Corporate Governance Environmental Stewardship

14 14 14 Reimagining the Claims Process Crawford Platform Solutions

15 15 Digital Claim Intake and Smart Triage process serve as enablers to fast track claim assignment. Virtual Adjuster leverages Digital Desk to segment and channel to best qualified, cost - efficient network resource to provide inspection. Technology enabled network resources include self service, on demand inspectors, contractors, and adjusters performing inspection. Virtual desk adjuster completes estimate using automated QA process ( Asservio ) and issues claim payment with option to offer fulfillment with contractor or contents replacement. Reimagined Claims Process Crawford Platform Solutions is using digital tools to improve efficiency, accuracy and quality of claims process The Claims Process Evolution Policyholder reports claim. Carrier uses manual process to segment and channel claim. Field Adjuster assigned and completes on site inspection. Estimate created by adjuster and goes thru QA process Claim payment made based on adjuster estimate. Subject to post loss QA re - inspection leakage. Insured procures own contractor. Potential claim supplement if contractor does not agree. Traditional Claims Process Key Benefit Digital Desk serves as Digitized Supply Chain management tool driving savings and efficiency Smart triage reduces allocated adjustment expense Leverage cost saving, non - traditional method of inspection Provides indemnity management and estimate accuracy positively impacting loss ratio 1 2 3 4

16 16 Reimagining the Claims Process Contractor Network 2% Fast Track Desk 18% Traditional 80% Network Low Touch Traditional Past (2000) Traditional: 80% Network/Fast Track Desk: 20% • Loss Adjusting • Managed Repair Contractor Network 20% Virtual/On Demand 10% Traditional 70% Network Low Touch Traditional Present (2020) Traditional: 70% Network/Virtual Desk: 30% Contractor Network 40% Virtual/On Demand 40% Traditional 20% Network Low Touch Traditional Future (2030) Traditional: 20% Network/Virtual Desk: 80% • Loss Adjusting • Managed Repair • WeGoLook • Crawford Inspection Services • Self Service • Building Consultancy • Forensic Accounting • Loss Adjusting • Managed Repair • WeGoLook • Crawford Inspection Services • Self Service • Building Consultancy • Engineering • Forensic Accountants • Specialty Networks • Professional Networks Source: Crawford Internal Estimates

17 Crawford Platform Solutions For clients looking for speed, cost savings, customer satisfaction and quality through end - to - end digitized solutions, Crawford Platform Solutions is reimagining claims management by uniquely architecting networks, technology and Insurtech innovations. *First Notice of Loss Managed Repair Adjuster Referral Emergency Services Affinity Direct to Consumer Catastrophe Response Drone Inspections Desk Operations Roof Inspections & Ladder Assist On - Demand Services Digital FNOL* Technology Innovations Notary Service & Document Retrieval Temporary Staffing Clients Scope & Scale Value Proposition • Carriers • Corporates • Risk Managers and Brokers • 6,000 General/Specialty Contractors • $3B total managed repair project costs • 45,000 on demand resources • 7,000+ licensed and trained catastrophe resources • 175,000+ claim calls handled • Enhancing the customer experience and optimizing claim expense through digitally enabled solutions providing end to end claims processing that set industry benchmarks for quality and expertise

18 From FNOL to finished repair, our commitment is to provide digitized claim platforms that reimagine and simplify the claims process resulting in elevated customer experience outcomes * In development including white label capabilities Digital X iOT RPA Escape of Water Alexa Asservio Renovo Job Track Crawford Platform Solutions Digital FNOL Digital Assist Digital Desk* Asservio • Digital claim intake process • Increased scale & efficiency in claim capture • Omni - Channel approach: Web, SMS, Alexa, iOT sensors • Assisted self - service (YouGoLook)* • On - demand field inspection services (ladder assist / interior) • Managed Repair • Traditional Loss Adjusting Services • Building Consultancy/Forensic Accounting Expertise • End to end digital desk claims management • Smart triage claim segmentation • Empower claim segmentation and channeling • Crawford internal Digital Desk solution • Client Virtual Desk option – SaaS model* • Digital automated estimate review • Integrated with leading estimating platform • Embedded in Crawford Loss Adjusting and Contractor Managed Repair • Available for carrier licensing • Enables touchless claims processing • SaaS offering

19 Driving Loss Ratio Improvement Platforms Driving Loss Ratio Improvement J.D. Power 2020 Certified Customer Service Program recognition is based on successful completion of an evaluation and exceedi ng a customer satisfaction benchmark through a survey of recent servicing interactions. For more information, visit www.jdpower.com/ccc . • Virtual Desk claims processing integrated with Network Solutions powered by Digital Platforms drives: o Faster service o Reduced claim expense o Indemnity management Reduce Claim Costs thru Reimagination • Technologically advanced service delivery reduces average claim life, drives estimate accuracy, and provides data insights with AI/RPA capabilities to improve efficiency Leverage Data for Insights • Operating model focused on performance metrics that drive customer satisfaction and policyholder retention. JD Power certified Customer Contact Center 5 years in a row. Enhance Customer Loyalty 7.5% Average Indemnity Savings $ 300 Average Per Claim Savings NPS Managed Repair 87

20 Summary Speed – Quality – Accuracy – Exceptional Customer Experiences The largest managed repair network in the U.S., driving increased policy holder satisfaction and indemnity accuracy, while enhancing client operational capacity Value Proposition • Digitalization of Processes – Continuous process innovation • 6,000+ professional and highly credentialed contractors • General and Specialty Contractor Services – Personal & Commercial • Available 24/7/365 – Customer Centric Approach • Analytics - based Network Performance Management Value Delivery System Programs Managed Repair Adjuster Referral Emergency Services Direct to Consumer Affinity Key Stakeholder Value Service Delivery Highlights Contractor Services • Emergency Services – Board Up, Tree Removal, Roof Tarping • Mitigation – For Water, Freeze and Wind claims • Specialty Trades – Contents, Textiles, Electronics Restoration • Environmental Hazards – Lead and Asbestos Abatement • Decontamination & Mold Remediation • Single Trade Services – Roofing & Exterior • General Contracting – regardless of severity of damages • All work backed by Contractor 5 - year Workmanship Warranty JobTrack • Delivering unprecedented communication and transparency • Capture deeper insights for clients, property owners & contractors Asservio • Digital Estimate Review technology - data driven increased accuracy • Enhances proven Estimate Review Expertise – accelerated cycle time Surge Response • Capacity management, performance - based assignment methodology • Customized Event Response Planning • Network mobilization Contractor Connection

21 Crawford Catastrophe Services Enhancing the customer experience through scalable claims adjudication solutions leveraging the full spectrum of technology and the highest trained field personnel in the industry. Value Proposition Value Delivery System • Network of over 6,000 licensed and trained resources throughout the U.S. • Background tested, vetted and continuous training platform supporting coverage, product, technology and customer service • Digitally enabled workforce leveraging our proprietary RENOVO deployment tracking platform • Globally deployed field and virtual assets supported by technical and specialist expertise Comprehensive Suite of Services Global Presence Cutting - edge Capabilities • Technology enabled scalable Workforce 6,000+ strong • US & Caribbean coverage: Wind, Hail, Hurricane, EQ, Wildfire • Industry leading training investment in our people • Rapid Response scalable resourcing solution for virtual & field personnel • Embedded alternative inspection capabilities throughout claim lifecycle • Stewardship discipline to drive preparedness for any scenario • True digital claim experience from FNOL through fulfillment Technology Man Cat Desk Solutions Temporary Staffing Digital FNOL Cat Response Key Stakeholder Value Service Delivery Highlights

22 Crawford is Partnering with Leading Insurtechs Smart Water Meters Property Measurement and 3 - D Modeling Digital Desk for Interior Property Claims Automate and Expedite Claim Handling via Mobile* Enables Digitalization of Estimate Review Process* Immersive 3D Technology One - stop Information Portal for Adjusters* Cloud Service Platform for P&C Insurers Mobile Claims Handling Insurance Risk Data Analytics *Crawford Owned
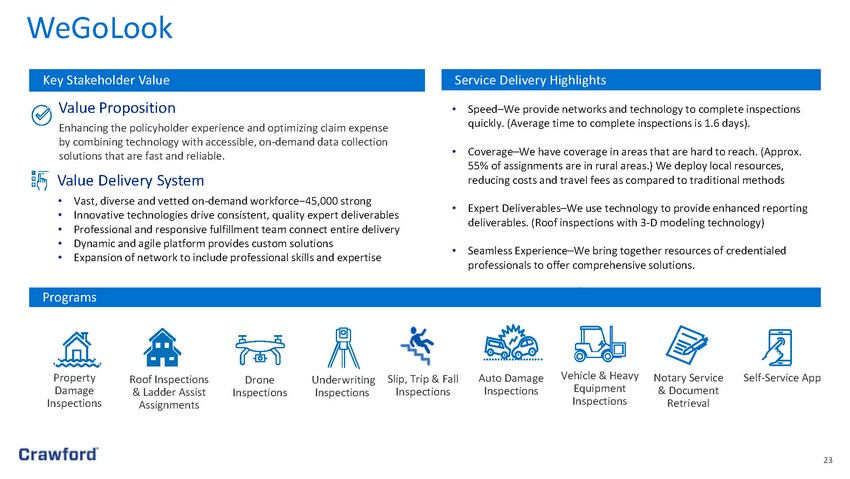
23 Enhancing the policyholder experience and optimizing claim expense by combining technology with accessible, on - demand data collection solutions that are fast and reliable. Value Proposition • Vast, diverse and vetted on - demand workforce−45,000 strong • Innovative technologies drive consistent, quality expert deliverables • Professional and responsive fulfillment team connect entire delivery • Dynamic and agile platform provides custom solutions • Expansion of network to include professional skills and expertise Value Delivery System Key Stakeholder Value Service Delivery Highlights • Speed – We provide networks and technology to complete inspections quickly. (Average time to complete inspections is 1.6 days). • Coverage – We have coverage in areas that are hard to reach. (Approx. 55% of assignments are in rural areas.) We deploy local resources, reducing costs and travel fees as compared to traditional methods • Expert Deliverables – We use technology to provide enhanced reporting deliverables. (Roof inspections with 3 - D modeling technology) • Seamless Experience – We bring together resources of credentialed professionals to offer comprehensive solutions. WeGoLook Programs Property Damage Inspections Auto Damage Inspections Vehicle & Heavy Equipment Inspections Slip, Trip & Fall Inspections Roof Inspections & Ladder Assist Assignments Drone Inspections Underwriting Inspections Notary Service & Document Retrieval Self - Service App

24 • QA Automation & Digitalization providing continuous improvement process • Rules based on Crawford industry expertise and customizable by client • Delivers consistent estimate accuracy • Automated processes reduce cycle time • Compliance results communicated in an easily transferrable format • Comprehensive date providing key data insights that drive performance improvement clicks seconds 5 Asservio Now Providing efficiency thru reimagination Improving estimating accuracy and cycle times Digitized solution that enables Touchless claims processing 17 Crawford’s proprietary solution for enabling digitalization of estimate review process

25 Strong financial position and liquidity Continuing share repurchase program as a component of our capital allocation strategy Our Capital Allocation Strategy We’re committed to employing a consistent strategy and are staying disciplined on our valuation approach Regular quarterly dividend For CRD - A and CRD - B Acquire ancillary services to bolster presence in property claim ecosystem Bolster technical capabilities by attracting top - tier technical adjusting talent globally Drive market share within fragmented independent loss adjusting market in the US Increase presence in rapidly growing P&C insurance markets with strong outsourced claims processing tailwinds 4XDOLW\ ([SHUWLVH
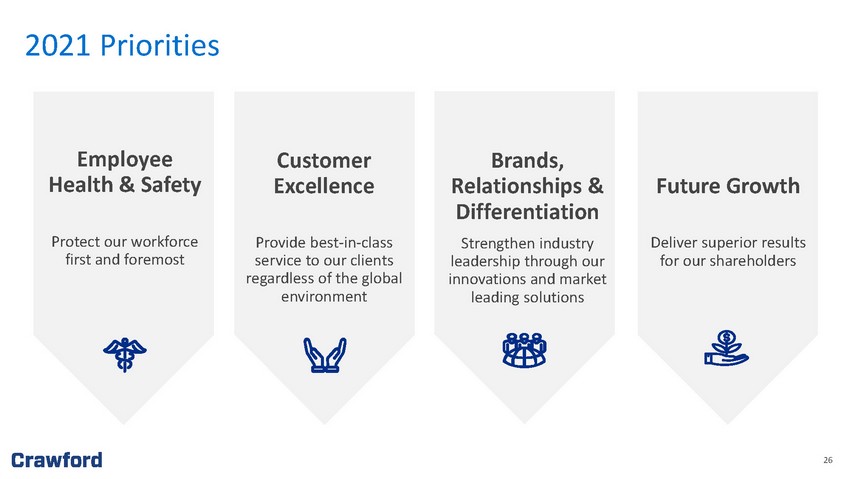
26 Employee Health & Safety Protect our workforce first and foremost Customer Excellence Provide best - in - class service to our clients regardless of the global environment Brands, Relationships & Differentiation Strengthen industry leadership through our innovations and market leading solutions Future Growth Deliver superior results for our shareholders 2021 Priorities
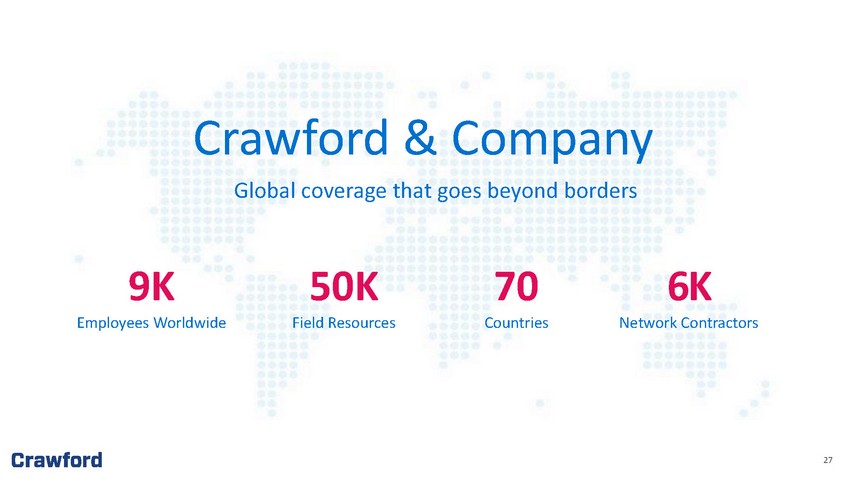
27 9K 50K 70 6K Employees Worldwide Field Resources Countries Network Contractors Crawford & Company Global coverage that goes beyond borders 27

28 28 Appendix A: Global Service Lines & Q2 2021 Segment Results 28

29 (1) See appendix for non - GAAP explanation and reconciliation of non - GAAP measures. 29 Second Quarter 2021 Financial Summary ($ in millions, except per share amounts) June 30, 2021 June 30, 2020 % Change Revenues $267.5 $234.4 14% Non-GAAP Revenues excluding foreign exchange fluctuations (1) 255.2 234.4 9% Net Income Attributable to Shareholders of Crawford & Company 11.8 5.9 100% Diluted Earnings per Share CRD-A $0.22 $0.11 100% CRD-B $0.22 $0.11 100% Non-GAAP Diluted Earnings per Share 1 CRD-A $0.25 $0.19 32% CRD-B $0.26 $0.19 37% Adjusted Operating Earnings 1 19.6 18.2 8% Adjusted Operating Margin 1 7.3% 7.8% (50bps) Adjusted EBITDA 1 29.0 25.5 14% Adjusted EBITDA Margin 1 10.8% 10.9% (10bps) Net Debt 80.3 68.9 17% Cash Flows from Operating Activities $10.5 $ 12.0 -13% Quarter Ended

30 Net Debt and Pension Liability (1) As of 6/30/2021 Net debt at $80.3 million Pension liability at $44.2 million 0 20,000 40,000 60,000 80,000 100,000 120,000 140,000 160,000 180,000 200,000 2015 2016 2017 2018 2019 2020 Q2 2021 Net Debt ¹ - 20,000 40,000 60,000 80,000 100,000 120,000 140,000 2015 2016 2017 2018 2019 2020 Q2 2021 Pension Liability¹ $80.3 million $44.2 million $171.2 million $121.7 million

31 For clients seeking to increase policyholder satisfaction across the full spectrum of loss adjusting needs, Crawford is the one - stop - shop delivering efficiency and savings through unmatched experience, specialized expertise and digitally - enabled solutions. Crawford Loss Adjusting *First Notice of Loss Property Casualty Catastrophe Equipment Inspections Subrogation Centralized Intake/FNOL* Cyber Forensic Accounting Energy Marine Global Admin (FNOL* to Final Payment) Field Adjusting Construction Clients Scope & Scale Strategy • Carriers of all sizes • MGAs • Lloyds • Brokers • Corporations • Claims sizes vary from $500 - $5B+ • ~315K Claims managed annually, $10B+ indemnity dollars • Nearly 2,500 claims professionals • 700+ executive general adjusters with an average of 25 years of experience Gain market share through digital simplification, setting quality benchmarks and investing in expertise

32 32 Highlights • 15% revenue growth in US • Recovering economic activity in US • Strong demand for major and complex adjustors driving investment in talent • Won ~$10 million of new business in the quarter Operating Results (2Q 2021 v. 2Q 2020) • Revenues of $116.0 million versus $109.1 million • Constant dollar revenues of $107.3 million • Gross profit of $27.2 million versus $30.5 million • Gross profit margin of 23.5% versus 28.0% • Operating earnings of $6.2 million versus $10.0 million • Operating margin of 5.3% versus 9.2% Crawford Loss Adjusting Three months ended (in thousands, except percentages) June 30, 2021 June 30 , 20 20 Variance Revenues $ 115,956 $ 109,062 6.3 % Direct expenses 88,712 78,537 13.0 % Gross profit 27,244 30,525 (10.7 % ) Indirect expenses 21,045 20,482 2.7 % Operating earnings $ 6,199 $10,043 (38.3%) Gross profit margin 23.5% 28.0% (4.5 % ) Operating margin 5.3% 9.2% (3.9 % ) Total cases received 87,107 84,701 2.8 % Full time equivalent employees 3,430 3 , 337 2.8 %
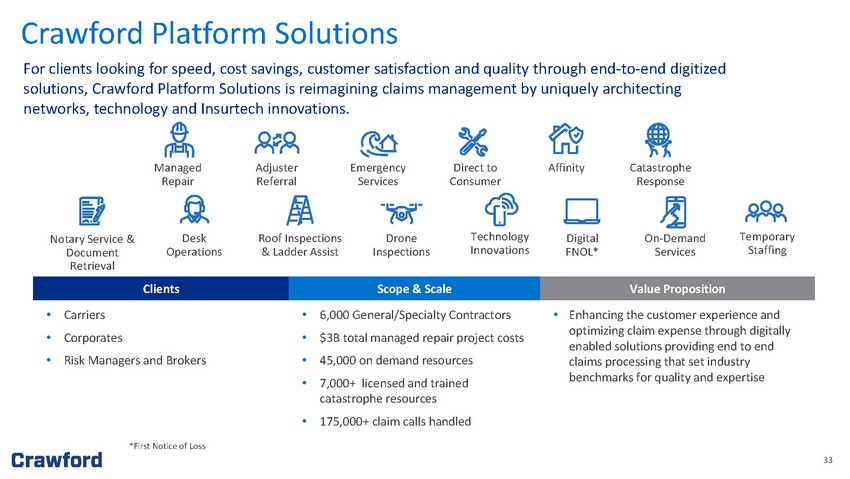
33 Crawford Platform Solutions For clients looking for speed, cost savings, customer satisfaction and quality through end - to - end digitized solutions, Crawford Platform Solutions is reimagining claims management by uniquely architecting networks, technology and Insurtech innovations. *First Notice of Loss Managed Repair Adjuster Referral Emergency Services Affinity Direct to Consumer Catastrophe Response Drone Inspections Desk Operations Roof Inspections & Ladder Assist On - Demand Services Digital FNOL* Technology Innovations Notary Service & Document Retrieval Temporary Staffing Clients Scope & Scale Value Proposition • Carriers • Corporates • Risk Managers and Brokers • 6,000 General/Specialty Contractors • $3B total managed repair project costs • 45,000 on demand resources • 7,000+ licensed and trained catastrophe resources • 175,000+ claim calls handled • Enhancing the customer experience and optimizing claim expense through digitally enabled solutions providing end to end claims processing that set industry benchmarks for quality and expertise

34 34 Highlights • Transformational area for Crawford • Volume increasing – Q2 saw the highest number of transactions in past two years • Despite benign weather, saw strong flow through • Won nearly $2 million of new business in the quarter Operating Results (2Q 2021 v. 2Q 2020) • Revenues of $51.1 million versus $36.7 million • Constant dollar revenues of $50.4 million • Gross profit of $15.4 million versus $10.7 million • Gross profit margin of 30.2% versus 29.1% • Operating earnings of $10.4 million versus $7.1 million • Operating margin of 20.3% versus 19.5% Crawford Platform Solutions Three months ended (in thousands, except percentages) June 30, 2021 June 30 , 20 20 Variance Revenues $ 51,127 $ 36,686 39.4 % Direct expenses 35,692 26 , 024 37.2 % Gross profit 15,435 10,662 44.8 % Indirect expenses 5,067 3 , 517 44.1% Operating earnings $ 10,368 $ 7,145 45.1 % Gross profit margin 30.2% 29.1% 1.1 % Operating margin 20.3% 19.5% 0.8 % Total cases received 131,977 96,746 36.4 % Full time equivalent employees 1,210 961 25.9 %

35 For companies looking to enhance the claims experience and drive quantifiable savings, TPA: Broadspire is the third party administrator that delivers client - centric integrated outsourced solutions powered by innovation and data science. Crawford TPA Solutions: Broadspire Workers Compensation Auto/ Motor Accident & Health Affinity/ Warranty General Liability Product Liability & Recall Employers Liability Medical Management Legal Services/ Recoveries Disability & Leave Technology Solutions Clients Scope & Scale Strategy • Corporations, municipalities • MGAs, Program Managers, Captives • Carriers of all sizes • 50%+ U.S. Fortune 250 corporations served • $1.0B Managed medical spend • $3.3B Claims Paid • 813,000 Claims Managed Strengthen differentiation through product innovation, digitization and scaling

36 36 Highlights • Claims volume up ~5% versus prior year • Impact of COVID still being felt in Canada and EU • Medical management is below pre - pandemic levels • Won more than $8 million of new business in the quarter Operating Results (2Q 2021 v. 2Q 2020) • Revenues of $100.4 million versus $88.7 million • Constant dollar revenues of $97.6 million • Gross profit of $19.1 million versus $17.2 million • Gross profit margin of 19.0% versus 19.4% • Operating earnings of $4.7 million versus $3.1 million • Operating margin of 4.7% versus 3.5% Crawford TPA Solutions: Broadspire Three months ended (in thousands, except percentages) June 30, 2021 June 3 0 , 20 20 Variance Revenues $ 100,374 $ 88 , 668 13.2 % Direct expenses 81 , 310 71,498 13.7 % Gross profit 19,064 17 , 170 11.0% Indirect expenses 14,349 14,048 2.1 % Operating earnings $ 4,715 $ 3,122 51.0% Gross profit margin 19.0% 19.4% (0.4%) Operating margin 4.7% 3.5% 1.2% Total cases received 197,125 187,045 5.4% Full time equivalent employees 3 , 522 3 , 108 13.3 %

37 Recent M&A Extending our market position through recent acquisitions and innovative solutions HBA Group • Acquired HBA Group in 2020, a legal services provider which complements the Crawford TPA Solutions segment in Australia and the larger Asia region Asservio • Launched Asservio in 2021, a bold innovation that will support the digital transformation of property claims • Improves efficiency, accuracy and consistency in the estimating process Crawford Carvallo • Acquired Crawford Carvallo in 2020, establishing Crawford as the largest loss adjusting company in Latin America

38 38 Appendix B: Non - GAAP Financial Information 38

39 Measurements of financial performance not calculated in accordance with GAAP should be considered as supplements to, and not substitutes for, performance measurements calculated or derived in accordance with GAAP. Any such measures are not necessaril y comparable to other similarly - titled measurements employed by other companies. Reimbursements for Out - of - Pocket Expenses In the normal course of our business, our operating segments incur certain out - of - pocket expenses that are thereafter reimbursed by our clients. Under GAAP, these out - of - pocket expenses and associated reimbursements are required to be included when reporting expenses and revenues, respectively, in our consolidated results of op erations. In this presentation, we do not believe it is informative to include in reported revenues the amounts of reimbursed expenses and related revenues, as they offset each other in our consolidated r esu lts of operations with no impact to our net income or operating earnings. As a result, unless noted in this presentation, revenue and expense amounts exclude reimbursements for out - of - pocket expenses. Net Debt Net debt is computed as the sum of long - term debt, capital leases and short - term borrowings less cash and cash equivalents. Man agement believes that net debt is useful because it provides investors with an estimate of what the Company's debt would be if all available cash was used to pay down the debt of the Company. The measu re is not meant to imply that management plans to use all available cash to pay down debt . Free Cash Flow Management believes free cash flow is useful to investors as it presents the amount of cash the Company has generated that ca n b e used for other purposes, including additional contributions to the Company's defined benefit pension plans, discretionary prepayments of outstanding borrowings under our credit agreement, and ret urn of capital to shareholders, among other purposes. It does not represent the residual cash flow of the Company available for discretionary expenditures. Segment and Consolidated Operating Earnings Operating earnings is the primary financial performance measure used by our senior management and chief operating decision ma ker to evaluate the financial performance of our Company and operating segments and make resource allocation and certain compensation decisions. Management believes operating earnings is useful to ot hers in that it allows them to evaluate segment and consolidated operating performance using the same criteria our management and chief operating decision maker use. Consolidated operating e arn ings represent segment earnings including certain unallocated corporate and shared costs and credits, but before net corporate interest expense, stock option expense, amortization of customer - relation ship intangible assets, loss on disposition of business, income taxes and net income or loss attributable to noncontrolling interests. Appendix: Non - GAAP Financial Information

40 Segment and Consolidated Gross Profit Gross profit is defined as revenues less direct expenses which exclude indirect overhead expenses allocated to the business. Ind irect expenses consist of centralized administrative support costs, regional and local shared services that are allocated to each segment based on usage. Adjusted EBITDA Adjusted EBITDA is used by management to evaluate, assess and benchmark our operational results and the Company believes that ad justed EBITDA is relevant and useful information widely used by analysts, investors and other interested parties. Adjusted EBITDA is defined as net income attributable to shareholders of the Company wi th recurring adjustments for depreciation and amortization, net corporate interest expense, income taxes and stock - based compensation expense. Additionally, adjustments for non - recurring expenses for lo ss on disposition of business have been included in the calculation of adjusted EBITDA. Adjusted EBITDA is not a term defined by GAAP and as a result our measure of adjusted EBITDA might not be co mpa rable to similarly titled measures used by other companies. Adjusted Revenue, Operating Earnings, Pretax Earnings, Net Income, Diluted Earnings per Share and EBITDA Included in non - GAAP adjusted measurements as an add back or subtraction to GAAP measurements, are impacts of amortization of cu stomer - relationship intangible assets, the goodwill impairment and loss on disposition of business, which arise from non - core items not directly related to our normal business or operations, or our fu ture performance. Management believes it is useful to exclude these charges when comparing net income and diluted earnings per share across periods, as these charges are not from ordinary operations. Appendix: Non - GAAP Financial Information (cont.)
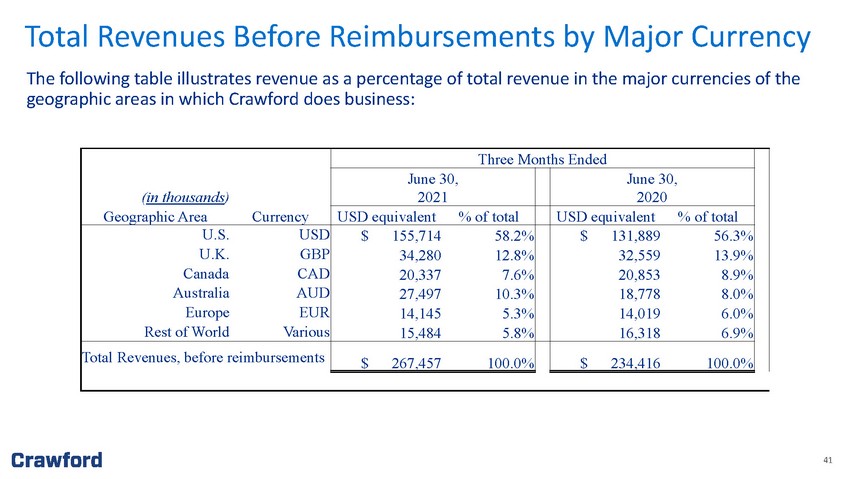
41 41 Total Revenues Before Reimbursements by Major Currency The following table illustrates revenue as a percentage of total revenue in the major currencies of the geographic areas in which Crawford does business: Three Months Ended ( in thousands ) June 30, 2021 June 30, 2020 Geographic Area Currency USD equivalent % of total USD equivalent % of total U.S. USD $ 155,714 58.2% $ 131,889 56.3% U.K. GBP 34,280 12.8% 32,559 13.9% Canada CAD 20,337 7.6% 20,853 8.9% Australia AUD 27,497 10.3% 18,778 8.0% Europe EUR 14,145 5.3% 14,019 6.0% Rest of World Various 15,484 5.8% 16,318 6.9% Total Revenues, before reimbursements $ 267,457 100.0% $ 234,416 100.0%

42 42 Reconciliation of Non - GAAP Items Revenues, Costs of Services Provided, and Operating Earnings Quarter Ended Quarter Ended June 30 , June 30 , Unaudited ($ in thousands) 2021 2020 Revenues Before Reimbursements Total Revenues $ 276,545 $ 242,875 Reimbursements ( 9,088 ) ( 8,459 ) Revenues Before Reimbursements 267 , 457 2 34,416 Costs of Services Provided, Before Reimbursements Total Costs of Services 202,245 172,057 Reimbursements ( 9,088 ) ( 8,459 ) Costs of Services Provided, Before Reimbursements $ 193,157 $ 163,598 Quarter Ended Quarter Ended June 30 , June 30 , Unaudited ($ in thousands) 2021 2020 Operating Earnings: Crawford Loss Adjusting $ 6,199 $ 10,043 Crawford Platform Solutions 10,368 7,145 Crawford TPA Solutions 4,715 3,122 Unallocated corporate and shared costs and credits, net (1,662 ) (2,066 ) Consolidated Operating Earnings 19,620 18,244 (Deduct) Add: Net corporate interest expense ( 1 , 213 ) ( 2,452 ) Stock option expense ( 264 ) ( 286 ) Amortization expense ( 2,750 ) ( 2,732 ) Loss on disposition of business — (341 ) Income ta x provision (3,590 ) (6,311 ) Net income attributable to noncontrolling interests and redeemable noncontrolling interests (23 ) ( 224 ) Net Income Attributable to Shareholders of Crawford & Company $ 11,780 $ 5,898
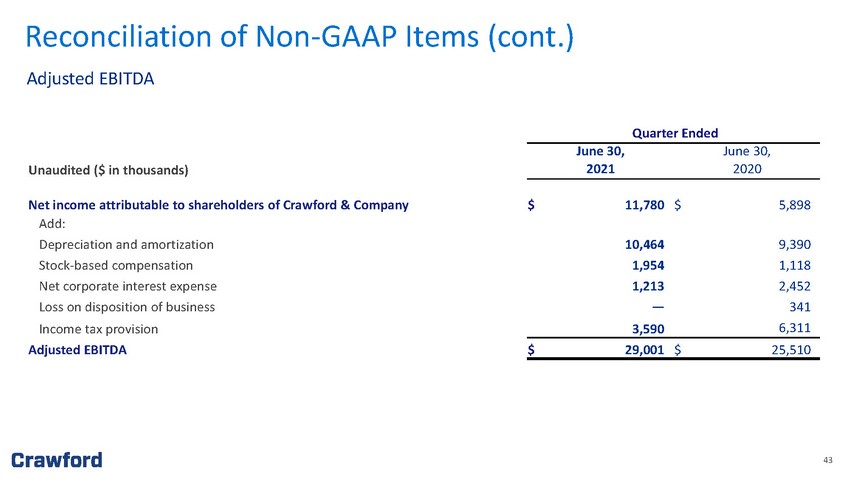
43 43 Reconciliation of Non - GAAP Items (cont.) Adjusted EBITDA ) Quarter Ended June 30 , June 3 0 , Unaudited ($ in thousands) 20 21 20 20 Net income attributable to shareholders of Crawford & Company $ 11,780 $ 5,898 Add: Depreciation and amortization 10,464 9,390 Stock - based compensation 1,954 1,118 Net corporate interest expense 1 , 213 2 , 452 Loss on disposition of business — 341 Income tax provision 3,590 6,311 Adjusted EBITDA $ 29,001 $ 25,510

44 44 Reconciliation of Non - GAAP Items (cont.) Net Debt June 30 , December 31, Unaudited ($ in thousands) 20 21 20 20 Net Debt Short - term borrowings $ 7,000 $ 1,570 Current installments of finance leases and other obligations 84 267 Long - term debt and finance leases, less current installments 117,878 1 11 , 758 Total debt 124,962 1 13 , 595 Less: Cash and cash equivalents 44,708 44,656 Net debt $ 80,254 $ 68,939

45 45 Reconciliation of Non - GAAP Items (cont.) Segment Gross Profit Three months ended ( $ in thousands) June 30, 20 21 June 30 , 20 20 Segment gross profit: Crawford Loss Adjusting $ 27 , 244 $ 30,525 Crawford Platform Solutions 15 , 435 10,662 Crawford TPA Solutions 19,064 17,170 Segment gross profit 61 , 743 58,357 Segment indirect costs: Crawford Loss Adjusting ( 21,045 ) ( 20 , 482 ) Crawford Platform Solutions ( 5 , 067 ) ( 3 , 517 ) Crawford TPA Solutions (14 , 349 ) (1 4 , 048 ) Unallocated corporate and shared costs, net (1,662 ) (2,066 ) Consolidated operating earnings 19,620 18,244 Net corporate interest expense ( 1 , 213 ) ( 2 , 452 ) Stock option expense ( 264 ) ( 286 ) Amortization expense (2,750 ) (2, 732 ) Loss on disposition of business — ( 341 ) Income tax provision (3,590 ) (6 , 311 ) Net income attributable to noncontrolling interests and redeemable noncontrolling interests (23 ) ( 224 ) Net income attributable to shareholders of Crawford & Company $ 11,780 $ 5,898
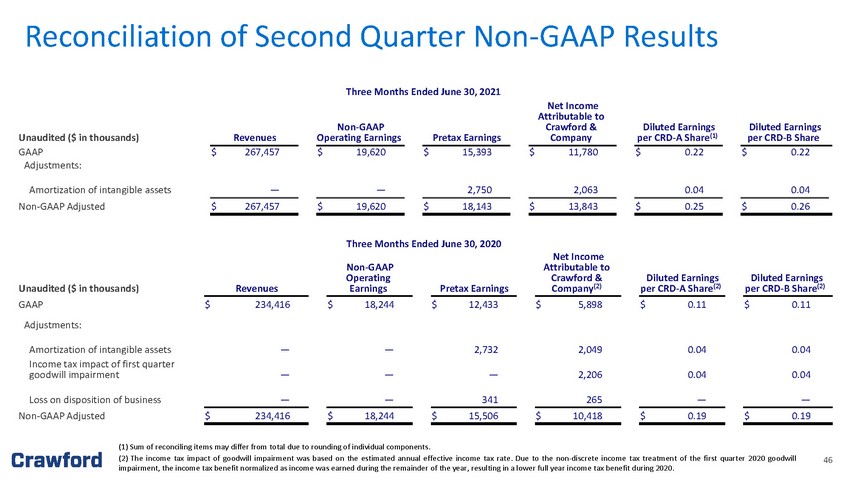
46 46 Reconciliation of Second Quarter Non - GAAP Results Three Months Ended June 3 0 , 20 21 Unaudited ($ in thousands) Revenues Non - GAAP Operating Earnings Pretax Earnings Net Income Attributable to Crawford & Company Diluted Earnings per CRD - A Share (1) Diluted Earnings per CRD - B Share GAAP $ 267,457 $ 19,620 $ 15,393 $ 11,780 $ 0. 22 $ 0. 22 Adjustments: Amortization of intangible assets — — 2,750 2,063 0. 04 0. 04 Non - GAAP Adjusted $ 267,457 $ 19,620 $ 18,143 $ 13,843 $ 0. 25 $ 0. 26 Three Months Ended June 3 0 , 20 20 Unaudited ($ in thousands) Revenues Non - GAAP Operating Earnings Pretax Earnings Net Income Attributable to Crawford & Company (2) Diluted Earnings per CRD - A Share (2) Diluted Earnings per CRD - B Share (2) GAAP $ 234,416 $ 18,244 $ 12,433 $ 5,898 $ 0.11 $ 0.11 Adjustments: Amortization of intangible assets — — 2,732 2,049 0.04 0.04 Income tax impact of first quarter goodwill impairment — — — 2,206 0.04 0.04 Loss on disposition of business — — 341 265 — — Non - GAAP Adjusted $ 234,416 $ 18,244 $ 15,506 $ 10,418 $ 0. 19 $ 0.19 ( 1 ) Sum of reconciling items may differ from total due to rounding of individual components . ( 2 ) The income tax impact of goodwill impairment was based on the estimated annual effective income tax rate . Due to the non - discrete income tax treatment of the first quarter 2020 goodwill impairment, the income tax benefit normalized as income was earned during the remainder of the year, resulting in a lower full year income tax benefit during 2020 .