Attached files
| file | filename |
|---|---|
| EX-99.2 - EX-99.2 - Premier, Inc. | d192117dex992.htm |
| EX-99.1 - EX-99.1 - Premier, Inc. | d192117dex991.htm |
| 8-K - 8-K - Premier, Inc. | d192117d8k.htm |

Fiscal 2021 Fourth Quarter Earnings Conference Call August 17, 2021 Exhibit 99.3
Forward-looking Statements and Non-GAAP Financial Measures Forward-looking statements – Statements made in this presentation and the accompanying webcast that are not statements of historical or current facts, such as those related to the timing and continuing impact of COVID-19, the ability to execute our strategy in both of our business segments and drive long-term, sustainable growth and value to all our stakeholders, our ability to develop and incorporate artificial intelligence into our solutions, the payment of dividends at current levels, or at all, the timing and number of shares repurchased, if any, under our share repurchase approval, and the statements under the heading “Fiscal 2022 Outlook and Guidance” and the assumptions underlying fiscal 2022 guidance are “forward-looking statements” within the meaning of the Private Securities Litigation Reform Act of 1995. Forward-looking statements may involve known and unknown risks, uncertainties and other factors that may cause the actual results, performance or achievements of Premier to be materially different from historical results or from any future results or projections expressed or implied by such forward-looking statements. Accordingly, readers should not place undue reliance on any forward-looking statements. In addition to statements that explicitly describe such risks and uncertainties, readers are urged to consider statements in the conditional or future tenses or that include terms such as “believes,” “belief,” “expects,” “estimates,” “intends,” “anticipates” or “plans” to be uncertain and forward-looking. Forward-looking statements may include comments as to Premier’s beliefs and expectations as to future events and trends affecting its business and are necessarily subject to uncertainties, many of which are outside Premier’s control. More information on potential factors that could affect Premier’s financial results is included from time to time in the “Cautionary Note Regarding Forward-Looking Statements,” “Risk Factors” and “Management’s Discussion and Analysis of Financial Condition and Results of Operations” sections of Premier’s periodic and current filings with the SEC, including those discussed under the “Risk Factors” and “Cautionary Note Regarding Forward-Looking Statements” section of Premier’s Form 10-K for the year ended June 30, 2021, expected to be filed with the with the SEC shortly after the date of this presentation, and also available on Premier’s website at investors.premierinc.com. Forward-looking statements speak only as of the date they are made, and Premier undertakes no obligation to publicly update or revise any forward-looking statements, whether as a result of new information or future events that occur after that date, or otherwise. Non-GAAP financial measures – This presentation and accompanying webcast includes certain “adjusted” or “non-GAAP” financial measures as defined in Regulation G under the Securities Exchange Act of 1934. Schedules are attached that reconcile the non-GAAP financial measures included in this presentation to the most directly comparable financial measures calculated and presented in accordance with Generally Accepted Accounting Principles in the United States. You should carefully read Premier’s periodic and current filings with the SEC for definitions and further explanation and disclosure regarding our use of non-GAAP financial measures and such filings should be read in conjunction with this presentation.

Michael J. Alkire President and CEO Overview and Business Review
Executive Summary Continued to advance strategy in fiscal 2021 to create more resilient healthcare supply chain in the United States Profitability in-line with company expectations Total net revenue grew by 40%, driven by growth in both Supply Chain Services and Performance Services segments* *Comparisons reflect fiscal 2021 fourth quarter results vs. fiscal 2020 fourth quarter results Playing integral role in supporting GPO members through COVID-19 pandemic
Supply Chain Services Continued evolution of supply chain, direct sourcing and analytics capabilities helping to advance strategy to build a more resilient healthcare supply chain in U.S. Co-investing with members in unique initiatives to protect healthcare workers, drive supply chain innovation and increase domestic and near-shore manufacturing of critical products Announced collaboration with Honeywell in August 2021 to expand U.S. production of nitrile exam gloves Achieved critical step in advancing strategy through acquisition of Invoice Delivery Services (IDS) assets in March 2021 Branded e-invoicing and e-payables capabilities, including IDS, “Remitra” Expected to further diversify revenue, increase visibility into total member spend and increase member retention and recruitment Focused on building technology-enabled, end-to-end supply chain with unique capabilities spanning from front-end e-commerce to back-end e-invoicing and e-payables solutions
Performance Services Launched PINC AI, a new brand for Premier’s comprehensive technology and consulting services platform Performance Services segment now consists of three sub-brands: PINC AI, Remitra and Contigo Health Realignment better reflects current product offerings and strategy to expand and incorporate artificial intelligence throughout portfolio Enables more than 300,000 physicians to deliver high quality care and safely reduce waste and other inefficiencies Believe platform can scale to advance patient-centric innovation and help drive growth in adjacent markets Focused on further penetrating provider market through AI-enablement and expanding into adjacent payor, life science and employer markets Making progress in driving growth and diversifying revenue streams through deeper penetration of provider market and further expansion into adjacent markets Life Sciences ‒ expanded business capabilities in fiscal 2021 to include new data sources, natural language processing, solutions for improved clinical trial recruitment and increased member partnerships Contigo Health ‒ completed integration of Health Design Plus, grew managed lives by more than 20% and achieved 100% retention rate in fiscal 2021

Craig McKasson Chief Administrative and Chief Financial Officer Financial Review
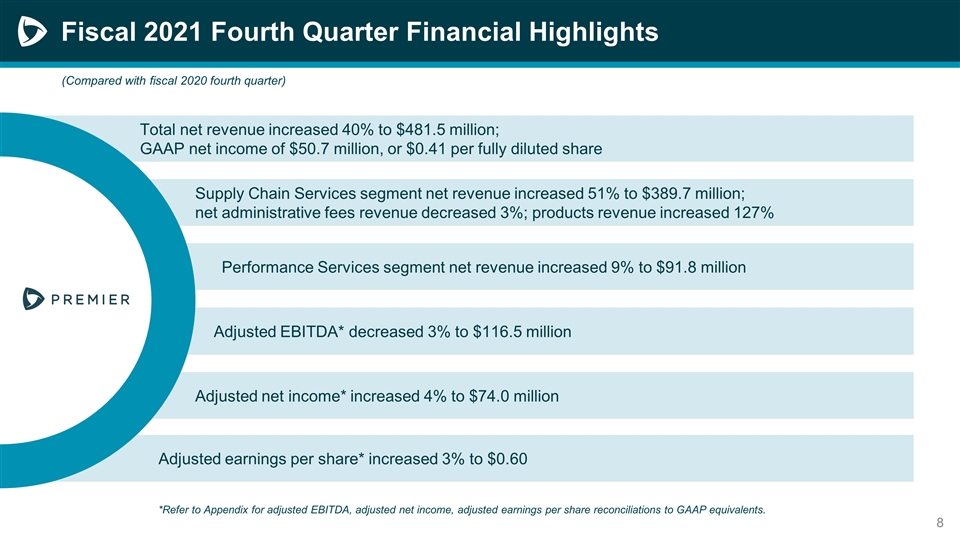
Fiscal 2021 Fourth Quarter Financial Highlights Performance Services segment net revenue increased 9% to $91.8 million Supply Chain Services segment net revenue increased 51% to $389.7 million; net administrative fees revenue decreased 3%; products revenue increased 127% Adjusted EBITDA* decreased 3% to $116.5 million Adjusted net income* increased 4% to $74.0 million Adjusted earnings per share* increased 3% to $0.60 Total net revenue increased 40% to $481.5 million; GAAP net income of $50.7 million, or $0.41 per fully diluted share *Refer to Appendix for adjusted EBITDA, adjusted net income, adjusted earnings per share reconciliations to GAAP equivalents. (Compared with fiscal 2020 fourth quarter)
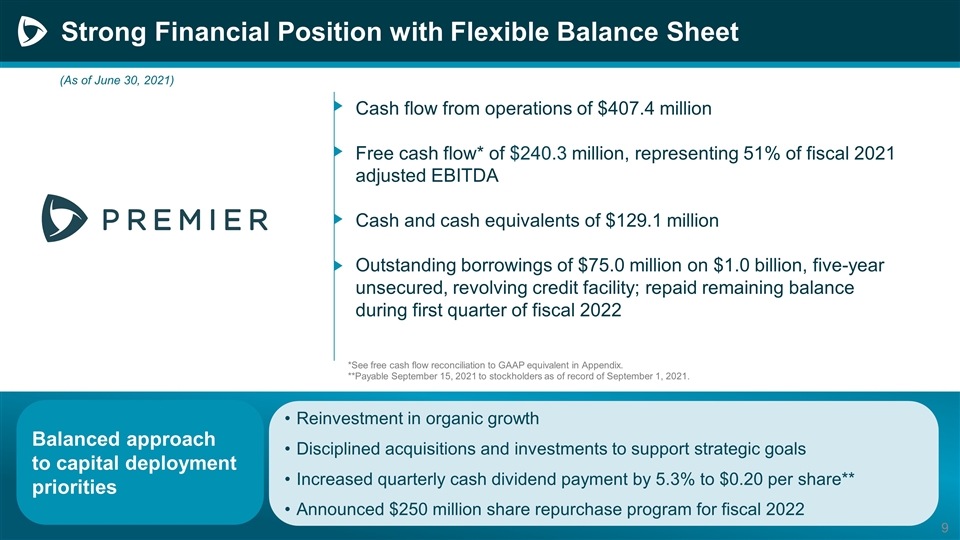
Strong Financial Position with Flexible Balance Sheet Cash flow from operations of $407.4 million Free cash flow* of $240.3 million, representing 51% of fiscal 2021 adjusted EBITDA Cash and cash equivalents of $129.1 million Outstanding borrowings of $75.0 million on $1.0 billion, five-year unsecured, revolving credit facility; repaid remaining balance during first quarter of fiscal 2022 Balanced approach to capital deployment priorities Reinvestment in organic growth Disciplined acquisitions and investments to support strategic goals Increased quarterly cash dividend payment by 5.3% to $0.20 per share** Announced $250 million share repurchase program for fiscal 2022 *See free cash flow reconciliation to GAAP equivalent in Appendix. **Payable September 15, 2021 to stockholders as of record of September 1, 2021. (As of June 30, 2021)
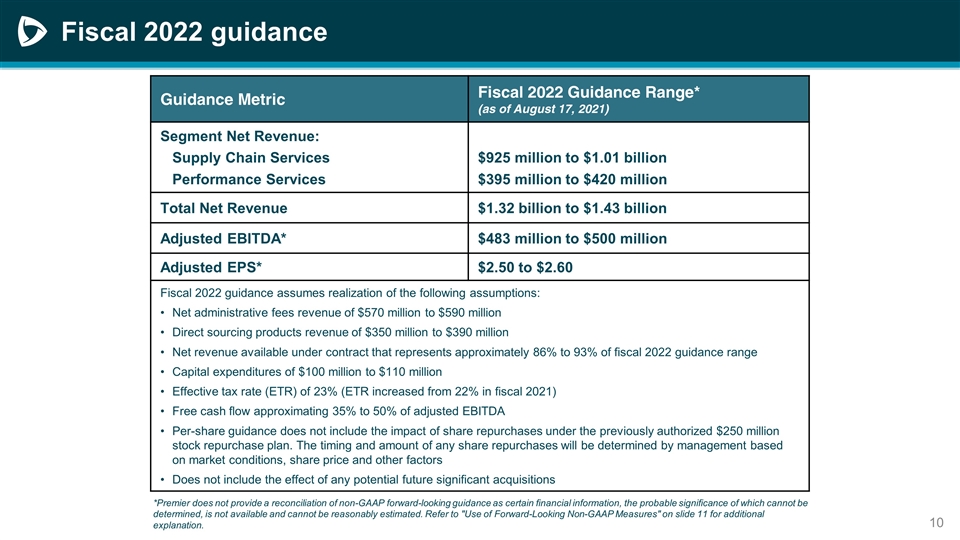
Fiscal 2022 guidance Guidance Metric Fiscal 2022 Guidance Range* (as of August 17, 2021) Segment Net Revenue: Supply Chain Services Performance Services $925 million to $1.01 billion $395 million to $420 million Total Net Revenue $1.32 billion to $1.43 billion Adjusted EBITDA* $483 million to $500 million Adjusted EPS* $2.50 to $2.60 Fiscal 2022 guidance assumes realization of the following assumptions: Net administrative fees revenue of $570 million to $590 million Direct sourcing products revenue of $350 million to $390 million Net revenue available under contract that represents approximately 86% to 93% of fiscal 2022 guidance range Capital expenditures of $100 million to $110 million Effective tax rate (ETR) of 23% (ETR increased from 22% in fiscal 2021) Free cash flow approximating 35% to 50% of adjusted EBITDA Per-share guidance does not include the impact of share repurchases under the previously authorized $250 million stock repurchase plan. The timing and amount of any share repurchases will be determined by management based on market conditions, share price and other factors Does not include the effect of any potential future significant acquisitions *Premier does not provide a reconciliation of non-GAAP forward-looking guidance as certain financial information, the probable significance of which cannot be determined, is not available and cannot be reasonably estimated. Refer to "Use of Forward-Looking Non-GAAP Measures" on slide 11 for additional explanation.
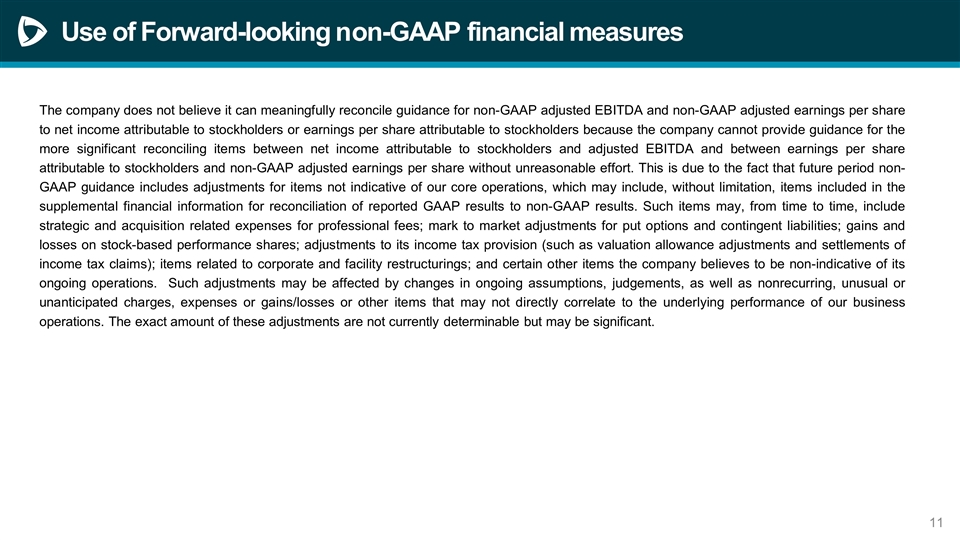
Use of Forward-looking non-GAAP financial measures The company does not believe it can meaningfully reconcile guidance for non-GAAP adjusted EBITDA and non-GAAP adjusted earnings per share to net income attributable to stockholders or earnings per share attributable to stockholders because the company cannot provide guidance for the more significant reconciling items between net income attributable to stockholders and adjusted EBITDA and between earnings per share attributable to stockholders and non-GAAP adjusted earnings per share without unreasonable effort. This is due to the fact that future period non-GAAP guidance includes adjustments for items not indicative of our core operations, which may include, without limitation, items included in the supplemental financial information for reconciliation of reported GAAP results to non-GAAP results. Such items may, from time to time, include strategic and acquisition related expenses for professional fees; mark to market adjustments for put options and contingent liabilities; gains and losses on stock-based performance shares; adjustments to its income tax provision (such as valuation allowance adjustments and settlements of income tax claims); items related to corporate and facility restructurings; and certain other items the company believes to be non-indicative of its ongoing operations. Such adjustments may be affected by changes in ongoing assumptions, judgements, as well as nonrecurring, unusual or unanticipated charges, expenses or gains/losses or other items that may not directly correlate to the underlying performance of our business operations. The exact amount of these adjustments are not currently determinable but may be significant.

Appendix
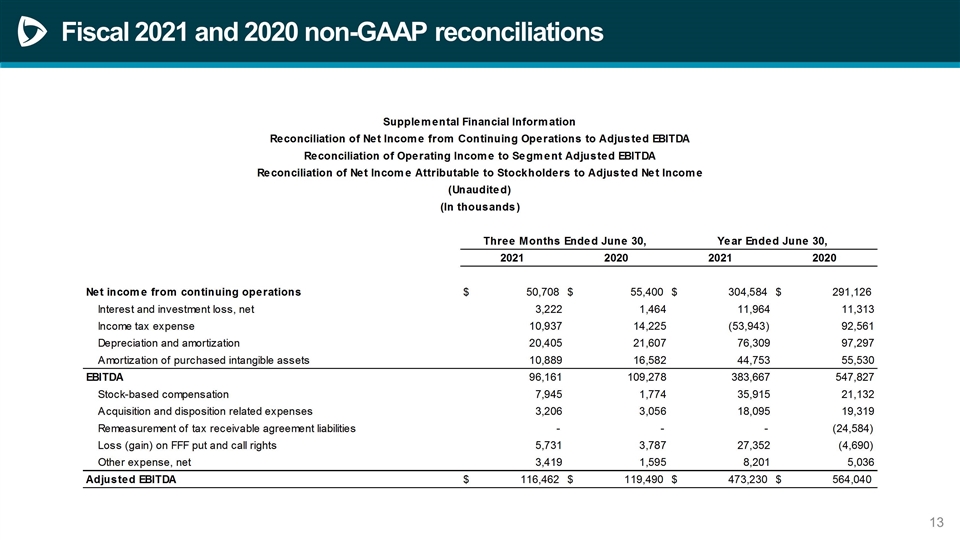
Fiscal 2021 and 2020 non-GAAP reconciliations
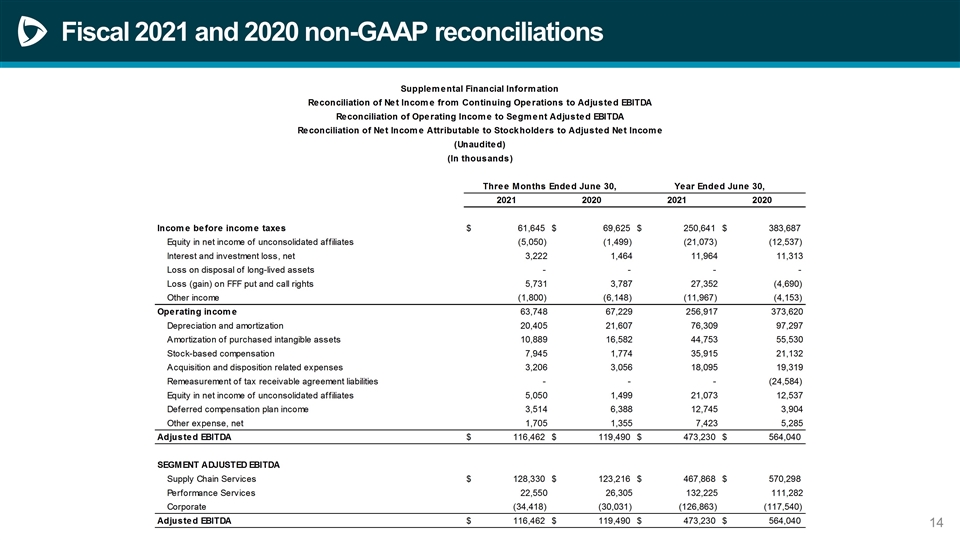
Fiscal 2021 and 2020 non-GAAP reconciliations
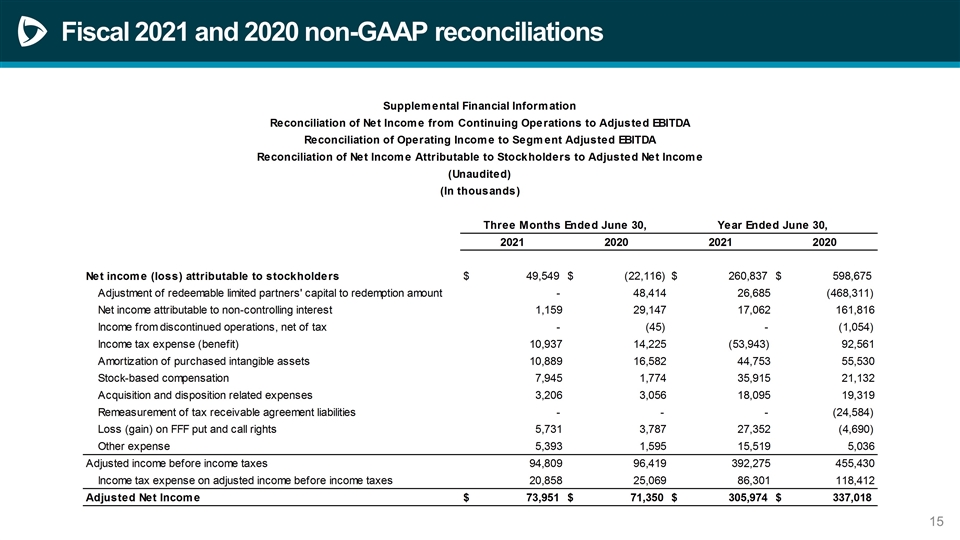
Fiscal 2021 and 2020 non-GAAP reconciliations
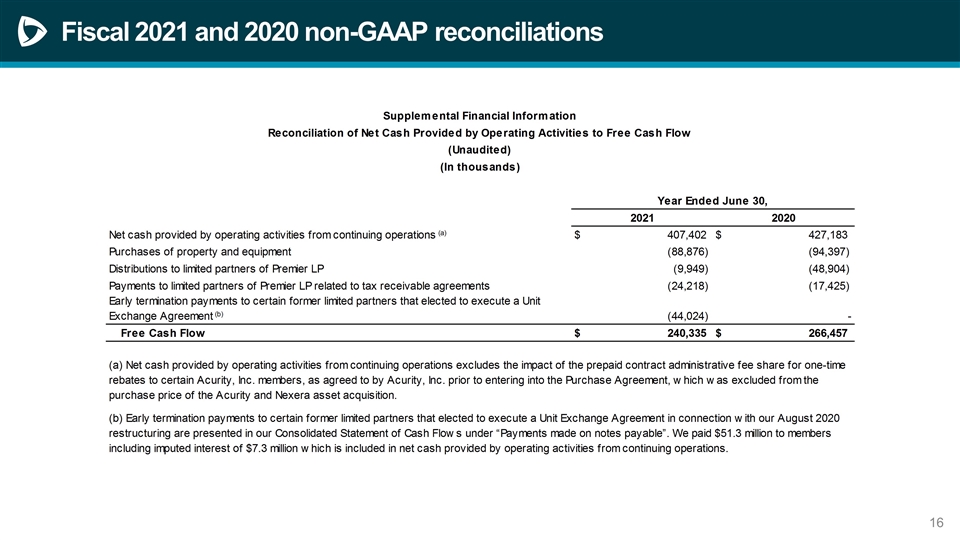
Fiscal 2021 and 2020 non-GAAP reconciliations
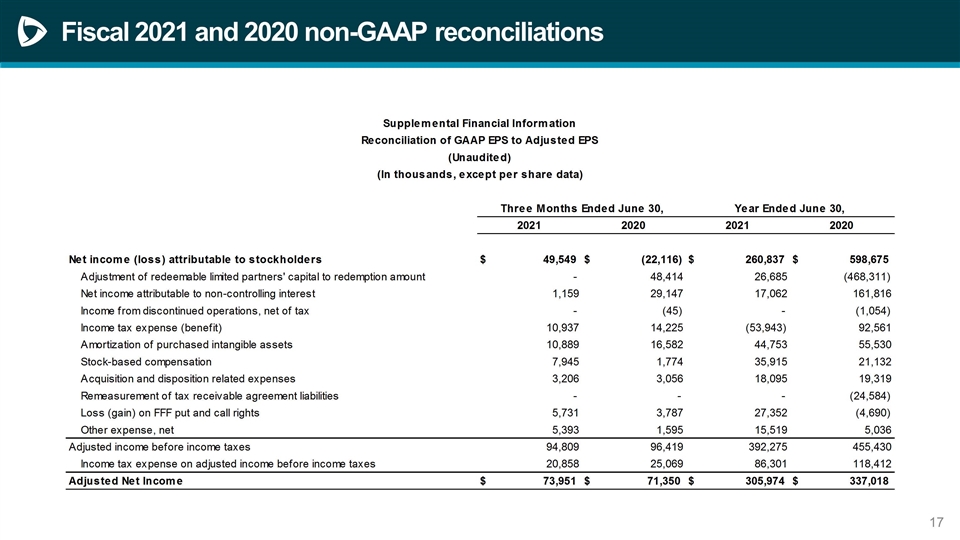
Fiscal 2021 and 2020 non-GAAP reconciliations
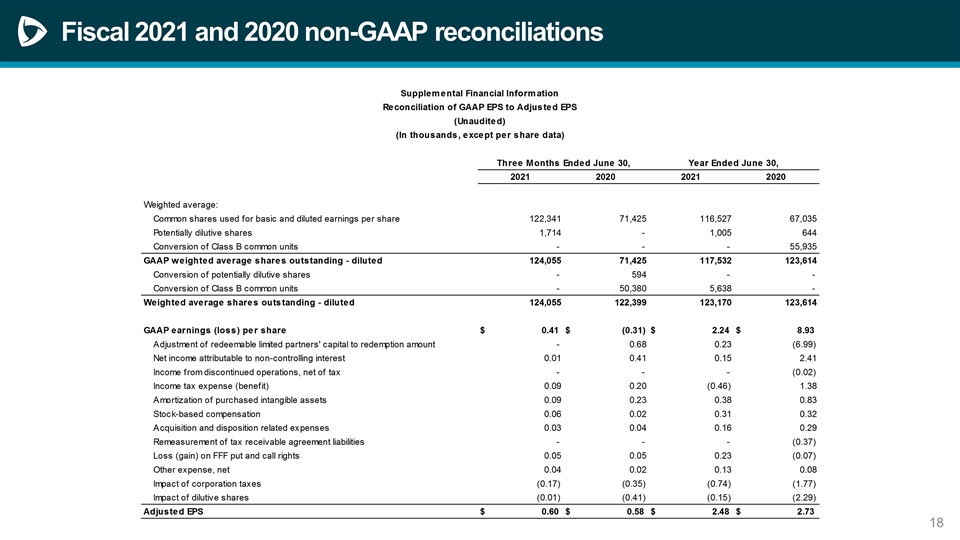
Fiscal 2021 and 2020 non-GAAP reconciliations
