Attached files
| file | filename |
|---|---|
| 8-K - 8-K - Thryv Holdings, Inc. | brhc10027912_8k.htm |
| EX-99.1 - EXHIBIT 99.1 - Thryv Holdings, Inc. | brhc10027912_ex99-1.htm |
Exhibit 99.2

Investor SupplementSecond Quarter 2021

Safe Harbor This Presentation may include certain forward-looking statements, including,
without limitation, statements concerning the conditions of our industry and our operations, performance, and financial condition, including, in particular, statements relating to our business, growth strategies, product development efforts,
and future expenses. Forward-looking statements can be identified by words such as ‘‘anticipates,’’ ‘‘intends,’’ ‘‘plans,’’ ‘‘seeks,’’ ‘‘believes,’’ ‘‘estimates,’’ ‘‘expects,’’ and similar references to future periods, or by the inclusion of
forecasts or projections. Forward-looking statements are based on our current expectations and assumptions regarding our business, the economy, and other future conditions. Because forward-looking statements relate to the future, by their
nature, they are subject to inherent uncertainties and risks (some of which are beyond our control) and changes in circumstances or other assumptions that may cause actual results or performance to be materially different from those expressed
or implied by these forward-looking statements. As a result, our actual results may differ materially from those contemplated by the forward-looking statements. Except as required by law, we are under no obligation to, and expressly disclaim
any obligation to, update or alter any forward-looking statements whether as a result of any such changes, new information, subsequent events or otherwise.Market data and industry information used throughout this Presentation are based on
management’s knowledge of the industry and the good faith estimates of management. We also relied, to the extent available, upon management’s review of independent industry surveys and publications and other publicly available information
prepared by a number of third party sources. All of the market data and industry information used in this Presentation involves a number of assumptions and limitations, and you are cautioned not to give undue weight to such estimates. Although
we believe that these sources are reliable, we cannot guarantee the accuracy or completeness of this information, and we have not independently verified this information. While we believe the estimated market position, market opportunity and
market size information included in this presentation are generally reliable, such information, which is derived in part from management’s estimates and beliefs, is inherently uncertain and imprecise. Projections, assumptions and estimates of
our future performance and the future performance of the industry in which we operate are necessarily subject to a high degree of uncertainty and risk due to a variety of factors. These factors could cause results to differ materially from
those expressed in our estimates and beliefs and in the estimates prepared by independent parties. You should not construe the contents of this Presentation as legal, tax, accounting or investment advice or a recommendation to take (or refrain
from taking) any particular action. You should consult your own counsel and tax and financial advisors as to legal and related matters concerning the matters described herein.In addition to financial measures prepared in accordance with U.S.
generally accepted accounting principles (“GAAP”), this press release and the accompanying tables contain, and the conference call will contain, non-GAAP financial measures. We present non-GAAP measures including: adjusted EBITDA, and adjusted
EBITDA margin. The non-GAAP financial information is presented for supplemental informational purposes only and is not intended to be considered in isolation or as a substitute for, or superior to, financial information prepared and presented
in accordance with GAAP. Please refer to the supplemental information presented in the tables for reconciliations of the non-GAAP financial measures used in this press release to the most comparable GAAP financial measures.We believe that these
non-GAAP financial measures provide useful information about our financial performance, enhance the overall understanding of our past performance and future prospects and allow for greater transparency with respect to important metrics used by
our management for financial and operational decision-making. We believe that these measures provide an additional tool for investors to use in comparing our core financial performance over multiple periods with other companies in our industry.
However, it is important to note that the particular items we exclude from, or include in, our non-GAAP financial measures may differ from the items excluded from, or included in, similar non-GAAP financial measures used by other companies in
the same industry. 2

2nd Quarter SaaS Highlights 3 Accelerating GrowthRevenue +32% YoY Thryv Added to Russell
2000Annual Reconstitution June 2021 Record Low Monthly Churn2.1% (-90bps YoY) Customer Value IncreasingARPU +39% YoY Net Dollar Retention+18 percentage point improvement YoY Note: Results U.S. Only RecognitionG2 & Capterra
AccoladesSaaS Awards FinalistSelling Power’s Best Companies to Sell For
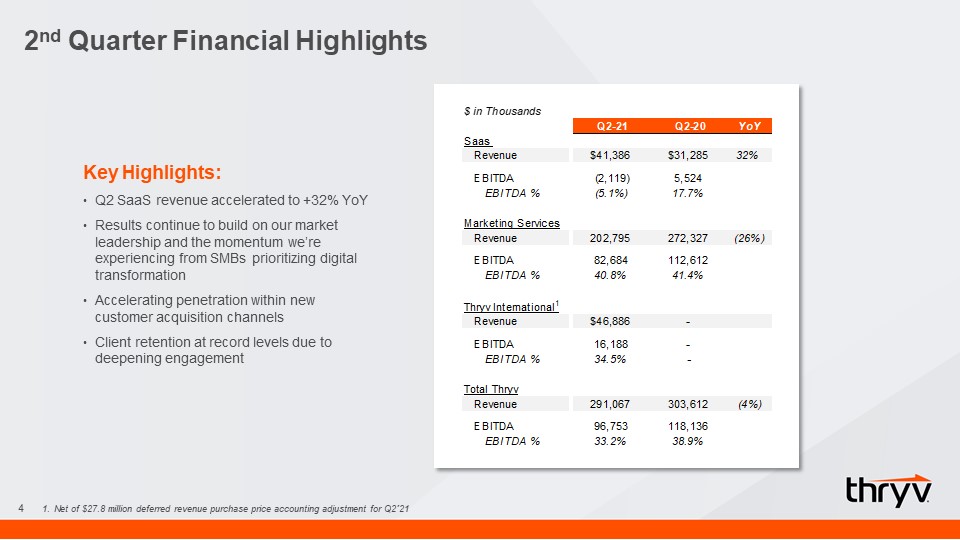
2nd Quarter Financial Highlights 4 Key Highlights:Q2 SaaS revenue accelerated to +32% YoY
Results continue to build on our market leadership and the momentum we’re experiencing from SMBs prioritizing digital transformationAccelerating penetration within new customer acquisition channelsClient retention at record levels due to
deepening engagement Net of $27.8 million deferred revenue purchase price accounting adjustment for Q2’21
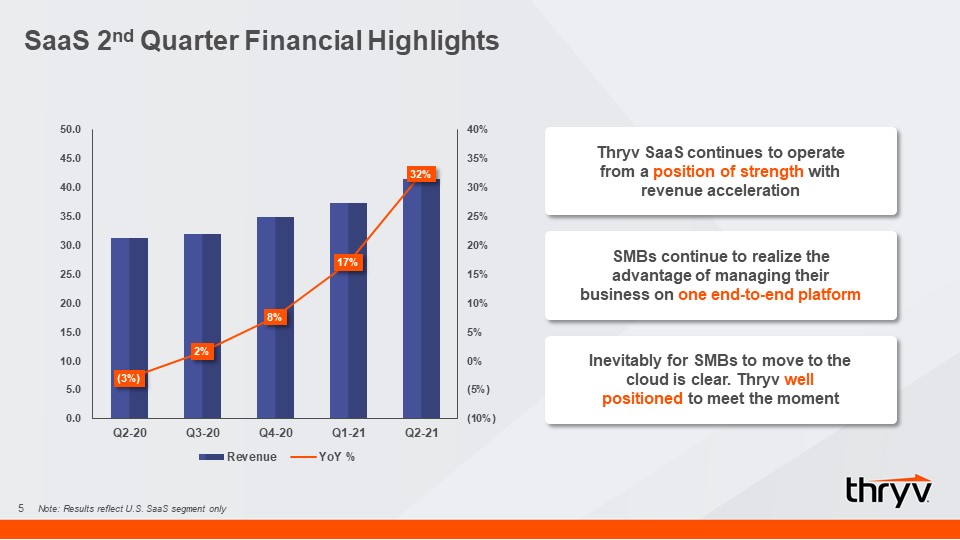
SaaS 2nd Quarter Financial Highlights 5 Thryv SaaS continues to operate from a position
of strength with revenue acceleration SMBs continue to realize the advantage of managing their business on one end-to-end platform Inevitably for SMBs to move to the cloud is clear. Thryv well positioned to meet the moment Note: Results
reflect U.S. SaaS segment only
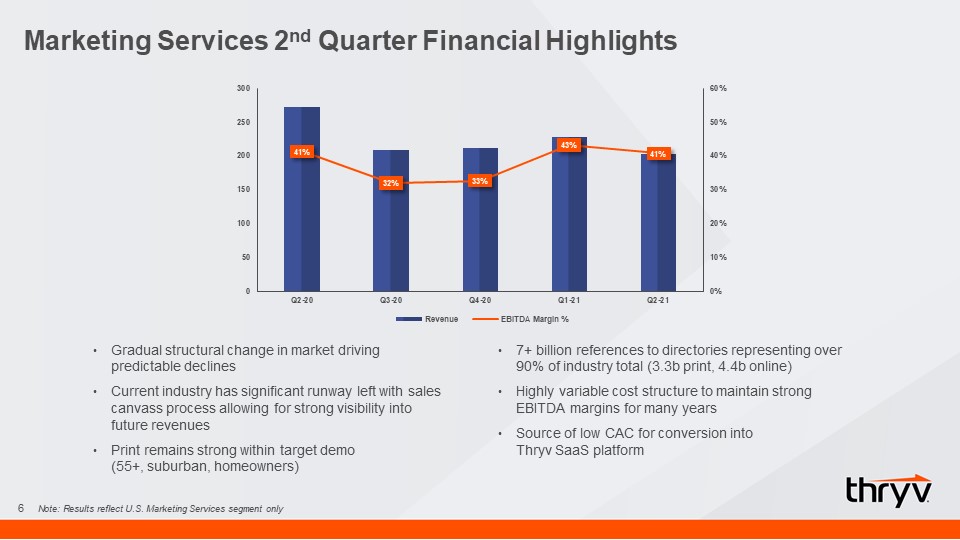
Marketing Services 2nd Quarter Financial Highlights 6 Gradual structural change in market
driving predictable declines Current industry has significant runway left with sales canvass process allowing for strong visibility into future revenuesPrint remains strong within target demo (55+, suburban, homeowners)7+ billion references to
directories representing over 90% of industry total (3.3b print, 4.4b online)Highly variable cost structure to maintain strong EBITDA margins for many years Source of low CAC for conversion into Thryv SaaS platform Note: Results reflect U.S.
Marketing Services segment only

Historical Segment Billings 7 Marketing Services billings rate of decline has stayed very
consistent over time and has shown improvementMost print directories are published on a 15-month cycle and billed ratably ensuring a predictable stream of cash inflowManagement considers billings a useful operational metric for the
business Note: Results reflect U.S. Marketing Services and SaaS segments only

SaaS Metrics 8 Note: Results reflect U.S. SaaS segment only

Engagement 9 30.2 +27% YoY Highlights:SaaS active users and usage frequency reached new
all-time high as daily and weekly active users increased 27% year-over-yearIncrease in user frequency a strong demonstration of the improved onboarding process and breadth of the Thryv platformEngagement efforts are built on a perpetually
improving, award winning software platform Note: Results reflect U.S. SaaS segment only 26.6

10 Thryv Continues to Receive Recognition Within Industry

ThryvPay Update 11 Continued Strength in Adoption~$30M TPV YTDLifetime Avg Transaction
Size mid-$400 Requesting payments with Thryv digital invoices reduces frictionClients paid faster;Next day funds Minimizes late or missed paymentsThru scheduled pay, installment, and membership plans Now most popular payment option
within the ThryvCustomers use ThrvyPay >50% of the time Note: Results reflect U.S. SaaS segment only

Updated FY 2021 Outlook 12 FY 2021 Management Commentary U.S. SaaS Revenue $157 to
$160 million Raising previous annual guidance of $151 to $153 million U.S. Marketing Services Revenue $750 to $770 million Raising previous annual guidance of $740 to $760 million Q3: $190 to $195 millionQ4: $139 to $146 million Thryv
International1 All amounts in AUD Q1: A$20 million actual (1 month of ownership)Q2: A$61 million actualQ3: A$35 to $40 million rangeQ4: A$50 to $57 million range Net of A$13 million and A$36 million deferred revenue purchase price accounting
adjustment for Q1’21 and Q2’21, respectively.
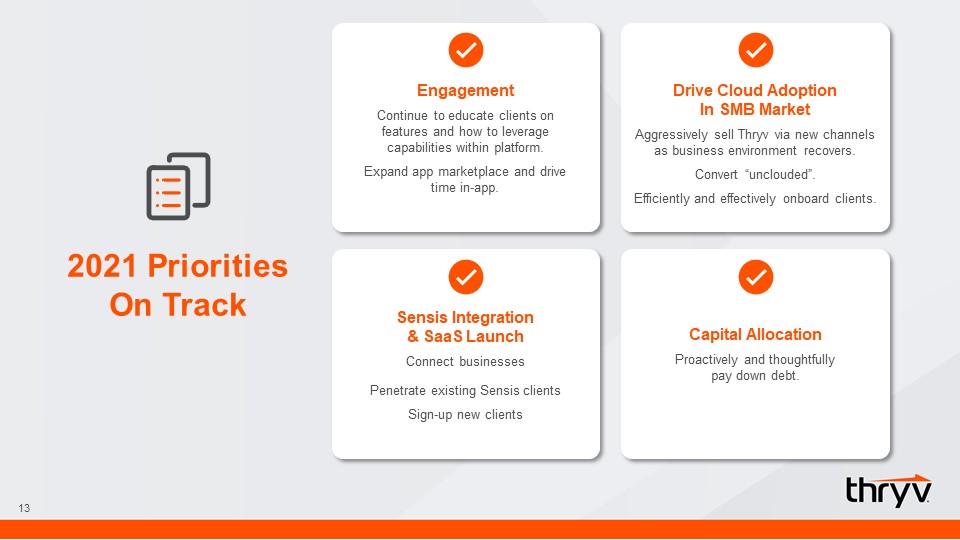
13 Engagement Continue to educate clients on features and how to leverage capabilities
within platform.Expand app marketplace and drive time in-app. Drive Cloud Adoption In SMB MarketAggressively sell Thryv via new channels as business environment recovers.Convert “unclouded”.Efficiently and effectively onboard
clients. Sensis Integration & SaaS Launch Connect businessesPenetrate existing Sensis clients Sign-up new clients Capital AllocationProactively and thoughtfully pay down debt. 2021 Priorities On Track
14 Appendix

Appendix: Non-GAAP Financial Reconciliation 15