Attached files
Exhibit 99.2

M i ta rbei ter k ü r z el ads - tec Energy Investor presentation Au g u s t 2021
M i ta rbei ter k ü r z el Disclaimer This investor presentation (this “Investor Presentation”) has been prepared by ads - tec Energy GmbH (collectively comprising the operating subsidiaries of ads - tec Energy GmbH referred to herein as the “Company”)) and EUSG (the “SPAC”) in connection with the proposed business combination (the “Business Combination”) of EUSG and the Company. This Investor Presentation is for informational purposes only and does not constitute (i) a solicitation of a proxy, consent or authorization with respect to any securities or in respect of the proposed Business Combination or (ii) an offer to sell, a solicitation of an offer to buy, or a recommendation to purchase any equity, debt or other financial instruments of the SPAC or the Company, or their respective affiliates, which offer may only be made at the time a qualified offeree receives definitive offering documents and other materials (collectively, the “Offering Materials”). Without limiting the generality of the foregoing, this Investor Presentation does not constitute an invitation or inducement of any sort to any person in any jurisdiction in which such an invitation or inducement is not permitted or where the SPAC and the Company are not qualified to make such invitation or inducement. In the event of any conflict between this Investor Presentation and information contained in the Offering Materials, the information in the Offering Materials will control and supersede the information contained in this Investor Presentation. No person has been authorized to make any statement concerning the SPAC or the Company other than as will be set forth in the Offering Materials, and any representation or information not contained therein may not be relied upon. Cautionary Language Regarding Forward - Looking Statements This Investor Presentation includes “forward - looking statements” within the meaning of the “safe harbor” provisions of the U.S. Private Securities Litigation Reform Act of 1995. Forward - looking statements may be identified by the use of words such as “may,” “might,” “will,” “would,” “could,” “should,” “forecast,” “intend,” “seek,” “target,” “anticipate,” “believe,” “expect,” “estimate,” “plan,” “outlook” and “project” and other similar expressions that predict or indicate future events or trends or that are not statements of historical matters. Such forward - looking statements, which include estimated financial information, involve known and unknown risks, uncertainties and other factors. A number of factors could cause actual results or outcomes to differ materially from those indicated by such forward - looking statements. These factors include, without limitation, • the risk that the proposed Business Combination may not be completed in a timely manner or at all, which may adversely affect the price of the securities of the SPAC or the Company; • the risk that the proposed Business Combination may not be completed by the 24 - month deadline to which the SPAC is subject and the potential failure to obtain an extension of the deadline if sought by the SPAC; • the failure to satisfy conditions to the consummation of the proposed Business Combination, including the adoption of a business combination agreement (the “BCA”) by the shareholders of the SPAC and the Company; • the lack of a third - party valuation in determining whether or not to pursue the proposed Business Combination; • the occurrence of any event, change or other circumstance that could give rise to the termination of the BCA; • the effect of the announcement or pendency of the proposed Business Combination on the Company’s business relationships, performance and business generally; • risks that the proposed Business Combination disrupts current plans and operations of the Company; • the outcome of any legal proceedings that may be instituted against the Company or the SPAC related to the BCA or the proposed Business Combination; • the ability to maintain the listing of the SPAC’s securities on Nasdaq; • the volatility of the price of the SPAC’s and the post - combination company’s securities; • the ability to implement business plans, forecasts and other expectations after the completion of the proposed Business Combination, and identify and realize additional opportunities; • the risk of downturns and the possibility of rapid change in the highly competitive industry in which the Company operates; • the risk that the Company and its current and future collaborators are unable to successfully develop and commercialize the Company’s products or services, or experience significant delays in doing so; • the risk that the post - combination company may not achieve or sustain profitability; • the risk that the post - combination company will need to raise additional capital to execute its business plan, which may not be available on acceptable terms or at all; and • the risk that the post - combination company experiences difficulties in managing its growth and expanding operations. You should (also) carefully consider the risks and uncertainties described on pages 42 and 43 of this presentation Forward - looking statements are based on current expectations, estimates, projections, targets, opinions and/or beliefs of the SPAC and the Company or, when applicable, of one or more third - party sources. No representation or warranty is made with respect to the reasonableness of any estimates, forecasts, illustrations, prospects or returns, which should be regarded as illustrative only. You should carefully consider the foregoing factors and the other risks and uncertainties described in the “Risk Factors” section of the SPAC’s registration statement on Form S - 1 (the “Registration Statement”) and the proxy statement/prospectus discussed below and other documents filed by the SPAC from time to time with the U.S. Securities and Exchange Commission (“SEC”). These filings identify and address other important risks and uncertainties that could cause actual events and results to differ materially from those contained in the forward - looking statements. You are cautioned not to place undue reliance upon any forward - looking statements, which, unless otherwise indicated herein, speak only as of the date of this Investor Presentation. Neither the SPAC nor the Company commits to update or revise the forward - looking statements set forth herein, whether as a result of new information, future events or otherwise, except as may be required by law. Use of Projections This Investor Presentation contains financial forecasts or projections (collectively “Projections”) prepared by the Company. The Company’s independent registered public accounting firm has not audited, reviewed, compiled or performed any procedures with respect to the Projections for the purpose of their inclusion in this Investor Presentation and, accordingly, neither the SPAC nor the Company expresses an opinion or provides any other form of assurance with respect thereto for the purpose of this Investor Presentation. These Projections should not be relied upon as being necessarily indicative of future results. The Projections are provided solely for illustrative purposes, reflect the current beliefs of the Company as of the date hereof, and are based on a variety of assumptions and estimates about, among others, future operating results, market conditions and transaction costs, all of which may differ from the assumptions on which the Projections are based. The Company does not assume any obligation to update the Projections or information, data, models, facts or assumptions underlying the foregoing in this Investor Presentation. There are numerous factors related to the markets in general or the implementation of any operational strategy that cannot be fully accounted for with respect to the Projections. Any targets or estimates are therefore subject to a number of important risks, qualifications, limitations and exceptions that could materially and adversely affect the combined company’s performance. Moreover, actual events are difficult to project and often depend upon factors that are beyond the control of the SPAC and the Company. The performance projections and estimates are subject to the ongoing COVID - 19 pandemic, and have the potential to be revised to take into account further adverse effects of the COVID - 19 pandemic on the future performance of the SPAC and the Company. Projected returns and estimates are based on an assumption that public health, economic, market, and other conditions will improve; however, there can be no assurance that such conditions will improve within the time period or to the extent estimated by the SPAC and the Company. The full impact of the COVID - 19 pandemic on future performance is particularly uncertain and difficult to predict, therefore actual results may vary materially and adversely from the Projections included herein. Presentation of Financial Information The Company’s financial statement have been prepared in accordance with International Financial Reporting Standards (“IFRS”), which may not be comparable to financial statements prepared in accordance with US generally accepted accounting principles. 2 Disclaimer (1/2)

M i ta rbei ter k ü r z el Use of Non - GAAP Financial Measures This Investor Presentation includes certain financial measures not presented in accordance with IFRS, including, but not limited to, EBITDA and certain ratios and other metrics derived therefrom. These non - IFRS financial measures are not measures of financial performance in accordance with IFRS and may exclude items that are significant in understanding and assessing the Company’s financial results. Therefore, these measures should not be considered in isolation or as an alternative to net income, cash flows from operations or other measures of profitability, liquidity or performance under IFRS. You should be aware that the Company’s presentation of these measures may not be comparable to similarly - titled measures used by other companies, including those peers whose measures are presented in this Investor Presentation. The Company believes these non - IFRS measures of financial results provide useful information to management and investors regarding certain financial and business trends relating to the Company’s financial condition and results of operations. The Company also believes that the use of these non - IFRS financial measures provides an additional tool for investors to use in evaluating ongoing operating results and trends, and in comparing the Company’s financial measures with other similar companies, many of which present similar non - IFRS financial measures to investors. These non - IFRS financial measures are subject to inherent limitations as they reflect the exercise of judgments by management about which expense and income are excluded or included in determining these non - IFRS financial measures. Please refer to any footnotes where presented in this Investor Presentation, as well as to the table on the final page, for a reconciliation of these measures to what the Company believes are the most directly comparable measure evaluated in accordance with IFRS. This Investor Presentation also includes certain projections of non - IFRS financial measures. Due to the high variability and difficulty in making accurate forecasts and projections of some of the information excluded from these projected measures, together with some of the excluded information not being ascertainable or accessible, the Company is unable to quantify certain amounts that would be required to be included in the most directly comparable IFRS financial measures without unreasonable effort. Consequently, no disclosure of estimated comparable IFRS measures and no reconciliation of the forward - looking non - IFRS financial measures are included in this Investor Presentation. Certain monetary amounts, percentages and other figures included in this Investor Presentation have been subject to rounding adjustments. Certain other amounts that appear in this Investor Presentation may not sum due to rounding. Use of Trademarks and Other Intellectual Property All registered or unregistered service marks, trademarks and trade names referred to in this Investor Presentation are the property of their respective owners, and the use herein does not imply an affiliation with, or endorsement by, the owners of these service marks, trademarks and trade names. Third - party logos included herein may represent past customers, present customers or may be provided simply for illustrative purposes only. Inclusion of such logos does not necessarily imply affiliation with or endorsement by such firms or businesses. There is no guarantee that either the SPAC or the Company will work, or continue to work, with any of the firms or businesses whose logos are included herein in the future. General This Investor Presentation is strictly confidential and may not be copied, reproduced, redistributed or passed on, in whole or in part, or disclosed, directly or indirectly, to any other person or published or for any purpose without the express written approval of the SPAC and the Companies. This Investor Presentation may not be reproduced or used for any other purpose. By accepting this Investor Presentation, the recipient agrees that it will, and will cause its representatives and advisors to, use this Investor Presentation, as well as any information derived by the recipient from this Investor Presentation, only for initial due diligence regarding the SPAC and the Company in connection with (i) the proposed Business Combination and (ii) the SPAC’s proposed private offering of public equity (“PIPE Offering”) to a limited number of investors and for no other purpose and will not, and will cause their representatives and advisors not to, divulge this Investor Presentation to any other party. The delivery of this Investor Presentation shall not, under any circumstances, create any implication that the Investor Presentation is correct in all respects, including as of any time subsequent to the date hereof, and the SPAC and the Company do not undertake any obligation to update such information at any time after such date. Neither the SPAC nor the Company nor any of their respective affiliates makes any representation or warranty, express or implied, as to the accuracy or completeness of this Investor Presentation and nothing contained herein should be relied upon as a promise or representation as to past or future performance of the SPAC, the Companies or any other entity referenced herein. An investment through the PIPE Offering entails a high degree of risk and no assurance can be given that investors will receive a return on their capital and investors could lose part or all of their investment. Each recipient acknowledges and agrees that it is receiving this Investor Presentation only for the purposes stated above and subject to all applicable confidentiality obligations as well as securities laws, including without limitation the U.S. federal securities laws and the EU Market Abuse Regulation, prohibiting any person who has received material, non - public information/inside information from purchasing or selling securities of the SPAC or the Company or from communicating such information to any other person under circumstances in which it is reasonably foreseeable that such person is likely to purchase or sell such securities Participants in the Solicitation The SPAC and its directors and executive officers may be deemed participants in the solicitation of proxies from its stockholders with respect to the proposed Business Combination. A list of the names of those directors and executive officers and a description of their interests in the SPAC is contained in the Registration Statement, which was filed with the SEC and is available free of charge at the SEC’s website at www.sec.gov. Additional information regarding the interests of such participants will be contained in the proxy statement/prospectus for the proposed Business Combination when available. The Company and its directors and executive officers may also be deemed to be participants in the solicitation of proxies from the stockholders of the SPAC in connection with the proposed Business Combination. A list of the names of such directors and executive officers and information regarding their interests in the proposed Business Combination will be included in the proxy statement/prospectus for the proposed Business Combination when available. Additional Information The SPAC intends to file with the SEC a proxy statement/prospectus on Form F - 4 relating to the proposed Business Combination, which will be mailed to its stockholders once definitive. This Presentation does not contain all the information that should be considered concerning the proposed Business Combination and is not intended to form the basis of any investment decision or any other decision in respect of the proposed Business Combination. SPAC stockholders and other interested persons are advised to read, when available, the preliminary proxy statement/prospectus and the amendments thereto and the definitive proxy statement/prospectus and other documents filed in connection with the proposed Business Combination, as these materials will contain important information about the Company, the SPAC and the proposed Business Combination. When available, the proxy statement/prospectus and other relevant materials for the proposed Business Combination will be mailed to stockholders of the SPAC as of a record date to be established for voting on the proposed Business Combination. Stockholders will also be able to obtain copies of the preliminary proxy statement/prospectus, the definitive proxy statement/prospectus and other documents filed with the SEC, without charge, once available, at the SEC’s website at www.sec.gov. UK Disclaimer UK In the United Kingdom, this Investor Presentation is only being distributed to and is only directed at persons who are qualified investors within the meaning of Regulation (EU) 2017/1129 of the European Parliament and of the Council of 14 June 2017 (Prospectus Regulation) as incorporated into the law of the United Kingdom (UK) by the Prospectus (Amendment etc.) (EU Exit) Regulations 2019 (SI 2019/1234) and supplemented by Financial Services (Miscellaneous Amendments) (EU Exit) Regulations 2020 (SI 2020/628) who are (i) the investment professionals falling within Article 19(5) of the Financial Services and Markets Act 2000 (Financial Promotion) Order 2005, as amended (the "Order"), or (iii) persons falling within Article 49(2)(a) to (d) of the Order (high net worth companies, unincorporated associations, etc.) (all such persons together being referred to as "Relevant Persons"). This Investor Presentation is directed only at Relevant Persons and must not be acted on or relied upon by persons who are not Relevant Persons. Any investment or investment activity to which this Investor Presentation relates is available only to Relevant Persons and will be engaged in only with Relevant Persons. The securities described herein have not been and are not intended to be offered, sold or otherwise made available to and should not be offered, sold or otherwise made available to any person in the UK, except in circumstances which will not result in an offer of securities to the public in the UK within the meaning of Part VI of the Financial Services and Market Act 2000. EEA Disclaimer In member states of the European Economic Area (the “EEA”), this Investor Presentation is directed exclusively at persons who are "qualified investors" within the meaning of Regulation (EU) 2017/1129 of the European Parliament and of the Council of 14 June 2017 (Prospectus Regulation). 3 Disclaimer (2/2)

M i ta rbei ter k ü r z el Transaction summary 4 Sources $m Uses $m Equity roll - over 244 Equity roll - over 244 EUSG cash in trust 144 Founder shares 36 PIPE proceeds 156 Cash to balance sheet (3) 224 Founders shares 36 Debt repayment (4) 32 Partial cash out of Bosch minority stake 24 Transaction fees (5) 20 Total uses 580 T o ta l s ourc e s 580 28% 14% 25% 27% 6% ads - tec Holding (2) Bosch EUSG shareholders PIPE investors Founder shareholders Sources and uses Valuation Cash sources Capital s tructure P ro - forma o w nershi p ( 6) • $580m pro forma equity value - a highly attractive valuation versus listed EV peers (see page 35) • Existing cash in trust of ~$144m • ~ PIPE size of $156m • Existing shareholders ads - tec Holding (2) and Bosch will hold a combined ownership of ~42% • European Sustainable Growth Acquisition Corp (“EUSG”) is a publicly listed special purpose acquisition company (SPAC) with an estimated ~$144m of cash in trust • EUSG’s IPO in Jan, 2021 was based on the premise of supplying growth capital to European companies with proven, scalable and sustainability - focused technologies, propelled by consumer preferences. Transaction summary (1) About EUSG Notes: Figures throughout the entire presentation are based on the assumption that there are no redemptions. (1) Transaction summary is subject to confirmation of historical financials and vetting of projections based on, among other items, release of PCAOB audit as well as outstanding debt and cash position as of closing of the BCA; (2) ads - tec Holding is 100% owned by Thomas Speidel’s Family and his family’s charitable foundation; Thomas Speidel has a majority of the votes in ads - tec Holding; (3) Cash to balance sheet subject to adjustment based on actual debt repayment as permitted under the BCA, acquisition of shareholder loans, as permitted under the BCA, and actual transaction fees (4) Debt repayment amount subject to adjustment based on funding for additional operating expenses between signing and closing; (5) Transaction fees subject to adjustment as may be mutually agreed between EUSG, ads - tec Holding and Bosch; (6) Ownership overview (i) assuming no redemptions from the trust account of EUSG by public stockholders; and (ii) without taking into effect any ordinary shares issuable upon the exercise of outstanding warrants.

M i ta rbei ter k ü r z el ads - tec Energy Thijs Hovers C o - CEO EUSG Pie ter Ta se la ar C o - CEO EUS G , Dire c tor Elain e W e id ma n Grunewald Director – ESG Ba z m i Hus a in Senio r Ad v i s o r La rs Thunell Chairman, Director Kara n Trehan President, Director ads - tec Energy / EUSG key people Aaron Greenberg Pro je c t M anage r Wilco J is k oot Director Thomas Speidel Founder & Chief Executive Officer 20+ yrs experience Robert Vogt Ch i e f F i nan c ial O ff i c e r 14 yrs experience Thorsten Ochs Chief Technology Officer 20+ yrs experience Hakan Konyar Chief Operating Officer 24 yrs experience European Sustainable Growth Acquisition Corp. (EUSG) John Neville Chief Sales Officer (Incoming) 30+ yrs experience 5

M i ta rbei ter k ü r z el Technology leader in ultra - fast DC charging • Ultra - fast 320 kW power battery buffered DC charging, allowing charging in minutes even on low powered 30 kW grid connection • Battery buffered solution offers lower total cost of ownership vs. expanding grid off the highways • Defensible technology platform years ahead of competition with a leading IP and a large patent portfolio (50+) • Blue - chip investor in Bosch with 39% and customer base including: Porsche, BP, Swarco, and TEAG • Well defined technology platform and roadmap certified independently in the US and EU • Product pipeline includes a proprietary DC home charging solution that will be white - labelled to large businesses Strong industry tailwinds • Strong long - term growth in EVs driving substantial investment in fast charging infrastructure • Green legislation and corporate commitments driving a rapid electrification of the auto fleet and supporting infrastructure • Increasing number of EVs able to tap into ultra - fast DC charging • Government infrastructure plans in the US and EU directly supporting build - out of EV charging infrastructure Highly scalable platform addressing multiple market segments • Multi - channel B2B market access and highly flexible revenue model • Large range of institutional customers through both branded and white label products • Established footprint in Europe with clear plan to roll - out platform across the US • Extensive in - house manufacturing facility with production capacity intended to permit over - delivery of business plan • Highly experienced management team and sales force Compelling valuation and fully funded business plan • Fully funded business plan with an additional cash buffer to provide flexibility for strategic investments • Excellent near term revenue visibility underpinned by an order book of 70% of FY21E revenue and a solid pipeline • Business plan accounts for a 95% sales CAGR from 2021 - 2025, with room for further growth • Increasing levels of recurring revenue from integrated software offering and various services • Very attractive valuation vs. competition - 1.5x FY23E revenue and 0.9x FY24E revenue Enabling the transition to a low carbon economy 6 • ESG at the heart of the business – strong commitments to responsible business and good governance principles • Real solutions to accelerate the transition to net zero emissions • Front - runners in advancing circular economy Executive summary

M i ta rbei ter k ü r z el ESG at the heart of our business En v ironm e nt Member and industrial sponsor of clean battery research initiative Driving the transition to a low carbon economy with key enabling technology addressing customer needs and overcoming real world restrictions Reduction of CO 2 footprint and implementation of circular principles in the company’s facilities (e.g. PV energy supply for buildings and vehicle fleet, waste prevention, LED lighting) Promoting gender equality and diversity in the hiring and promotion process has led to a high percentage of women as employees (25% vs.15% female students in relevant degrees) Promoting work - life balance (i.e. flexible working hours, home office possibilities, 30 days leave for every employee, preschool allowance) Active support of the community - national and international social projects with NFPOs Supporting employee health & safety with trainings, occupational health & safety specialist, free fitness, company doctor, annual health checks, etc. Energy efficiency at the core of our value proposition, with an award winning clean tech patent portfolio to prove it Committed to circular economy and ISO 14001 on track for 2021 Commitment to a code of conduct to promote good corporate governance in the company Zero tolerance towards corruption Committed and purpose driven culture focused on continuous improvements Fully digitized production process with error detection and traceability R&D project for independence from battery producers in order to implement ESG standards in the supply chain Society Governance Clear management responsibilities and accountability 7

M i ta rbei ter k ü r z el Accelerating the transition to clean energy and decarbonisation Climate change innovation at the heart of ads - tec Energy’s mission and values “Top Innovator” in the advancement of climate protection. The award was based on a global innovation study on patents > 5 0 c l e an - tech p a te n ts I S O9 0 00 c o m p l i a n t I S O1 4 0 0 0 o n g oi ng Complete in - house pro d ucti o n fa c ili t i e s based Germany Enabler of an all electric world, directly supporting the Paris Climate Agreement targets Supporting goals 9 & 13 of the UN Sustainable Development Goals with scale up of electric, low carbon infrastructure Front - runners in advancing circular economy: advanced materials database, reduce haz substances, energy performance, and end of life treatment “ Top innovator” in 2021 for Climate Protection Technologies 8

M i ta rbei ter k ü r z el ads - tec Energy’s key differentiators 9 Defensible technology with IP protection 2 >50 essential c l e a n - tech p a te n ts registered 2021 “ Top innovator” for Climate Protection Technologies 1 Ultra - high power DC charging in minutes even on low power grids Boosted to 320 kW charging power 100 mile range in ~10 mins (2) 30 – 110 kW required power grid Blue - chip investor and customer base 3 S ig n ific a nt s h are h older Blue - chip partner Scalable and secure platforms replicable globally 5 ~$54m (1) FY20A revenue Strong pipeline Scalable esta bli s h e d production Enabling the transition towards a low carbon, intelligent and “all electric economy” with a strong commitment to ESG principles 4 In d u s tr i al R e s id e nt i al DC EV charging Notes: (1) Based on EUR/USD exchange rate of 1.1422 for FY20A; (2) Calculated based on 250 kW charging power due to current car limitations on output and capability

M i ta rbei ter k ü r z el Battery buffered ultra - fast charging is a key enabler for EV adoption With increasing EV adoption there is a need for battery - based ultra - fast charging 10 Relative low installation costs of battery buffered UHP chargers allow easy transfer to most attractive locations Battery buffered UHP chargers have often substantially lower TCO than grid connected DCFCs plus grid upgrade Battery buffered UHP chargers ideally complement local renewable energy sources near by Why ultra - fast charging? Low consumer acceptance for long charging periods Why battery buffer? Infrastructure cannot always be upgraded to support a sufficient number of ultra - fast chargers Required for successful EV adoption Independency from grid network enables durable and constant output performance of up to 320 kW Charging in minutes allows rapid customer turnover for operators by minimizing charging time Maximizing charging experience due to reliably short charging time and customer reach For long distances, emergencies and ride - hailing UHP charging is vital for continued adoption of EVs Future - proof technology providing up to 320 kW of charging power

M i ta rbei ter k ü r z el Where does the Power and Energy come from to charge all these upcoming electric vehicles? 11 Energy (kWh) ► It takes a long time to fill the same basin (car battery) with the same amount of water (Energy) using “low power” and a very short time to fill it with high power ► At many locations our grids are not providing high power ► ads - tec Energy has solved that problem What is the difference between Power and Energy High power 250kW Require time (2) ~10 mins Low power 10kW Require time (2) ~4 hrs What is the energy demand of an electric vehicle? Energy for 100 miles mileage is about 40 KWh The electro mobility is limited not due to low energy capacity but rather due to low power from the grid Sources: Management information, company data Energy requirements per year (1) 1 car ~4 MWh 1 million cars ~4 T Wh 10 million cars ~40 T Wh Note: (1) Illustrative example calculation assuming average per year and per car mileage of 10,000 miles with 0.4kW requirement per 1 mile. TWh stands for terawatt - hour and is equivalent to 1,000,000 MWh; (2) Required time to charge ~100 miles assuming 40kW per 100 miles Germany’s excess energy exported (2016) ~50 TWh

M i ta rbei ter k ü r z el ads - tec Energy’s EV charging platform is built to be future proof - benefitting from improvements in battery technology and insufficient grid infrastructure 12 Grid power will remain the bottleneck to ultra - fast EV charging Battery’s technology & performances are improving Sources: Global EV Outlook 2020, Bloomberg NEF Leader in development of battery buffered ultra - fast EV chargers 10+ years of experience with strong R&D capabilities >50 IP patents and certified battery buffered offering in EU and US Significant and continuous improvements in battery technology , will enable: x Increased EV range By 2030, battery electric vehicles to reach an average driving range of ~ 220 - 250 miles x Reduced charging times New EV models launched already allow ~150kW+ power charging Power (kW) x Time (h) = Energy (kWh) • Future EV’s batteries will allow faster charging which will increase the demand for ultra - fast charging • Speed of EV charging is dependent on the power input the EV receives from the charger • Existing grid infrastructure insufficient to provide power required for ultra - fast DC charging Battery buffered EV charging solutions enabling ultra - fast DC charging even on low power grids

M i ta rbei ter k ü r z el Future proof technology to charge BEVs in minutes With our technology current and new BEVs can charge as fast as the car allows 13 Sources: EV - Database.org, company data Notes: (1) Illustrative selection, model specifications and figures based on EV - database.org; (2) Expected for 2021; (3) Available grid power and capability of car provided; (4) Assuming a power consumption of 40kW per 100 miles; (5) Calculated for 10kW charging power; (6) Calculated with 50kW charging power; (7) Calculated for 250 kW charging power (output & car capability provided) Porsche Taycan 270kW Tesla Model 3 Perf. 250kW Polestar 2 Long Range 150kW VW iD.4 1 st 126kW Ford Mach - E GT 150kW Hyundai IONIQ 5 LR AWD 232 kW Kia EV6 >200kW (2) Audi E - tron 150kW Level 1 (≤1.9 k W ) Level 2 (3 . 7 - 22 k W ) Ult ra - fa s t ( >150kW) FC (>5 0 k W ) BEV models & max. charging power (1) Charging time (3) Battery - buffered DC charging Integrated battery buffer Up to 3 2 0 kW power Output to car ~21 hrs ~10 mins (5) ~4 hrs (7) Standard low power grid connection (30 - 110kW) Continuous battery charging (6) ~50 mins How long do 40 KWh ( ~100 m il e s ) (4) take to charge?

M i ta rbei ter k ü r z el ChargeBox (320kW) ChargePost (300kW) L i quid cooled DC cable Co m ple te l y noiseless CBX can be built at a distance of up to 100 meters from dispenser Up to 320 kW DC charging power Up to 85’’ ad v e rt is ing display up to two DC outlets Battery capacity up to ~ 200 kWh Semi - mobile / no c on s tru c t i o n needed Low power grid connection Deplo y m en t expected H2 22 Regardless of available grid performance Ultra - Fast Charging: recharging in minutes vs. hours Mobile ChargeTrailer (3,200kW) Si m ul ta neou s c harging option of 10 cars Fully mobile power charger Suitable for high - traffic routes and events of EVs 14

M i ta rbei ter k ü r z el Patent portfolio provides strong protection for key technologies Battery buffered energy systems Key technological advantages Enabled by a highly integrated technology Award winning IP (>50 patents) 1 Battery module Inverter tec hnology 2 3 HVAC and System Design Technologies developed over 10 years add up to sustainable competitive moats UHP charging even on limited grids Low noise / high power density Compact unit, very limited footprint Avoids expensive grid expansion x x x x x 100% development depth secures ability to act over decades x x Software, data and security turns hardware into intelligent eco - platforms 15

M i ta rbei ter k ü r z el 16 Sources: Eurelectric, Bloomberg NEF Note: (1) Calculated for new # of public and commercial connectors >150kW in 2020 multiplied by the average 2020 hardware cost per connector per power output (excl. China), Bloomberg NEF; Cumulative global connectors for public and commercial segments with hardware power greater than or equal to 150kW (excl. Home and Work) ~30% CAGR in EV demand (2020 - 2025) Ultra - fast charging (>150kW) accounting for ~ 71% of global EV charger hardware revenues (1) Most existing power grids in Europe & USA are not designed for area wide ultra - fast charging ~€400bn grid expansion costs already expected until 2030 just in Europe. Massive government funds dedicated to EV infrastructure are expected Ultra - fast DC chargers are critical to meet EV demand Cumulative global ultra - fast (>150kW) connectors installed by category (000s units) (2) 352 549 188 124 315 488 311 668 1,037 2 0 20 2 0 2 5 2 0 3 0 Public Commercial Ultra - Fast Charging as key component to EV infrastructure Ultra - fast (>150kW) share of global EV charger hardware sales ($) (1) 71% FY20A

M i ta rbei ter k ü r z el 17 “Future - proof” charging solutions enabling ultra - fast charging everywhere R e s iden t ial U rban H igh w ay R ural Comm e r c i a l “Charging - on - the - go” will be relevant to all segments and locations

M i ta rbei ter k ü r z el Universe of potential customers for DC ultra - fast charging increasing Ultimate opportunity Convenience is going to be the next big hurdle for electric vehicles, beyond these early adopters who think it’s cool to hang around a charging station for an hour and talk about their vehicles Lucy McKenzie, Lead author Atlas Public Policy study (April 2021) “ Cumulative ultra - fast public and commercial connectors (#) (1) 3 1 1k 1 , 0 37 k 2030 2020 Source: Bloomberg NEF Note: (1) Global number of EVs in circulation excluding China Fast followers First movers ” Fleets Hotels Retail Fuel stations Utilit i e s Local authorities Commercial Charging opera tors 18

M i ta rbei ter k ü r z el Reviews from industry leading brands Selected reviews TEAGs first HPC in Thuringia We have now used the trucks mobile ChargeTrailer at numerous events all over Europe and have carried out around 5,000 charging operations – sometimes at extreme temperatures down to minus 40 degrees. Their performance has therefore been tried a nd teste d Ragnar Schulte, Director Experimental Marketing at Porsche ads - tec Energy’s HPC boosters are an ideal addition to our e - mobility portfolio . Now we can also offer our complete ” “ service to companies with power - limited grids Marcus Anders, Managing Director at SWARCO We can finally bring HPC chargers to places where because of a lack of space and limited grid resources , it was before only possible with uneconomically high costs: to city centres, supermarkets or even gas stations and car dealerships. Now we can set up fast - charging hubs that enable fast and convenient charging for this customers “ Dr . Andre as Roß, CT O ” a t TEAG “Microgrid” pilot project in Berlin where ads - tec Energy’s HPC charging solution is used The technological heart of the system are the two ultra - fast charging points , which are supplied by a buffer battery. With this… we can also provide ultra - fast charging in places where the local power grid does not provide the technical or commercial prerequisites ” “ Alexander Junge, Director BP Electrification ” 19 “

M i ta rbei ter k ü r z el Proven capabilities with existing customers Certified ChargeBox in Europe and US Existing & replicable manufacturing capabilities ads - tec Energy has a mature technology > 900 UHP Dispensers delivered > 430 Ch a r g e B o x e s delivered Established and proven production in Germany (existing) Can easily be replicated to US & globally 20
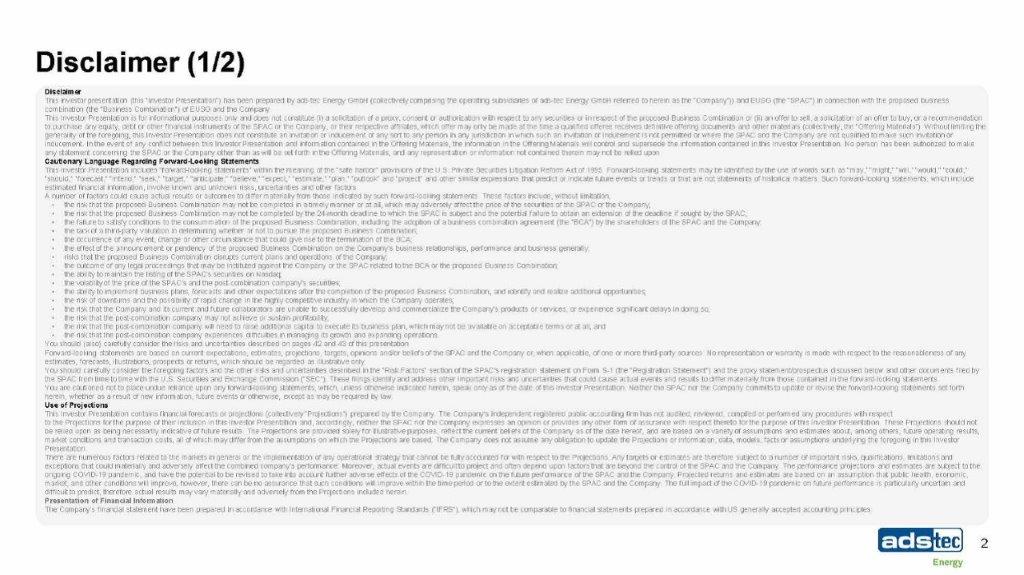
M i ta rbei ter k ü r z el $54m $59m $38m $26m $25m $24m $14m $8m $6m $6m Player of existing scale; combining DC with grid’s limitations 21 Boosting grid performance with integrated battery Players in the EV charging value chain (Revenue 2020A) (1) $146m $80m Sources: CapIQ as per 29/07/2021, investor presentations, company information Notes: (1) FY20A figures converted to USD ($) using EUR/USD exchange rate of 1.1422, NOK/EUR exchange rate of 0.1161; (2) Illustrative figures based on the assumption that without a battery buffer, a like - for - like power input to power output is required (assuming 100% efficiency) Ultra fast C ha r ger s pe c i f i cat ions c harg ing enab led by battery usage Battery integrated x x Required grid power (for max. output, kW) (2) 30 350 350 350 50 22 100 22 350 350 175 n.a. Power output (kW) 320 7 – 350 7 - 350 50 - 350 11 - 50 <22 7 - 100 7 - 22 50 - 350 50 - 350 7 - 175 <50

M i ta rbei ter k ü r z el Strong long - term growth in EV vehicles across Europe and US Sources: Bloomberg NEF Notes: (1) Average internal combustion engine (ICE) price based on the US medium car segment; (2) BEVs and PHEVs passenger vehicle fleets; (3) Selected OEMs, does not represent an exhaustive overview 22 2.2 2.9 3.9 5.3 6.9 8.9 1.6 1.9 2.2 2.7 3.5 4.5 3 .8 4 .7 6 .1 8.0 10 .4 13 .3 2 0 20 2 0 21 2 0 22 2 0 23 2 0 2 4 2 0 25 23% 32% CAGR ’20 – ‘25 Total cumulative passenger EV sales (2) (million of EVs) Stimulating demand for EVs $0 $10 $20 $30 2020 2022 2024 2026 2028 2030 EV Battery Price EV price (Vehicle + Powertrain) ICE Price EV cost arriving at an inflexion point US medium car segment EVs price vs ICE price (1) ($000s) $40 Traditional OEMs (3) New EV OEMs (3)

M i ta rbei ter k ü r z el Exceptional EV demand will trigger a substantial investment in fast charging infrastructure Source: Bloomberg NEF 23 $0 $ 1 00 2 0 20 2 0 25 2 0 40 Supporting a strong raise in the global Public and Commercial charging infrastructure investment Billion $200 Public fast 2030 Commercial 2035 Public slow Ultra - fast fast utilisation expected to increase globally 0 3 0 0 2 0 0 1 0 0 4 0 0 7 0 0 6 0 0 5 0 0 2 0 20 2 0 25 2 0 30 2 0 35 2 0 40 BEVs per ultra - fast charger U.S. Eur o pe
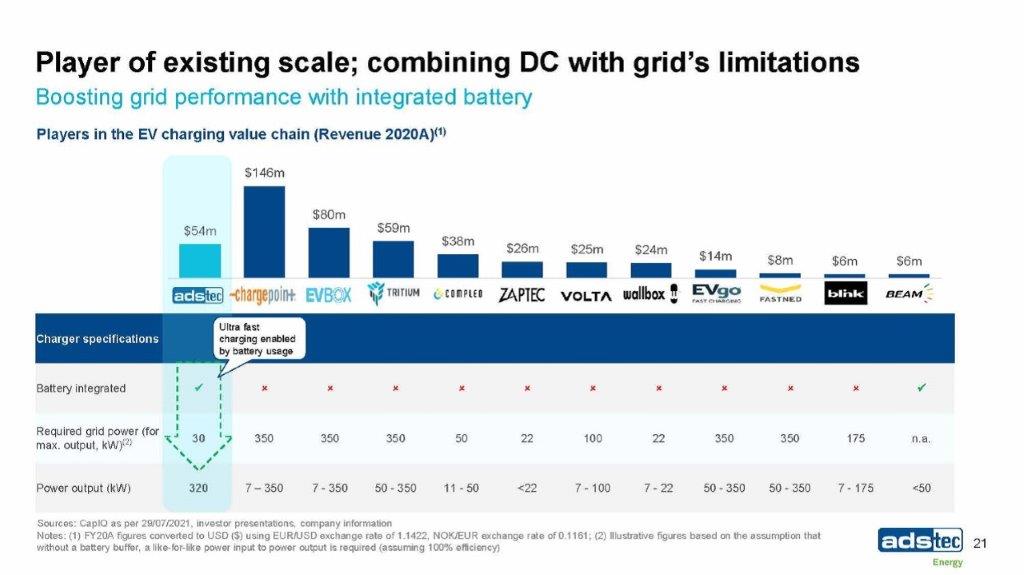
M i ta rbei ter k ü r z el Legislation and corporate commitments will likely drive rapid electrification of the auto fleet Note: (1) Global EV Outlook 2021, IEA. European Union refers to the collective pledge of 27 member states; (2) ZEV stands for zero emission vehicles (BEVs, PHEVs and F CEVs) 24 2025 Internal combustion engine bans or electrification targets Net - zero emission pledges 2030 203 5 2040 2045 2050 100% e l e ctr i f i ed sa l e s 100% ZEV (2) sales Net - zero pledge Announced order of ~100k BEV light - commercial vehicles with a goal to have a full deployment by 2030 Reportedly investing ~€7bn in climate - neutral logistics by 2030. Announced target net - zero emissions logistics by 2050 Announced further acceleration of e - campaign, expecting all - electric to exceed 70% in Europe and 50% of Chinese and US sales volumes by 2030 Reportedly targeting to electrify the entire Mercedes - Benz auto portfolio by 2022 Pr es ident B iden Reportedly announced plan for a transformational $7.5bn investment to fund and build a network of EV charging stations (July 2021) 20+ countries have electrification / ICE bans for cars, 8 countries + EU have announced net - zero pledges (1)

M i ta rbei ter k ü r z el Fully integrated eco - platforms enabling an all - electric energy system Serving EV - Charging, Residential as well as Commercial & Industrial segments + + Dat a - dri v e n ser v i c es So f t w are Ba tt e ry m anage m en t System (BMS) E ne r gy m anage m ent system (EMS) Data - driven services & over - the - air updates Hard w a re Battery buffered Ultra - fast EV charging Battery storage solutions Residential Commercial & Industrial S e m i - m obile 300 kW Mobile 3 , 20 0 kW Stationary 320 kW Functionality, security, highest integration density Optimization and data acquisition on all levels Customers x Car OEMs x Energy provid e r s x C harge Oper a t o r s x Instal l e r s x Network Ope r a t o r s x V e rti ca l segm e nt C&I partners x V e rti ca l segm e nt res i d e n t i a l part ne r s 25
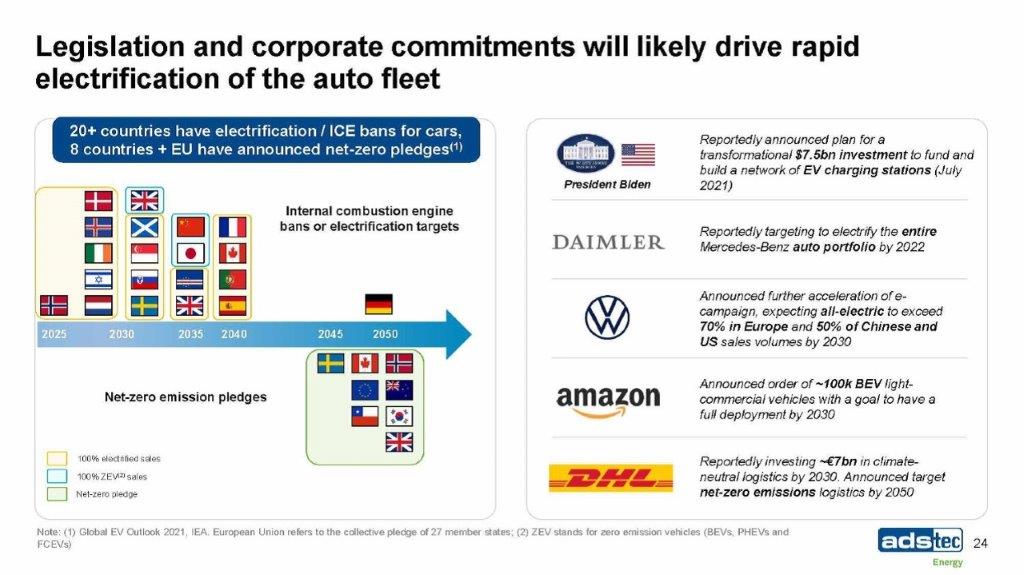
M i ta rbei ter k ü r z el Strong product roadmap based on existing technology 2022 2023 Next generation PowerBooster Expected launch: H1 2023 ChargePost Expected launch: H2 2022 MyPowerPlant Expected launch: H2 2023 1980 2009 2010 2011 2014 2016 2017 2018 2020 Founding of ads - tec GmbH New production site in Wilsruff, Dresden (Germany) Strategic focus on energy and IT New headquarters opened in Nutringen Start of R&D for energy storage solutions First pilot application in eMobility inf ra st ru ct ur e Carve - out of ads - tec Energy subsidiary Acquisition of 39% shares of ads - tec Energy by Bosch Delivery of first 100 High - Power Chargers Partnership with Porsche for the development of the HPC 26

M i ta rbei ter k ü r z el Note: ads - tec Energy is forecasting launch of MyPowerPlant in the second half of 2023 27 x Integrated all - in - one home solution x Unique technology - highly efficient, enabling DC to DC transmission End customers Ha r d w a r e Future partners for example x Significant cost advantages to end customer x Fully cloud connected with IoT applications In - house development x Enabling future power companies to run their new energy business models “MyPowerPlant” is our answer to sector coupling and CO 2 reduction at home MyPowerPlant Expected product launch: H2 2023 Residential

M i ta rbei ter k ü r z el 2019 2024E Sources: “European Market Outlook” Solar Power Europe, Eurelectric, IEA New Policies Scenario Note: (1) “European Market Outlook” Solar Power Europe, High Scenario forecasting 1 GWh of home storage additions in 2020 In order to optimize the usage of renewable energy at home a battery is key With sector coupling at home an effective smart grid management can be realized MyPowerPlant for sector coupling at home Allows the integration of PV, battery storage, DC charging and energy management in one platform Annually installed residential battery storage systems in Europe (1) 2,000 in M W h 700 23.4 % 28 Exponential growth in Residential 31 53 85 2015 2016 2017 2018 2019 2020 2021E Germany had more than 1.7m active PV systems in 2019 being the main driver of the increasing demand for battery storage systems at home Innovative battery storage solutions store energy produced by decentralized energy sources during times of low consumption and feed it back at peak times, thereby improving the power quality Germany – Market proof Cumulative installed residential battery storage systems in Germany (2) in k units 385 285 185 125 S our c e : I SEA R W T H A a c he n Note: (2) ISEA RWTH Aachen and an estimate of 3Energy Consulting

M i ta rbei ter k ü r z el 29 Container Systems PowerBooster Rack Systems x State - of - the art, scalable storage solutions (up to multiple MW) x 100% in - house development x Enabler of smart grid applications and future sector decoupling x Optimizing energy flows, grid utilisation and services x References with established and well known companies Peak shaving & grid services Self - consumption Hybrid power plants Primary control reserve Microgrid (off - grid) EV charging Commercial & Industrial: storage is key to electrify the transition Intelligent storage systems provide critical flexibility Comprehensive range of product solutions Use cases
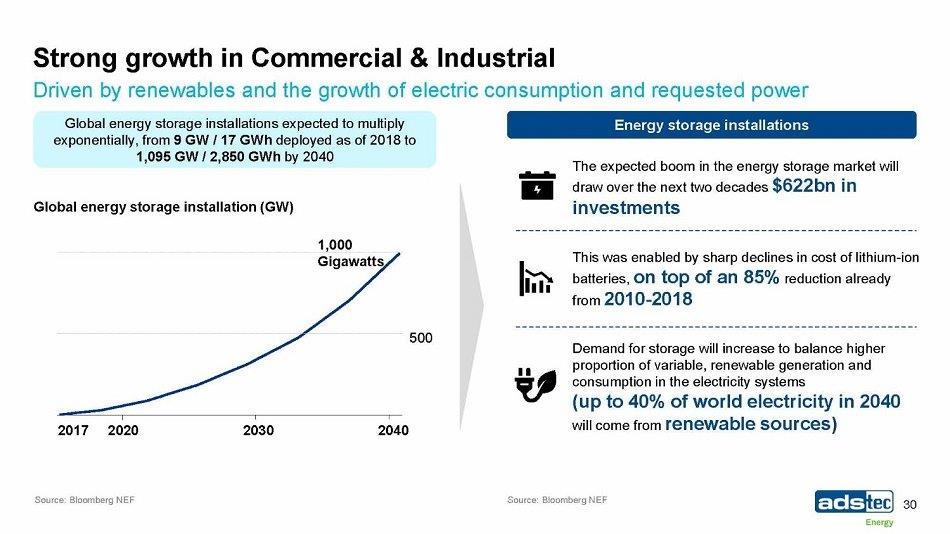
M i ta rbei ter k ü r z el Strong growth in Commercial & Industrial 30 Driven by renewables and the growth of electric consumption and requested power Source: Bloomberg NEF Energy storage installations 500 1 , 000 Gi ga w at t s 2017 2020 2030 2040 Global energy storage installations expected to multiply exponentially, from 9 GW / 17 GWh deployed as of 2018 to 1,095 GW / 2,850 GWh by 2040 Global energy storage installation (GW) The expected boom in the energy storage market will draw over the next two decades $622bn in investments This was enabled by sharp declines in cost of lithium - ion ba t t eries, o n t o p o f an 85% r eduction al r eady from 2010 - 2018 Demand for storage will increase to balance higher proportion of variable, renewable generation and consumption in the electricity systems (up to 40% of world electricity in 2040 will come from renewable sources) Source: Bloomberg NEF

M i ta rbei ter k ü r z el Multi - channel market access & flexible revenue model We serve all channels in a rapidly evolving ecosystem heading an all - electric world Har d w a r e S er v i c es So f t w are ads - tec platform B2B channel offering Se le cte d c usto m er t y pe s C ustomers EV O EMs Energy pro v iders EV charging operators I ns t a l lers Network O pera t ors Vertical segment partners C&I and residential Start - ups Data ads - tec branded pla t f orm White - label platform • ads - tec sells branded and white - label products to customers • White - label product allows ads - tec Energy to: • Sell its platform to network and charging operators • Distribute its solutions through its blue - chip partners distribution network Revenue streams Service fees / subscription Direct sales Financing / leasing 31

M i ta rbei ter k ü r z el Recurring revenue from integrated software offering and data - driven services Energy management software x Peak shaving x Self - consumption optimisation x Emergency power supply x Deep discharge protection • Direct access to cell level data enabling key insights in: x Cell aging x Behaviour (i.e. temperature) x Performance • Calculation of SOC, SOH, SOF Customers can control & manage “high - value” controls directly online (via App, desktop) Battery management software Data - driven services Pre di c t i on ba s ed services & data analytics Over the air updates of hardware firmware Dat a c olle c t i on and cloud - ba s ed s to rage Physical ser v ices in c l. training 24/7 remote access to platform components BAT - X for cell performance agreements Alerts, au to m a te d messages API connectivity Security / firewall / c e rt i f ic a tes / VPN channels 32

M i ta rbei ter k ü r z el Revenue projections by division Note: (1) IFRS financials, 6 - month average USD/EUR exchange rate of 1.20522, IFRS financials. Projections constitute forward - looking statements that are subject to inherent uncertainty and rely in part on historical financials that are subject to change 33 30 67 183 283 439 2021E 2022E 2023E 2024E 2025E EV ch a rg i ng x Launch of ChargePost in FY22E x Market entry into US expected in FY22E n /a n /a 19 81 137 2021E 2022 E 2023E 2024E 2025E Residential EV charging ($m) (1) Residential ($m) (1) x Launch of Residential product offering with MyPowerPlant in FY23E x Market entry in the US expected in FY24 15 11 24 27 32 2021E 2022E 2023E 2024E 2025E Commercial & Industrial Commercial & Industrial ($m) (1) x Launch of new PowerBooster generation (including MultiScale) replacing current generation in FY23

M i ta rbei ter k ü r z el Platform of scale with good near term visibility 34 • Strong growth primarily driven by : x Favourable market developments x Geographic expansion : US launch in 2022 x Product launches : EV charging (FY 22 ), Residential (FY 23 ) and Commercial & Industrial (FY 23 ) • Very high revenue visibility for FY 21 E 70% 25% 4% 70% FY 21 E orde r book F Y 2 1 E Key financials ($m) (1,2) Notes: (1) Historical financials converted to USD ($) using EUR/USD exchange rate of 1.1195 for FY19A and 1.1422 for FY20A. Projected financials converted using 6 - month average USD/EUR exchange rate of 1.20522, IFRS financials; (2) Historical financials are subject to release of PCAOB audit upon signing of BCA as well as confirmation with respect to outstanding debt and cash position, and projections constitute forward - looking statements that are subject to inherent uncertainty and rely in part on historical financials that are subject to change; (3) Capex is a combination of investment in tangible and intangible assets, capex figures converted using EUR/USD exchange rate of 1.1234 for FY19A and 1.2271 for FY20A Dec ye, $m FY19A FY20A FY21E FY22E FY23E FY24E FY25E EV charging 16 46 30 67 183 283 439 Residential 0 0 0 0 19 81 137 Commercial & Industrial 3 6 11 15 24 27 32 Services 2 1 2 3 6 12 21 Revenue 21 54 44 85 233 403 629 Growth 153% (23%) 95% 173% 73% 56% Gross profit (4) 2 4 13 59 116 205 Margin n/m 4% 9% 15% 25% 29% 33% EBITDA (10) (7) (6) (12) 18 56 131 Margin n/m n/m n/m n/m 8% 14% 21% Capex (3) 7 8 12 23 33 41 40 • In 2020, an OEM customer made an exceptionally large contribution to 2020 revenue primarily due to: – A large order to equip its retailers with ultra - fast chargers – Order of large charging trailers (no order of large trailer in 2021 , mainly due to the lack of large event)

M i ta rbei ter k ü r z el Compelling valuation priced relative to peers Sources: CapIQ data as per 29/07/2021 Notes: (1) Refer to page 36 - 39 for further information on peer group valuation metrics, median figures displayed; (2) ChargePoint excluded from FY24 EV/EBITDA calculation; (3) Projections constitute forward - looking statements that are subject to inherent uncertainty and rely in part on historical financials that are subject to change 35 1 . 5 x 4 . 4 x 5 . 8 x 6 . 3 x 4 . 7 x 4 . 1 x 0 . 9 x 3 . 0 x 4 . 1 x 4 . 6 x 4 . 6 x 2 . 7 x A p er t a E V OE M s 2023 2024 2023 2024 EV charging de - SPAC peers 2023 2024 Other listed EV charging peers 2023 2024 EV focused energy storage solutions 2023 2024 Stationary clean - tech 2023 2024 EV / Revenues (1) 6 . 3 x 28 . 1 x 15 . 3 x 31 . 4 x 17 . 1 x 32 . 0 x 2 . 7 x 9 . 1 x 13 . 6 x 30 . 4 x 13 . 5 x 25 . 3 x A p er t a Other listed EV charging peers EV focused energy storage solutions Stationary clean - tech E V OE M s EV / EBITDA (1) 202 4 2025 2024 (2) 2025 EV charging de - SPAC peers 202 4 2025 202 4 2025 202 4 2025 202 4 2025 Illustrative EV / revenue range 4x – 7x re v e nu e P ro forma EV $356m 2023E revenue (3) $233m

M i ta rbei ter k ü r z el Listed comparable companies universe 36 E V O E M s Stationary clean - tech EV focused energy storage solutions SPAC merger EV charging players Listed EV charging businesses Other listed EV charging players
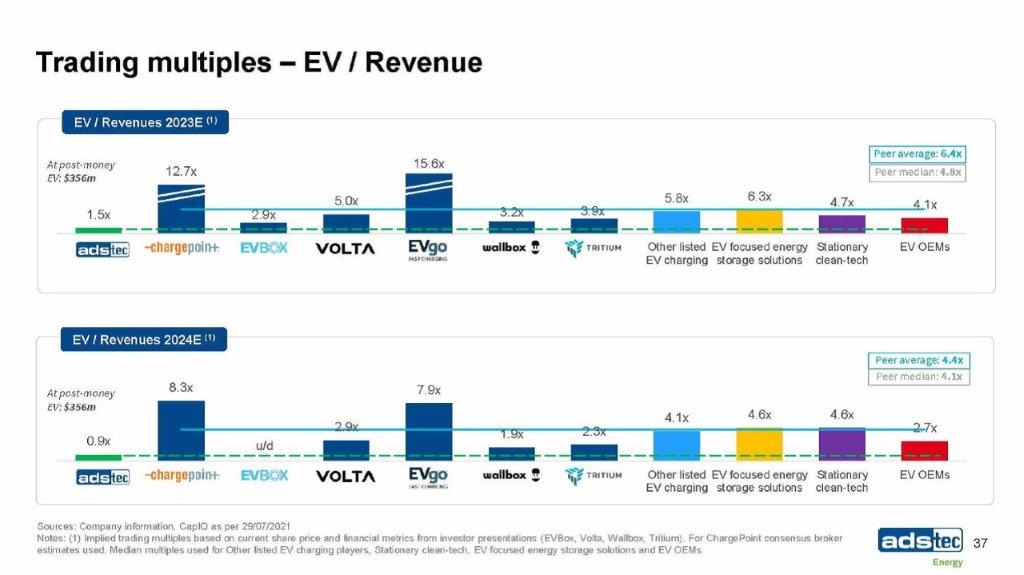
M i ta rbei ter k ü r z el Trading multiples – EV / Revenue Sources: Company information, CapIQ as per 29/07/2021 Notes: (1) Implied trading multiples based on current share price and financial metrics from investor presentations (EVBox, Volta, Wallbox, Tritium). For ChargePoint consensus broker estimates used. Median multiples used for Other listed EV charging players, Stationary clean - tech, EV focused energy storage solutions and EV OEMs 37 0 .9x 8 .3x 2 .9x 7 .9x 1 .9x 2 .3x 4 .1x 4 .6x 4 .6x 2 .7x A p er t a C h a r ge P oin t E V B ox V O L TA E V g o Wa ll bo x T r i t ium Other listed EV focused energy Stationary EV charging storage solutions clean - tech E V OE M s u /d 1 .5x 12.7x 2. 9 x 5 .0x 15 .6x 3 .2x 3 .9x 5 .8x 6 .3x 4 .7x 4 .1x A p er t a C h a r g e P oi n t E V B ox V O L TA E Vg o Wa llb o x T r i t i u m Other listed EV focused energy Stationary EV charging storage solutions clean - tech E V OE M s At p os t - m o n ey E V : $356m Peer average: 6.4x Pe e r m e d i a n : 4.8x Pe e r a v er a g e : 4 . 4 x Pe e r m e d i a n : 4 . 1 x EV / Revenues 2023E (1) EV / Revenues 2024E (1) At p o st - m o n ey EV: $356m

M i ta rbei ter k ü r z el 2 .7x 79.4x u /d 5 .6x 13 .4x 12 .0x 6.3x 13. 6 x 30 .4x 13 .5x 25 .3x A p er t a C ha r ge P o i n t E V B o x V O L TA E Vg o Wa llb o x T r i t i u m Other listed EV focused energy Stationary E V OE M s 6 .3x 154.1x u /d 12 .9x 43 .2x 56 .4x 10 .1x 31 .4x 15. 3 x 17.1x 32 .0x A p er t a Cha r ge P o int E V B o x V O L TA E V g o Wa ll bo x T r i t ium E V OE M s Other listed EV focused energy Stationary EV charging storage solutions (2) clean - tech Trading multiples – EV / EBITDA Sources: Company information, CapIQ as per 29/07/2021 Notes: (1) Implied trading multiples based on current share price and financial metrics from investor presentations (EVBox, Volta, Wallbox, Tritium). For ChargePoint consensus broker estimates used. Median multiples used for Other listed EV charging players, Stationary clean - tech, EV focused energy storage solutions and EV OEMs; (2) Based on FY23 median multiples; (3) Peer average excludes ChargePoint; (4) Excludes Blink Charging and FY24 multiples for Compleo and Fastned due to unavailability datapoints in FY25; (5) Median FY24 multiples used. 38 Peer average (3) : 27.3x Pe e r m e d i a n : 24 . 2 x Peer average (3) : 15.0x P e e r m e d i an : 13 . 4 x EV / EBITDA 2024E (1) EV / EBITDA 2025E (1) At p os t - m o n ey E V : $356m At p os t - m o n ey EV: $356m EV charging (4) storage solutions (5) clean - tech

M i ta rbei ter k ü r z el Operational benchmarking Sources: Company information, CapIQ as per 29/07/2021 Notes: (1) ChargePoint using consensus broker estimates. Investor presentation data used for companies currently under - going de - SPAC; (2) EVBox revenue growth from FY21 – FY23 due to unavailability of data thereafter; (3) Based on 2024E gross margin figures; (4) Based on 2023E gross margin figures; (5) FY23E EBITDA margin used for Stationary clean - tech and EV energy storage peers 39 63% 76% 119% 154% 114% 93% 74% 41% 22% 46% A p er t a Cha r ge P o int E V B o x V O L TA E V g o Wa ll bo x T r i t ium Other listed EV focused energy Stationary EV charging storage solutions clean - tech E V OE M s Pe e r a v er a g e : 80% Pe e r m e d i a n : 75% Revenue growth (%) (1) CAGR 2021E - 2024E 110% 33% 32% 38% 53% 58% 43% 44% 35% 26% 24% 19% A p er t a Cha r ge P o int E V B o x V O L TA E V g o Wa ll bo x T r i t ium Other listed EV focused energy Stationary E V OE M s Pe e r a v er a g e : 37% Pe e r m e d i a n : 36% Gross margin (%) (1) 2025E EV charging (3) storage solutions (4) clean - tech 7% u /d 31% 32% 10% 23% 17% 18% 23% 16% A p er t a Cha r ge P o int E V B o x V O L TA E V g o Wa ll bo x T r i t ium Other listed EV focused energy Stationary EV charging storage solutions clean - tech E V OE M s Pe e r a v er a g e : 20% Pe e r m e d i a n : 18% EBITDA margin (%) (1)(5) 2025E 21% ( 2 ) ( 4 )

M i ta rbei ter k ü r z el A p pe n dix 40

M i ta rbei ter k ü r z el Financial statements 41 Source: Company information Note: Historical financials based on IFRS standards. Historical P&L financials converted to USD ($) using EUR/USD exchange rate of 1.1195 for FY19A and 1.1422 for FY20A. Historical balance sheet and cash flow items converted using EUR/USD exchange rate of 1.1234 for FY19A and 1.2271 for FY20A. Historical financials are subject to change based on PCAOB audit as well as confirmation with respect to outstanding debt and cash position. P&L Dec ye, $m FY19A FY20A Sales 21.4 54.1 Cost of sales (24.9) (52.0) Gross profit (3.5) 2.1 Selling and general administrative expenses (6.6) (8.6) Other (0.7) (2.8) EBIT (10.8) (9.4) Financial result (1.0) (2.4) EBT (11.8) (11.8) Cash flows Dec ye, $m FY19A FY20A Profit for the period (13.5) (12.6) Amortisation and depreciation 0.6 2.0 Finance income / expense 1.0 2.6 Gain/loss on disposal of property, plant & equipment 0.2 0.1 Change in net working capital (22.0) 26.0 Change in provisions 0.1 3.8 Change in other operating assets / liabilities 11.3 (37.3) Cash flow from operations (22.3) (15.4) Cash flow from investing activities (6.6) (8.1) Proceeds from borrowings & shareholder contribution & loans 15.4 12.7 Payment of lease liabilities (0.3) (0.6) Cash flow from financing activities 15.2 12.1 Net cash & cash equivalents - begin of period 24.2 11.4 Net cash flow (13.7) (11.4) Net cash & cash equivalents - end of the period 10.5 0.0 Balance sheet statement Dec ye, $m FY19A FY20A Long - term assets 15.3 24.5 Contract assets 1.2 2.0 Inventories 39.9 26.5 Trade and other receivables 3.9 2.5 Short - term assets 44.9 31.1 Cash and cash - equivalents 10.5 0.0 Assets 70.8 55.6 Equity 1.9 (10.5) Trade and other payables (long - term) 15.8 31.2 Other long - term liabilities 3.5 6.1 Long - term liabilities 19.3 37.4 Liabilties to banks (short - term) 0.0 0.4 Other short - term liabilities 43.0 13.1 Trade and other payables (short term) 6.5 15.3 Short - term liabilities 49.5 28.8 Equity & liabilities 70.8 55.6

M i ta rbei ter k ü r z el The following list of risk factors is provided to certain sophisticated institutional investors in connection with a potential investment in European Sustainable Growth Acquisition Corp (“EUSG”), or a newly formed holding company, as part of a proposed business combination between the Company and EUSG pursuant to which the combined company will become a publicly traded company (the “Business Combination”). References to “we,” “us” or “our” are to the Company and, following the Business Combination, refer to the combined company. The list of risk factors has not been prepared for any other purpose. Investing in the combined company’s common shares to be issued in connection with the Business Combination involves a high degree of risk. Investors should carefully consider the risks and uncertainties inherent in an investment including those described below, and conduct their own due diligence investigation, before making an investment decision. If we cannot address any of the following risks and uncertainties effectively, or any other risks and difficulties that may arise in the future, our business, financial condition or results of operations could be materially and adversely affected. The risks described below are not the only ones we face. The following list of risks is not exhaustive, and additional risks that we currently do not know about or that we currently believe to be immaterial may also impair our business, financial condition or results of operations. Risks relating to our business will be disclosed in future documents filed or furnished with the US Securities and Exchange Commission (“SEC”), including the documents filed or furnished in connection with the proposed Business Combination. The risks presented in such filings will be consistent with those that would be required for a public company in their SEC filings and may differ significantly from, and will be more extensive than, those presented below. Risks Related to Our Business and Industry • The COVID - 19 pandemic, and any future outbreak or other public health emergency, could materially affect our business, liquidity, financial condition and operating results. • We may experience significant fluctuations in our operating results and rates of growth. • If we are unable to manage our growth or execute our growth strategies effectively, our business and prospects may be materially and adversely affected. • We face intense competition and could fail to gain, or could lose, market share if we are unable to compete effectively. • Our failure to quickly identify and adapt to changing industry conditions may have a material and adverse effect on us. • We may be unable to prevent unlawful or fraudulent activities in our operations, and we could be liable for such fraudulent or unlawful activities. • Any significant interruptions or delays in IT service or any undetected errors or design faults in IT systems could result in limited capacity, reduced demand, processing delays and loss of customers, suppliers or marketplace merchants and a reduction of commercial activity. • Any failure to adapt to technological developments or industry trends could harm our business. • Our success depends in large part on our ability to attract and retain high quality management and operating personnel, and if we are unable to attract, retain and motivate well qualified employees, our business could be negatively impacted. • We may from time to time pursue acquisitions, which could have an adverse impact on our business, as could the integration of the businesses following acquisition. • Exchange rate fluctuations may negatively affect our results of operations. Risks Related to Legal, Regulatory and Tax Matters • Our operations are subject to a variety of laws and regulations, and we expect that the extent of regulation applicable to us and our operations will increase over time and that we will be subject to new laws and new regulations. • We may become subject to additional laws or regulations or changes to existing laws or regulations, or changes in the interpretation of existing or new laws or regulations, any of which could impact the way we conduct our business. • We are subject to increasingly stringent environmental regulations. • We may not be able to adequately protect our intellectual property rights or may be accused of infringing intellectual property rights of third parties. • We may be unable to continue the use of our domain names or prevent third parties from acquiring and using domain names that infringe upon, are similar to or otherwise decrease the value of our brands, trademarks, or service marks. • Employment laws in German are relatively stringent and their application in a more aggressive manner by the German state could negatively impact our activity. • We may be subject to litigation, tax proceedings or regulatory proceedings which could result in significant liability. • We may be subject to product liability claims if people or property are harmed by the products sold on our platform. • Some of our potential losses may not be covered by insurance. We may not be able to obtain or maintain adequate insurance coverage. • We may be exposed to enforcement for violating anti - corruption laws, anti - money laundering laws and other similar laws and regulations. • Changes in tax treatment of companies engaged in e - commerce may adversely affect the commercial use of our sites and our financial results. • We may experience fluctuations in our tax obligations and effective tax rate, which could materially and adversely affect our operating results. 42 Risk factors (1/2)

M i ta rbei ter k ü r z el Risk Related to the Business Combination • We have not yet entered into a definitive agreement for the Business Combination and, when we do, the completion of the Business Combination will be subject to a number of conditions and if those conditions are not satisfied or waived, the Business Combination may not be completed. • Resales of the shares of common stock included in the stock consideration could depress the market price of the combined company’s common stock. • The exercise of discretion by the EUSG directors and officers in agreeing to changes to the terms of or waivers of closing conditions in the Business Combination Agreement may result in a conflict of interest when determining whether such changes to the terms of the Business Combination Agreement or waivers of conditions are appropriate and in the best interests of the stockholders of the combined company. • A market for the combined company’s securities may not continue, which would adversely affect the liquidity and price of the combined company’s securities. • If the Business Combination’s benefits do not meet the expectations of investors, stockholders or financial analysts, the market price of EUSG’s securities may decline. • Both EUSG and the Company will incur significant transaction costs in connection with the Business Combination. • The ability to successfully effect the Business Combination and following the consummation of the Business Combination, the combined company’s ability to successfully operate the business thereafter will be largely dependent upon the efforts of certain key personnel of the Company. The loss of such key personnel could negatively impact the operations and financial results of the combined business. • If the Business Combination’s benefits do not meet the expectations of investors or securities analysts, the market price of EUSG securities or, following the consummation of the Business Combination, the combined company’s securities, may decline. • Delays in completing the Business Combination may substantially reduce the expected benefits of the Business Combination. • Subsequent to the completion of the Business Combination, the combined company may be required to take write - downs or write - offs, restructuring and impairment or other charges that could have a significant negative effect on its financial condition, results of operations and the combined company’s common share price, which could cause you to lose some or all of your investment. • There can be no assurance that the combined company’s common shares will be approved for listing on the Nasdaq or that the combined company will be able to comply with the continued listing standards of the Nasdaq. • There can be no assurance as to the timing of the commencement, or completion, of the SEC review of the proxy statement/prospectus relating to the Business Combination, which in turn will determine the timing of the closing of the Business Combination. • Regulatory investigations or legal proceedings in connection with the Business Combination, the outcomes of which are uncertain, could delay or prevent the completion of the Business Combination. • Changes in laws or regulations, or a failure to comply with existing or future laws and regulations, may adversely affect our business, financial condition and results of operations. Risk Related to Owning the Combined Company’s Shares • A market for the combined company’s common shares may not develop or be sustained, which would adversely affect the liquidity and price of the combined company’s common shares. • Sales of a substantial number of the combined company’s common shares in the public market, including those issued upon exercise of warrants or options, could cause our share price to decline. • The combined company’s future ability to pay cash dividends to shareholders is subject to the discretion of its board of directors and will be limited by its ability to generate sufficient earnings and cash flows. • There can be no assurance that the combined company will not be a passive foreign investment company for any taxable year, which could subject U.S. shareholders to significant adverse U.S. federal income tax consequences. Risks Related to Being a Public Company • The combined company will incur increased costs as a result of operating as a public company, and its management will devote substantial time to new compliance initiatives. • If our estimates or judgments relating to our critical accounting standards prove to be incorrect, or such standards change over time, our results of operations could be adversely affected. • We expect to be a “foreign private issuer” and intend to follow certain home country corporate governance practices. As a foreign private issuer, we will have different disclosure and other requirements than U.S. domestic registrants. Our shareholders may therefore not have the same protections afforded to shareholders of companies that are subject to all Nasdaq corporate governance requirements. We may lose our foreign private issuer status in the future, which could result in significant additional expense and the need to present our financial statements in accordance with US GAAP. • We could in the future need to disclose, and be required to remediate, material weaknesses or significant deficiencies in our internal control over financial reporting. • We will be a “foreign private issuer” within the meaning of the rules under the Exchange Act, and as such we are exempt from certain provisions applicable to U.S. domestic public companies. 43 Risk factors (2/2)