Attached files
| file | filename |
|---|---|
| 8-K - 8-K - BLUE OWL CAPITAL INC. | d48311d8k.htm |
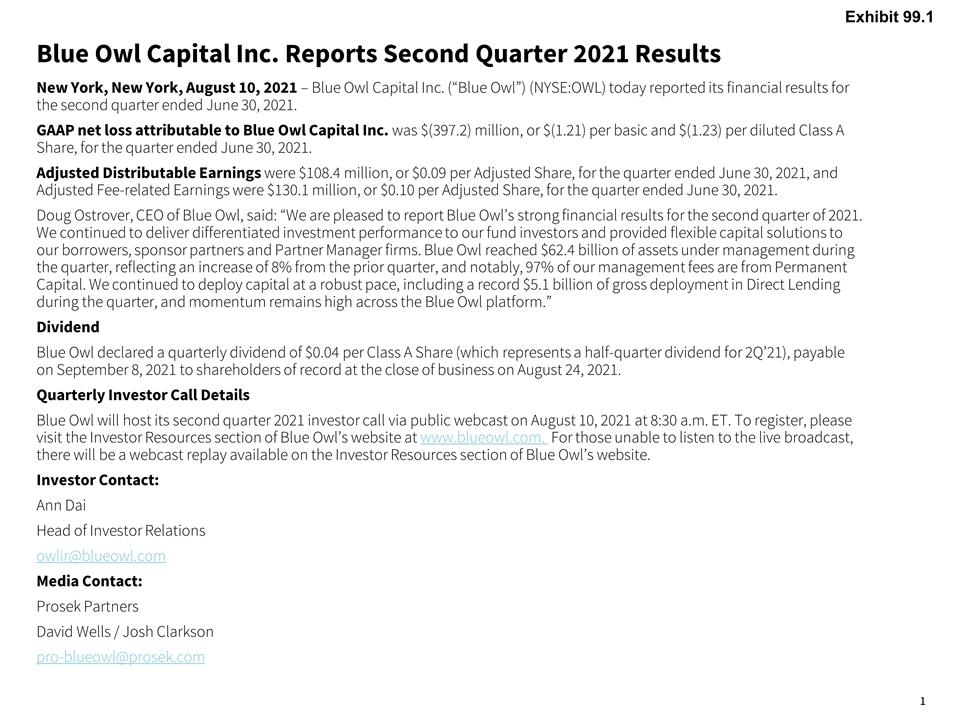
Blue Owl Capital Inc. Reports Second Quarter 2021 Results New York, New York, August 10, 2021 – Blue Owl Capital Inc. (“Blue Owl”) (NYSE:OWL) today reported its financial results for the second quarter ended June 30, 2021. GAAP net loss attributable to Blue Owl Capital Inc. was $(397.2) million, or $(1.21) per basic and $(1.23) per diluted Class A Share, for the quarter ended June 30, 2021. Adjusted Distributable Earnings were $108.4 million, or $0.09 per Adjusted Share, for the quarter ended June 30, 2021, and Adjusted Fee-related Earnings were $130.1 million, or $0.10 per Adjusted Share, for the quarter ended June 30, 2021. Doug Ostrover, CEO of Blue Owl, said: “We are pleased to report Blue Owl’s strong financial results for the second quarter of 2021. We continued to deliver differentiated investment performance to our fund investors and provided flexible capital solutions to our borrowers, sponsor partners and Partner Manager firms. Blue Owl reached $62.4 billion of assets under management during the quarter, reflecting an increase of 8% from the prior quarter, and notably, 97% of our management fees are from Permanent Capital. We continued to deploy capital at a robust pace, including a record $5.1 billion of gross deployment in Direct Lending during the quarter, and momentum remains high across the Blue Owl platform.” Dividend Blue Owl declared a quarterly dividend of $0.04 per Class A Share (which represents a half-quarter dividend for 2Q’21), payable on September 8, 2021 to shareholders of record at the close of business on August 24, 2021. Quarterly Investor Call Details Blue Owl will host its second quarter 2021 investor call via public webcast on August 10, 2021 at 8:30 a.m. ET. To register, please visit the Investor Resources section of Blue Owl’s website at www.blueowl.com. For those unable to listen to the live broadcast, there will be a webcast replay available on the Investor Resources section of Blue Owl’s website. Investor Contact: Ann Dai Head of Investor Relations owlir@blueowl.com Media Contact: Prosek Partners David Wells / Josh Clarkson pro-blueowl@prosek.com Exhibit 99.1
Blue Owl Capital Inc. Second Quarter 2021 Earnings August 10, 2021
Blue Owl Capital Inc. Reports Second Quarter 2021 Results About Blue Owl Blue Owl is an alternative asset manager that provides investors access to Direct Lending and GP Capital Solutions strategies through a variety of products. The firm’s breadth of offerings and permanent capital base enables it to offer a differentiated, holistic platform of capital solutions to participants throughout the private market ecosystem, including alternative asset managers and private middle market corporations. The firm had approximately $62.4 billion of assets under management as of June 30, 2021. Blue Owl’s management team is comprised of seasoned investment professionals with more than 25 years of experience building alternative investment businesses. Blue Owl has approximately 250 employees across its Direct Lending and GP Capital Solutions divisions and has six offices globally. For more information, please visit us at www.blueowl.com. Forward-Looking Statements Certain statements made in this presentation are “forward looking statements” within the meaning of the “safe harbor” provisions of the United States Private Securities Litigation Reform Act of 1995. When used in this press release, the words “estimates,” “projected,” “expects,” “anticipates,” “forecasts,” “plans,” “intends,” “believes,” “seeks,” “may,” “will,” “would,” “should,” “future,” “propose,” “target,” “goal,” “objective,” “outlook” and variations of these words or similar expressions (or the negative versions of such words or expressions) are intended to identify forward-looking statements. These forward-looking statements are not guarantees of future performance, conditions or results, and involve a number of known and unknown risks, uncertainties, assumptions and other important factors, many of which are outside Blue Owl’s control, that could cause actual results or outcomes to differ materially from those discussed in the forward-looking statements. Any such forward-looking statements are made pursuant to the safe harbor provisions available under applicable securities laws and speak only as of the date of this presentation. Blue Owl assumes no obligation to update or revise any such forward-looking statements except as required by law. Important factors, among others, that may affect actual results or outcomes include the inability to recognize the anticipated benefits of the recently completed business combination; costs related to the recently completed business combination; Blue Owl’s ability to manage growth; Blue Owl’s ability to execute its business plan and meet its projections; potential litigation involving Blue Owl; changes in applicable laws or regulations; the possibility that Blue Owl may be adversely affected by other economic, business, and competitive factors; the impact of the continuing COVID-19 pandemic on Blue Owl’s business as well as those factors described in the “Risk Factors” section of our filings with the Securities and Exchange Commission (“SEC”). The information contained in this presentation is summary information that is intended to be considered in the context of Blue Owl’s SEC filings and other public announcements that Blue Owl may make, by press release or otherwise, from time to time. Blue Owl also uses its website to distribute company information, including assets under management and performance information, and such information may be deemed material. Accordingly, investors should monitor Blue Owl’s website (www.blueowl.com). Blue Owl undertakes no duty or obligation to publicly update or revise the forward-looking statements or other information contained in this presentation. These materials contain information about Blue Owl and its affiliates and certain of their respective personnel and affiliates, information about their respective historical performance and general information about the market. You should not view information related to the past performance of Blue Owl or information about the market, as indicative of future results, the achievement of which cannot be assured.
Blue Owl Capital Inc. Reports Second Quarter 2021 Results Non-GAAP Financial Measures; Other Financial and Operational Data This presentation includes certain non-GAAP financial measures that are not prepared in accordance with accounting principles generally accepted in the United States (“GAAP”) and that may be different from non-GAAP financial measures used by other companies. Blue Owl believes that the use of these non-GAAP financial measures provides an additional tool for investors and potential investors to use in evaluating its ongoing operating results and trends. These non-GAAP measures should not be considered in isolation from, or as an alternative to, financial measures determined in accordance with GAAP. See the footnotes on the slides where these measures are discussed. Exact net IRRs and multiples cannot be calculated for individual investments held by Blue Owl’s products, or a subset of such investments, due to the lack of a mechanism to precisely allocate fees, taxes, transaction costs, expenses and general partner carried interest. Valuations are as of the dates provided herein and do not take into account subsequent events, including the continued impact of COVID-19, which can be expected to have an adverse effect on certain entities identified or contemplated herein. For the definitions of certain terms used in this presentation, please refer to the "Defined Terms" slide in the appendix. Important Notice No representations or warranties, express or implied are given in, or in respect of, this presentation. To the fullest extent permitted by law, in no circumstances will Blue Owl or any of its subsidiaries, stockholders, affiliates, representatives, partners, directors, officers, employees, advisers or agents be responsible or liable for any direct, indirect or consequential loss or loss of profit arising from use of this presentation, its contents, its omissions, reliance on the information contained within it, or on opinions communicated in relation thereto or otherwise arising in connection therewith. This presentation does not purport to be all-inclusive or to contain all of the information that may be required to make a full analysis of Blue Owl. Viewers of this presentation should each make their own evaluation of Blue Owl and of the relevance and adequacy of the information contained herein and should make sure other investigations as they deem necessary. This communication does not constitute an offer to sell, or the solicitation of an offer to buy or sell, any securities, investment funds, vehicles or accounts, investment advice or any other service by Blue Owl or any of its affiliates or subsidiaries. Nothing in this presentation constitutes the provision of tax, accounting, financial, investment, regulatory, legal or other advice by Blue Owl or its advisors. Industry and Market Data This presentation may contain information obtained from third parties, including ratings from credit ratings agencies such as Standard & Poor’s and Fitch Ratings. Such information has not been independently verified and, accordingly, Blue Owl makes no representation or warranty in respect of this information. Reproduction and distribution of third party content in any form is prohibited except with the prior written permission of the related third party. Third party content providers do not guarantee the accuracy, completeness, timeliness or availability of any information, including ratings, and are not responsible for any errors or omissions (negligent or otherwise), regardless of the cause, or for the results obtained from the use of such content. THIRD PARTY CONTENT PROVIDERS GIVE NO EXPRESS OR IMPLIED WARRANTIES, INCLUDING, BUT NOT LIMITED TO, ANY WARRANTIES OF MERCHANTABILITY OR FITNESS FOR A PARTICULAR PURPOSE OR USE. THIRD PARTY CONTENT PROVIDERS SHALL NOT BE LIABLE FOR ANY DIRECT, INDIRECT, INCIDENTAL, EXEMPLARY, COMPENSATORY, PUNITIVE, SPECIAL OR CONSEQUENTIAL DAMAGES, COSTS, EXPENSES, LEGAL FEES, OR LOSSES (INCLUDING LOST INCOME OR PROFITS AND OPPORTUNITY COSTS OR LOSSES CAUSED BY NEGLIGENCE) IN CONNECTION WITH ANY USE OF THEIR CONTENT, INCLUDING RATINGS. Credit ratings are statements of opinions and are not statements of fact or recommendations to purchase, hold or sell securities. They do not address the suitability of securities or the suitability of securities for investment purposes, and should not be relied on as investment advice.
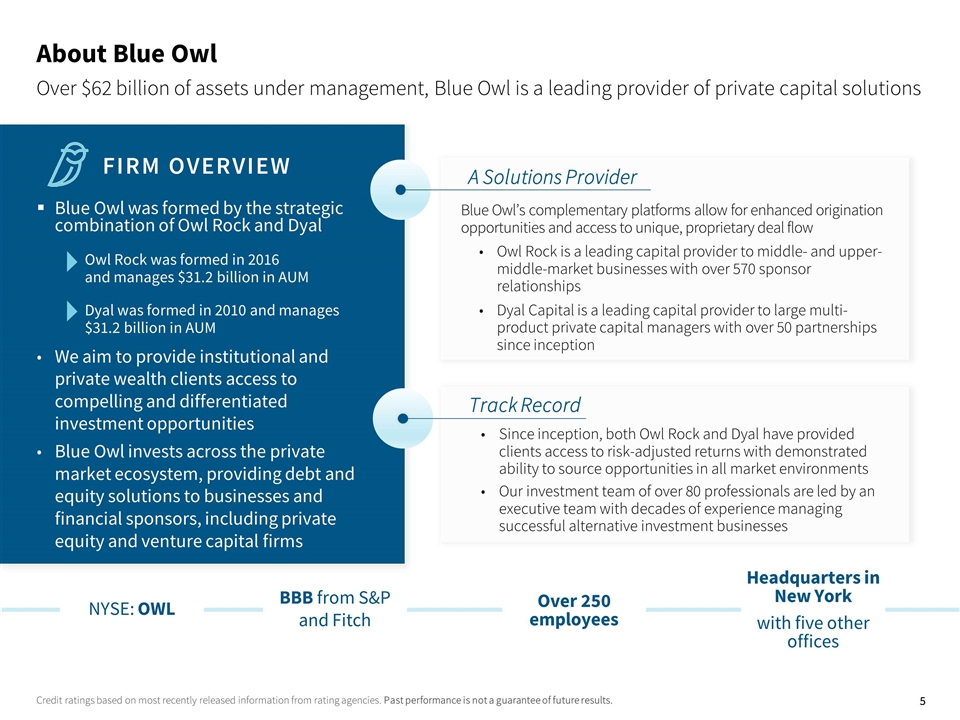
Credit ratings based on most recently released information from rating agencies. Past performance is not a guarantee of future results. About Blue Owl FIRM OVERVIEW Blue Owl was formed by the strategic combination of Owl Rock and Dyal Owl Rock was formed in 2016 and manages $31.2 billion in AUM Dyal was formed in 2010 and manages $31.2 billion in AUM We aim to provide institutional and private wealth clients access to compelling and differentiated investment opportunities Blue Owl invests across the private market ecosystem, providing debt and equity solutions to businesses and financial sponsors, including private equity and venture capital firms Over $62 billion of assets under management, Blue Owl is a leading provider of private capital solutions Blue Owl’s complementary platforms allow for enhanced origination opportunities and access to unique, proprietary deal flow Owl Rock is a leading capital provider to middle- and upper-middle-market businesses with over 570 sponsor relationships Dyal Capital is a leading capital provider to large multi-product private capital managers with over 50 partnerships since inception A Solutions Provider Track Record NYSE: OWL Over 250 employees BBB from S&P and Fitch Headquarters in New York with five other offices Since inception, both Owl Rock and Dyal have provided clients access to risk-adjusted returns with demonstrated ability to source opportunities in all market environments Our investment team of over 80 professionals are led by an executive team with decades of experience managing successful alternative investment businesses
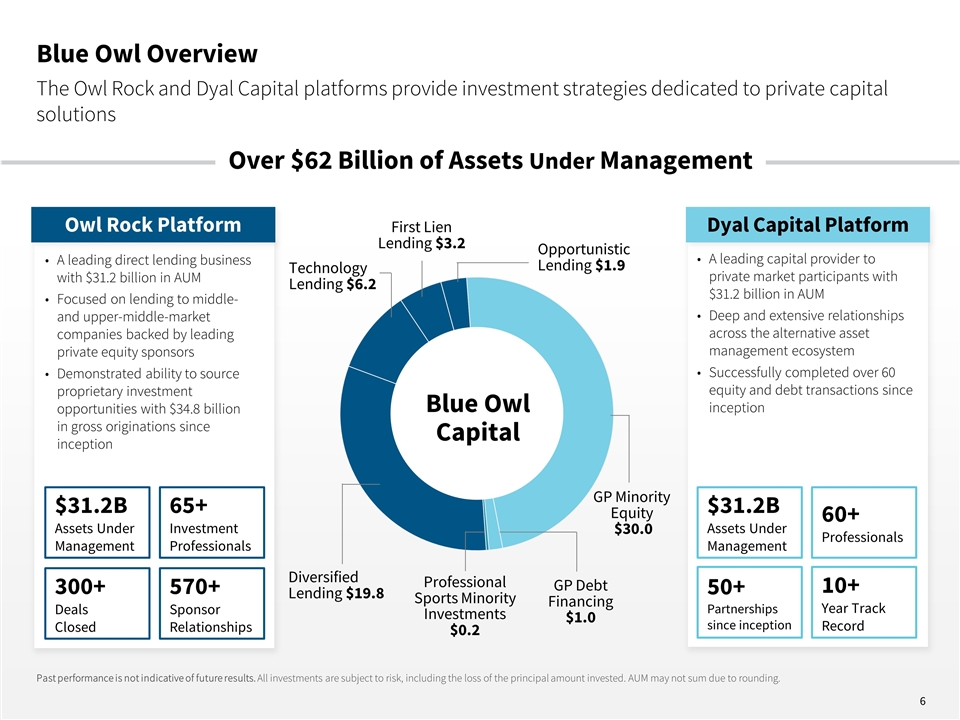
Blue Owl Overview The Owl Rock and Dyal Capital platforms provide investment strategies dedicated to private capital solutions A leading capital provider to private market participants with $31.2 billion in AUM Deep and extensive relationships across the alternative asset management ecosystem Successfully completed over 60 equity and debt transactions since inception A leading direct lending business with $31.2 billion in AUM Focused on lending to middle- and upper-middle-market companies backed by leading private equity sponsors Demonstrated ability to source proprietary investment opportunities with $34.8 billion in gross originations since inception First Lien Lending $3.2 Opportunistic Lending $1.9 GP Minority Equity $30.0 GP Debt Financing $1.0 Technology Lending $6.2 Diversified Lending $19.8 Dyal Capital Platform Owl Rock Platform Past performance is not indicative of future results. All investments are subject to risk, including the loss of the principal amount invested. AUM may not sum due to rounding. Professional Sports Minority Investments $0.2 $31.2B Assets Under Management 60+ Professionals 50+ Partnerships since inception 10+ Year Track Record $31.2B Assets Under Management 65+ Investment Professionals 300+ Deals Closed 570+ Sponsor Relationships Blue Owl Capital Over $62 Billion of Assets Under Management
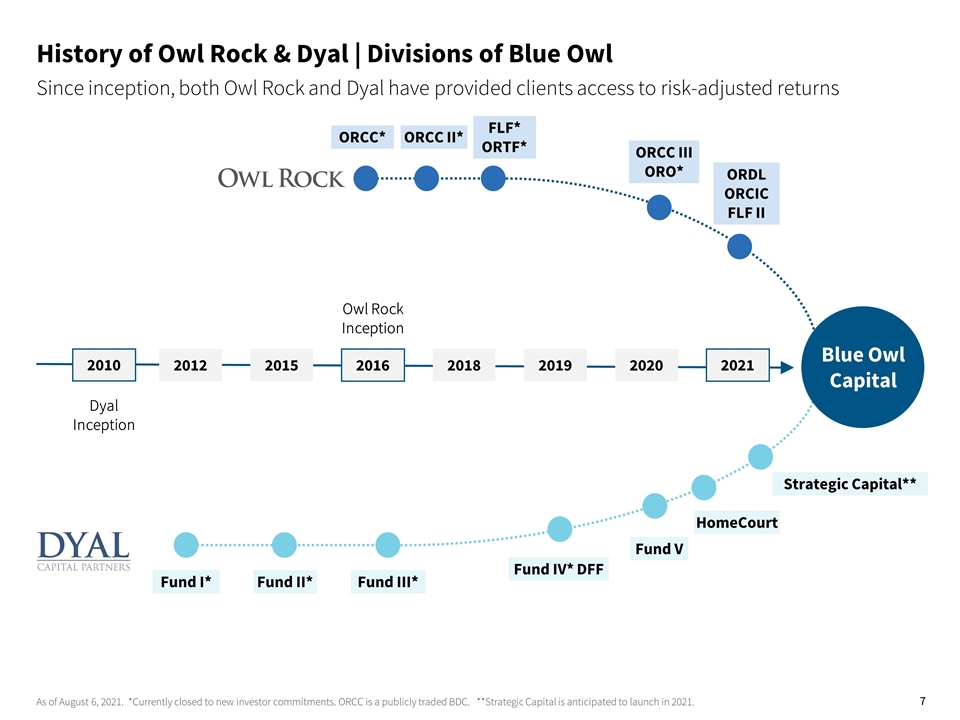
History of Owl Rock & Dyal | Divisions of Blue Owl Since inception, both Owl Rock and Dyal have provided clients access to risk-adjusted returns Fund I* Fund II* Fund III* FLF* ORTF* 2020 2015 2016 2018 2019 2012 Fund IV* DFF Fund V ORCC III ORO* ORCC* ORCC II* ORDL ORCIC FLF II HomeCourt Blue Owl Capital 2021 As of August 6, 2021. *Currently closed to new investor commitments. ORCC is a publicly traded BDC. **Strategic Capital is anticipated to launch in 2021. 2010 Dyal Inception Owl Rock Inception Strategic Capital** Blue Owl Capital
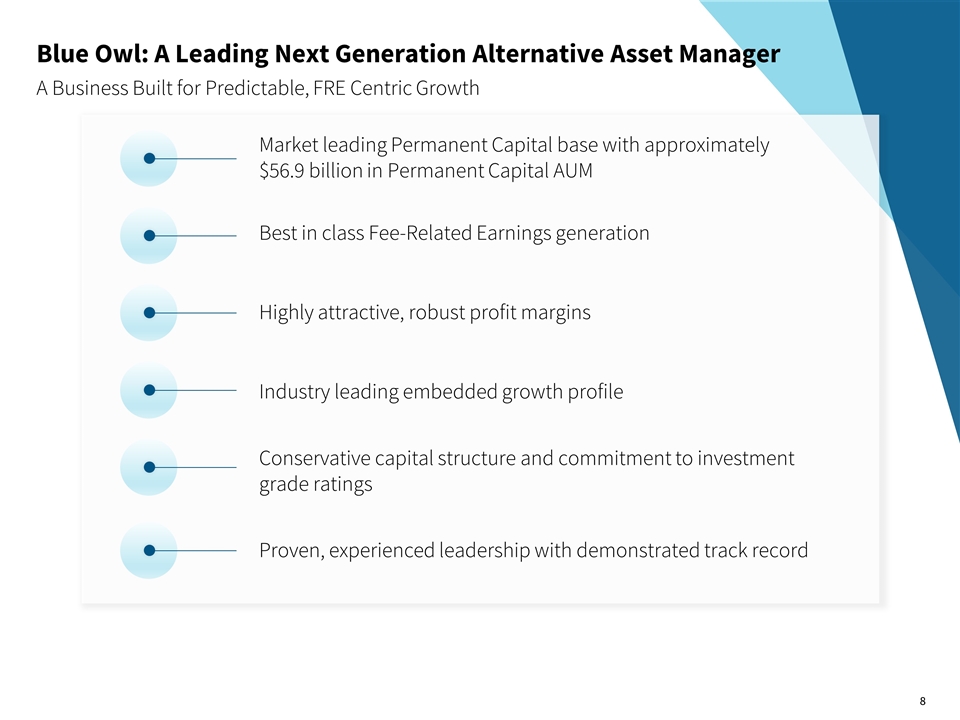
Blue Owl: A Leading Next Generation Alternative Asset Manager A Business Built for Predictable, FRE Centric Growth Market leading Permanent Capital base with approximately $56.9 billion in Permanent Capital AUM Best in class Fee-Related Earnings generation Proven, experienced leadership with demonstrated track record Industry leading embedded growth profile Highly attractive, robust profit margins Conservative capital structure and commitment to investment grade ratings
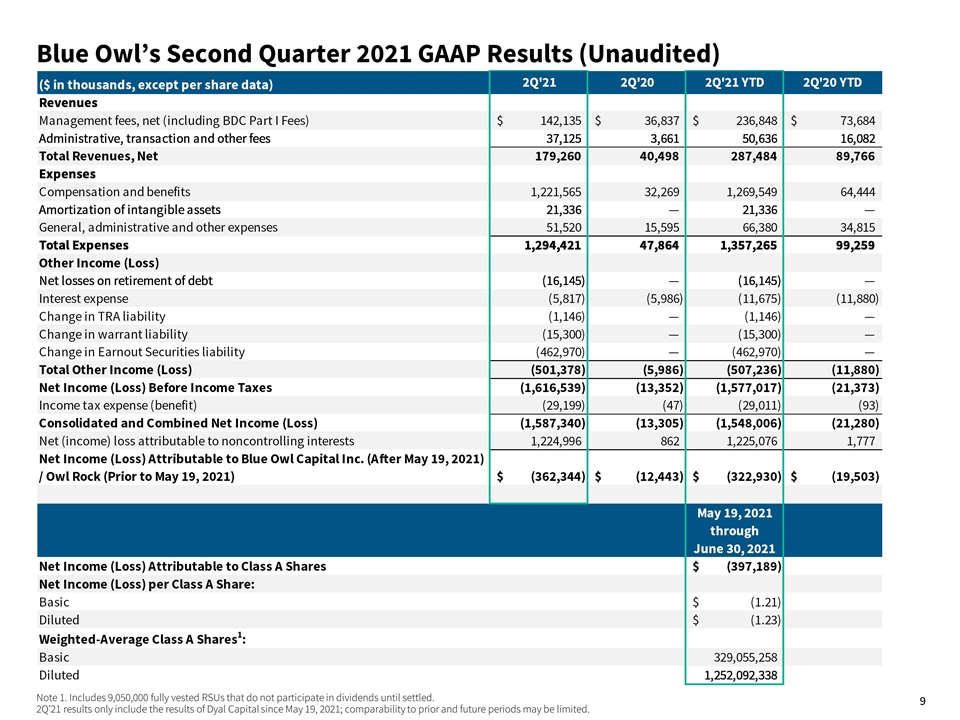
Blue Owl’s Second Quarter 2021 GAAP Results (Unaudited) Note 1. Includes 9,050,000 fully vested RSUs that do not participate in dividends until settled. 2Q’21 results only include the results of Dyal Capital since May 19, 2021; comparability to prior and future periods may be limited.
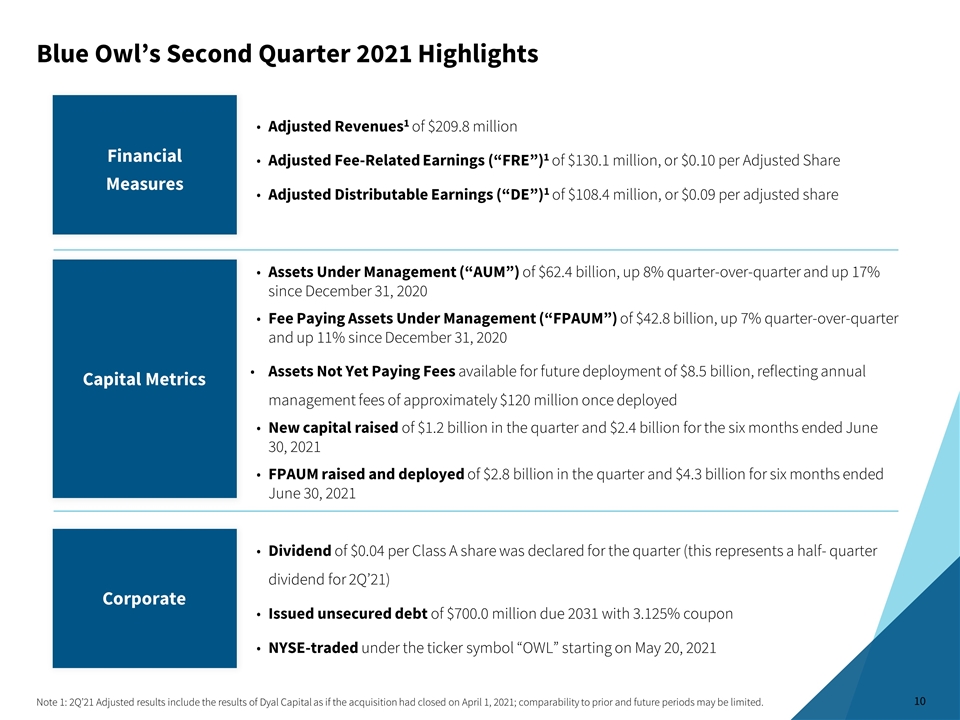
Blue Owl’s Second Quarter 2021 Highlights Note 1: 2Q’21 Adjusted results include the results of Dyal Capital as if the acquisition had closed on April 1, 2021; comparability to prior and future periods may be limited. Financial Measures Capital Metrics Corporate Adjusted Revenues1 of $209.8 million Adjusted Fee-Related Earnings (“FRE”)1 of $130.1 million, or $0.10 per Adjusted Share Adjusted Distributable Earnings (“DE”)1 of $108.4 million, or $0.09 per adjusted share Assets Under Management (“AUM”) of $62.4 billion, up 8% quarter-over-quarter and up 17% since December 31, 2020 Fee Paying Assets Under Management (“FPAUM”) of $42.8 billion, up 7% quarter-over-quarter and up 11% since December 31, 2020 Assets Not Yet Paying Fees available for future deployment of $8.5 billion, reflecting annual management fees of approximately $120 million once deployed New capital raised of $1.2 billion in the quarter and $2.4 billion for the six months ended June 30, 2021 FPAUM raised and deployed of $2.8 billion in the quarter and $4.3 billion for six months ended June 30, 2021 Dividend of $0.04 per Class A share was declared for the quarter (this represents a half- quarter dividend for 2Q’21) Issued unsecured debt of $700.0 million due 2031 with 3.125% coupon NYSE-traded under the ticker symbol “OWL” starting on May 20, 2021
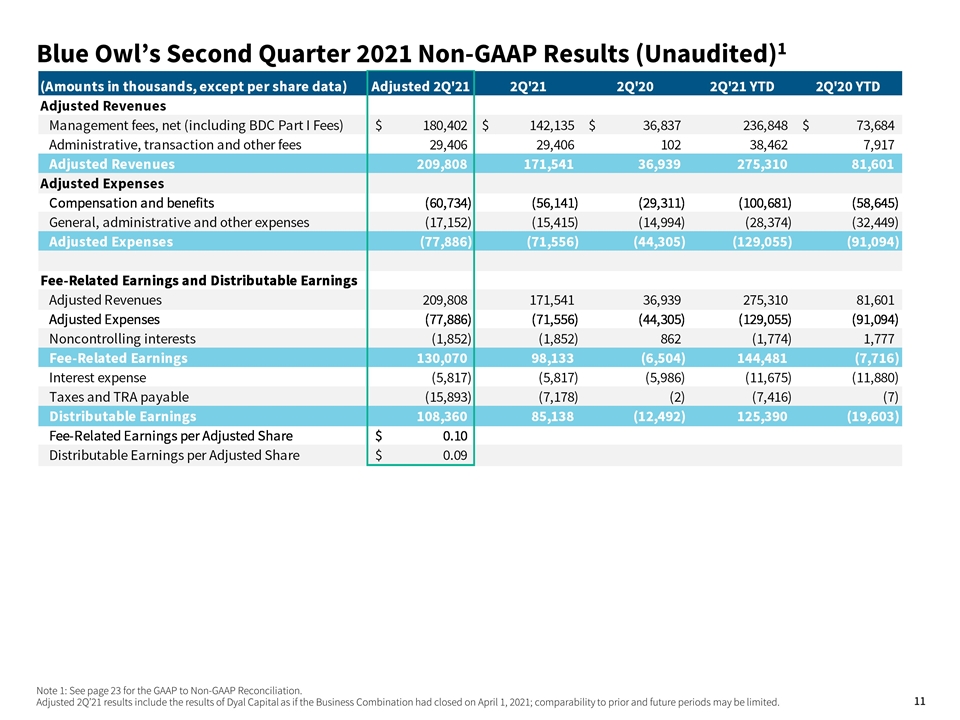
Blue Owl’s Second Quarter 2021 Non-GAAP Results (Unaudited)1 Note 1: See page 23 for the GAAP to Non-GAAP Reconciliation. Adjusted 2Q’21 results include the results of Dyal Capital as if the Business Combination had closed on April 1, 2021; comparability to prior and future periods may be limited.
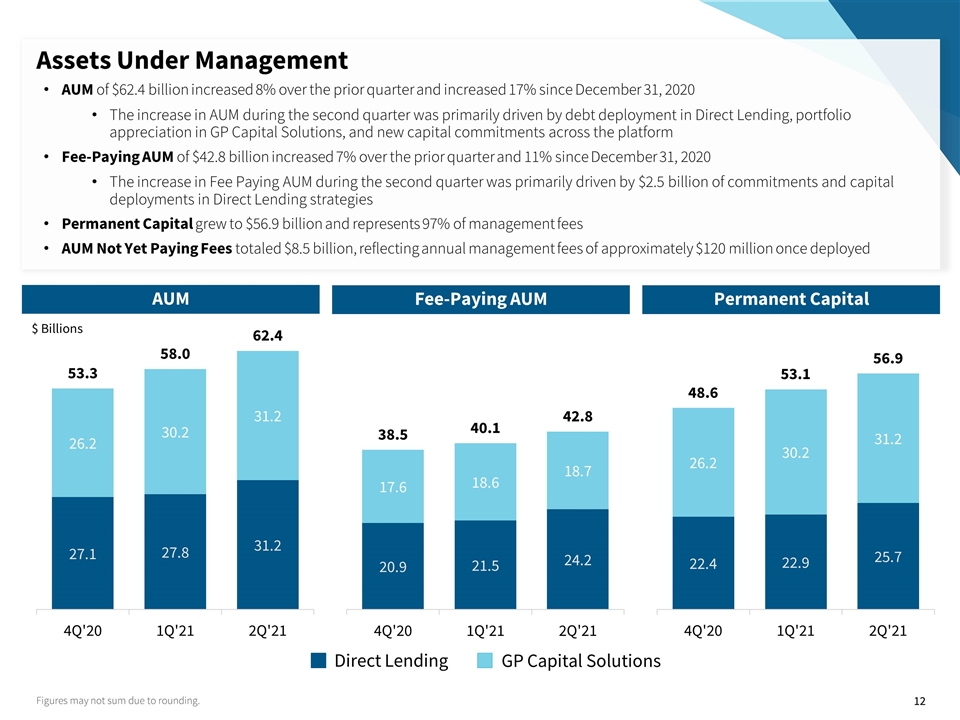
Assets Under Management AUM AUM of $62.4 billion increased 8% over the prior quarter and increased 17% since December 31, 2020 The increase in AUM during the second quarter was primarily driven by debt deployment in Direct Lending, portfolio appreciation in GP Capital Solutions, and new capital commitments across the platform Fee-Paying AUM of $42.8 billion increased 7% over the prior quarter and 11% since December 31, 2020 The increase in Fee Paying AUM during the second quarter was primarily driven by $2.5 billion of commitments and capital deployments in Direct Lending strategies Permanent Capital grew to $56.9 billion and represents 97% of management fees AUM Not Yet Paying Fees totaled $8.5 billion, reflecting annual management fees of approximately $120 million once deployed Fee-Paying AUM Permanent Capital Direct Lending GP Capital Solutions Figures may not sum due to rounding. $ Billions
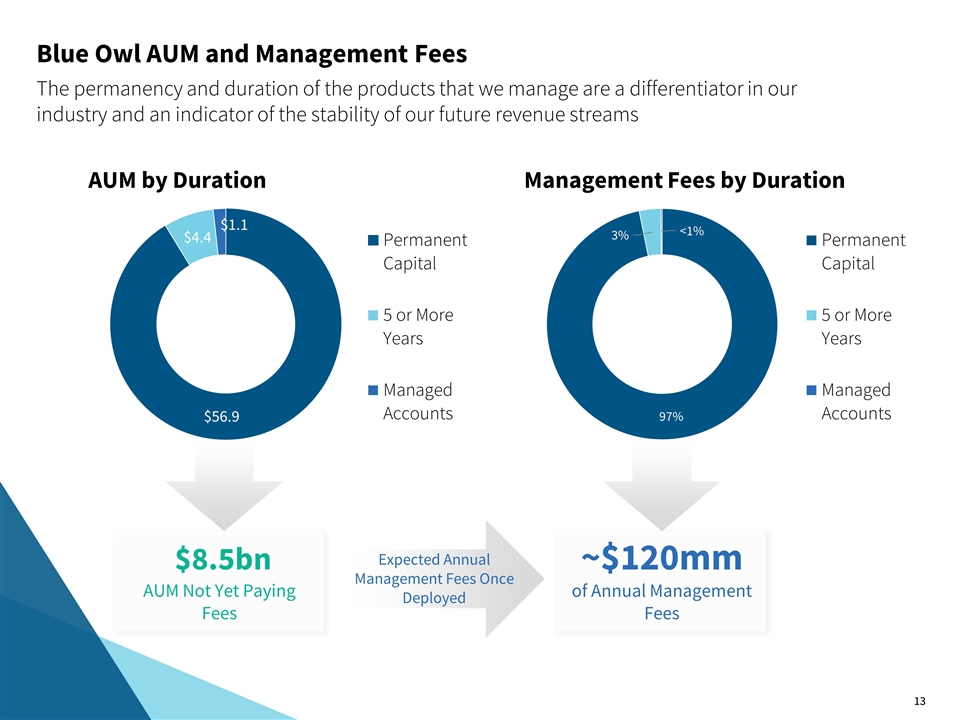
Blue Owl AUM and Management Fees The permanency and duration of the products that we manage are a differentiator in our industry and an indicator of the stability of our future revenue streams AUM by Duration Management Fees by Duration $8.5bn AUM Not Yet Paying Fees ~$120mm of Annual Management Fees Expected Annual Management Fees Once Deployed
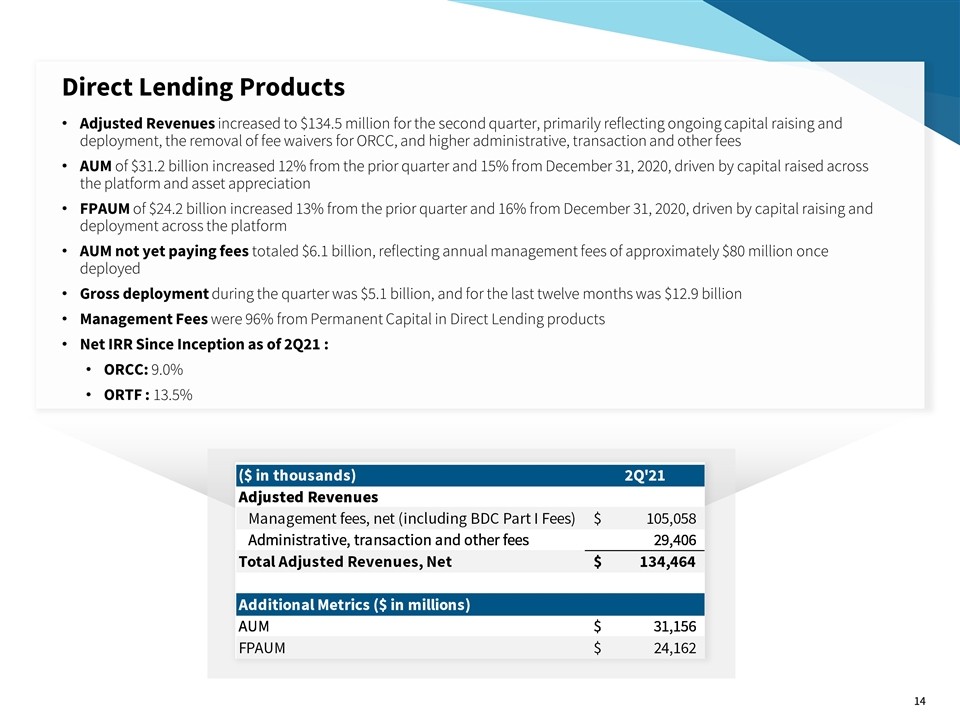
Direct Lending Products Adjusted Revenues increased to $134.5 million for the second quarter, primarily reflecting ongoing capital raising and deployment, the removal of fee waivers for ORCC, and higher administrative, transaction and other fees AUM of $31.2 billion increased 12% from the prior quarter and 15% from December 31, 2020, driven by capital raised across the platform and asset appreciation FPAUM of $24.2 billion increased 13% from the prior quarter and 16% from December 31, 2020, driven by capital raising and deployment across the platform AUM not yet paying fees totaled $6.1 billion, reflecting annual management fees of approximately $80 million once deployed Gross deployment during the quarter was $5.1 billion, and for the last twelve months was $12.9 billion Management Fees were 96% from Permanent Capital in Direct Lending products Net IRR Since Inception as of 2Q21 : ORCC: 9.0% ORTF : 13.5%
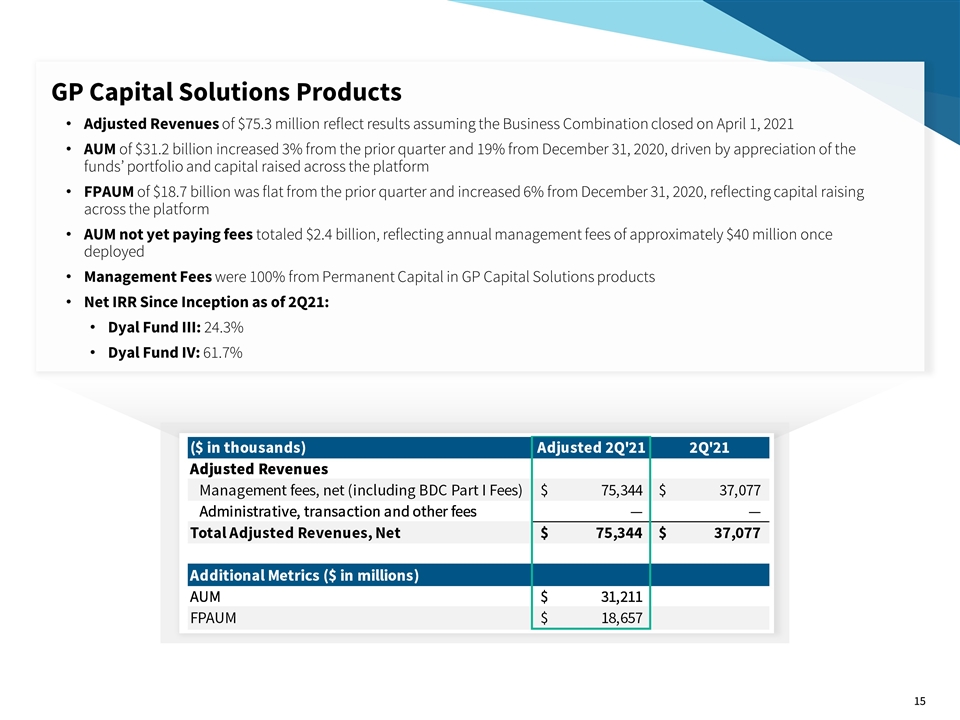
GP Capital Solutions Products Adjusted Revenues of $75.3 million reflect results assuming the Business Combination closed on April 1, 2021 AUM of $31.2 billion increased 3% from the prior quarter and 19% from December 31, 2020, driven by appreciation of the funds’ portfolio and capital raised across the platform FPAUM of $18.7 billion was flat from the prior quarter and increased 6% from December 31, 2020, reflecting capital raising across the platform AUM not yet paying fees totaled $2.4 billion, reflecting annual management fees of approximately $40 million once deployed Management Fees were 100% from Permanent Capital in GP Capital Solutions products Net IRR Since Inception as of 2Q21: Dyal Fund III: 24.3% Dyal Fund IV: 61.7%
Supplemental Information
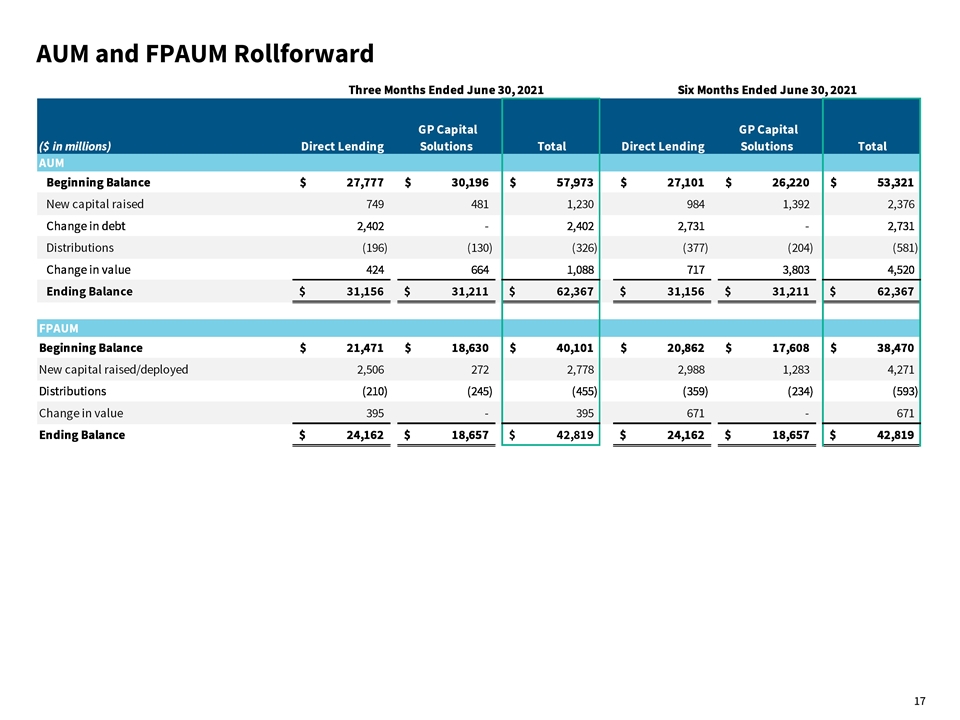
AUM and FPAUM Rollforward
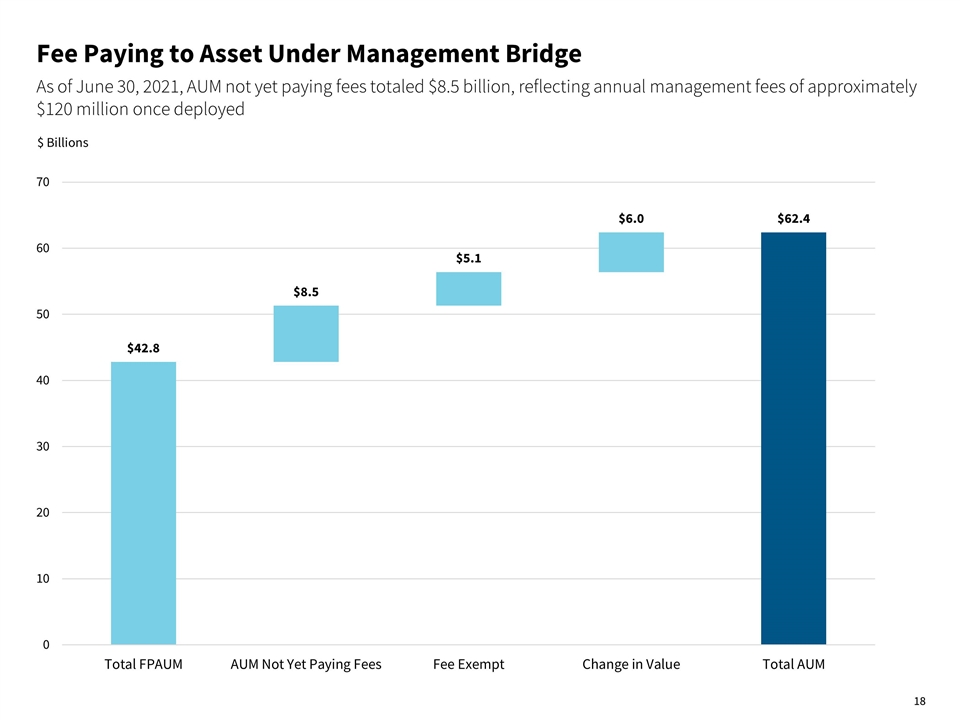
Fee Paying to Asset Under Management Bridge As of June 30, 2021, AUM not yet paying fees totaled $8.5 billion, reflecting annual management fees of approximately $120 million once deployed $ Billions
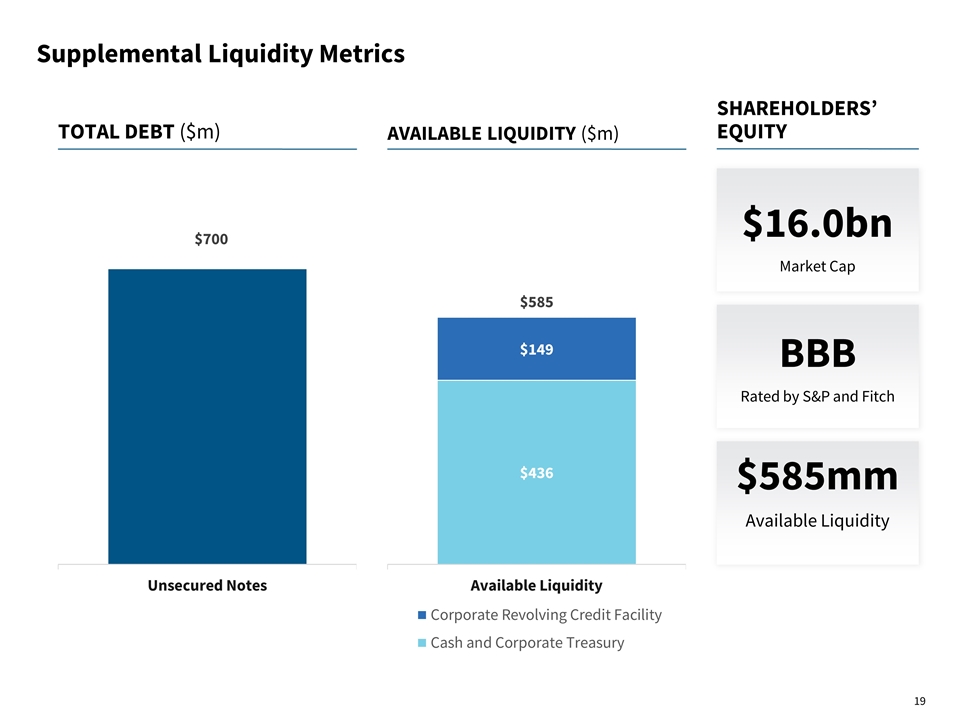
$16.0bn Market Cap BBB Rated by S&P and Fitch $585mm Available Liquidity Total Debt ($m) Available Liquidity ($m) Shareholders’ Equity Supplemental Liquidity Metrics
Appendix
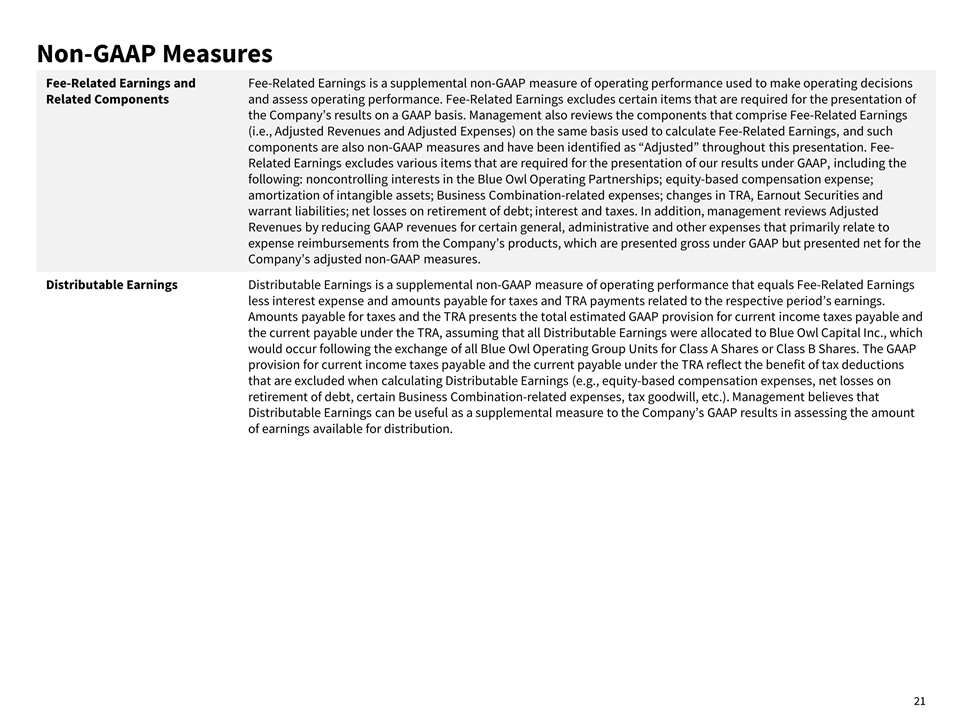
Non-GAAP Measures Fee-Related Earnings and Related Components Fee-Related Earnings is a supplemental non-GAAP measure of operating performance used to make operating decisions and assess operating performance. Fee-Related Earnings excludes certain items that are required for the presentation of the Company’s results on a GAAP basis. Management also reviews the components that comprise Fee-Related Earnings (i.e., Adjusted Revenues and Adjusted Expenses) on the same basis used to calculate Fee-Related Earnings, and such components are also non-GAAP measures and have been identified as “Adjusted” throughout this presentation. Fee-Related Earnings excludes various items that are required for the presentation of our results under GAAP, including the following: noncontrolling interests in the Blue Owl Operating Partnerships; equity-based compensation expense; amortization of intangible assets; Business Combination-related expenses; changes in TRA, Earnout Securities and warrant liabilities; net losses on retirement of debt; interest and taxes. In addition, management reviews Adjusted Revenues by reducing GAAP revenues for certain general, administrative and other expenses that primarily relate to expense reimbursements from the Company’s products, which are presented gross under GAAP but presented net for the Company’s adjusted non-GAAP measures. Distributable Earnings Distributable Earnings is a supplemental non-GAAP measure of operating performance that equals Fee-Related Earnings less interest expense and amounts payable for taxes and TRA payments related to the respective period’s earnings. Amounts payable for taxes and the TRA presents the total estimated GAAP provision for current income taxes payable and the current payable under the TRA, assuming that all Distributable Earnings were allocated to Blue Owl Capital Inc., which would occur following the exchange of all Blue Owl Operating Group Units for Class A Shares or Class B Shares. The GAAP provision for current income taxes payable and the current payable under the TRA reflect the benefit of tax deductions that are excluded when calculating Distributable Earnings (e.g., equity-based compensation expenses, net losses on retirement of debt, certain Business Combination-related expenses, tax goodwill, etc.). Management believes that Distributable Earnings can be useful as a supplemental measure to the Company’s GAAP results in assessing the amount of earnings available for distribution.
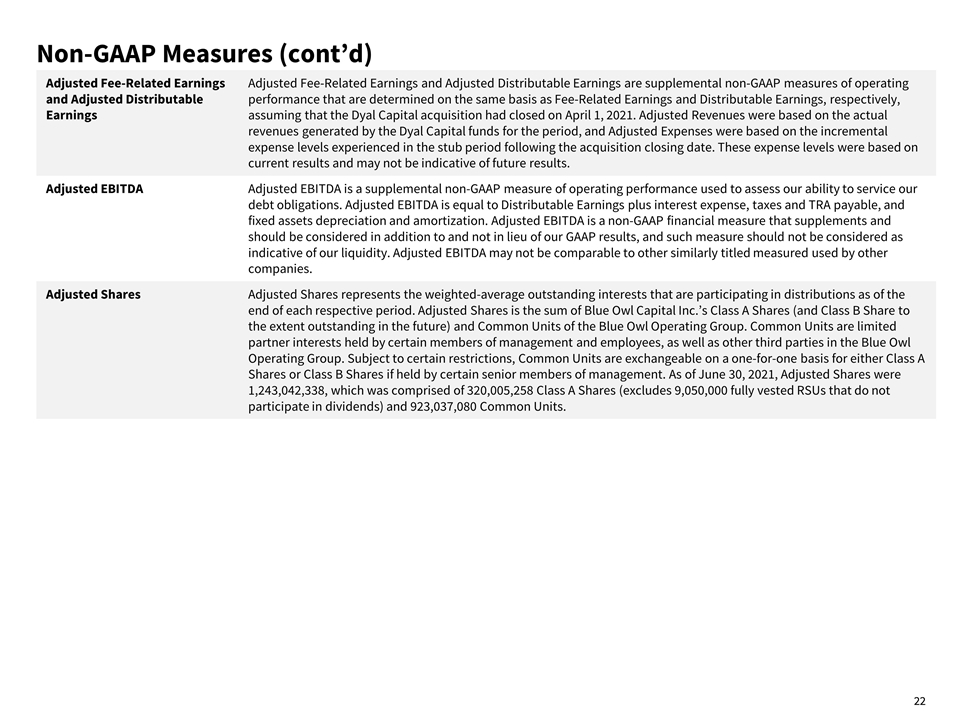
Non-GAAP Measures (cont’d) Adjusted Fee-Related Earnings and Adjusted Distributable Earnings Adjusted Fee-Related Earnings and Adjusted Distributable Earnings are supplemental non-GAAP measures of operating performance that are determined on the same basis as Fee-Related Earnings and Distributable Earnings, respectively, assuming that the Dyal Capital acquisition had closed on April 1, 2021. Adjusted Revenues were based on the actual revenues generated by the Dyal Capital funds for the period, and Adjusted Expenses were based on the incremental expense levels experienced in the stub period following the acquisition closing date. These expense levels were based on current results and may not be indicative of future results. Adjusted EBITDA Adjusted EBITDA is a supplemental non-GAAP measure of operating performance used to assess our ability to service our debt obligations. Adjusted EBITDA is equal to Distributable Earnings plus interest expense, taxes and TRA payable, and fixed assets depreciation and amortization. Adjusted EBITDA is a non-GAAP financial measure that supplements and should be considered in addition to and not in lieu of our GAAP results, and such measure should not be considered as indicative of our liquidity. Adjusted EBITDA may not be comparable to other similarly titled measured used by other companies. Adjusted Shares Adjusted Shares represents the weighted-average outstanding interests that are participating in distributions as of the end of each respective period. Adjusted Shares is the sum of Blue Owl Capital Inc.’s Class A Shares (and Class B Share to the extent outstanding in the future) and Common Units of the Blue Owl Operating Group. Common Units are limited partner interests held by certain members of management and employees, as well as other third parties in the Blue Owl Operating Group. Subject to certain restrictions, Common Units are exchangeable on a one-for-one basis for either Class A Shares or Class B Shares if held by certain senior members of management. As of June 30, 2021, Adjusted Shares were 1,243,042,338, which was comprised of 320,005,258 Class A Shares (excludes 9,050,000 fully vested RSUs that do not participate in dividends) and 923,037,080 Common Units.
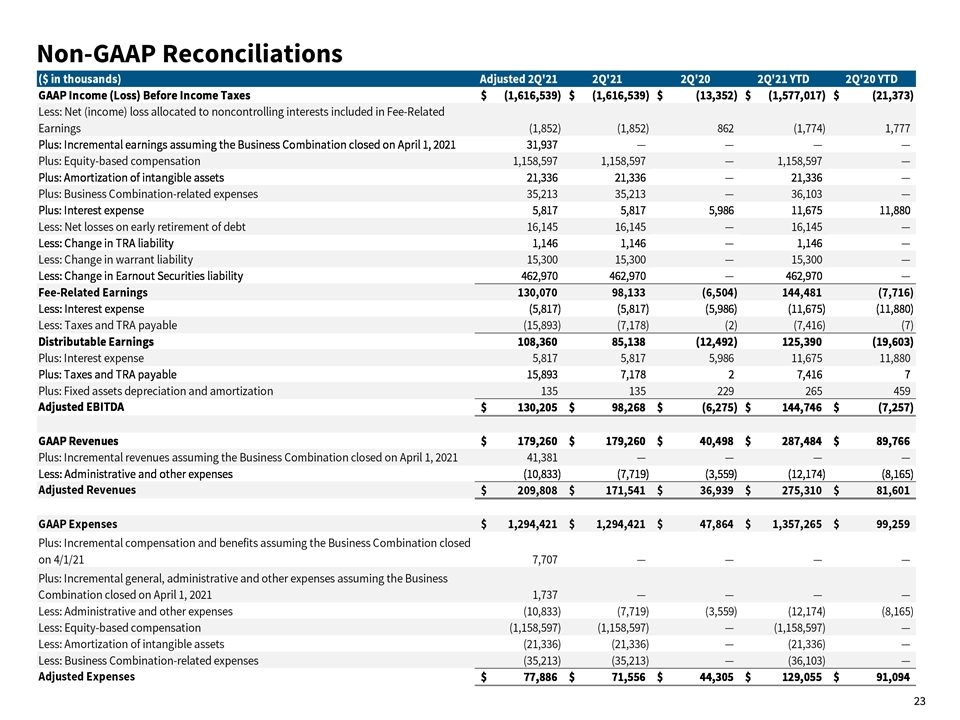
Non-GAAP Reconciliations
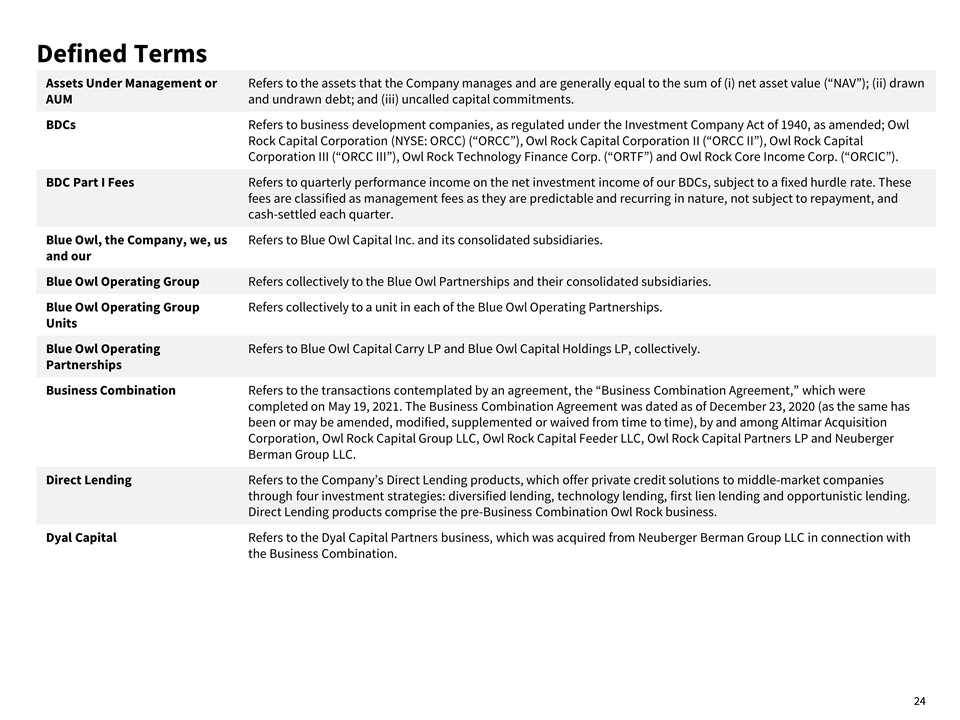
Defined Terms Assets Under Management or AUM Refers to the assets that the Company manages and are generally equal to the sum of (i) net asset value (“NAV”); (ii) drawn and undrawn debt; and (iii) uncalled capital commitments. BDCs Refers to business development companies, as regulated under the Investment Company Act of 1940, as amended; Owl Rock Capital Corporation (NYSE: ORCC) (“ORCC”), Owl Rock Capital Corporation II (“ORCC II”), Owl Rock Capital Corporation III (“ORCC III”), Owl Rock Technology Finance Corp. (“ORTF”) and Owl Rock Core Income Corp. (“ORCIC”). BDC Part I Fees Refers to quarterly performance income on the net investment income of our BDCs, subject to a fixed hurdle rate. These fees are classified as management fees as they are predictable and recurring in nature, not subject to repayment, and cash-settled each quarter. Blue Owl, the Company, we, us and our Refers to Blue Owl Capital Inc. and its consolidated subsidiaries. Blue Owl Operating Group Refers collectively to the Blue Owl Partnerships and their consolidated subsidiaries. Blue Owl Operating Group Units Refers collectively to a unit in each of the Blue Owl Operating Partnerships. Blue Owl Operating Partnerships Refers to Blue Owl Capital Carry LP and Blue Owl Capital Holdings LP, collectively. Business Combination Refers to the transactions contemplated by an agreement, the “Business Combination Agreement,” which were completed on May 19, 2021. The Business Combination Agreement was dated as of December 23, 2020 (as the same has been or may be amended, modified, supplemented or waived from time to time), by and among Altimar Acquisition Corporation, Owl Rock Capital Group LLC, Owl Rock Capital Feeder LLC, Owl Rock Capital Partners LP and Neuberger Berman Group LLC. Direct Lending Refers to the Company’s Direct Lending products, which offer private credit solutions to middle-market companies through four investment strategies: diversified lending, technology lending, first lien lending and opportunistic lending. Direct Lending products comprise the pre-Business Combination Owl Rock business. Dyal Capital Refers to the Dyal Capital Partners business, which was acquired from Neuberger Berman Group LLC in connection with the Business Combination.
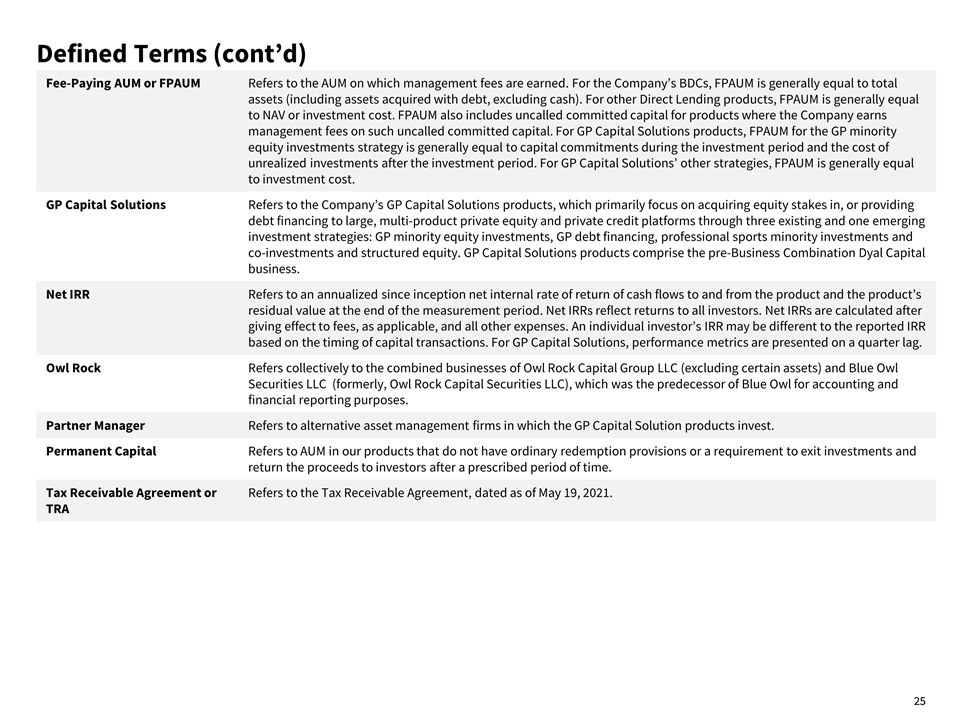
Defined Terms (cont’d) Fee-Paying AUM or FPAUM Refers to the AUM on which management fees are earned. For the Company’s BDCs, FPAUM is generally equal to total assets (including assets acquired with debt, excluding cash). For other Direct Lending products, FPAUM is generally equal to NAV or investment cost. FPAUM also includes uncalled committed capital for products where the Company earns management fees on such uncalled committed capital. For GP Capital Solutions products, FPAUM for the GP minority equity investments strategy is generally equal to capital commitments during the investment period and the cost of unrealized investments after the investment period. For GP Capital Solutions’ other strategies, FPAUM is generally equal to investment cost. GP Capital Solutions Refers to the Company’s GP Capital Solutions products, which primarily focus on acquiring equity stakes in, or providing debt financing to large, multi-product private equity and private credit platforms through three existing and one emerging investment strategies: GP minority equity investments, GP debt financing, professional sports minority investments and co-investments and structured equity. GP Capital Solutions products comprise the pre-Business Combination Dyal Capital business. Net IRR Refers to an annualized since inception net internal rate of return of cash flows to and from the product and the product’s residual value at the end of the measurement period. Net IRRs reflect returns to all investors. Net IRRs are calculated after giving effect to fees, as applicable, and all other expenses. An individual investor’s IRR may be different to the reported IRR based on the timing of capital transactions. For GP Capital Solutions, performance metrics are presented on a quarter lag. Owl Rock Refers collectively to the combined businesses of Owl Rock Capital Group LLC (excluding certain assets) and Blue Owl Securities LLC (formerly, Owl Rock Capital Securities LLC), which was the predecessor of Blue Owl for accounting and financial reporting purposes. Partner Manager Refers to alternative asset management firms in which the GP Capital Solution products invest. Permanent Capital Refers to AUM in our products that do not have ordinary redemption provisions or a requirement to exit investments and return the proceeds to investors after a prescribed period of time. Tax Receivable Agreement or TRA Refers to the Tax Receivable Agreement, dated as of May 19, 2021.
