Attached files
| file | filename |
|---|---|
| EX-99.2 - EXHIBIT 99.2 - Coronado Global Resources Inc. | tm2124367d3_ex99-2.htm |
| EX-99.1 - EXHIBIT 99.1 - Coronado Global Resources Inc. | tm2124367d3_ex99-1.htm |
| 8-K - FORM 8-K - Coronado Global Resources Inc. | tm2124367d3_8k.htm |
Exhibit 99.3
| 2021 Half Year Results Presentation GERRY SPINDLER Managing Director and CEO GERHARD ZIEMS Group Chief Financial Officer 10 August 2021 (All units in USD and metric tonnes, unless otherwise stated) |

| HY 2021 HIGHLIGHTS GERRY SPINDLER MANAGING DIRECTOR AND CEO |
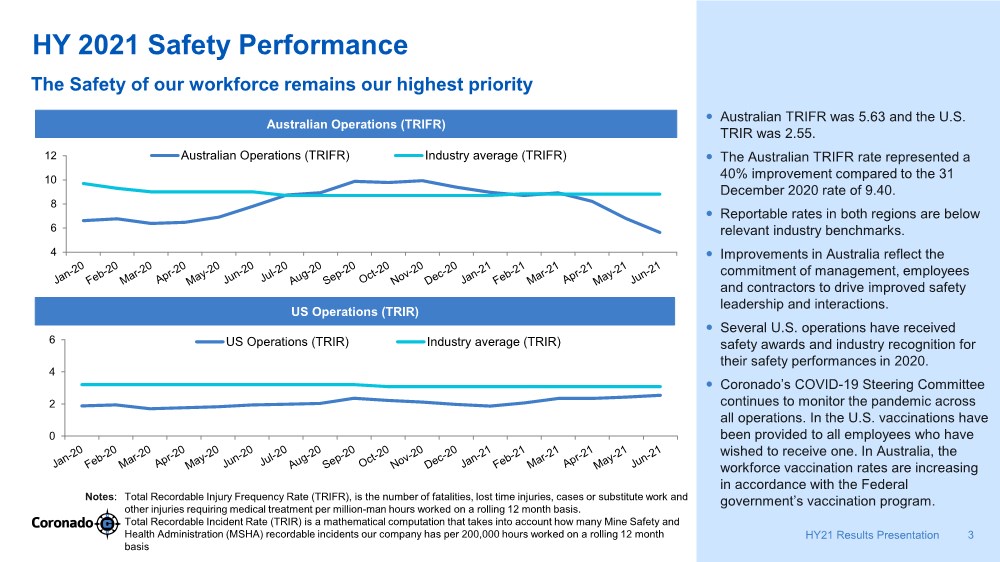
| HY 2021 Safety Performance 3 HY21 Results Presentation The Safety of our workforce remains our highest priority Notes: Total Recordable Injury Frequency Rate (TRIFR), is the number of fatalities, lost time injuries, cases or substitute work and other injuries requiring medical treatment per million-man hours worked on a rolling 12 month basis. Total Recordable Incident Rate (TRIR) is a mathematical computation that takes into account how many Mine Safety and Health Administration (MSHA) recordable incidents our company has per 200,000 hours worked on a rolling 12 month basis Australian Operations (TRIFR) US Operations (TRIR) 0 2 4 6 US Operations (TRIR) Industry average (TRIR) Australian TRIFR was 5.63 and the U.S. TRIR was 2.55. The Australian TRIFR rate represented a 40% improvement compared to the 31 December 2020 rate of 9.40. Reportable rates in both regions are below relevant industry benchmarks. Improvements in Australia reflect the commitment of management, employees and contractors to drive improved safety leadership and interactions. Several U.S. operations have received safety awards and industry recognition for their safety performances in 2020. Coronado’s COVID-19 Steering Committee continues to monitor the pandemic across all operations. In the U.S. vaccinations have been provided to all employees who have wished to receive one. In Australia, the workforce vaccination rates are increasing in accordance with the Federal government’s vaccination program. 4 6 8 10 12 Australian Operations (TRIFR) Industry average (TRIFR) |
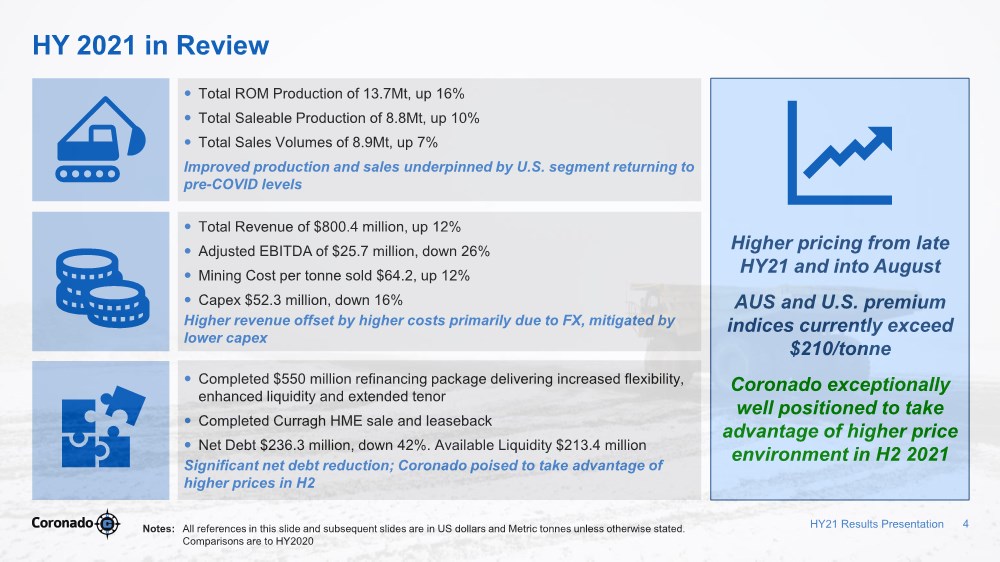
| Total Revenue of $800.4 million, up 12% Adjusted EBITDA of $25.7 million, down 26% Mining Cost per tonne sold $64.2, up 12% Capex $52.3 million, down 16% Higher revenue offset by higher costs primarily due to FX, mitigated by lower capex Total ROM Production of 13.7Mt, up 16% Total Saleable Production of 8.8Mt, up 10% Total Sales Volumes of 8.9Mt, up 7% Improved production and sales underpinned by U.S. segment returning to pre-COVID levels Completed $550 million refinancing package delivering increased flexibility, enhanced liquidity and extended tenor Completed Curragh HME sale and leaseback Net Debt $236.3 million, down 42%. Available Liquidity $213.4 million Significant net debt reduction; Coronado poised to take advantage of higher prices in H2 Higher pricing from late HY21 and into August AUS and U.S. premium indices currently exceed $210/tonne Coronado exceptionally well positioned to take advantage of higher price environment in H2 2021 4 HY 2021 in Review HY21 Results Presentation Notes: All references in this slide and subsequent slides are in US dollars and Metric tonnes unless otherwise stated. Comparisons are to HY2020 |
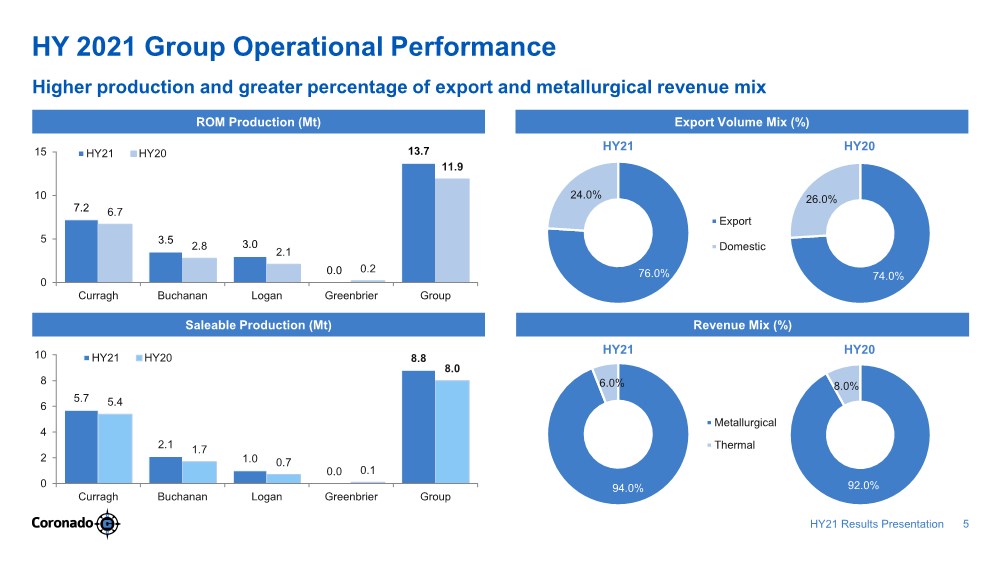
| 5 HY 2021 Group Operational Performance HY21 Results Presentation Higher production and greater percentage of export and metallurgical revenue mix Export Volume Mix (%) ROM Production (Mt) Saleable Production (Mt) Revenue Mix (%) 7.2 3.5 3.0 0.0 13.7 6.7 2.8 2.1 0.2 11.9 0 5 10 15 Curragh Buchanan Logan Greenbrier Group HY21 HY20 5.7 2.1 1.0 0.0 8.8 5.4 1.7 0.7 0.1 8.0 0 2 4 6 8 10 Curragh Buchanan Logan Greenbrier Group HY21 HY20 74.0% 26.0% Export Domestic 76.0% 24.0% HY21 HY20 92.0% 8.0% Metallurgical Thermal 94.0% 6.0% HY21 HY20 |
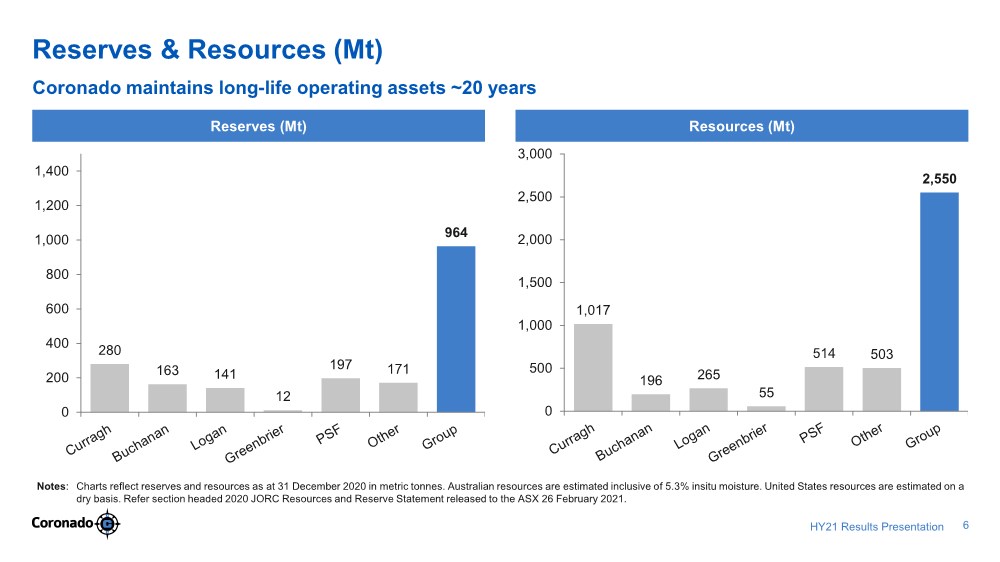
| 6 Reserves & Resources (Mt) HY21 Results Presentation Coronado maintains long-life operating assets ~20 years Notes: Charts reflect reserves and resources as at 31 December 2020 in metric tonnes. Australian resources are estimated inclusive of 5.3% insitu moisture. United States resources are estimated on a dry basis. Refer section headed 2020 JORC Resources and Reserve Statement released to the ASX 26 February 2021. Resources (Mt) Reserves (Mt) 280 163 141 12 197 171 964 0 200 400 600 800 1,000 1,200 1,400 1,017 196 265 55 514 503 2,550 0 500 1,000 1,500 2,000 2,500 3,000 |
| HY 2021 FINANCIAL PERFORMANCE GERHARD ZIEMS GROUP CHIEF FINANCIAL OFFICER |

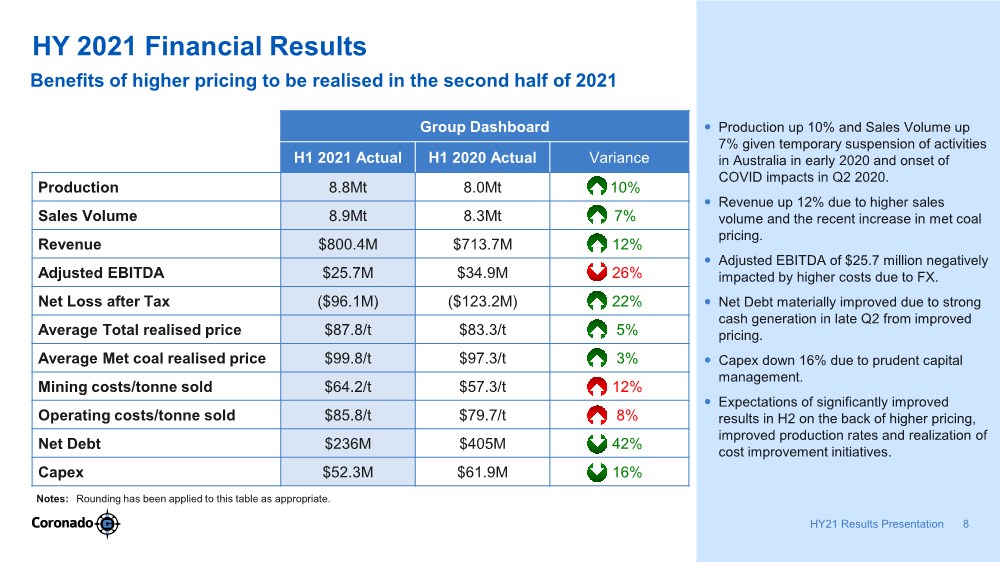
| HY 2021 Financial Results Benefits of higher pricing to be realised in the second half of 2021 Notes: Rounding has been applied to this table as appropriate. Group Dashboard H1 2021 Actual H1 2020 Actual Variance Production 8.8Mt 8.0Mt 10% Sales Volume 8.9Mt 8.3Mt 7% Revenue $800.4M $713.7M 12% Adjusted EBITDA $25.7M $34.9M 26% Net Loss after Tax ($96.1M) ($123.2M) 22% Average Total realised price $87.8/t $83.3/t 5% Average Met coal realised price $99.8/t $97.3/t 3% Mining costs/tonne sold $64.2/t $57.3/t 12% Operating costs/tonne sold $85.8/t $79.7/t 8% Net Debt $236M $405M 42% Capex $52.3M $61.9M 16% Production up 10% and Sales Volume up 7% given temporary suspension of activities in Australia in early 2020 and onset of COVID impacts in Q2 2020. Revenue up 12% due to higher sales volume and the recent increase in met coal pricing. Adjusted EBITDA of $25.7 million negatively impacted by higher costs due to FX. Net Debt materially improved due to strong cash generation in late Q2 from improved pricing. Capex down 16% due to prudent capital management. Expectations of significantly improved results in H2 on the back of higher pricing, improved production rates and realization of cost improvement initiatives. 8 HY21 Results Presentation |
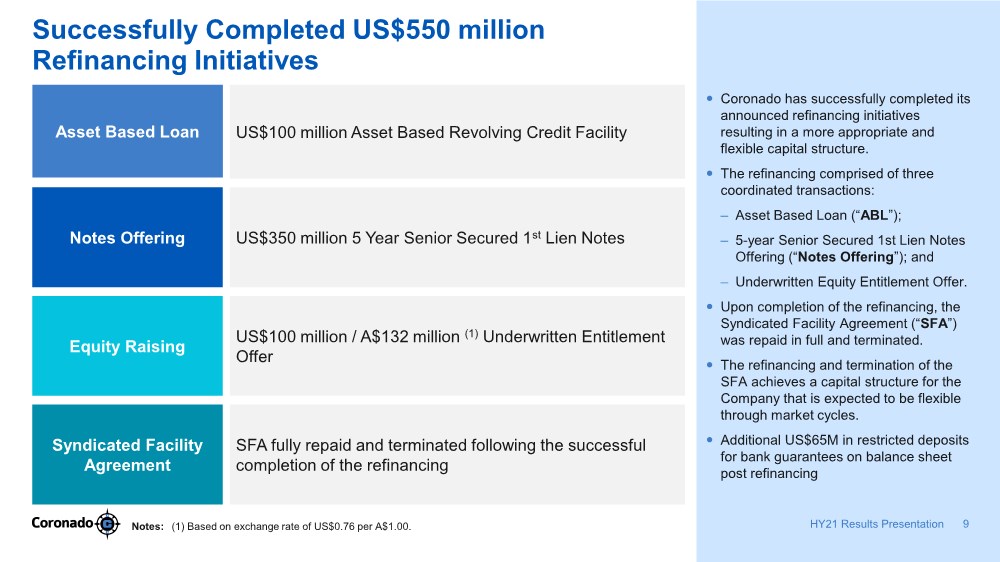
| Successfully Completed US$550 million Refinancing Initiatives Coronado has successfully completed its announced refinancing initiatives resulting in a more appropriate and flexible capital structure. The refinancing comprised of three coordinated transactions: – Asset Based Loan (“ABL”); – 5-year Senior Secured 1st Lien Notes Offering (“Notes Offering”); and – Underwritten Equity Entitlement Offer. Upon completion of the refinancing, the Syndicated Facility Agreement (“SFA”) was repaid in full and terminated. The refinancing and termination of the SFA achieves a capital structure for the Company that is expected to be flexible through market cycles. Additional US$65M in restricted deposits for bank guarantees on balance sheet post refinancing 9 HY21 Results Presentation US$100 million Asset Based Revolving Credit Facility Asset Based Loan SFA fully repaid and terminated following the successful completion of the refinancing Syndicated Facility Agreement Notes Offering US$350 million 5 Year Senior Secured 1st Lien Notes Equity Raising US$100 million / A$132 million (1) Underwritten Entitlement Offer Notes: (1) Based on exchange rate of US$0.76 per A$1.00. |
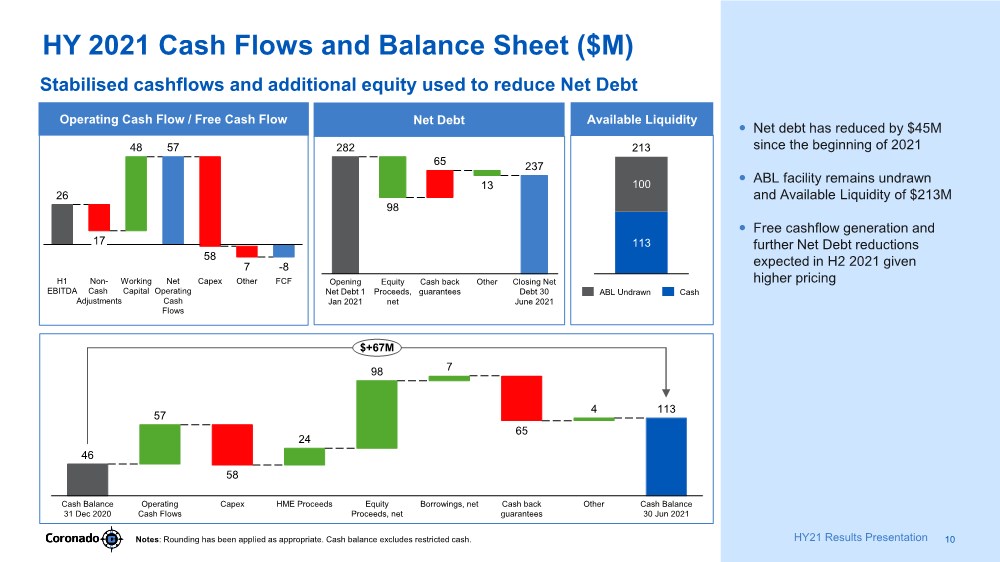
| 10 HY 2021 Cash Flows and Balance Sheet ($M) Notes: Rounding has been applied as appropriate. Cash balance excludes restricted cash. Operating Cash Flow / Free Cash Flow Net Debt Available Liquidity 26 57 -8 48 FCF 58 Working Capital H1 EBITDA Non- Cash Adjustments Net Operating Cash Flows Capex Other 17 7 282 237 65 Equity Proceeds, net Opening Net Debt 1 Jan 2021 Cash back guarantees Closing Net Debt 30 June 2021 Other 98 13 113 100 213 ABL Undrawn Cash 46 113 57 24 98 7 4 Equity Proceeds, net Cash Balance 31 Dec 2020 Operating Cash Flows Capex Other HME Proceeds Cash back guarantees Borrowings, net Cash Balance 30 Jun 2021 58 65 $+67M Net debt has reduced by $45M since the beginning of 2021 ABL facility remains undrawn and Available Liquidity of $213M Free cashflow generation and further Net Debt reductions expected in H2 2021 given higher pricing Stabilised cashflows and additional equity used to reduce Net Debt HY21 Results Presentation |
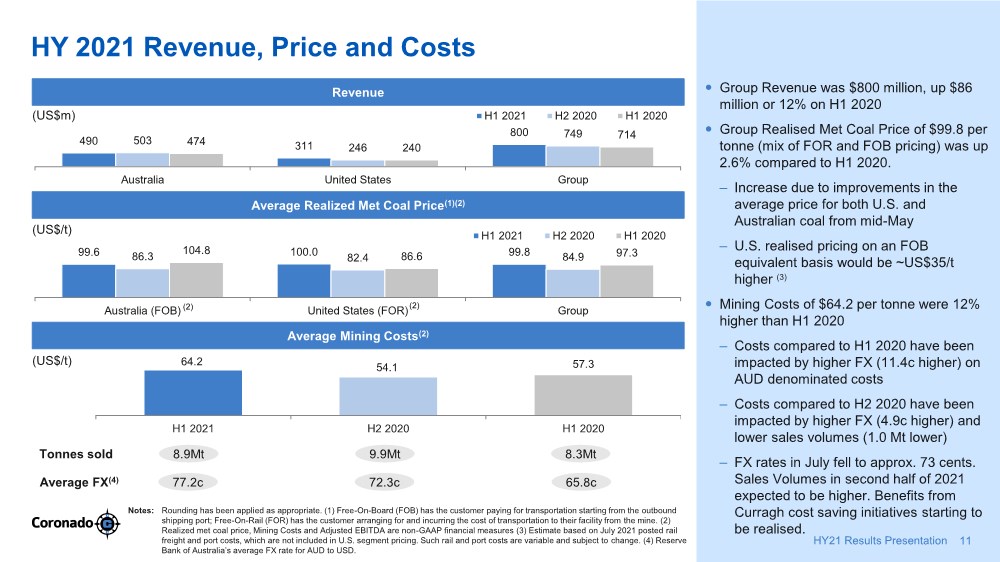
| HY 2021 Revenue, Price and Costs Notes: Rounding has been applied as appropriate. (1) Free-On-Board (FOB) has the customer paying for transportation starting from the outbound shipping port; Free-On-Rail (FOR) has the customer arranging for and incurring the cost of transportation to their facility from the mine. (2) Realized met coal price, Mining Costs and Adjusted EBITDA are non-GAAP financial measures (3) Estimate based on July 2021 posted rail freight and port costs, which are not included in U.S. segment pricing. Such rail and port costs are variable and subject to change. (4) Reserve Bank of Australia’s average FX rate for AUD to USD. Group Revenue was $800 million, up $86 million or 12% on H1 2020 Group Realised Met Coal Price of $99.8 per tonne (mix of FOR and FOB pricing) was up 2.6% compared to H1 2020. – Increase due to improvements in the average price for both U.S. and Australian coal from mid-May – U.S. realised pricing on an FOB equivalent basis would be ~US$35/t higher (3) Mining Costs of $64.2 per tonne were 12% higher than H1 2020 – Costs compared to H1 2020 have been impacted by higher FX (11.4c higher) on AUD denominated costs – Costs compared to H2 2020 have been impacted by higher FX (4.9c higher) and lower sales volumes (1.0 Mt lower) – FX rates in July fell to approx. 73 cents. Sales Volumes in second half of 2021 expected to be higher. Benefits from Curragh cost saving initiatives starting to be realised. Revenue (US$m) Average Realized Met Coal Price(1)(2) (US$/t) Average Mining Costs(2) (US$/t) 64.2 54.1 57.3 H1 2021 H2 2020 H1 2020 490 311 800 503 246 749 474 240 714 Australia United States Group H1 2021 H2 2020 H1 2020 99.6 100.0 99.8 86.3 82.4 84.9 104.8 86.6 97.3 Australia (FOB) United States (FOR) Group H1 2021 H2 2020 H1 2020 Tonnes sold 8.9Mt 9.9Mt 8.3Mt Average FX(4) 77.2c 72.3c 65.8c (2) (2) 11 HY21 Results Presentation |
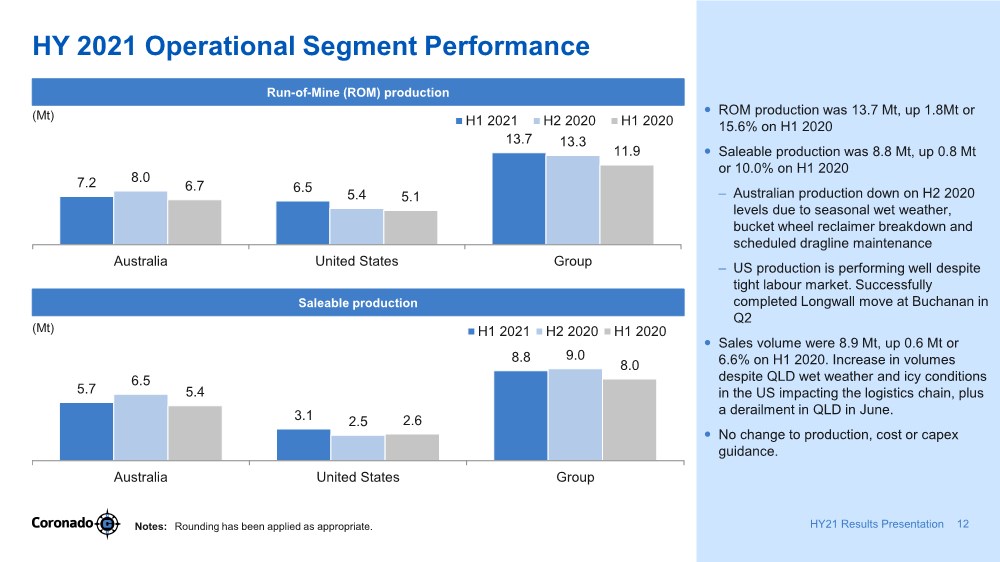
| HY 2021 Operational Segment Performance Notes: Rounding has been applied as appropriate. ROM production was 13.7 Mt, up 1.8Mt or 15.6% on H1 2020 Saleable production was 8.8 Mt, up 0.8 Mt or 10.0% on H1 2020 – Australian production down on H2 2020 levels due to seasonal wet weather, bucket wheel reclaimer breakdown and scheduled dragline maintenance – US production is performing well despite tight labour market. Successfully completed Longwall move at Buchanan in Q2 Sales volume were 8.9 Mt, up 0.6 Mt or 6.6% on H1 2020. Increase in volumes despite QLD wet weather and icy conditions in the US impacting the logistics chain, plus a derailment in QLD in June. No change to production, cost or capex guidance. Run-of-Mine (ROM) production Saleable production 7.2 6.5 13.7 8.0 5.4 13.3 6.7 5.1 11.9 Australia United States Group H1 2021 H2 2020 H1 2020 5.7 3.1 8.8 6.5 2.5 9.0 5.4 2.6 8.0 Australia United States Group H1 2021 H2 2020 H1 2020 (Mt) (Mt) 12 HY21 Results Presentation |
| 13 HY21 Results Presentation Metallurgical Coal Markets |
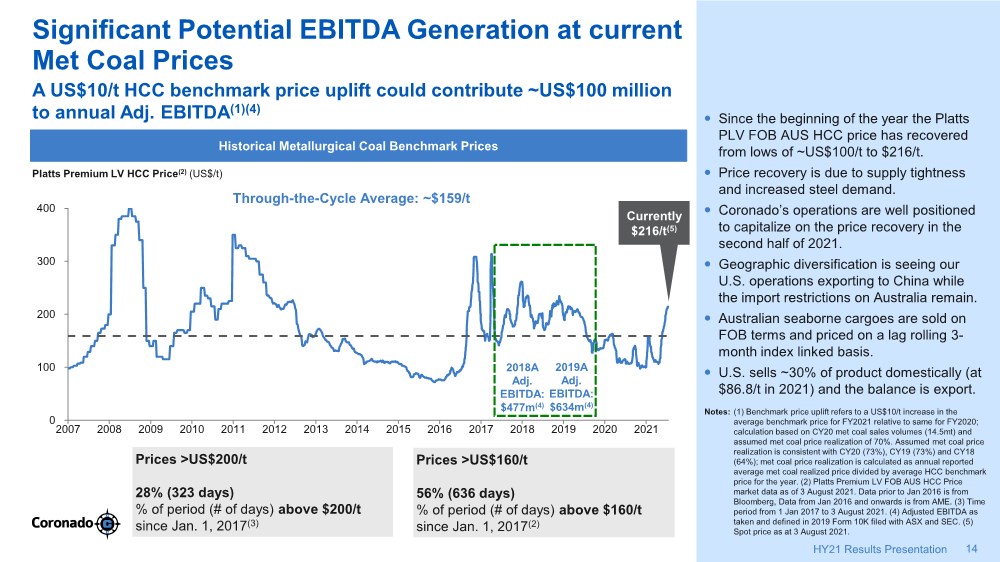
| Significant Potential EBITDA Generation at current Met Coal Prices Since the beginning of the year the Platts PLV FOB AUS HCC price has recovered from lows of ~US$100/t to $216/t. Price recovery is due to supply tightness and increased steel demand. Coronado’s operations are well positioned to capitalize on the price recovery in the second half of 2021. Geographic diversification is seeing our U.S. operations exporting to China while the import restrictions on Australia remain. Australian seaborne cargoes are sold on FOB terms and priced on a lag rolling 3- month index linked basis. U.S. sells ~30% of product domestically (at $86.8/t in 2021) and the balance is export. 14 HY21 Results Presentation Notes: (1) Benchmark price uplift refers to a US$10/t increase in the average benchmark price for FY2021 relative to same for FY2020; calculation based on CY20 met coal sales volumes (14.5mt) and assumed met coal price realization of 70%. Assumed met coal price realization is consistent with CY20 (73%), CY19 (73%) and CY18 (64%); met coal price realization is calculated as annual reported average met coal realized price divided by average HCC benchmark price for the year. (2) Platts Premium LV FOB AUS HCC Price market data as of 3 August 2021. Data prior to Jan 2016 is from Bloomberg, Data from Jan 2016 and onwards is from AME. (3) Time period from 1 Jan 2017 to 3 August 2021. (4) Adjusted EBITDA as taken and defined in 2019 Form 10K filed with ASX and SEC. (5) Spot price as at 3 August 2021. A US$10/t HCC benchmark price uplift could contribute ~US$100 million to annual Adj. EBITDA(1)(4) Historical Metallurgical Coal Benchmark Prices Prices >US$200/t 28% (323 days) % of period (# of days) above $200/t since Jan. 1, 2017(3) 0 100 200 300 400 2007 2008 2009 2010 2011 2012 2013 2014 2015 2016 2017 2018 2019 2020 2021 Prices >US$160/t 56% (636 days) % of period (# of days) above $160/t since Jan. 1, 2017(2) Currently $216/t(5) Through-the-Cycle Average: ~$159/t 2018A Adj. EBITDA: $477m(4) 2019A Adj. EBITDA: $634m(4) Platts Premium LV HCC Price(2) (US$/t) |
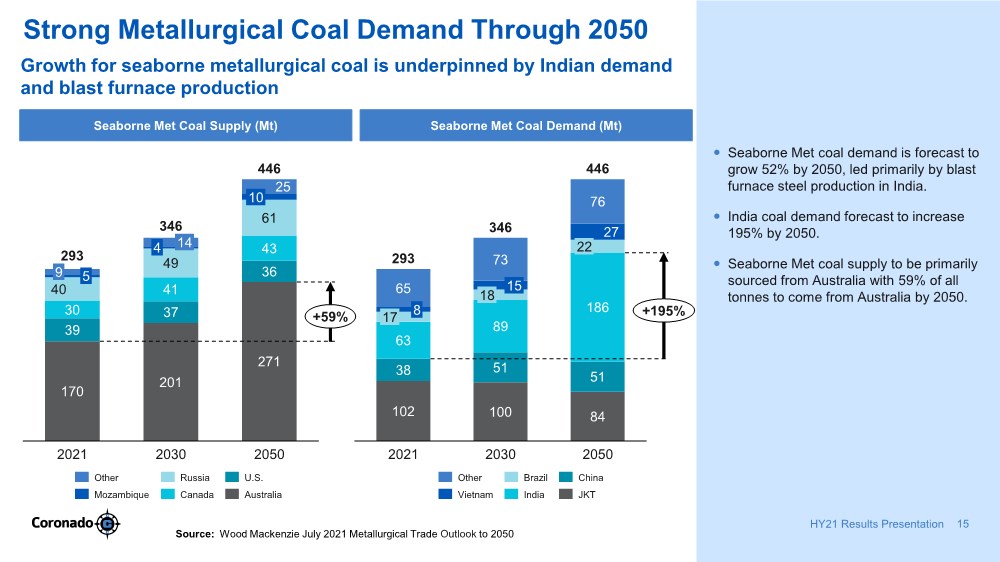
| Strong Metallurgical Coal Demand Through 2050 15 HY21 Results Presentation Growth for seaborne metallurgical coal is underpinned by Indian demand and blast furnace production Source: Wood Mackenzie July 2021 Metallurgical Trade Outlook to 2050 Seaborne Met Coal Supply (Mt) Seaborne Met Coal Demand (Mt) Seaborne Met coal demand is forecast to grow 52% by 2050, led primarily by blast furnace steel production in India. India coal demand forecast to increase 195% by 2050. Seaborne Met coal supply to be primarily sourced from Australia with 59% of all tonnes to come from Australia by 2050. 170 201 271 39 37 36 30 41 43 40 49 61 25 4 9 2050 5 2021 2030 14 10 293 346 446 +59% Other Canada Mozambique Russia U.S. Australia 102 100 84 38 51 51 63 89 186 27 65 73 76 2050 346 22 15 8 18 17 2030 2021 293 446 +195% Other Brazil Vietnam China India JKT |
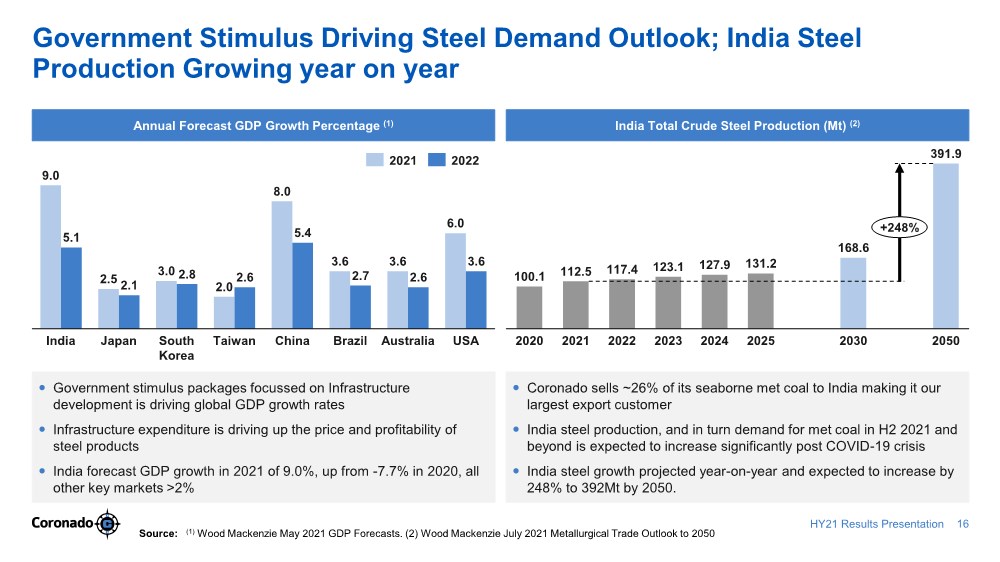
| Government Stimulus Driving Steel Demand Outlook; India Steel Production Growing year on year Source: (1) Wood Mackenzie May 2021 GDP Forecasts. (2) Wood Mackenzie July 2021 Metallurgical Trade Outlook to 2050 Annual Forecast GDP Growth Percentage (1) India Total Crude Steel Production (Mt) (2) 9.0 2.5 3.0 2.0 8.0 3.6 3.6 6.0 5.1 2.1 2.8 2.6 5.4 2.7 2.6 3.6 Brazil India Australia Taiwan China South Korea Japan USA 2021 2022 100.1 112.5 117.4 123.1 127.9 131.2 168.6 391.9 2020 2021 2022 2030 2023 2050 2024 2025 +248% Government stimulus packages focussed on Infrastructure development is driving global GDP growth rates Infrastructure expenditure is driving up the price and profitability of steel products India forecast GDP growth in 2021 of 9.0%, up from -7.7% in 2020, all other key markets >2% Coronado sells ~26% of its seaborne met coal to India making it our largest export customer India steel production, and in turn demand for met coal in H2 2021 and beyond is expected to increase significantly post COVID-19 crisis India steel growth projected year-on-year and expected to increase by 248% to 392Mt by 2050. 16 HY21 Results Presentation |
| ESG GERRY SPINDLER MANAGING DIRECTOR AND CEO |
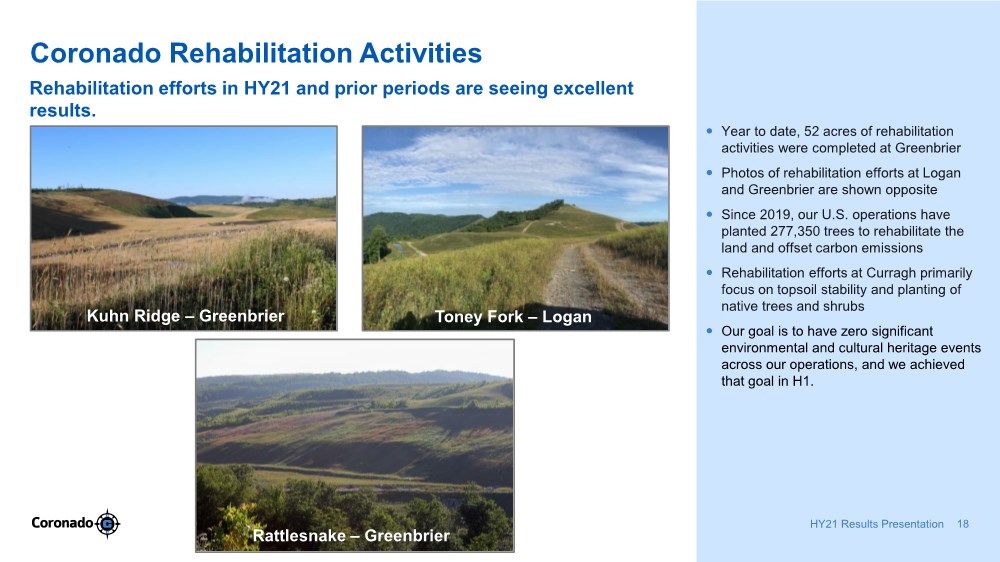
| Coronado Rehabilitation Activities 18 HY21 Results Presentation Year to date, 52 acres of rehabilitation activities were completed at Greenbrier Photos of rehabilitation efforts at Logan and Greenbrier are shown opposite Since 2019, our U.S. operations have planted 277,350 trees to rehabilitate the land and offset carbon emissions Rehabilitation efforts at Curragh primarily focus on topsoil stability and planting of native trees and shrubs Our goal is to have zero significant environmental and cultural heritage events across our operations, and we achieved that goal in H1. Rehabilitation efforts in HY21 and prior periods are seeing excellent results. Kuhn Ridge – Greenbrier Toney Fork – Logan Rattlesnake – Greenbrier |
| Sustainability 19 HY21 Results Presentation Coronado’s Sustainability Report details the Company’s commitments in respect of Safety, Health, People, Community, Environment and Climate Change. Climate risks and opportunities increasingly form part of our strategic thinking and investment decisions. We monitor our emissions, and we are investing in research and development to ensure we are well positioned for a transition to a low-carbon economy. During HY 2021, Coronado commenced work partnering with industry experts on preparing an Energy Transition Plan. Coronado expects to release the outcomes of this plan in the second half of the year. Coronado released its 2020 Sustainability Report during HY 2021 Notes: Coronado Sustainability Report located on our website at https://coronadoglobal.com/environment-social-governance/ |
| Coronado Outlook |

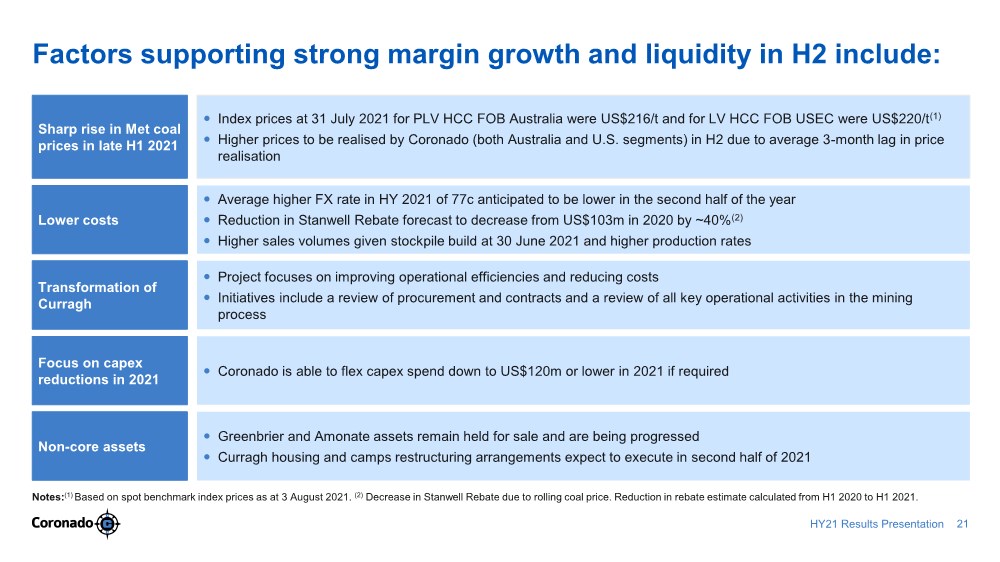
| Factors supporting strong margin growth and liquidity in H2 include: Notes:(1) Based on spot benchmark index prices as at 3 August 2021. (2) Decrease in Stanwell Rebate due to rolling coal price. Reduction in rebate estimate calculated from H1 2020 to H1 2021. Index prices at 31 July 2021 for PLV HCC FOB Australia were US$216/t and for LV HCC FOB USEC were US$220/t(1) Higher prices to be realised by Coronado (both Australia and U.S. segments) in H2 due to average 3-month lag in price realisation Sharp rise in Met coal prices in late H1 2021 Average higher FX rate in HY 2021 of 77c anticipated to be lower in the second half of the year Reduction in Stanwell Rebate forecast to decrease from US$103m in 2020 by ~40%(2) Higher sales volumes given stockpile build at 30 June 2021 and higher production rates Lower costs Project focuses on improving operational efficiencies and reducing costs Initiatives include a review of procurement and contracts and a review of all key operational activities in the mining process Transformation of Curragh Coronado is able to flex capex spend down to US$120m or lower in 2021 if required Focus on capex reductions in 2021 Greenbrier and Amonate assets remain held for sale and are being progressed Curragh housing and camps restructuring arrangements expect to execute in second half of 2021 Non-core assets 21 HY21 Results Presentation |
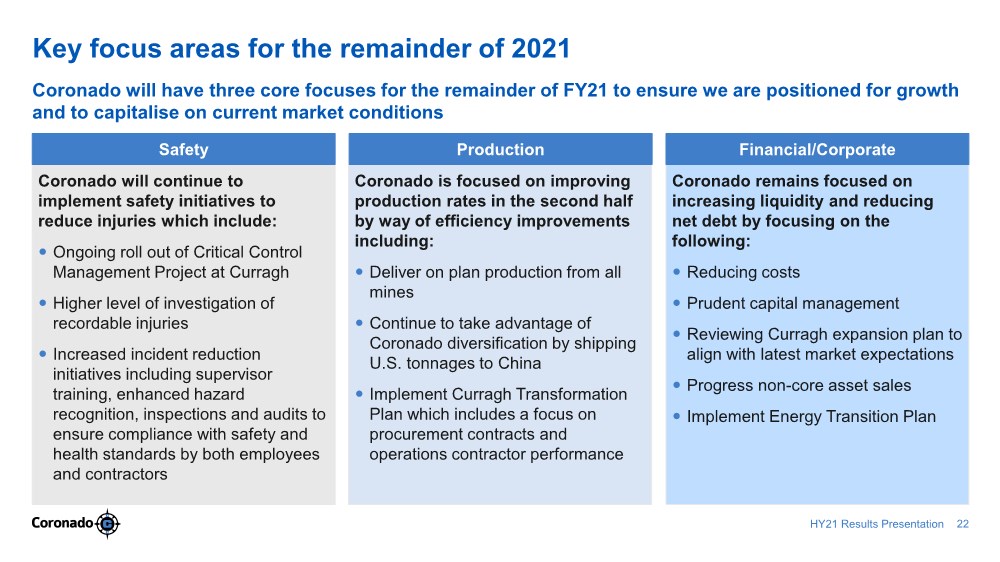
| Key focus areas for the remainder of 2021 Coronado will continue to implement safety initiatives to reduce injuries which include: Ongoing roll out of Critical Control Management Project at Curragh Higher level of investigation of recordable injuries Increased incident reduction initiatives including supervisor training, enhanced hazard recognition, inspections and audits to ensure compliance with safety and health standards by both employees and contractors Safety Coronado is focused on improving production rates in the second half by way of efficiency improvements including: Deliver on plan production from all mines Continue to take advantage of Coronado diversification by shipping U.S. tonnages to China Implement Curragh Transformation Plan which includes a focus on procurement contracts and operations contractor performance Production Coronado remains focused on increasing liquidity and reducing net debt by focusing on the following: Reducing costs Prudent capital management Reviewing Curragh expansion plan to align with latest market expectations Progress non-core asset sales Implement Energy Transition Plan Financial/Corporate Coronado will have three core focuses for the remainder of FY21 to ensure we are positioned for growth and to capitalise on current market conditions 22 HY21 Results Presentation |
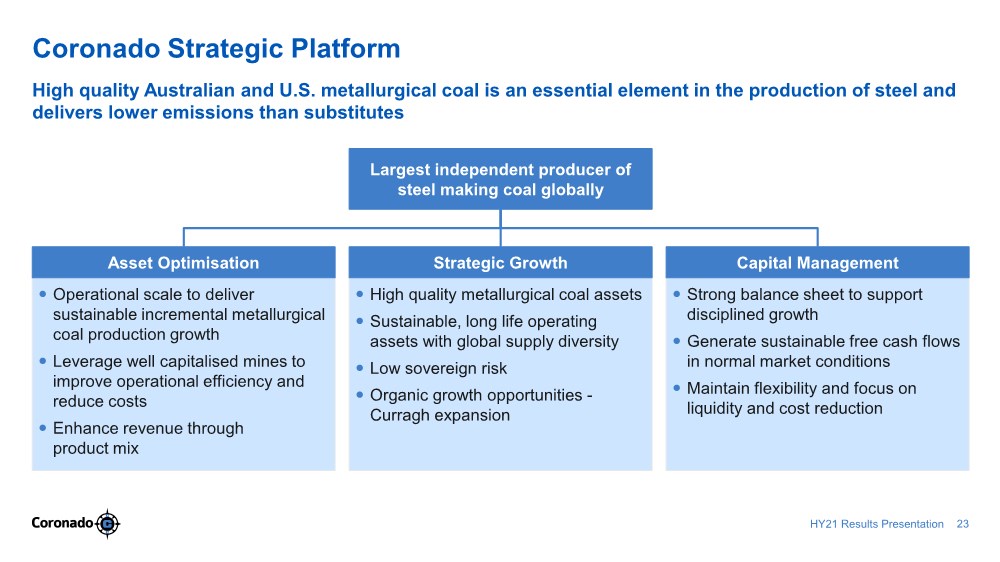
| Coronado Strategic Platform High quality Australian and U.S. metallurgical coal is an essential element in the production of steel and delivers lower emissions than substitutes Operational scale to deliver sustainable incremental metallurgical coal production growth Leverage well capitalised mines to improve operational efficiency and reduce costs Enhance revenue through product mix Asset Optimisation High quality metallurgical coal assets Sustainable, long life operating assets with global supply diversity Low sovereign risk Organic growth opportunities - Curragh expansion Strategic Growth Strong balance sheet to support disciplined growth Generate sustainable free cash flows in normal market conditions Maintain flexibility and focus on liquidity and cost reduction Capital Management Largest independent producer of steel making coal globally 23 HY21 Results Presentation |
| QUESTIONS |

| Disclaimer The material contained in this presentation is intended to be general background information on Coronado Global Resources (Coronado) and its activities. The information is supplied in summary form and is therefore not necessarily complete. It is not intended that it be relied upon as advice to investors or potential investors, who should consider seeking independent professional advice depending upon their specific investment objectives, financial situation or particular needs. The material contained in this presentation may include information derived from publicly available sources that have not been independently verified. No representation or warranty is made as to the accuracy, completeness or reliability of the information. All amounts are in United States dollars unless otherwise indicated. The presentation of certain financial information may not be compliant with financial captions in the primary financial statements prepared under US GAAP. Refer to Coronado’s 2020 FORM 10-Q for the three and six months ended June 30, 2021 available at www.coronadoglobal.com for details of the basis primary financial statements prepared under US GAAP. This presentation contains statements that constitute “forward-looking statements” within the meaning of Section 21E of the US Securities Exchange Act of 1934. Forward looking statements are statements about matters that are not historical facts. Forward-looking statements appear in a number of places in this presentation and include statements regarding our intent, belief or current expectations with respect to our business and operations, market conditions and results of operations. This report contains forward-looking statements concerning our business, operations, financial performance and condition, the coal, steel and other industries, as well as our plans, objectives and expectations for our business, operations, financial performance and condition. Forward-looking statements may be identified by words such as "may," "could," "believes," "estimates," "expects," "intends," "considers", “forecasts”, “targets” and other similar words that involve risk and uncertainties. Forward-looking statements provide management's current expectations or predictions of future conditions, events or results. All statements that address operating performance, events or developments that we expect or anticipate will occur in the future are forward-looking statements. They may include estimates of revenues, income, earnings per share, cost savings, capital expenditures, dividends, share repurchases, liquidity, capital structure, market share, industry volume, or other financial items, descriptions of management’s plans or objectives for future operations, or descriptions of assumptions underlying any of the above. All forward-looking statements speak only as of the date they are made and reflect the company's good faith beliefs, assumptions and expectations, but they are not guarantees of future performance or events. Furthermore, the company disclaims any obligation to publicly update or revise any forward-looking statement, except as required by law. By their nature, forward-looking statements are subject to risks and uncertainties that could cause actual results to differ materially from those suggested by the forward-looking statements. Factors that might cause such differences include, but are not limited to, a variety of economic, competitive and regulatory factors, many of which are beyond the Company's control, that are described in our Annual Report on Form 10-K with the ASX and SEC on 26 February 2021, as well as additional factors we may describe from time to time in other filings with the ASX and SEC. You may get such filings for free at our website at www.coronadoglobal.com. You should understand that it is not possible to predict or identify all such factors and, consequently, you should not consider any such list to be a complete set of all potential risks or uncertainties. In this announcement, references to ore reserves (Reserves) are compliant with the Australasian Code for Reporting of Exploration Results, Mineral Resources and Ore Reserves 2012 (JORC Code) and are measured in accordance with the JORC Code. Information in this ASX Release relating to Coal Reserves and Coal Resources is extracted from information previously published by Coronado and available on the Coronado and ASX websites (2020 JORC Statement also released to the ASX on 26 February 2021). For details of the Coal Reserves and Coal Resources estimates and the Competent Persons statements, refer to relevant Australian and US Operations sections in the 2020 JORC Statement. Coronado confirms that it is not aware of any new information or data that materially affects the information included in the 2020 JORC Statement, and that all assumptions and technical parameters underpinning the estimates in the 2020 JORC Statement continue to apply and have not materially changed. Coronado confirms that the context in which the Competent Persons’ findings are presented have not been materially modified from the 2020 JORC Statement. 25 HY21 Results Presentation |
| SUPPLEMENTARY INFORMATION |
| Reconciliation of Non-GAAP measures This report includes a discussion of results of operations and references to and analysis of certain non-GAAP measures (as described below) which are financial measures not recognised in accordance with U.S. GAAP. Non-GAAP financial measures are used by the Company and investors to measure operating performance. Management uses a variety of financial and operating metrics to analyse performance. These metrics are significant factors in assessing operating results and profitability. These financial and operating metrics include:(i) safety and environmental metrics;(ii) Adjusted EBITDA, (iii) Metallurgical coal sales volumes and average realised price per Mt of metallurgical coal sold, which we define as metallurgical coal revenues divided by metallurgical sales volumes;(iv) average mining costs per Mt sold, which we define as mining costs divided by sales volumes; and (v) average operating costs per Mt sold, which we define as operating costs divided by sales volumes. Investors should be aware that the Company’s presentation of Adjusted EBITDA may not be comparable to similarly titled financial measures used by other companies. Reconciliations of certain forward-looking non-GAAP financial measures, including market guidance, to the most directly comparable GAAP financial measures are not provided because the Company is unable to provide such reconciliations without unreasonable effort, due to the uncertainty and inherent difficulty of predicting the occurrence and the financial impact of items impacting comparability and the periods in which such items may be recognised. For the same reasons, the Company is unable to address the probable significance of the unavailable information, which could be material to future results. HY21 Results Presentation 27 |
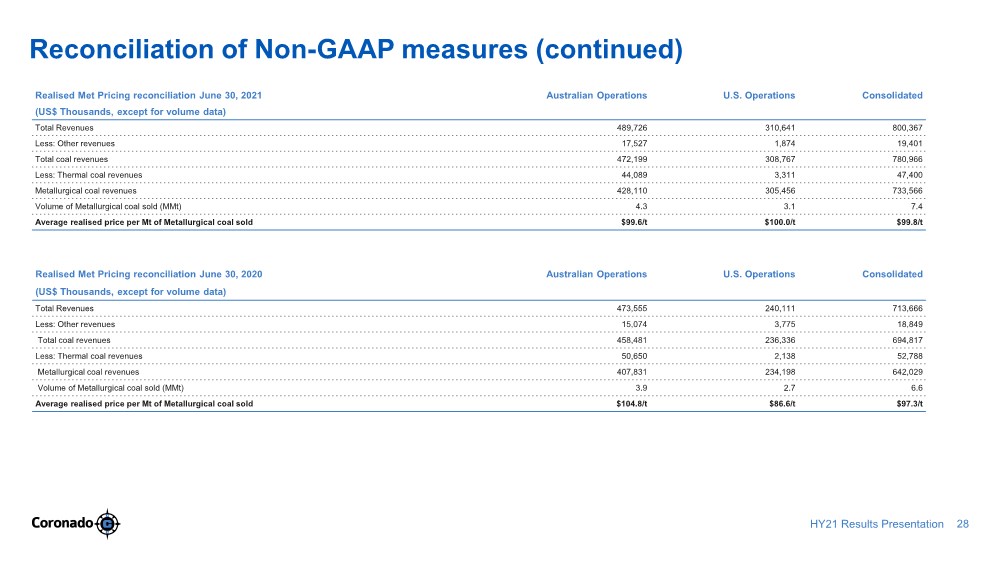
| Reconciliation of Non-GAAP measures (continued) Realised Met Pricing reconciliation June 30, 2021 Australian Operations U.S. Operations Consolidated (US$ Thousands, except for volume data) Total Revenues 489,726 310,641 800,367 Less: Other revenues 17,527 1,874 19,401 Total coal revenues 472,199 308,767 780,966 Less: Thermal coal revenues 44,089 3,311 47,400 Metallurgical coal revenues 428,110 305,456 733,566 Volume of Metallurgical coal sold (MMt) 4.3 3.1 7.4 Average realised price per Mt of Metallurgical coal sold $99.6/t $100.0/t $99.8/t Realised Met Pricing reconciliation June 30, 2020 Australian Operations U.S. Operations Consolidated (US$ Thousands, except for volume data) Total Revenues 473,555 240,111 713,666 Less: Other revenues 15,074 3,775 18,849 Total coal revenues 458,481 236,336 694,817 Less: Thermal coal revenues 50,650 2,138 52,788 Metallurgical coal revenues 407,831 234,198 642,029 Volume of Metallurgical coal sold (MMt) 3.9 2.7 6.6 Average realised price per Mt of Metallurgical coal sold $104.8/t $86.6/t $97.3/t HY21 Results Presentation 28 |
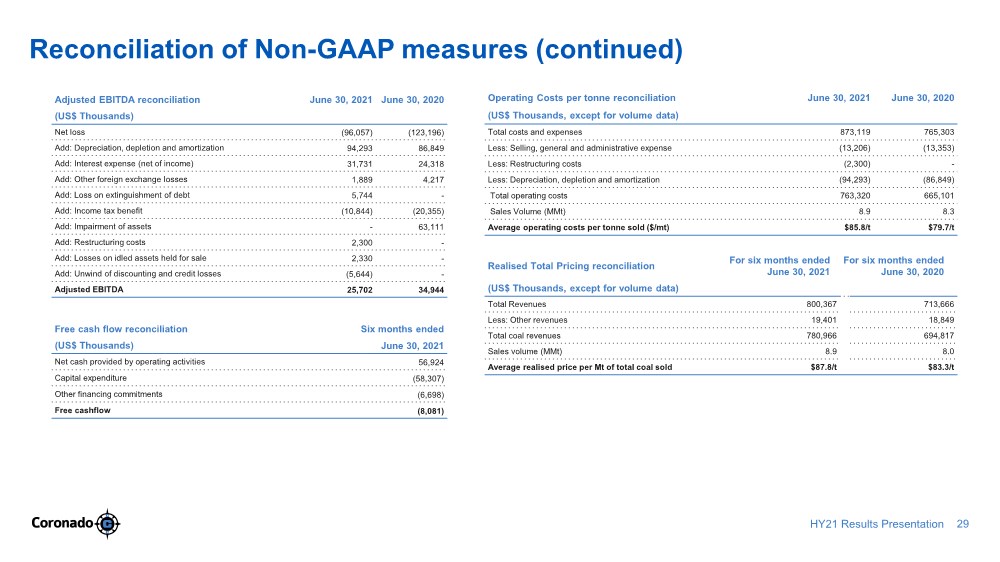
| Reconciliation of Non-GAAP measures (continued) Adjusted EBITDA reconciliation June 30, 2021 June 30, 2020 (US$ Thousands) Net loss (96,057) (123,196) Add: Depreciation, depletion and amortization 94,293 86,849 Add: Interest expense (net of income) 31,731 24,318 Add: Other foreign exchange losses 1,889 4,217 Add: Loss on extinguishment of debt 5,744 - Add: Income tax benefit (10,844) (20,355) Add: Impairment of assets - 63,111 Add: Restructuring costs 2,300 - Add: Losses on idled assets held for sale 2,330 - Add: Unwind of discounting and credit losses (5,644) - Adjusted EBITDA 25,702 34,944 Operating Costs per tonne reconciliation June 30, 2021 June 30, 2020 (US$ Thousands, except for volume data) Total costs and expenses 873,119 765,303 Less: Selling, general and administrative expense (13,206) (13,353) Less: Restructuring costs (2,300) - Less: Depreciation, depletion and amortization (94,293) (86,849) Total operating costs 763,320 665,101 Sales Volume (MMt) 8.9 8.3 Average operating costs per tonne sold ($/mt) $85.8/t $79.7/t HY21 Results Presentation 29 Realised Total Pricing reconciliation For six months ended June 30, 2021 For six months ended June 30, 2020 (US$ Thousands, except for volume data) Total Revenues 800,367 713,666 Less: Other revenues 19,401 18,849 Total coal revenues 780,966 694,817 Sales volume (MMt) 8.9 8.0 Average realised price per Mt of total coal sold $87.8/t $83.3/t Free cash flow reconciliation Six months ended (US$ Thousands) June 30, 2021 Net cash provided by operating activities 56,924 Capital expenditure (58,307) Other financing commitments (6,698) Free cashflow (8,081) |
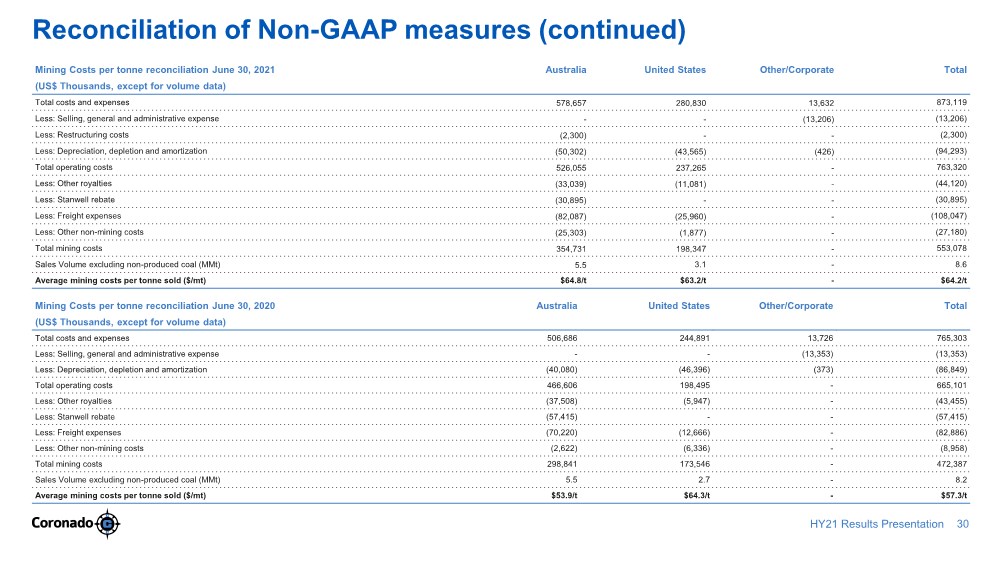
| Reconciliation of Non-GAAP measures (continued) Mining Costs per tonne reconciliation June 30, 2021 Australia United States Other/Corporate Total (US$ Thousands, except for volume data) Total costs and expenses 578,657 280,830 13,632 873,119 Less: Selling, general and administrative expense --(13,206) (13,206) Less: Restructuring costs (2,300) --(2,300) Less: Depreciation, depletion and amortization (50,302) (43,565) (426) (94,293) Total operating costs 526,055 237,265 - 763,320 Less: Other royalties (33,039) (11,081) -(44,120) Less: Stanwell rebate (30,895) --(30,895) Less: Freight expenses (82,087) (25,960) -(108,047) Less: Other non-mining costs (25,303) (1,877) -(27,180) Total mining costs 354,731 198,347 - 553,078 Sales Volume excluding non-produced coal (MMt) 5.5 3.1 - 8.6 Average mining costs per tonne sold ($/mt) $64.8/t $63.2/t - $64.2/t Mining Costs per tonne reconciliation June 30, 2020 Australia United States Other/Corporate Total (US$ Thousands, except for volume data) Total costs and expenses 506,686 244,891 13,726 765,303 Less: Selling, general and administrative expense --(13,353) (13,353) Less: Depreciation, depletion and amortization (40,080) (46,396) (373) (86,849) Total operating costs 466,606 198,495 - 665,101 Less: Other royalties (37,508) (5,947) -(43,455) Less: Stanwell rebate (57,415) --(57,415) Less: Freight expenses (70,220) (12,666) -(82,886) Less: Other non-mining costs (2,622) (6,336) -(8,958) Total mining costs 298,841 173,546 - 472,387 Sales Volume excluding non-produced coal (MMt) 5.5 2.7 - 8.2 Average mining costs per tonne sold ($/mt) $53.9/t $64.3/t - $57.3/t 30 HY21 Results Presentation |
| CONTACTS Investors: Andrew Mooney P: +61 458 666 639 E: amooney@coronadoglobal.com E: investors@coronadoglobal.com Media: Brett Clegg Citadel Magnus P: +61 487 436 985 |