Attached files
| file | filename |
|---|---|
| 8-K - 8-K - INSIGHT ENTERPRISES INC | nsit-8k_20210805.htm |
| EX-99.1 - EX-99.1 - INSIGHT ENTERPRISES INC | nsit-ex991_7.htm |

Insight Enterprises, Inc. Second Quarter 2021 Earnings Conference Call and Webcast Exhibit 99.2
Agenda Disclosures CEO Commentary Second Quarter 2021 Highlights Emerging Technology: Artificial Intelligence and Computer Vision Diverse Solutions Offerings Business and Leadership Recognitions CFO Commentary Second Quarter 2021 Financial Highlights by Region Cashflow and Debt Covenants 2021 Outlook Closing Comments
Disclosures Safe harbor statement This presentation includes “forward-looking statements” within the meaning of the Private Securities Litigation Reform Act of 1995 related to Insight’s plans and expectations. Statements that are not historical facts, including those related to coronavirus strain COVID-19 (“COVID-19”), our future responses to and the impact of COVID-19 on our Company, our expectations about future financial results, our expectations regarding current supply constraints, our expectations regarding backlog shipments, future expected trends in the IT market and our opportunities for growth, are forward-looking statements. These forward-looking statements are subject to assumptions, risks and uncertainties which could cause actual results or future events to differ materially from such statements. The Company undertakes no obligation to update publicly or revise any of the forward-looking statements, except as otherwise required by law. More detailed information about risk factors is included in today’s press release and discussed in the Company’s most recently filed periodic reports and subsequent filings with the Securities and Exchange Commission. Non-GAAP measures This presentation will reference certain non-GAAP financial information as ‘Adjusted’. A reconciliation of non-GAAP financial measures presented in this document to our actual GAAP results is attached to the back of this presentation and included in the press release issued today, which you may find on the Investor Relations section of our website at investor.insight.com. These non-GAAP measures are used by the Company and its management to evaluate financial performance against budgeted amounts, to calculate incentive compensation, to assist in forecasting future performance and to compare the Company’s results to those of the Company’s competitors. The Company believes that these non-GAAP financial measures are useful to investors because they allow for greater transparency, facilitate comparisons to prior periods and the Company’s competitors’ results and assist in forecasting performance for future periods. These non-GAAP financial measures are not prepared in accordance with GAAP and may be different from non-GAAP financial measures presented by other companies. Non-GAAP financial measures should not be considered as a substitute for, or superior to, measures of financial performance prepared in accordance with GAAP. Constant currency In some instances the Company refers to changes in net sales, gross profit and earnings from operations on a consolidated basis and in North America, EMEA and APAC excluding the effects of fluctuating foreign currency exchange rates. In computing these changes and percentages, the Company compares the current year amount as translated into U.S. dollars under the applicable accounting standards to the prior year amount in local currency translated into U.S. dollars utilizing the weighted average translation rate for the current period.
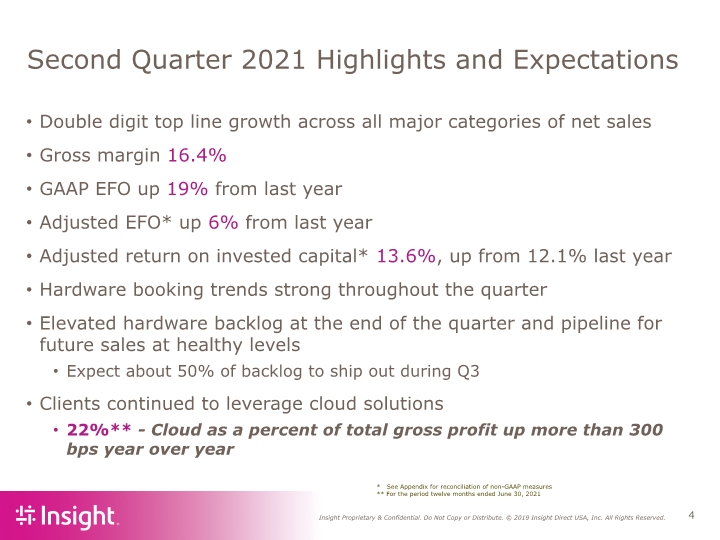
Second Quarter 2021 Highlights and Expectations Double digit top line growth across all major categories of net sales Gross margin 16.4% GAAP EFO up 19% from last year Adjusted EFO* up 6% from last year Adjusted return on invested capital* 13.6%, up from 12.1% last year Hardware booking trends strong throughout the quarter Elevated hardware backlog at the end of the quarter and pipeline for future sales at healthy levels Expect about 50% of backlog to ship out during Q3 Clients continued to leverage cloud solutions 22%** - Cloud as a percent of total gross profit up more than 300 bps year over year * See Appendix for reconciliation of non-GAAP measures ** For the period twelve months ended June 30, 2021
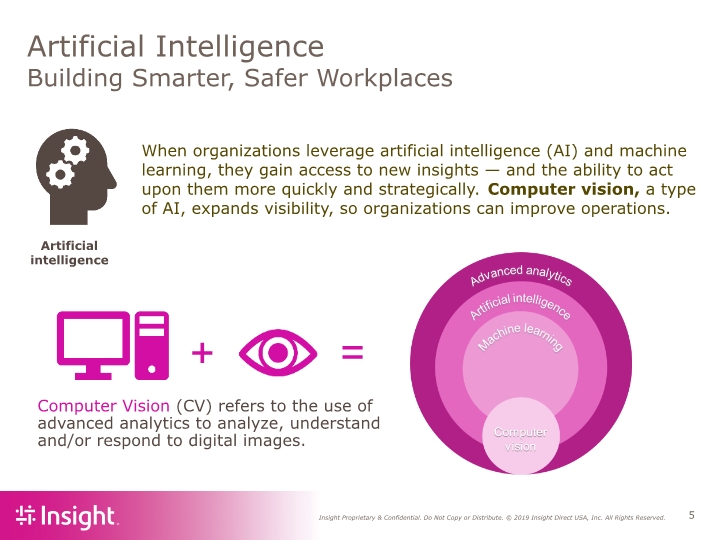
Artificial Intelligence Building Smarter, Safer Workplaces When organizations leverage artificial intelligence (AI) and machine learning, they gain access to new insights — and the ability to act upon them more quickly and strategically. Computer vision, a type of AI, expands visibility, so organizations can improve operations. Computer Vision (CV) refers to the use of advanced analytics to analyze, understand and/or respond to digital images.
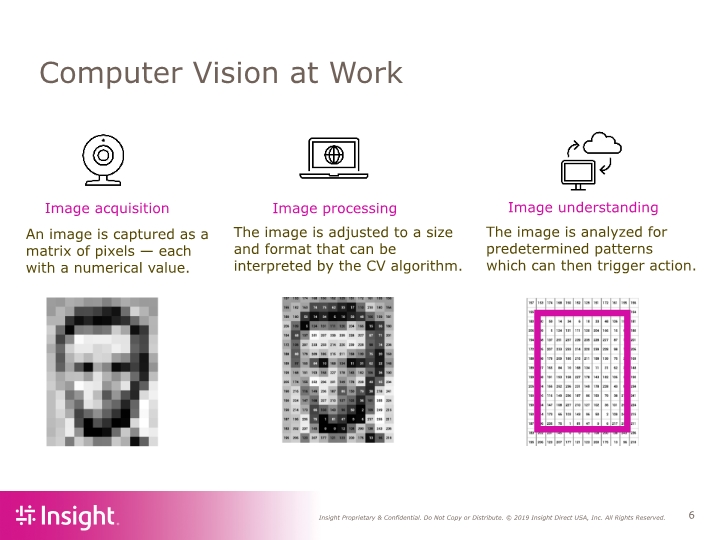
Computer Vision at Work Image processing Image acquisition Image understanding An image is captured as a matrix of pixels — each with a numerical value. The image is adjusted to a size and format that can be interpreted by the CV algorithm. The image is analyzed for predetermined patterns which can then trigger action.
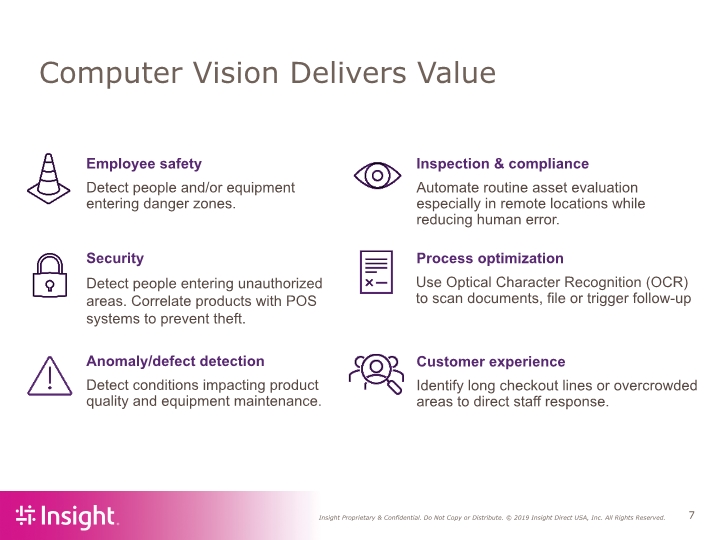
Computer Vision Delivers Value Employee safety Detect people and/or equipment entering danger zones. Anomaly/defect detection Detect conditions impacting product quality and equipment maintenance. Security Detect people entering unauthorized areas. Correlate products with POS systems to prevent theft. Process optimization Use Optical Character Recognition (OCR) to scan documents, file or trigger follow-up Customer experience Identify long checkout lines or overcrowded areas to direct staff response. Inspection & compliance Automate routine asset evaluation especially in remote locations while reducing human error.
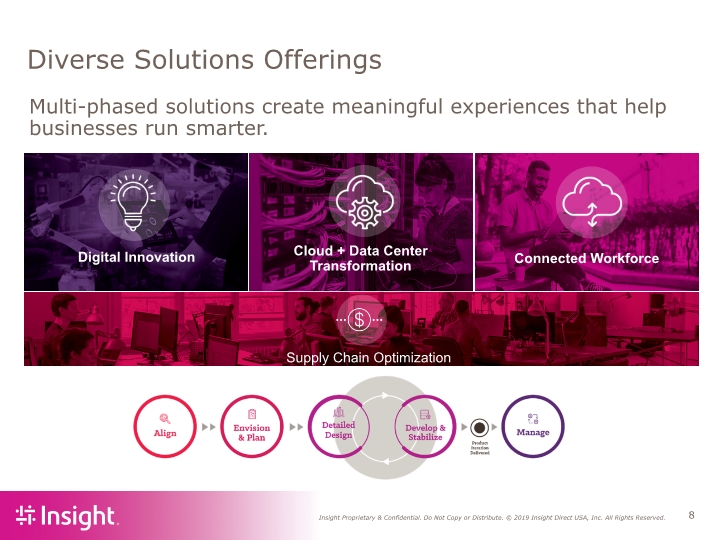
Diverse Solutions Offerings Multi-phased solutions create meaningful experiences that help businesses run smarter.
Insight Business Recognitions #360 on the Fortune 500 rankings for 2021 – improved 49 spots One of 11 providers globally to be recognized in the Gartner Magic Quadrant for Software Asset Management Managed Services Earned four of Microsoft’s most prestigious awards after a record-setting year: Worldwide Migration to Azure Partner of the Year for demonstrating excellence in innovation and implementation of customer solutions Worldwide Solution Assessments Partner of the Year for our use of deep data and analytics capability to help clients achieve a cohesive, single source for data Worldwide Microsoft 365 & Surface Solution Selling Partner of the Year recognizing our efforts to sell complete modern workplace solutions US Application Innovation Partner of the Year for leadership in customer impact, solution innovation, deployment and exceptional use of advanced features in Microsoft technologies

Insight Leadership Recognitions Insight’s values of Hunger, Heart, and Harmony are core to how our teammates treat one another, engage with those we work with every day, and improve the communities where we work and live. CFO Named to The Top 100 Women Leaders in Technology of 2021 by Women We Admire Honored as one of Phoenix Business Journal’s Most Admired Leaders CIO named Global CIO of the Year by Arizona CIO 16 Insight women recognized with CRN Women in the Channel Awards Four named to CRN’s Power 60 Solutions Providers, elite subset of female executives at solution provider organizations whose insight and influence drive channel success
CFO Commentary Second Quarter 2021 Financial Highlights by Region Cashflow and Debt Covenants 2021 Outlook
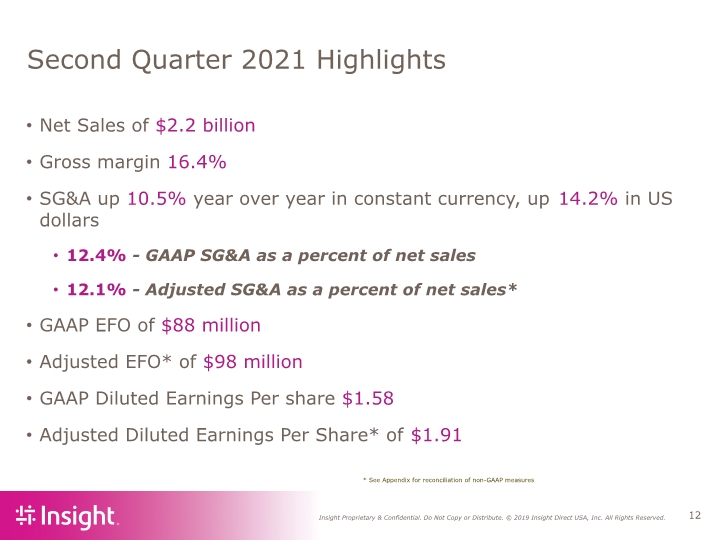
Second Quarter 2021 Highlights Net Sales of $2.2 billion Gross margin 16.4% SG&A up 10.5% year over year in constant currency, up 14.2% in US dollars 12.4% - GAAP SG&A as a percent of net sales 12.1% - Adjusted SG&A as a percent of net sales* GAAP EFO of $88 million Adjusted EFO* of $98 million GAAP Diluted Earnings Per share $1.58 Adjusted Diluted Earnings Per Share* of $1.91 * See Appendix for reconciliation of non-GAAP measures
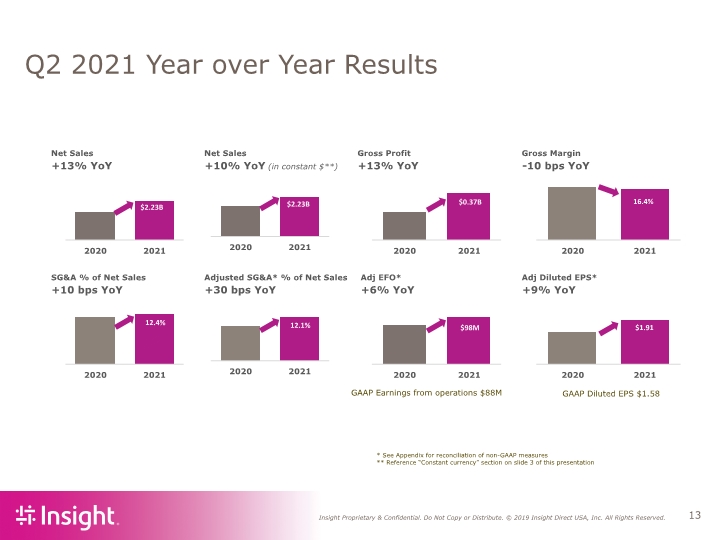
Q2 2021 Year over Year Results GAAP Earnings from operations $88M GAAP Diluted EPS $1.58 * See Appendix for reconciliation of non-GAAP measures ** Reference “Constant currency” section on slide 3 of this presentation (in constant $**)
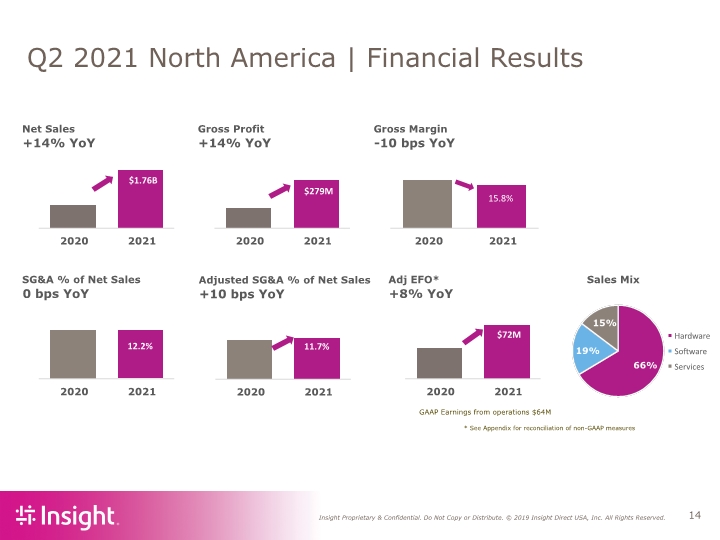
Net Sales Gross Profit Gross Margin +14% YoY +14% YoY -10 bps YoY SG&A % of Net Sales Adj EFO* Sales Mix 0 bps YoY +8% YoY 66% 19% 15% Hardware Software Services $1.76B 2020 2021 $279M 2020 2021 15.8% 2020 2021 $72M 2020 2021 12.2% 2020 2021 * See Appendix for reconciliation of non-GAAP measures Q2 2021 North America | Financial Results GAAP Earnings from operations $64M Adjusted SG&A % of Net Sales +10 bps YoY 11.7% 2020 2021
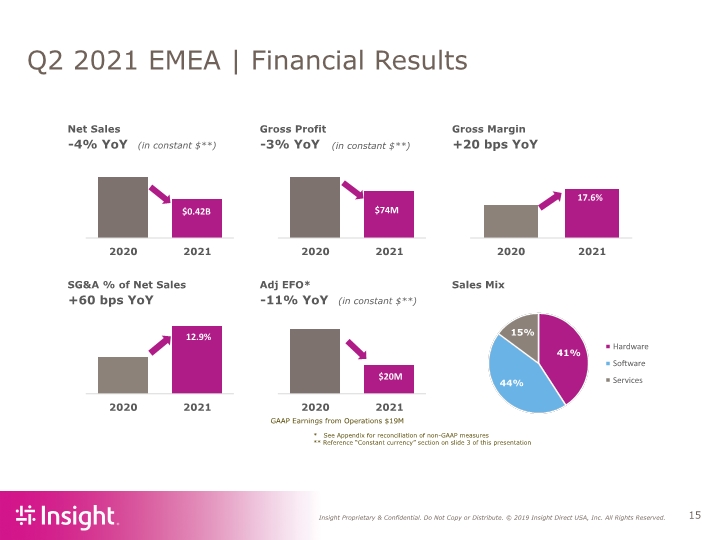
* See Appendix for reconciliation of non-GAAP measures ** Reference “Constant currency” section on slide 3 of this presentation Q2 2021 EMEA | Financial Results GAAP Earnings from Operations $19M (in constant $**) (in constant $**) (in constant $**)
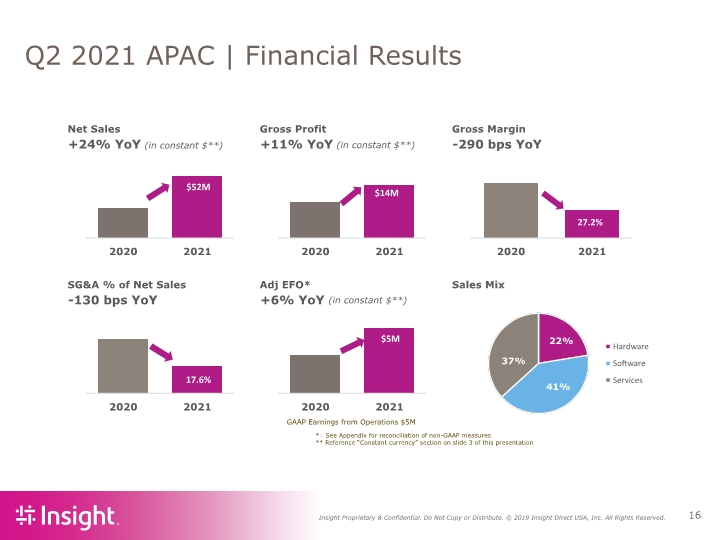
* See Appendix for reconciliation of non-GAAP measures ** Reference “Constant currency” section on slide 3 of this presentation Q2 2021 APAC | Financial Results (in constant $**) (in constant $**) GAAP Earnings from Operations $5M (in constant $**)
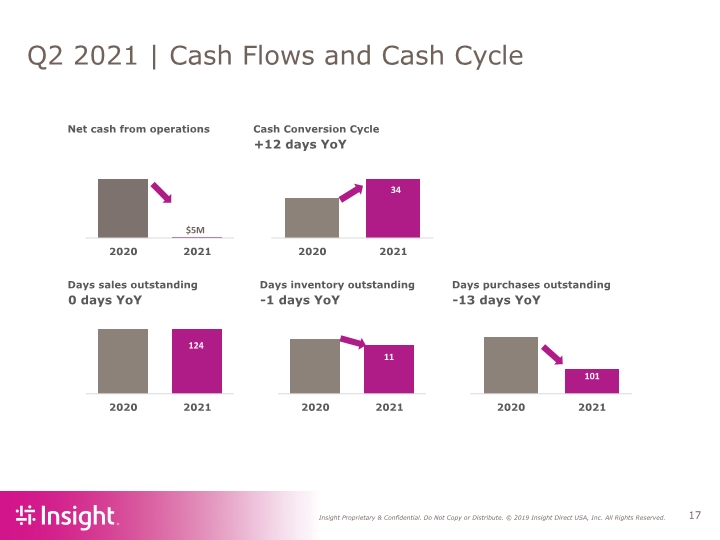
Q2 2021 | Cash Flows and Cash Cycle
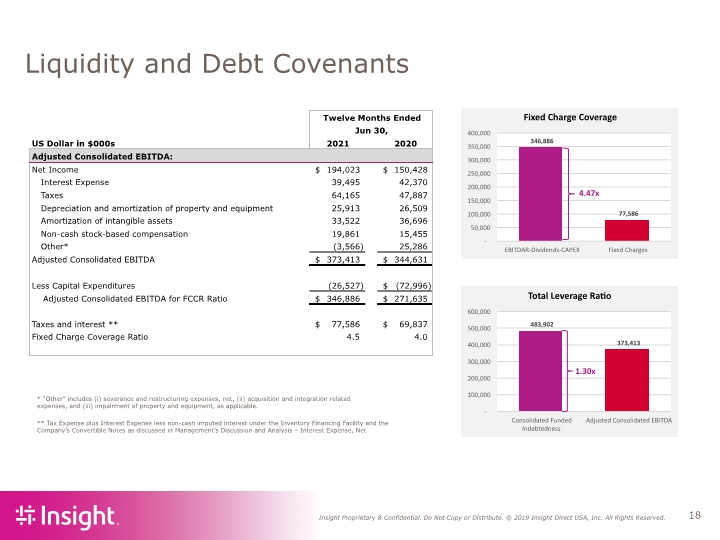
Liquidity and Debt Covenants ** Tax Expense plus Interest Expense less non-cash imputed interest under the Inventory Financing Facility and the Company’s Convertible Notes as discussed in Management’s Discussion and Analysis – Interest Expense, Net * “Other” includes (i) severance and restructuring expenses, net, (ii) acquisition and integration related expenses, and (iii) impairment of property and equipment, as applicable.
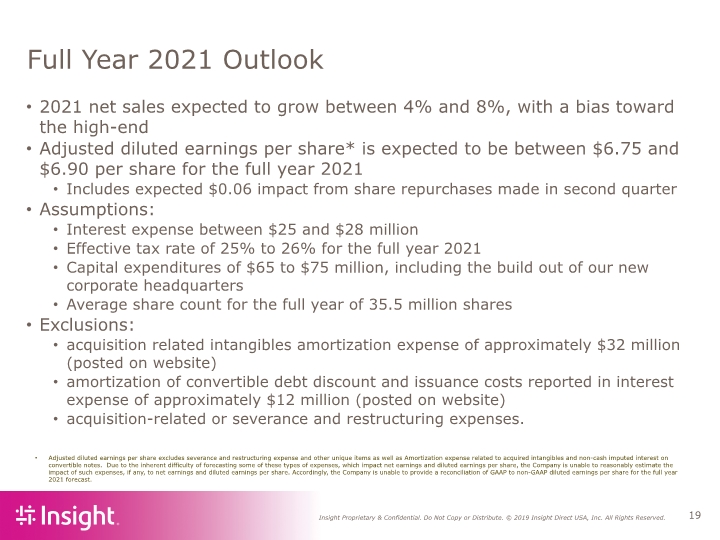
Full Year 2021 Outlook 2021 net sales expected to grow between 4% and 8%, with a bias toward the high-end Adjusted diluted earnings per share* is expected to be between $6.75 and $6.90 per share for the full year 2021 Includes expected $0.06 impact from share repurchases made in second quarter Assumptions: Interest expense between $25 and $28 million Effective tax rate of 25% to 26% for the full year 2021 Capital expenditures of $65 to $75 million, including the build out of our new corporate headquarters Average share count for the full year of 35.5 million shares Exclusions: acquisition related intangibles amortization expense of approximately $32 million (posted on website) amortization of convertible debt discount and issuance costs reported in interest expense of approximately $12 million (posted on website) acquisition-related or severance and restructuring expenses. Adjusted diluted earnings per share excludes severance and restructuring expense and other unique items as well as Amortization expense related to acquired intangibles and non-cash imputed interest on convertible notes. Due to the inherent difficulty of forecasting some of these types of expenses, which impact net earnings and diluted earnings per share, the Company is unable to reasonably estimate the impact of such expenses, if any, to net earnings and diluted earnings per share. Accordingly, the Company is unable to provide a reconciliation of GAAP to non-GAAP diluted earnings per share for the full year 2021 forecast.

Appendix
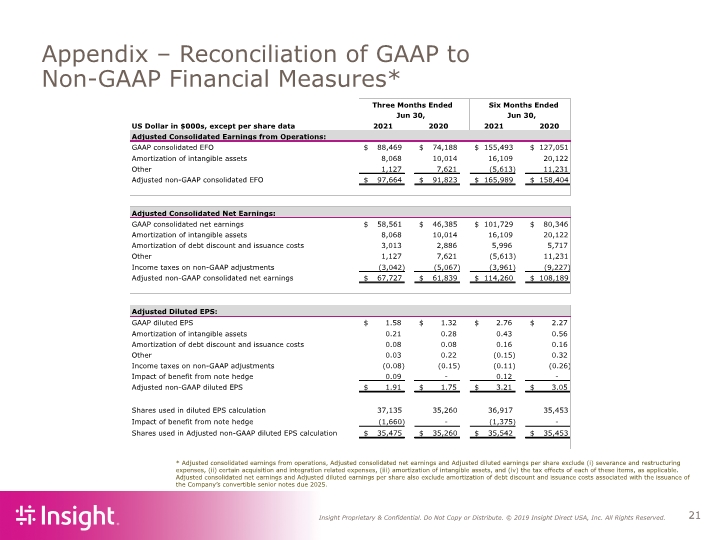
US Dollar in $000s, except per share data 2021 2020 2021 2020 Adjusted Consolidated Earnings from Operations: GAAP consolidated EFO 88,469 $ 74,188 $ 155,493 $ 127,051 $ Amortization of intangible assets 8,068 10,014 16,109 20,122 Other 1,127 7,621 (5,613) 11,231 Adjusted non-GAAP consolidated EFO 97,664 $ 91,823 $ 165,989 $ 158,404 $ Adjusted Consolidated Net Earnings: GAAP consolidated net earnings 58,561 $ 46,385 $ 101,729 $ 80,346 $ Amortization of intangible assets 8,068 10,014 16,109 20,122 Amortization of debt discount and issuance costs 3,013 2,886 5,996 5,717 Other 1,127 7,621 (5,613) 11,231 Income taxes on non-GAAP adjustments (3,042) (5,067) (3,961) (9,227) Adjusted non-GAAP consolidated net earnings 67,727 $ 61,839 $ 114,260 $ 108,189 $ Adjusted Diluted EPS: GAAP diluted EPS 1.58 $ 1.32 $ 2.76 $ 2.27 $ Amortization of intangible assets 0.21 0.28 0.43 0.56 Amortization of debt discount and issuance costs 0.08 0.08 0.16 Appendix – Reconciliation of GAAP to Non-GAAP Financial Measures* * Adjusted consolidated earnings from operations, Adjusted consolidated net earnings and Adjusted diluted earnings per share exclude (i) severance and restructuring expenses, (ii) certain acquisition and integration related expenses, (iii) amortization of intangible assets, and (iv) the tax effects of each of these items, as applicable. Adjusted consolidated net earnings and Adjusted diluted earnings per share also exclude amortization of debt discount and issuance costs associated with the issuance of the Company’s convertible senior notes due 2025.
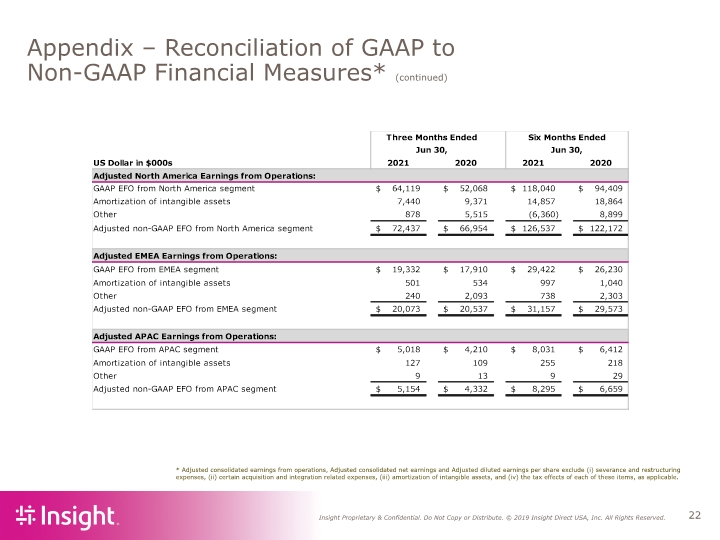
Appendix – Reconciliation of GAAP to Non-GAAP Financial Measures* (continued) * Adjusted consolidated earnings from operations, Adjusted consolidated net earnings and Adjusted diluted earnings per share exclude (i) severance and restructuring expenses, (ii) certain acquisition and integration related expenses, (iii) amortization of intangible assets, and (iv) the tax effects of each of these items, as applicable.
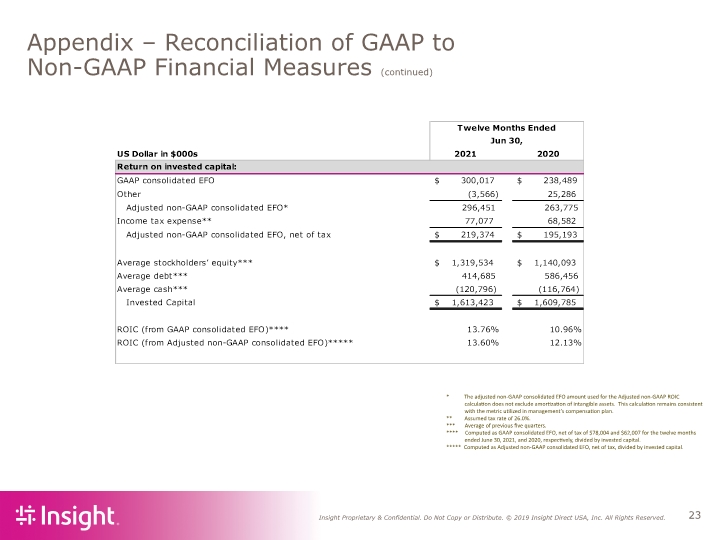
Appendix – Reconciliation of GAAP to Non-GAAP Financial Measures (continued) * The adjusted non-GAAP consolidated EFO amount used for the Adjusted non-GAAP ROIC calculation does not exclude amortization of intangible assets. This calculation remains consistent with the metric utilized in management’s compensation plan. ** Assumed tax rate of 26.0%. *** Average of previous five quarters. **** Computed as GAAP consolidated EFO, net of tax of $78,004 and $62,007 for the twelve months ended June 30, 2021, and 2020, respectively, divided by invested capital. ***** Computed as Adjusted non-GAAP consolidated EFO, net of tax, divided by invested capital.
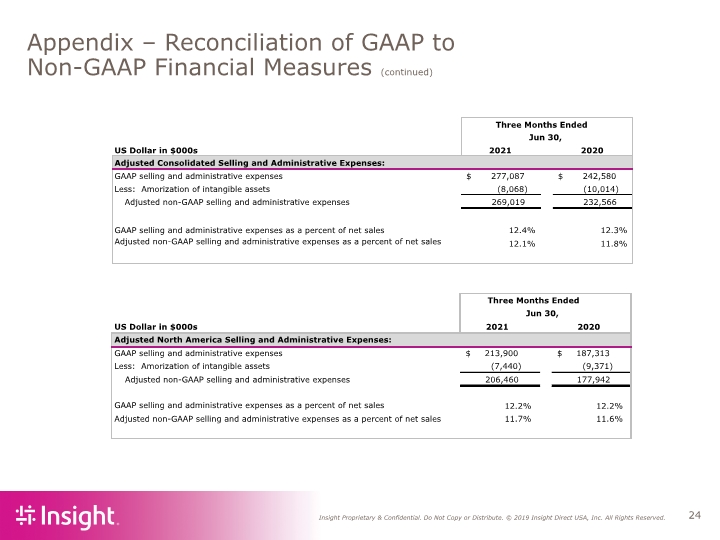
Appendix – Reconciliation of GAAP to Non-GAAP Financial Measures (continued)
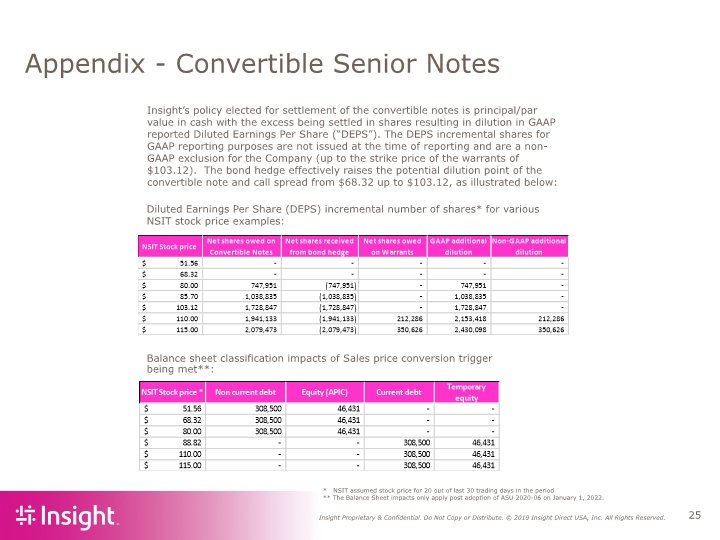
Appendix - Convertible Senior Notes * NSIT assumed stock price for 20 out of last 30 trading days in the period ** The Balance Sheet impacts only apply post adoption of ASU 2020-06 on January 1, 2022. Diluted Earnings Per Share (DEPS) incremental number of shares* for various NSIT stock price examples: Insight’s policy elected for settlement of the convertible notes is principal/par value in cash with the excess being settled in shares resulting in dilution in GAAP reported Diluted Earnings Per Share (“DEPS”). The DEPS incremental shares for GAAP reporting purposes are not issued at the time of reporting and are a non-GAAP exclusion for the Company (up to the strike price of the warrants of $103.12). The bond hedge effectively raises the potential dilution point of the convertible note and call spread from $68.32 up to $103.12, as illustrated below: Balance sheet classification impacts of Sales price conversion trigger being met**:
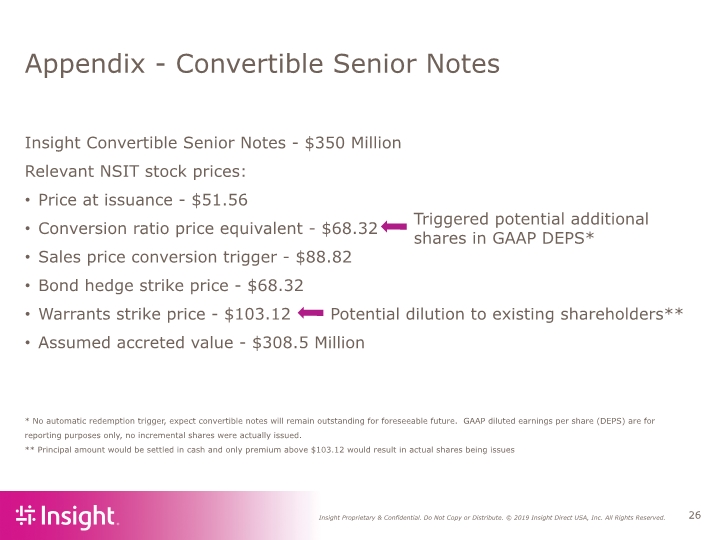
Appendix - Convertible Senior Notes * No automatic redemption trigger, expect convertible notes will remain outstanding for foreseeable future. GAAP diluted earnings per share (DEPS) are for reporting purposes only, no incremental shares were actually issued. ** Principal amount would be settled in cash and only premium above $103.12 would result in actual shares being issues Insight Convertible Senior Notes - $350 Million Relevant NSIT stock prices: Price at issuance - $51.56 Conversion ratio price equivalent - $68.32 Sales price conversion trigger - $88.82 Bond hedge strike price - $68.32 Warrants strike price - $103.12 Potential dilution to existing shareholders** Assumed accreted value - $308.5 Million Triggered potential additional shares in GAAP DEPS*
