Attached files
| file | filename |
|---|---|
| 8-K - 8-K - Trinseo S.A. | tse-20210804x8k.htm |
| EX-99.1 - EX-99.1 - Trinseo S.A. | tse-20210804xex99d1.htm |
Exhibit 99.2
| Second Quarter 2021 Financial Results & Outlook August 4, 2021 |
| 2 Disclosure Rules Cautionary Note on Forward-Looking Statements. This presentation contains forward-looking statements including, without limitation, statements concerning plans, objectives, goals, projections, strategies, future events or performance, and underlying assumptions and other statements, which are not statements of historical facts or guarantees or assurances of future performance. Forward-looking statements may be identified by the use of words like “expect,” “anticipate,” “intend,” “forecast,” “outlook,” “will,” “may,” “might,” “see,” “tend,” “assume,” “potential,” “likely,” “target,” “plan,” “contemplate,” “seek,” “attempt,” “should,” “could,” “would” or expressions of similar meaning. Forward-looking statements reflect management’s evaluation of information currently available and are based on our current expectations and assumptions regarding our proposed acquisition of Aristech Surfaces, LLC, our proposed sale of our synthetic rubber business; our business, the economy and other future conditions. Because forward-looking statements relate to the future, they are subject to inherent uncertainties, risks and changes in circumstances that are difficult to predict. Factors that might cause such a difference include, but are not limited to, our ability to successfully complete the Aristech acquisition or meet the conditions to closing, including regulatory approvals, our ability to successfully integrate Aristech and its employees, to generate expected cost and revenue synergies and expected margins, and to profitably grow the Aristech business, our ability to complete the sale of our synthetic rubber business, and those factors discussed in our Annual Report on Form 10-K, under Part I, Item 1A — “Risk Factors” and elsewhere in our other reports furnished or filed with the U.S. Securities and Exchange Commission. As a result of these or other factors, our actual results may differ materially from those contemplated by the forward-looking statements. Therefore, we caution you against relying on any of these forward-looking statements. The forward-looking statements included in this presentation are made only as of the date hereof. We undertake no obligation to publicly update or revise any forward-looking statement as a result of new information, future events or otherwise, except as otherwise required by law. This presentation contains financial measures that are not in accordance with generally accepted accounting principles in the US (“GAAP”) including EBITDA, Adjusted EBITDA, Adjusted Net Income, Adjusted EPS and Free Cash Flow. We believe these measures provide relevant and meaningful information to investors and lenders about the ongoing operating results and liquidity position of the Company. Such measures when referenced herein should not be viewed as an alternative to GAAP measures of performance or liquidity, as applicable. We have provided a reconciliation of these measures to the most comparable GAAP metric alongside of the respective measure or otherwise in the Appendix section and in the accompanying press release. Introductions • Frank Bozich, President & CEO • David Stasse, Executive Vice President & CFO • Andy Myers, Director of Investor Relations Introductions & Disclosure Rules |

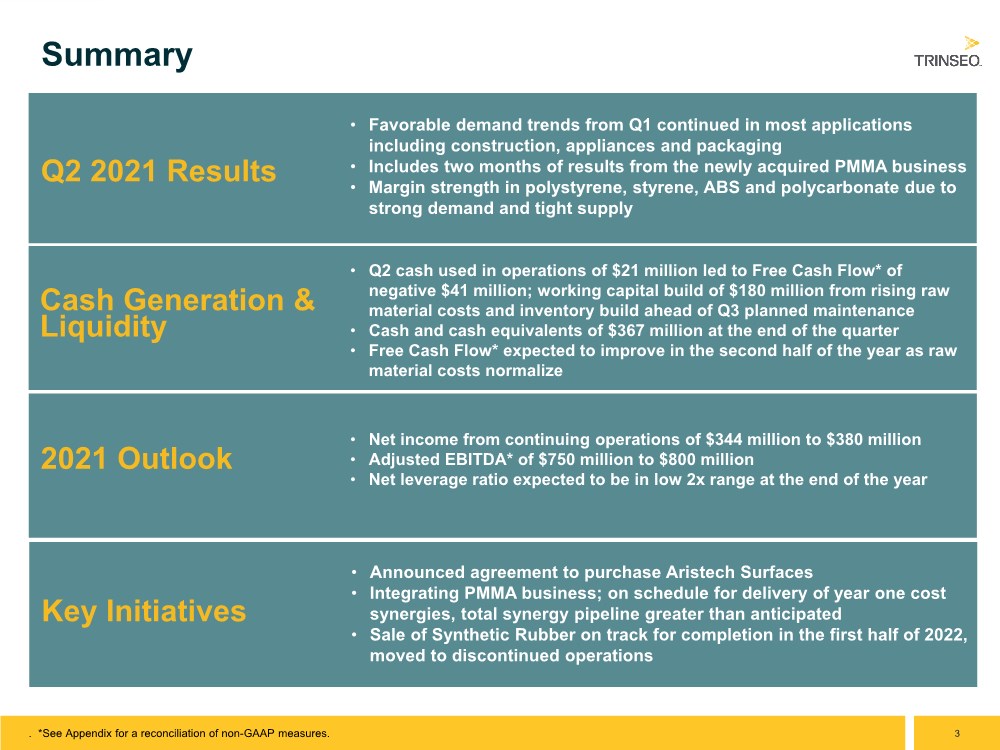
| 3 Summary • Favorable demand trends from Q1 continued in most applications including construction, appliances and packaging • Includes two months of results from the newly acquired PMMA business • Margin strength in polystyrene, styrene, ABS and polycarbonate due to strong demand and tight supply 2021 Outlook Q2 2021 Results • Q2 cash used in operations of $21 million led to Free Cash Flow* of negative $41 million; working capital build of $180 million from rising raw material costs and inventory build ahead of Q3 planned maintenance • Cash and cash equivalents of $367 million at the end of the quarter • Free Cash Flow* expected to improve in the second half of the year as raw material costs normalize Cash Generation & Liquidity • Net income from continuing operations of $344 million to $380 million • Adjusted EBITDA* of $750 million to $800 million • Net leverage ratio expected to be in low 2x range at the end of the year • Announced agreement to purchase Aristech Surfaces • Integrating PMMA business; on schedule for delivery of year one cost synergies, total synergy pipeline greater than anticipated • Sale of Synthetic Rubber on track for completion in the first half of 2022, moved to discontinued operations Key Initiatives . *See Appendix for a reconciliation of non-GAAP measures. |
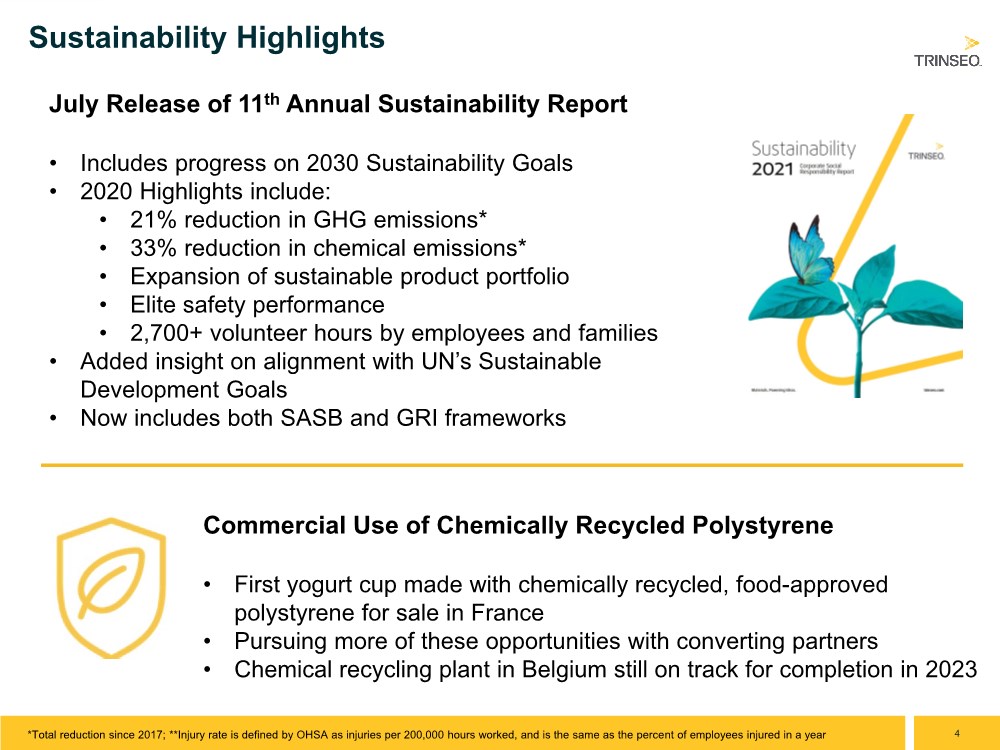
| 4 Sustainability Highlights Commercial Use of Chemically Recycled Polystyrene • First yogurt cup made with chemically recycled, food-approved polystyrene for sale in France • Pursuing more of these opportunities with converting partners • Chemical recycling plant in Belgium still on track for completion in 2023 July Release of 11th Annual Sustainability Report • Includes progress on 2030 Sustainability Goals • 2020 Highlights include: • 21% reduction in GHG emissions* • 33% reduction in chemical emissions* • Expansion of sustainable product portfolio • Elite safety performance • 2,700+ volunteer hours by employees and families • Added insight on alignment with UN’s Sustainable Development Goals • Now includes both SASB and GRI frameworks *Total reduction since 2017; **Injury rate is defined by OHSA as injuries per 200,000 hours worked, and is the same as the percent of employees injured in a year |
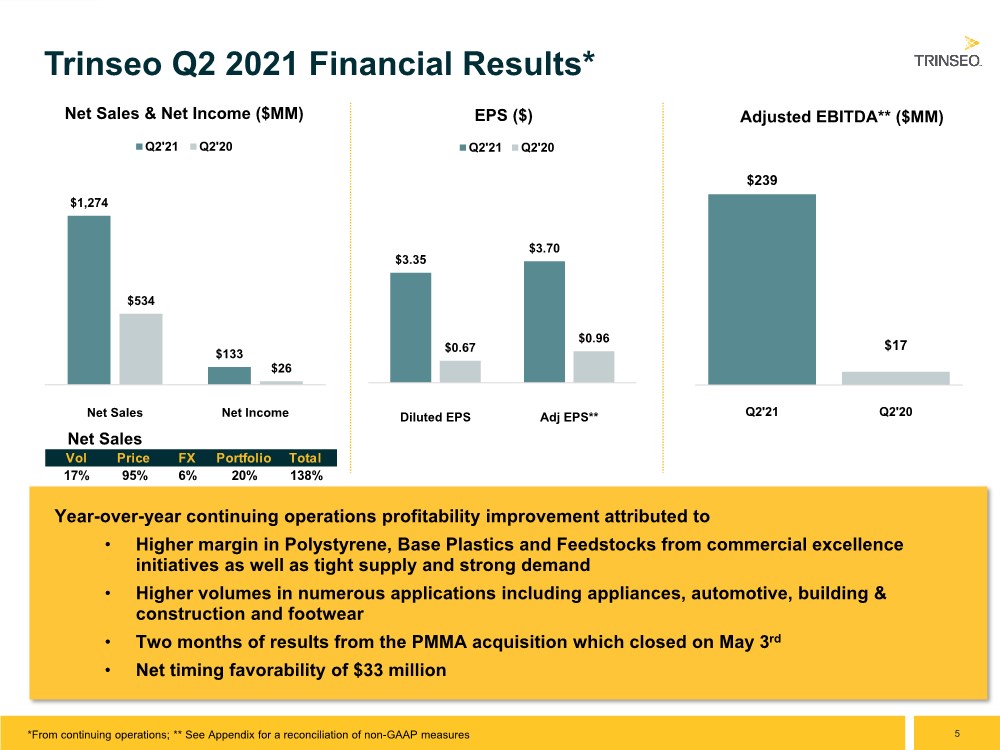
| 5 $239 $17 Q2'21 Q2'20 Adjusted EBITDA** ($MM) Year-over-year continuing operations profitability improvement attributed to • Higher margin in Polystyrene, Base Plastics and Feedstocks from commercial excellence initiatives as well as tight supply and strong demand • Higher volumes in numerous applications including appliances, automotive, building & construction and footwear • Two months of results from the PMMA acquisition which closed on May 3rd • Net timing favorability of $33 million Trinseo Q2 2021 Financial Results* $3.35 $3.70 $0.67 $0.96 Diluted EPS Adj EPS** EPS ($) Q2'21 Q2'20 $1,274 $133 $534 $26 Net Sales Net Income Net Sales & Net Income ($MM) Q2'21 Q2'20 Net Sales *From continuing operations; ** See Appendix for a reconciliation of non-GAAP measures Vol Price FX Portfolio Total 17% 95% 6% 20% 138% |
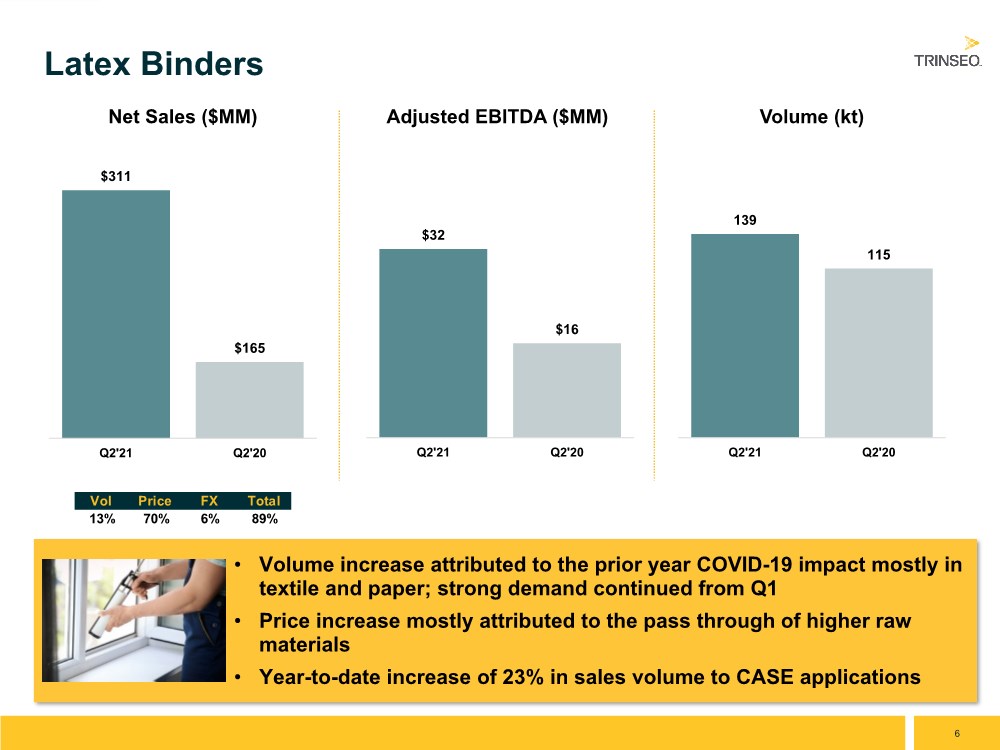
| 6 • Volume increase attributed to the prior year COVID-19 impact mostly in textile and paper; strong demand continued from Q1 • Price increase mostly attributed to the pass through of higher raw materials • Year-to-date increase of 23% in sales volume to CASE applications Latex Binders $311 $165 Q2'21 Q2'20 Net Sales ($MM) $32 $16 Q2'21 Q2'20 Adjusted EBITDA ($MM) 139 115 Q2'21 Q2'20 Volume (kt) Vol Price FX Total 13% 70% 6% 89% |
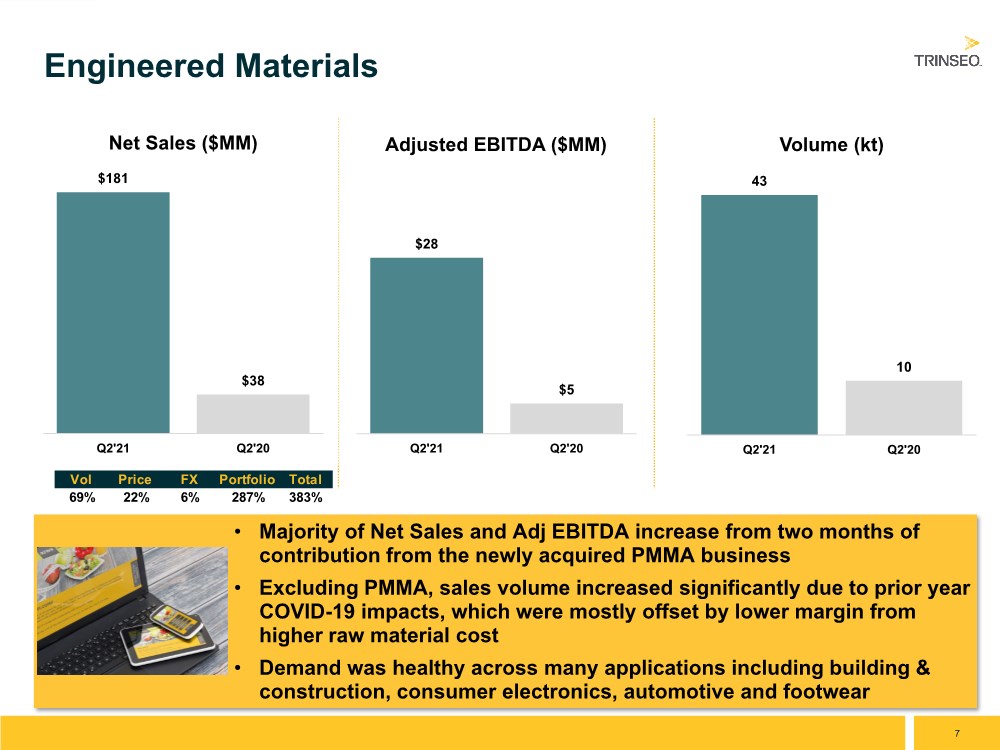
| 7 • Majority of Net Sales and Adj EBITDA increase from two months of contribution from the newly acquired PMMA business • Excluding PMMA, sales volume increased significantly due to prior year COVID-19 impacts, which were mostly offset by lower margin from higher raw material cost • Demand was healthy across many applications including building & construction, consumer electronics, automotive and footwear Engineered Materials $181 $38 Q2'21 Q2'20 Net Sales ($MM) $28 $5 Q2'21 Q2'20 Adjusted EBITDA ($MM) 43 10 Q2'21 Q2'20 Volume (kt) Vol Price FX Portfolio Total 69% 22% 6% 287% 383% |
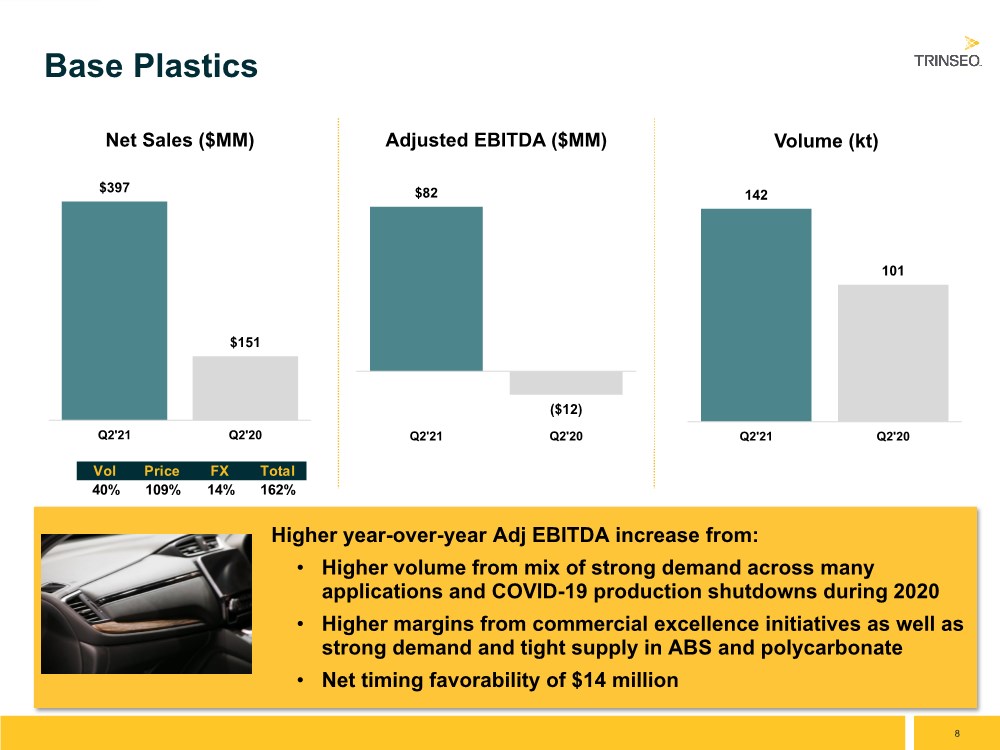
| 8 Higher year-over-year Adj EBITDA increase from: • Higher volume from mix of strong demand across many applications and COVID-19 production shutdowns during 2020 • Higher margins from commercial excellence initiatives as well as strong demand and tight supply in ABS and polycarbonate • Net timing favorability of $14 million Base Plastics $397 $151 Q2'21 Q2'20 Net Sales ($MM) $82 ($12) Q2'21 Q2'20 Adjusted EBITDA ($MM) 142 101 Q2'21 Q2'20 Volume (kt) Vol Price FX Total 40% 109% 14% 162% |
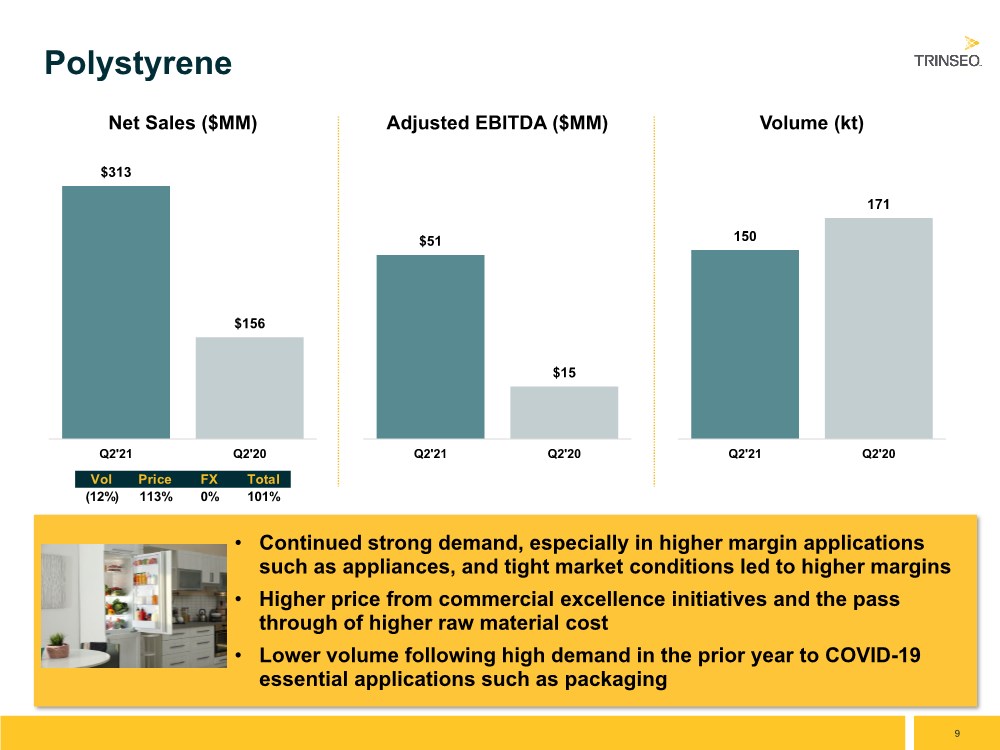
| 9 • Continued strong demand, especially in higher margin applications such as appliances, and tight market conditions led to higher margins • Higher price from commercial excellence initiatives and the pass through of higher raw material cost • Lower volume following high demand in the prior year to COVID-19 essential applications such as packaging Polystyrene $313 $156 Q2'21 Q2'20 Net Sales ($MM) $51 $15 Q2'21 Q2'20 Adjusted EBITDA ($MM) 150 171 Q2'21 Q2'20 Volume (kt) Vol Price FX Total (12%) 113% 0% 101% |
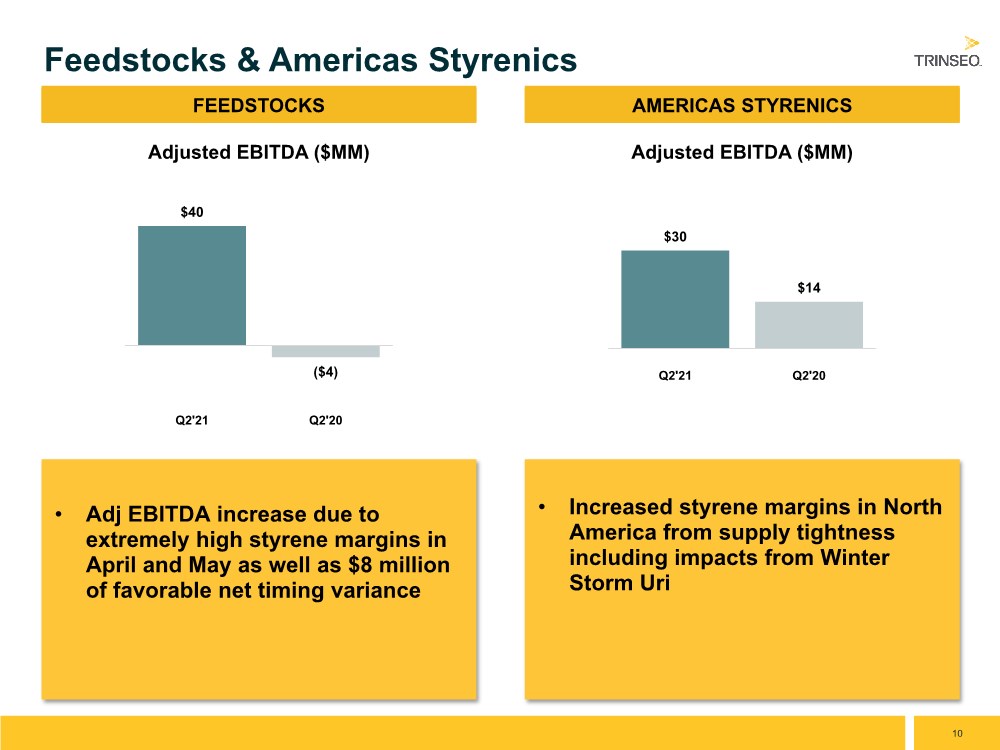
| 10 • Adj EBITDA increase due to extremely high styrene margins in April and May as well as $8 million of favorable net timing variance Feedstocks & Americas Styrenics $40 ($4) Q2'21 Q2'20 Adjusted EBITDA ($MM) FEEDSTOCKS • Increased styrene margins in North America from supply tightness including impacts from Winter Storm Uri AMERICAS STYRENICS $30 $14 Q2'21 Q2'20 Adjusted EBITDA ($MM) |
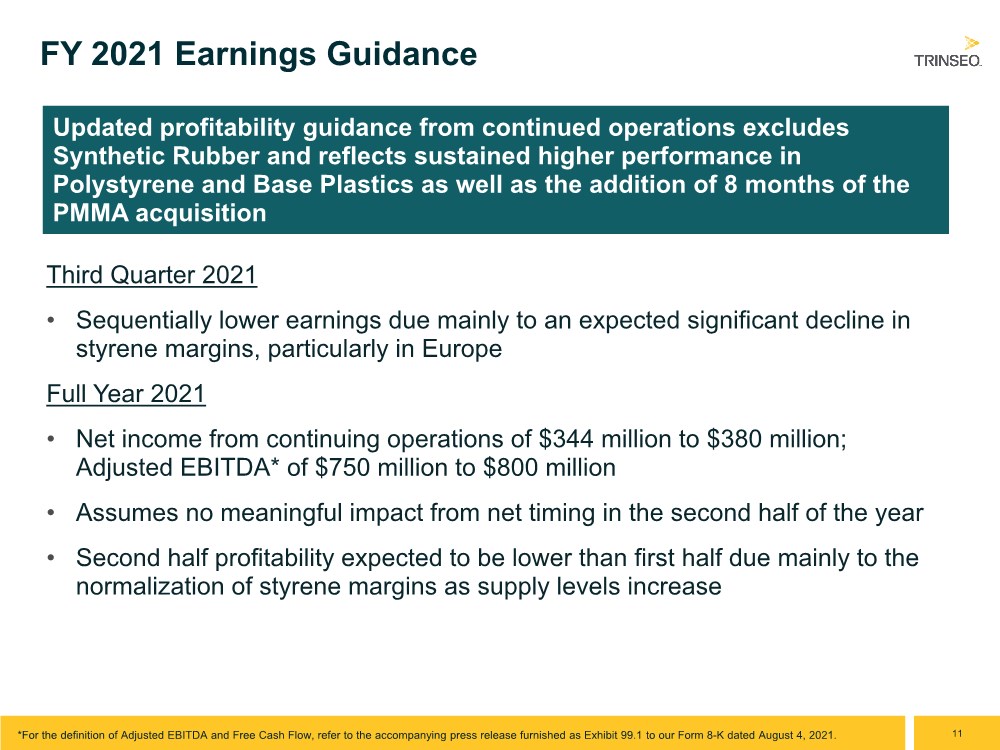
| 11 FY 2021 Earnings Guidance Third Quarter 2021 • Sequentially lower earnings due mainly to an expected significant decline in styrene margins, particularly in Europe Full Year 2021 • Net income from continuing operations of $344 million to $380 million; Adjusted EBITDA* of $750 million to $800 million • Assumes no meaningful impact from net timing in the second half of the year • Second half profitability expected to be lower than first half due mainly to the normalization of styrene margins as supply levels increase *For the definition of Adjusted EBITDA and Free Cash Flow, refer to the accompanying press release furnished as Exhibit 99.1 to our Form 8-K dated August 4, 2021. Updated profitability guidance from continued operations excludes Synthetic Rubber and reflects sustained higher performance in Polystyrene and Base Plastics as well as the addition of 8 months of the PMMA acquisition |
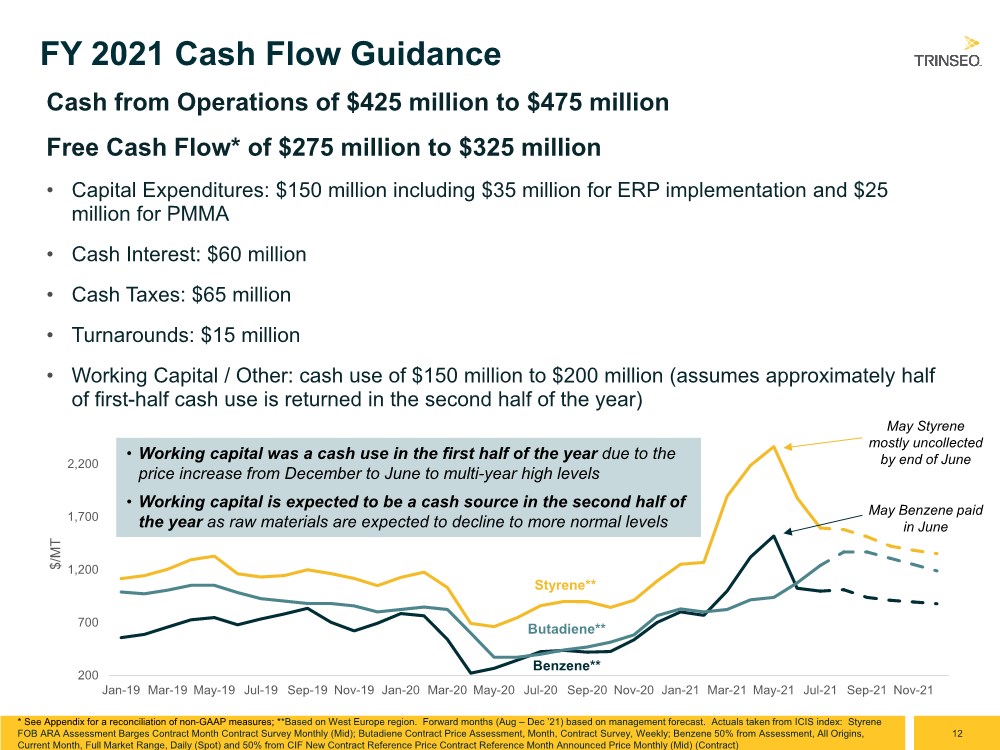
| 12 FY 2021 Cash Flow Guidance Cash from Operations of $425 million to $475 million Free Cash Flow* of $275 million to $325 million • Capital Expenditures: $150 million including $35 million for ERP implementation and $25 million for PMMA • Cash Interest: $60 million • Cash Taxes: $65 million • Turnarounds: $15 million • Working Capital / Other: cash use of $150 million to $200 million (assumes approximately half of first-half cash use is returned in the second half of the year) * See Appendix for a reconciliation of non-GAAP measures; **Based on West Europe region. Forward months (Aug – Dec ’21) based on management forecast. Actuals taken from ICIS index: Styrene FOB ARA Assessment Barges Contract Month Contract Survey Monthly (Mid); Butadiene Contract Price Assessment, Month, Contract Survey, Weekly; Benzene 50% from Assessment, All Origins, Current Month, Full Market Range, Daily (Spot) and 50% from CIF New Contract Reference Price Contract Reference Month Announced Price Monthly (Mid) (Contract) 200 700 1,200 1,700 2,200 Jan-19 Mar-19 May-19 Jul-19 Sep-19 Nov-19 Jan-20 Mar-20 May-20 Jul-20 Sep-20 Nov-20 Jan-21 Mar-21 May-21 Jul-21 Sep-21 Nov-21 $/MT Styrene** Butadiene** Benzene** May Styrene mostly uncollected by end of June May Benzene paid in June • Working capital was a cash use in the first half of the year due to the price increase from December to June to multi-year high levels • Working capital is expected to be a cash source in the second half of the year as raw materials are expected to decline to more normal levels |
| Appendix |

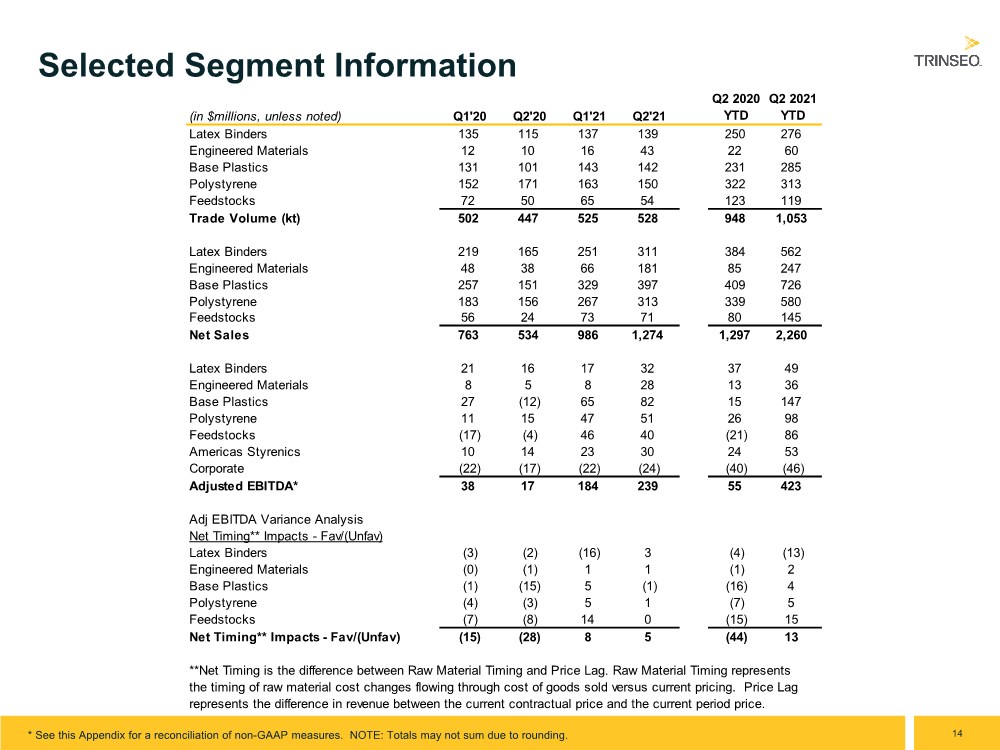
| 14 Selected Segment Information * See this Appendix for a reconciliation of non-GAAP measures. NOTE: Totals may not sum due to rounding. (in $millions, unless noted) Q1'20 Q2'20 Q1'21 Q2'21 Q2 2020 YTD Q2 2021 YTD Latex Binders 135 115 137 139 250 276 Engineered Materials 12 10 16 43 22 60 Base Plastics 131 101 143 142 231 285 Polystyrene 152 171 163 150 322 313 Feedstocks 72 50 65 54 123 119 Trade Volume (kt) 502 447 525 528 948 1,053 Latex Binders 219 165 251 311 384 562 Engineered Materials 48 38 66 181 85 247 Base Plastics 257 151 329 397 409 726 Polystyrene 183 156 267 313 339 580 Feedstocks 56 24 73 71 80 145 Net Sales 763 534 986 1,274 1,297 2,260 Latex Binders 21 16 17 32 37 49 Engineered Materials 8 5 8 28 13 36 Base Plastics 27 (12) 65 82 15 147 Polystyrene 11 15 47 51 26 98 Feedstocks (17) (4) 46 40 (21) 86 Americas Styrenics 10 14 23 30 24 53 Corporate (22) (17) (22) (24) (40) (46) Adjusted EBITDA* 38 17 184 239 55 423 Adj EBITDA Variance Analysis Net Timing** Impacts - Fav/(Unfav) Latex Binders (3) (2) (16) 3 (4) (13) Engineered Materials (0) (1) 1 1 (1) 2 Base Plastics (1) (15) 5 (1) (16) 4 Polystyrene (4) (3) 5 1 (7) 5 Feedstocks (7) (8) 14 0 (15) 15 Net Timing** Impacts - Fav/(Unfav) (15) (28) 8 5 (44) 13 **Net Timing is the difference between Raw Material Timing and Price Lag. Raw Material Timing represents the timing of raw material cost changes flowing through cost of goods sold versus current pricing. Price Lag represents the difference in revenue between the current contractual price and the current period price. |
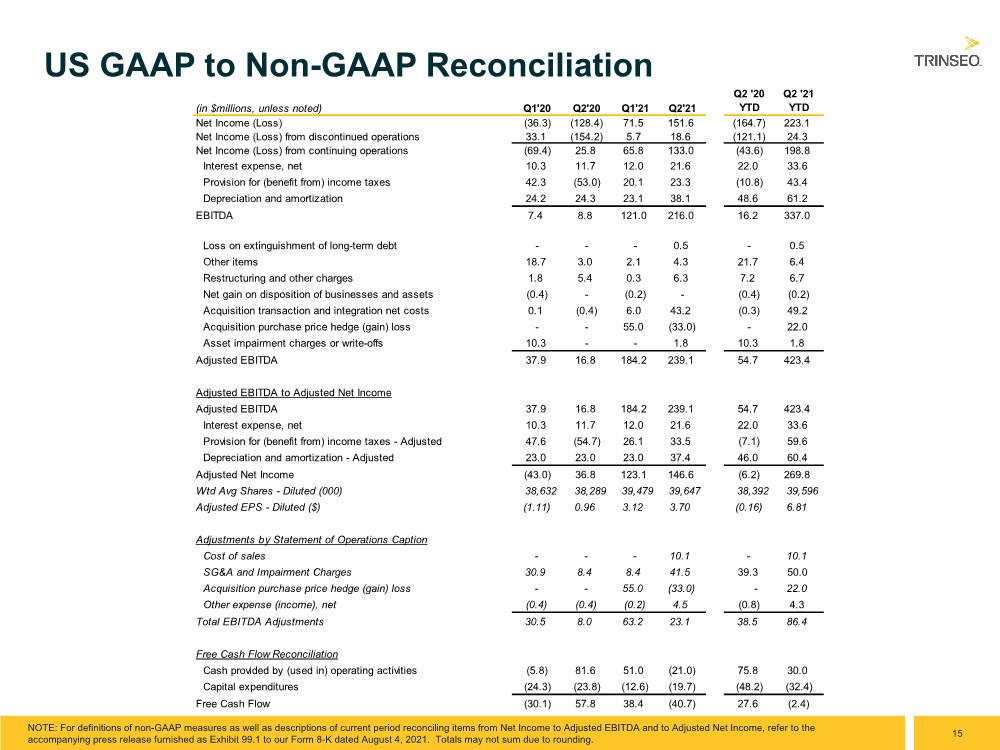
| 15 US GAAP to Non-GAAP Reconciliation NOTE: For definitions of non-GAAP measures as well as descriptions of current period reconciling items from Net Income to Adjusted EBITDA and to Adjusted Net Income, refer to the accompanying press release furnished as Exhibit 99.1 to our Form 8-K dated August 4, 2021. Totals may not sum due to rounding. (in $millions, unless noted) Q1'20 Q2'20 Q1'21 Q2'21 Q2 '20 YTD Q2 '21 YTD Net Income (Loss) (36.3) (128.4) 71.5 151.6 (164.7) 223.1 Net Income (Loss) from discontinued operations 33.1 (154.2) 5.7 18.6 (121.1) 24.3 Net Income (Loss) from continuing operations (69.4) 25.8 65.8 133.0 (43.6) 198.8 Interest expense, net 10.3 11.7 12.0 21.6 22.0 33.6 Provision for (benefit from) income taxes 42.3 (53.0) 20.1 23.3 (10.8) 43.4 Depreciation and amortization 24.2 24.3 23.1 38.1 48.6 61.2 EBITDA 7.4 8.8 121.0 216.0 16.2 337.0 Loss on extinguishment of long-term debt - - - 0.5 - 0.5 Other items 18.7 3.0 2.1 4.3 21.7 6.4 Restructuring and other charges 1.8 5.4 0.3 6.3 7.2 6.7 Net gain on disposition of businesses and assets (0.4) - (0.2) - (0.4) (0.2) Acquisition transaction and integration net costs 0.1 (0.4) 6.0 43.2 (0.3) 49.2 Acquisition purchase price hedge (gain) loss - - 55.0 (33.0) - 22.0 Asset impairment charges or write-offs 10.3 - - 1.8 10.3 1.8 Adjusted EBITDA 37.9 16.8 184.2 239.1 54.7 423.4 Adjusted EBITDA to Adjusted Net Income Adjusted EBITDA 37.9 16.8 184.2 239.1 54.7 423.4 Interest expense, net 10.3 11.7 12.0 21.6 22.0 33.6 Provision for (benefit from) income taxes - Adjusted 47.6 (54.7) 26.1 33.5 (7.1) 59.6 Depreciation and amortization - Adjusted 23.0 23.0 23.0 37.4 46.0 60.4 Adjusted Net Income (43.0) 36.8 123.1 146.6 (6.2) 269.8 Wtd Avg Shares - Diluted (000) 38,632 38,289 39,479 39,647 38,392 39,596 Adjusted EPS - Diluted ($) (1.11) 0.96 3.12 3.70 (0.16) 6.81 Adjustments by Statement of Operations Caption Cost of sales - - - 10.1 - 10.1 SG&A and Impairment Charges 30.9 8.4 8.4 41.5 39.3 50.0 Acquisition purchase price hedge (gain) loss - - 55.0 (33.0) - 22.0 Other expense (income), net (0.4) (0.4) (0.2) 4.5 (0.8) 4.3 Total EBITDA Adjustments 30.5 8.0 63.2 23.1 38.5 86.4 Free Cash Flow Reconciliation Cash provided by (used in) operating activities (5.8) 81.6 51.0 (21.0) 75.8 30.0 Capital expenditures (24.3) (23.8) (12.6) (19.7) (48.2) (32.4) Free Cash Flow (30.1) 57.8 38.4 (40.7) 27.6 (2.4) |
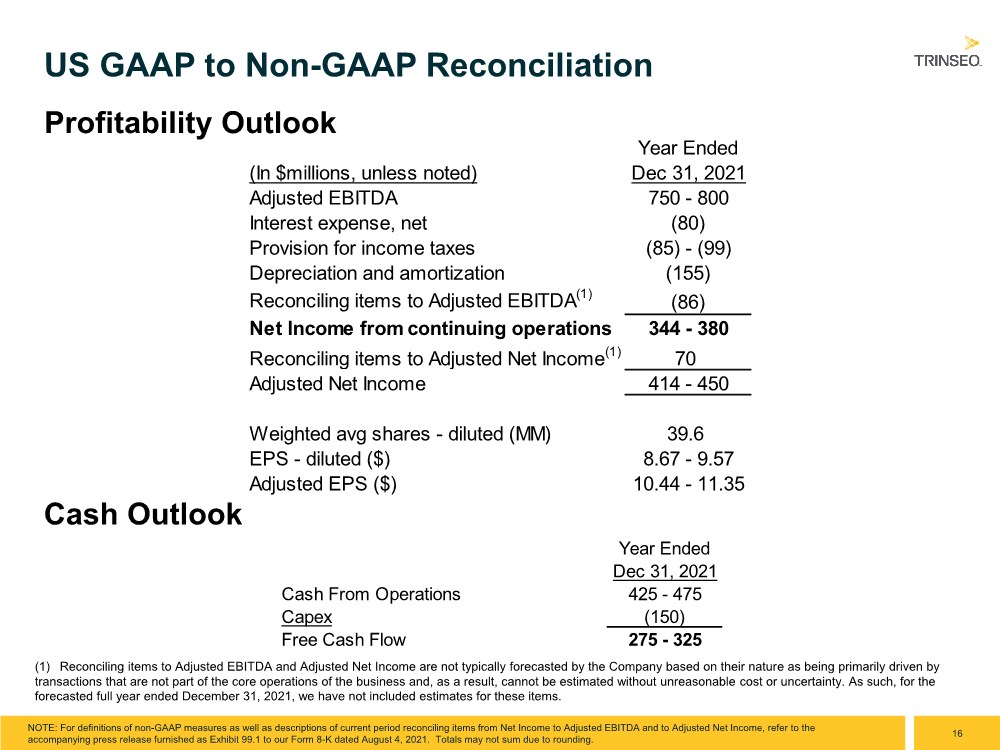
| 16 US GAAP to Non-GAAP Reconciliation NOTE: For definitions of non-GAAP measures as well as descriptions of current period reconciling items from Net Income to Adjusted EBITDA and to Adjusted Net Income, refer to the accompanying press release furnished as Exhibit 99.1 to our Form 8-K dated August 4, 2021. Totals may not sum due to rounding. Profitability Outlook (1) Reconciling items to Adjusted EBITDA and Adjusted Net Income are not typically forecasted by the Company based on their nature as being primarily driven by transactions that are not part of the core operations of the business and, as a result, cannot be estimated without unreasonable cost or uncertainty. As such, for the forecasted full year ended December 31, 2021, we have not included estimates for these items. Cash Outlook Year Ended Dec 31, 2021 Cash From Operations 425 - 475 Capex (150) Free Cash Flow 275 - 325 Year Ended (In $millions, unless noted) Dec 31, 2021 Adjusted EBITDA 750 - 800 Interest expense, net (80) Provision for income taxes (85) - (99) Depreciation and amortization (155) Reconciling items to Adjusted EBITDA(1) (86) Net Income from continuing operations 344 - 380 Reconciling items to Adjusted Net Income(1) 70 Adjusted Net Income 414 - 450 Weighted avg shares - diluted (MM) 39.6 EPS - diluted ($) 8.67 - 9.57 Adjusted EPS ($) 10.44 - 11.35 |