Attached files
| file | filename |
|---|---|
| 8-K - FORM 8-K - American Finance Trust, Inc | tm2124016d2_8k.htm |
Exhibit 99.1
August 2021 Second Quarter 2021 Investor Presentation (NASDAQ: AFIN)
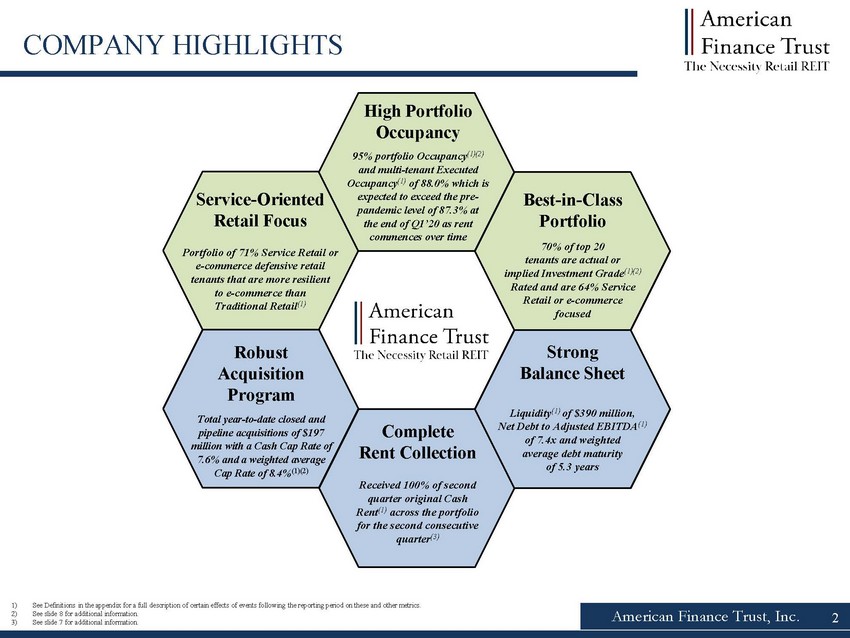
American Finance Trust, Inc. COMPANY HIGHLIGHTS Service Oriented Retail Focus Portfolio of 71% Service Retail or e commerce defensive retail tenants that are more resilient to e commerce than Traditional Retail ( High Portfolio Occupancy 95% portfolio Occupancy (1)( and multi tenant Executed Occupancy ( of 88.0% which is expected to exceed the pre pandemic level of 87.3% at the end of Q1’20 as rent commences over time Best in Class Portfolio 70 % of top 20 tenants are actual or implied Investment Grade (1)(2) Rated and are 64% Service Retail or e commerce focused Strong Balance Sheet Liquidity (1) of $390 million, Net Debt to Adjusted EBITDA ( of 7.4x and weighted average debt maturity of 5.3 years Robust Acquisition Program Total year to date closed and pipeline acquisitions of $197 million with a Cash Cap Rate of 7.6% and a weighted average Cap Rate of 8.4% 1)(2) Complete Rent Collection Received 100% of second quarter original Cash Rent ( across the portfolio for the second consecutive quarter ( 1) See Definitions in the appendix for a full description of certain effects of events following the reporting period on these a nd other metrics. 2) See slide 8 for additional information. 3) See slide 7 for additional information. 2
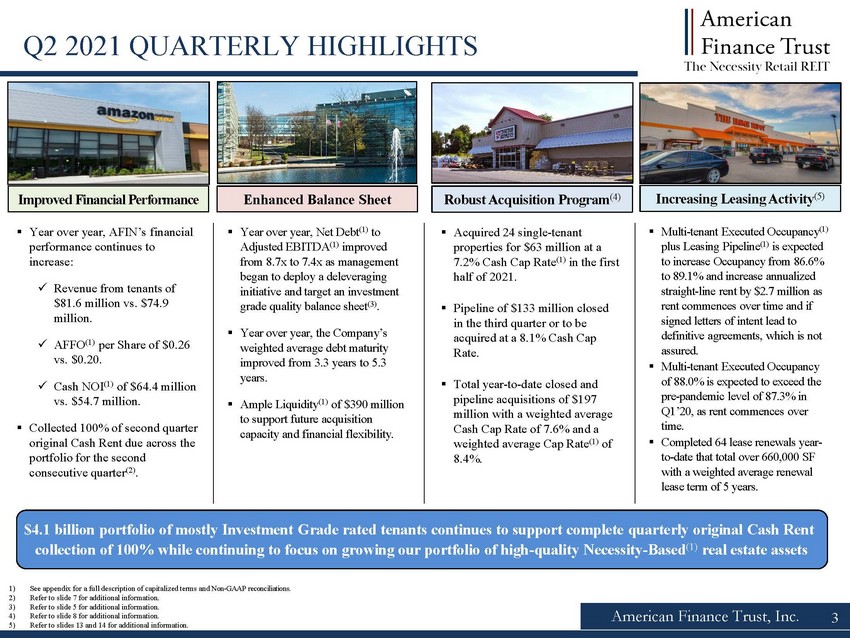
American Finance Trust, Inc. 3 Q2 2021 QUARTERLY HIGHLIGHTS Improved Financial Performance Robust Acquisition Program ( Acquired 24 single tenant properties for $63 million at a 7.2% Cash Cap Rate ( in the first half of 2021. Pipeline of $133 million closed in the third quarter or to be acquired at a 8.1% Cash Cap Rate. Total year to date closed and pipeline acquisitions of $197 million with a weighted average Cash Cap Rate of 7.6% and a weighted average Cap Rate ( of 8.4%. $4.1 billion portfolio of mostly Investment Grade rated tenants continues to support complete quarterly original Cash Rent collection of 100% while continuing to focus on growing our portfolio of high quality Necessity Based ( real estate assets Year over year, AFIN’s financial performance continues to increase: Revenue from tenants of $81.6 million vs. $74.9 million. AFFO ( per Share of $0.26 vs. $0.20. Cash NOI ( of $64.4 million vs. $54.7 million. Collected 100% of second quarter original Cash Rent due across the portfolio for the second consecutive quarter ( Multi tenant Executed Occupancy ( plus Leasing Pipeline ( is expected to increase Occupancy from 86.6% to 89.1% and increase annualized straight line rent by $2.7 million as rent commences over time and if signed letters of intent lead to definitive agreements, which is not assured. Multi tenant Executed Occupancy of 88.0% is expected to exceed the pre pandemic level of 87.3% in Q1’20, as rent commences over time. Completed 64 lease renewals year to date that total over 660,000 SF with a weighted average renewal lease term of 5 years. 1) See appendix for a full description of capitalized terms and Non GAAP reconciliations. 2) Refer to slide 7 for additional information. 3) Refer to slide 5 for additional information. 4) Refer to slide 8 for additional information. 5) Refer to slides 13 and 14 for additional information. Increasing Leasing Activity ( Enhanced Balance Sheet Year over year, Net Debt ( to Adjusted EBITDA ( improved from 8.7x to 7.4x as management began to deploy a deleveraging initiative and target an investment grade quality balance sheet ( Year over year, the Company’s weighted average debt maturity improved from 3.3 years to 5.3 years. Ample Liquidity ( of $390 million to support future acquisition capacity and financial flexibility.
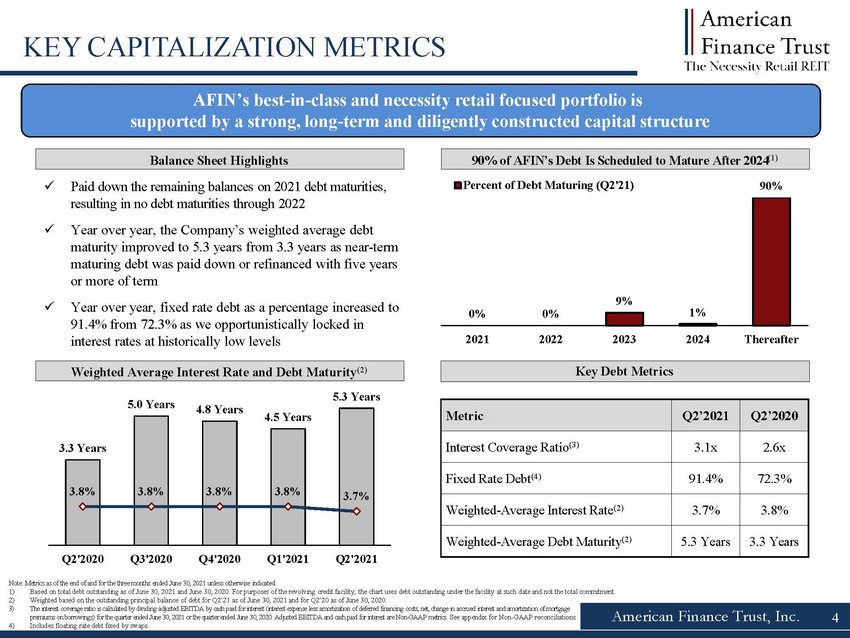
0% 0% 9% 1% 90% 2021 2022 2023 2024 Thereafter Percent of Debt Maturing (Q2'21) 4 American Finance Trust, Inc. AFIN’s best in class and necessity retail focused portfolio is supported by a strong, long term and diligently constructed capital structure 90% of AFIN’s Debt Is Scheduled to Mature After 2024 ( Balance Sheet Highlights Weighted Average Interest Rate and Debt Maturity ( KEY CAPITALIZATION METRICS Key Debt Metrics 3.3 Years 5.0 Years 4.8 Years 4.5 Years 5.3 Years 3.8% 3.8% 3.8% 3.8% 3.7% 0 1 2 3 4 5 3.0% 3.5% 4.0% 4.5% 5.0% 5.5% 6.0% Q2'2020 Q3'2020 Q4'2020 Q1'2021 Q2'2021 Paid down the remaining balances on 2021 debt maturities, resulting in no debt maturities through 2022 Year over year, the Company’s weighted average debt maturity improved to 5.3 years from 3.3 years as near term maturing debt was paid down or refinanced with five years or more of term Year over year, fixed rate debt as a percentage increased to 91.4% from 72.3% as we opportunistically locked in interest rates at historically low levels Note: Metrics as of the end of and for the three months ended June 30 , 2021 unless otherwise indicated . 1) Based on total debt outstanding as of June 30, 2021 and June 30, 2020. For purposes of the revolving credit facility, the chart uses debt outstanding under the facility at such da te and not the total commitment. 2) Weighted based on the outstanding principal balance of debt for Q2’21 as of June 30, 2021 and for Q2’20 as of June 30, 2020. 3) The interest coverage ratio is calculated by dividing adjusted EBITDA by cash paid for interest (interest expense less amortizat ion of deferred financing costs, net, change in accrued interest and amortization of mortgage premiums on borrowings) for the quarter ended June 30, 2021 or the quarter ended June 30, 2020. Adjusted EBITDA and cash paid for interest are Non GAAP metrics. See appendix for Non GAAP reconciliations. 4) Includes floating rate debt fixed by swaps. Metric Q2’2021 Q2’2020 Interest Coverage Ratio ( 3.1x 2.6x Fixed Rate Debt ( 91.4% 72.3% Weighted Average Interest Rate ( 3.7% 3.8% Weighted Average Debt Maturity ( 5.3 Years 3.3 Years
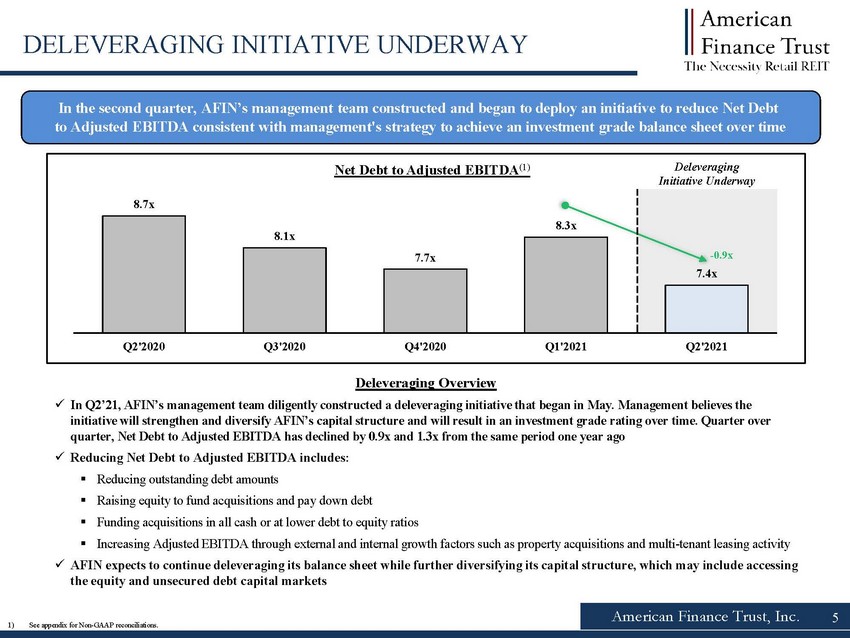
American Finance Trust, Inc. DELEVERAGING INITIATIVE UNDERWAY 5 In the second quarter, AFIN’s management team constructed and began to deploy an initiative to reduce Net Debt to Adjusted EBITDA consistent with management's strategy to achieve an investment grade balance sheet over time 8.7x 8.1x 7.7x 8.3x 7.4x 6.5 7 7.5 8 8.5 9 Q2'2020 Q3'2020 Q4'2020 Q1'2021 Q2'2021 Net Debt to Adjusted EBITDA ( Deleveraging Initiative Underway - 0.9x Deleveraging Overview In Q2’21, AFIN’s management team diligently constructed a deleveraging initiative that began in May. Management believes the initiative will strengthen and diversify AFIN’s capital structure and will result in an investment grade rating over time. Qu art er over quarter, Net Debt to Adjusted EBITDA has declined by 0.9x and 1.3x from the same period one year ago Reducing Net Debt to Adjusted EBITDA includes: Reducing outstanding debt amounts Raising equity to fund acquisitions and pay down debt Funding acquisitions in all cash or at lower debt to equity ratios Increasing Adjusted EBITDA through external and internal growth factors such as property acquisitions and multi tenant leasing a ctivity AFIN expects to continue deleveraging its balance sheet while further diversifying its capital structure, which may include a cce ssing the equity and unsecured debt capital markets 1) See appendix for Non GAAP reconciliations.
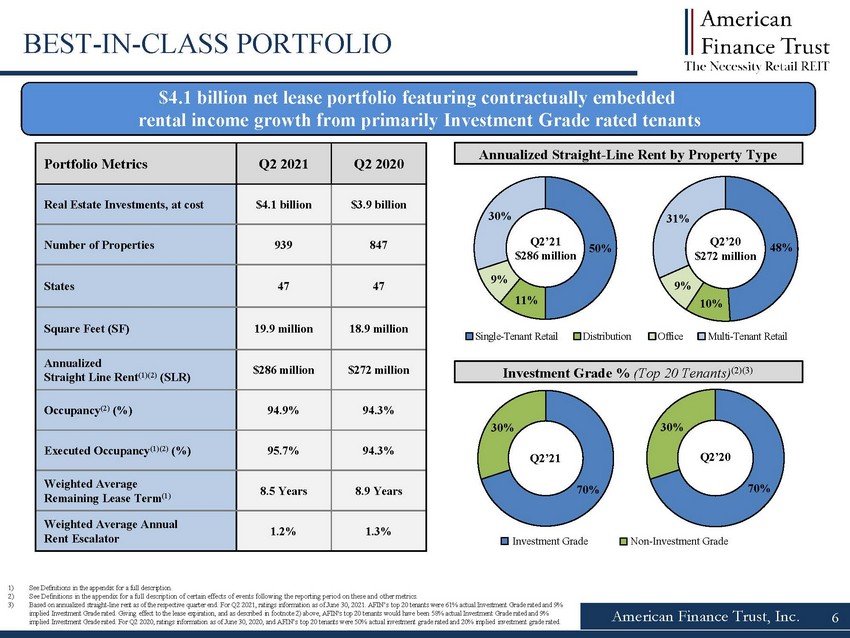
70% 30% 48% 10% 9% 31% 70% 30% 50% 11% 9% 30% American Finance Trust, Inc. $4.1 billion net lease portfolio featuring contractually embedded rental income growth from primarily Investment Grade rated tenants 1) See Definitions in the appendix for a full description. 2) See Definitions in the appendix for a full description of certain effects of events following the reporting period on these a nd other metrics. 3) Based on annualized straight line rent as of the respective quarter end. For Q2 2021, ratings information as of June 30, 2021. A FIN’s top 20 tenants were 61% actual Investment Grade rated and 9% implied Investment Grade rated. Giving effect to the lease expiration, and as described in footnote 2) above, AFIN's top 20 t ena nts would have been 58% actual Investment Grade rated and 9% implied Investment Grade rated. For Q2 2020, ratings information as of June 30, 2020, and AFIN’s top 20 tenants were 50% actu al investment grade rated and 20% implied investment grade rated. Portfolio Metrics Q2 2021 Q2 2020 Real Estate Investments, at cost $4.1 billion $3.9 billion Number of Properties 939 847 States 47 47 Square Feet (SF) 19.9 million 18.9 million Annualized Straight Line Rent (1)( 2)( $286 million $272 million Occupancy ( 94.9% 94.3% Executed Occupancy (1)( 95.7% 94.3% Weighted Average Remaining Lease Term ( 8.5 Years 8.9 Years Weighted Average Annual Rent Escalator 1.2% 1.3% BEST IN CLASS PORTFOLIO Annualized Straight Line Rent by Property Type 6 Q2’20 $272 million Q2’21 $286 million Single Tenant Retail Distribution Office Multi Tenant Retail Investment Grade % (Top 20 Tenants)Tenants)(2)( Investment Grade Non Investment Grade Q2’21 Q2’20
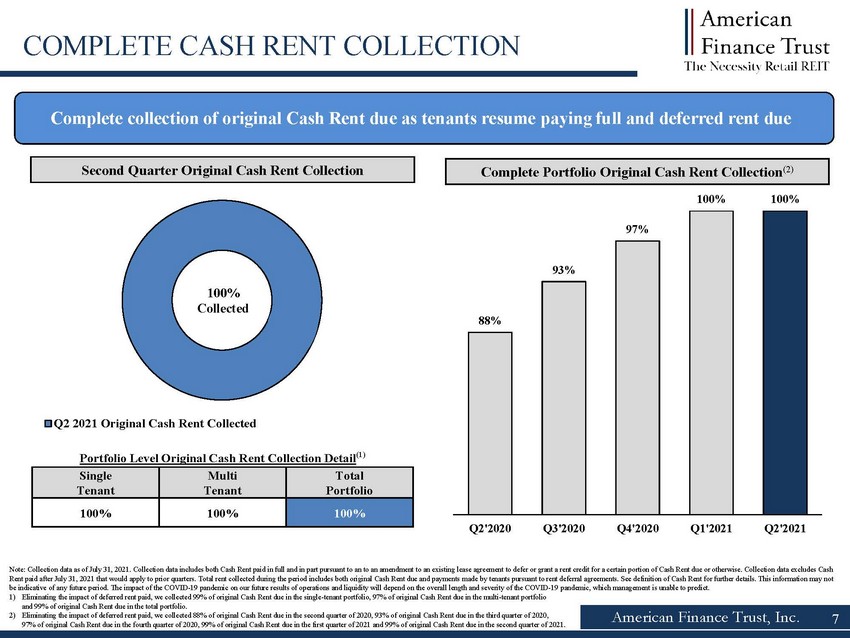
Q2 2021 Original Cash Rent Collected American Finance Trust, Inc. COMPLETE CASH RENT COLLECTION 7 Complete collection of original Cash Rent due as tenants resume paying full and deferred rent due Second Quarter Original Cash Rent Collection Complete Portfolio Original Cash Rent Collection ( 100% 100% 97% 93% 88% Q2'2021 Q1'2021 Q4'2020 Q3'2020 Q2'2020 100% Collected Portfolio Level Original Cash Rent Collection Detail ( Single Tenant Multi Tenant Total Portfolio 100% 100% 100% Note: Collection data as of July 31, 2021. Collection data includes both Cash Rent paid in full and in part pursuant to an to an amendment to an existing lease agreement to defer or grant a rent credit for a certain portion of Cash Rent due or othe rw ise. Collection data excludes Cash Rent paid after July 31, 2021 that would apply to prior quarters. Total rent collected during the period includes both original Cash Rent due and payments ma de by tenants pursuant to rent deferral agreements. See definition of Cash Rent for further details. This information may not be indicative of any future period. The impact of the COVID 19 pandemic on our future results of operations and liquidity will d epend on the overall length and severity of the COVID 19 pandemic, which management is unable to predict. 1) Eliminating the impact of deferred rent paid, we collected 99% of original Cash Rent due in the single tenant portfolio, 97% of original Cash Rent due in the multi tenant portfolio and 99% of original Cash Rent due in the total portfolio. 2) Eliminating the impact of deferred rent paid, we collected 88% of original Cash Rent due in the second quarter of 2020, 93% o f o riginal Cash Rent due in the third quarter of 2020, 97% of original Cash Rent due in the fourth quarter of 2020, 99% of original Cash Rent due in the first quarter of 2021 and 9 9% of original Cash Rent due in the second quarter of 2021.
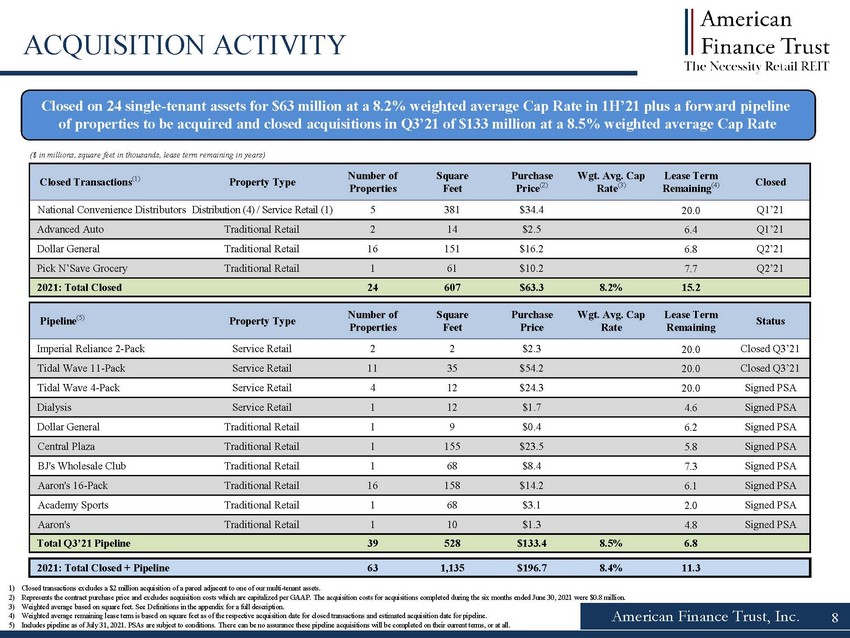
American Finance Trust, Inc. ACQUISITION ACTIVITY ($ in millions, square feet in thousands, lease term remaining in years) 1) Closed transactions excludes a $2 million acquisition of a parcel adjacent to one of our multi tenant assets. 2) Represents the contract purchase price and excludes acquisition costs which are capitalized per GAAP. The acquisition costs f or acquisitions completed during the six months ended June 30, 2021 were $0.8 million. 3) Weighted average based on square feet. See Definitions in the appendix for a full description. 4) Weighted average remaining lease term is based on square feet as of the respective acquisition date for closed transactions a nd estimated acquisition date for pipeline. 5) Includes pipeline as of July 31 , 2021 . PSAs are subject to conditions . There can be no assurance these pipeline acquisitions will be completed on their current terms, or at all. Closed Transactions ( Property Type Number of Properties Square Feet Purchase Price ( Wgt. Avg. Cap Rate ( Lease Term Remaining ( Closed National Convenience Distributors Distribution (4) / Service Retail (1) 5 381 $34.4 20.0 Q1’21 Advanced Auto Traditional Retail 2 14 $2.5 6.4 Q1’21 Dollar General Traditional Retail 16 151 $16.2 6.8 Q2’21 Pick N’Save Grocery Traditional Retail 1 61 $10.2 7.7 Q2’21 2021: Total Closed 24 607 $63.3 8.2% 15.2 Pipeline ( Property Type Number of Properties Square Feet Purchase Price Wgt. Avg. Cap Rate Lease Term Remaining Status Imperial Reliance 2 Pack Service Retail 2 2 $2.3 20.0 Closed Q3’21 Tidal Wave 11 Pack Service Retail 11 35 $54.2 20.0 Closed Q3’21 Tidal Wave 4 Pack Service Retail 4 12 $24.3 20.0 Signed PSA Dialysis Service Retail 1 12 $1.7 4.6 Signed PSA Dollar General Traditional Retail 1 9 $0.4 6.2 Signed PSA Central Plaza Traditional Retail 1 155 $23.5 5.8 Signed PSA BJ's Wholesale Club Traditional Retail 1 68 $8.4 7.3 Signed PSA Aaron's 16 Pack Traditional Retail 16 158 $14.2 6.1 Signed PSA Academy Sports Traditional Retail 1 68 $3.1 2.0 Signed PSA Aaron's Traditional Retail 1 10 $1.3 4.8 Signed PSA Total Q3’21 Pipeline 39 528 $133.4 8.5% 6.8 2021: Total Closed + Pipeline 63 1,135 $196.7 8.4% 11.3 8 Closed on 24 single tenant assets for $63 million at a 8.2% weighted average Cap Rate in 1H’21 plus a forward pipeline of properties to be acquired and closed acquisitions in Q3’21 of $133 million at a 8.5 % weighted average Cap Rate
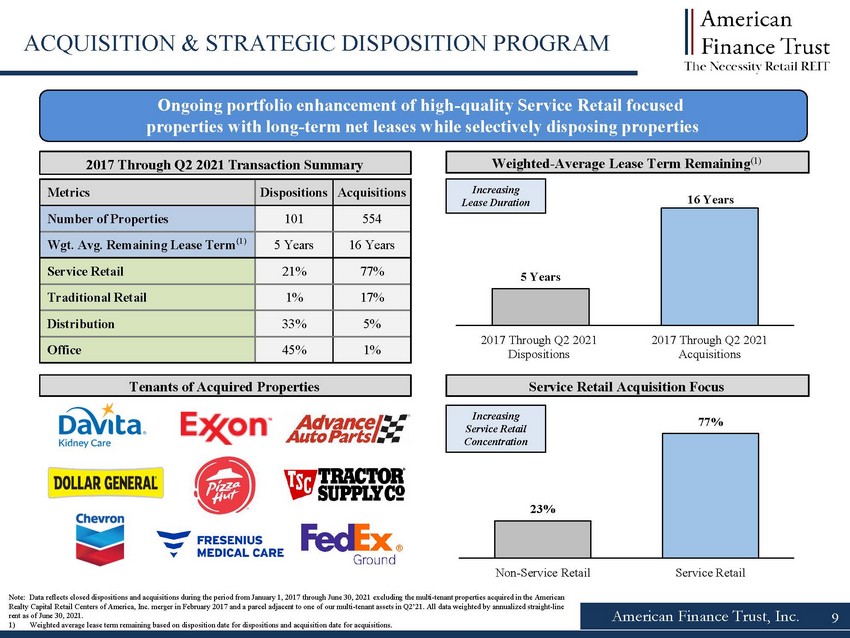
American Finance Trust, Inc. Ongoing portfolio enhancement of high quality Service Retail focused properties with long term net leases while selectively disposing properties Note: Data reflects closed dispositions and acquisitions during the period from January 1, 2017 through June 30, 2021 excluding the multi tenant properties acquired in the American Realty Capital Retail Centers of America, Inc. merger in February 2017 and a parcel adjacent to one of our multi tenant assets i n Q2’21 . All data weighted by annualized straight line rent as of June 30, 2021 1) Weighted average lease term remaining based on disposition date for dispositions and acquisition date for acquisitions. 9 Metrics Dispositions Acquisitions Number of Properties 101 554 Wgt . Avg. Remaining Lease Term ( 5 Years 16 Years Service Retail 21% 77% Traditional Retail 1% 17% Distribution 33% 5% Office 45% 1% 2017 Through Q2 2021 Transaction Summary Weighted Average Lease Term Remaining ( Service Retail Acquisition Focus Tenants of Acquired Properties Increasing Service Retail Concentration Increasing Lease Duration 5 Years 16 Years 2017 Through Q2 2021 Dispositions 2017 Through Q2 2021 Acquisitions ACQUISITION & STRATEGIC DISPOSITION PROGRAM 23% 77% Non-Service Retail Service Retail
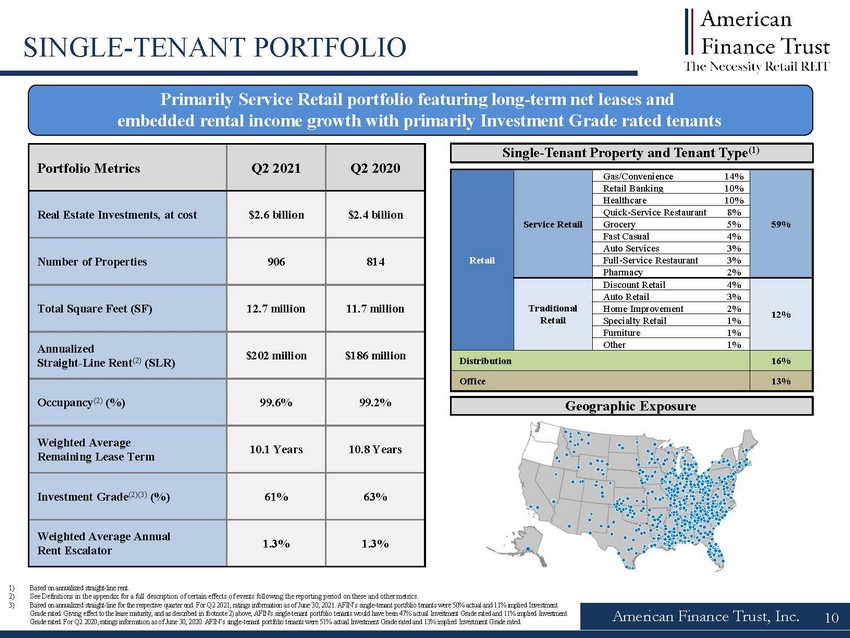
Primarily Service Retail portfolio featuring long term net leases and embedded rental income growth with primarily Investment Grade rated tenants Portfolio Metrics Q2 2021 Q2 2020 Real Estate Investments, at cost $2.6 billion $2.4 billion Number of Properties 906 814 Total Square Feet (SF) 12.7 million 11.7 million Annualized Straight Line Rent ( 2)( $202 million $186 million Occupancy ( 99.6% 99.2% Weighted Average Remaining Lease Term 10.1 Years 10.8 Years Investment Grade (2)( 61% 63% Weighted Average Annual Rent Escalator 1.3% 1.3% American Finance Trust, Inc. 10 SINGLE TENANT PORTFOLIO Single Tenant Property and Tenant Type ( Retail Service Retail Gas/Convenience 14% 59% Retail Banking 10% Healthcare 10% Quick Service Restaurant 8% Grocery 5% Fast Casual 4% Auto Services 3% Full Service Restaurant 3% Pharmacy 2% Traditional Retail Discount Retail 4% 12% Auto Retail 3% Home Improvement 2% Specialty Retail 1% Furniture 1% Other 1% Distribution 16% Office 13% Geographic Exposure 1) Based on annualized straight line rent. 2) See Definitions in the appendix for a full description of certain effects of events following the reporting period on these a nd other metrics. 3) Based on annualized straight line for the respective quarter end. For Q2 2021, ratings information as of June 30, 2021. AFIN’s s ingle tenant portfolio tenants were 50% actual and 11% implied Investment Grade rated. Giving effect to the lease maturity, and as described in footnote 2) above, AFIN's single tenant portfolio tenants would have been 47% actual Investment Grade rated and 11% implied Investment Grade rated. For Q2 2020, ratings information as of June 30, 2020. AFIN’s single tenant portfolio tenants were 51% actual Invest ment Grade rated and 13% implied Investment Grade rated.
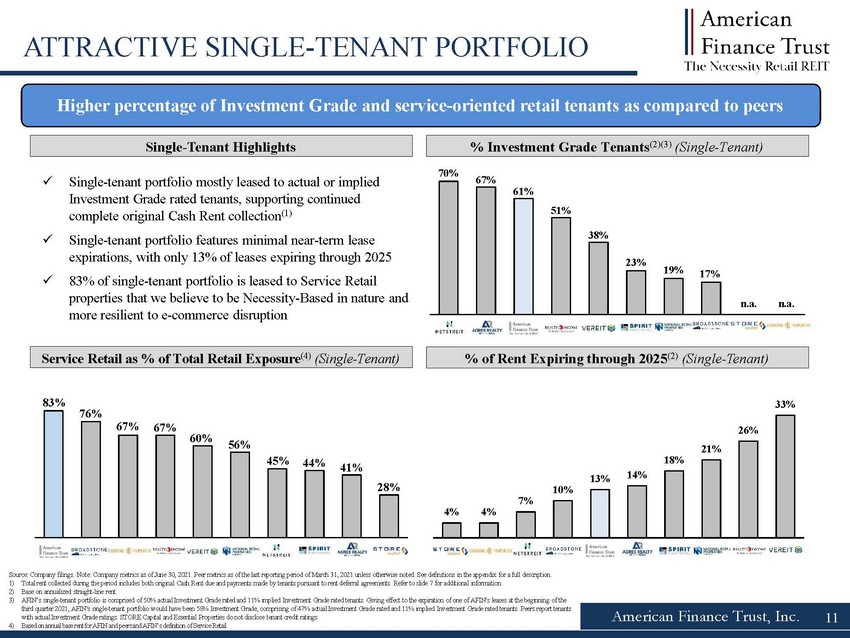
83% 76% 67% 67% 60% 56% 45% 44% 41% 28% AFIN BNL EPRT STOR NNN O NTST SRC ADC VER 70% 67% 61% 51% 38% 23% 19% 17% n.a. n.a. NTST ADC AFIN O VER SRC NNN BNL EPRT STOR 33% 26% 21% 18% 14% 13% 10% 7% 4% 4% EPRT AFIN STOR NNN O SRC VER 11 American Finance Trust, Inc. Single tenant portfolio mostly leased to actual or implied Investment Grade rated tenants, supporting continued complete original Cash Rent collection ( Single tenant portfolio features minimal near term lease expirations, with only 13% of leases expiring through 2025 83% of single tenant portfolio is leased to Service Retail properties that we believe to be Necessity Based in nature and more resilient to e commerce disruption Higher percentage of Investment Grade and service oriented retail tenants as compared to peers Service Retail as % of Total Retail Exposure ( 4)(Single Tenant) % Investment Grade Tenants ( 2)( 3)(Single Tenant) Source: Company filings. Note: Company metrics as of June 30, 2021. Peer metrics as of the last reporting period of March 31, 2021 unless otherwise noted. See definitions in the appendix for a full description. 1) Total rent collected during the period includes both original Cash Rent due and payments made by tenants pursuant to rent def err al agreements. Refer to slide 7 for additional information. 2) Base on annualized straight line rent. 3) AFIN’s single tenant portfolio is comprised of 50 % actual Investment Grade rated and 11% implied Investment Grade rated tenants. Giving effect to the expiration of one of AFIN's leases at the beginning of the third quarter 2021, AFIN's single tenant portfolio would have been 58% Investment Grade, comprising of 47% actual Investment Gra de rated and 11% implied Investment Grade rated tenants. Peers report tenants with actual Investment Grade ratings. STORE Capital and Essential Properties do not disclose tenant credit ratings. 4) Based on annual base rent for AFIN and peers and AFIN’s definition of Service Retail. % of Rent Expiring through 2025 ( 2)(Single Tenant) ATTRACTIVE SINGLE TENANT PORTFOLIO Single Tenant Highlights
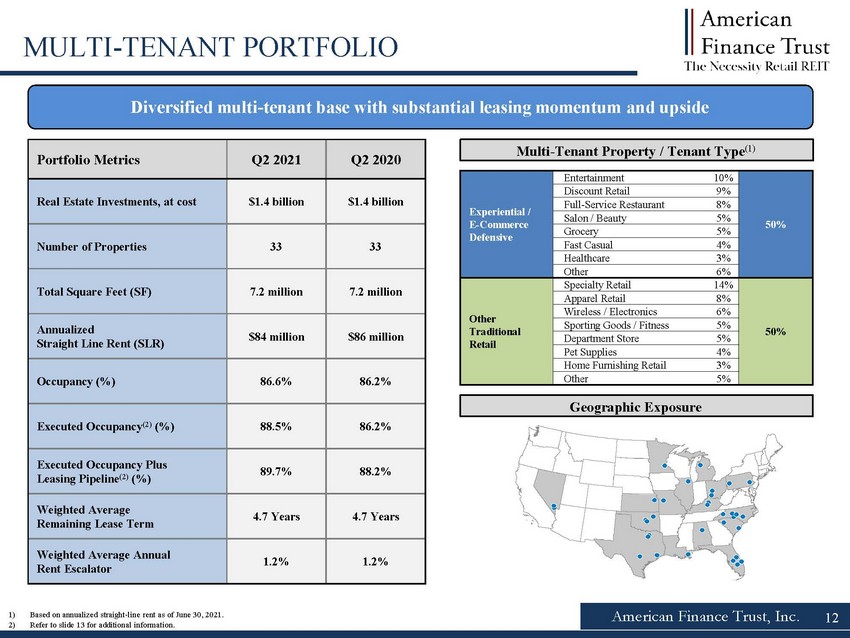
American Finance Trust, Inc. MULTI TENANT PORTFOLIO Diversified multi tenant base with substantial leasing momentum and upside Portfolio Metrics Q2 2021 Q2 2020 Real Estate Investments, at cost $1.4 billion $1.4 billion Number of Properties 33 33 Total Square Feet (SF) 7.2 million 7.2 million Annualized Straight Line Rent (SLR) $84 million $86 million Occupancy (%) 86.6% 86.2% Executed Occupancy ( 88.5% 86.2% Executed Occupancy Plus Leasing Pipeline ( 89.7% 88.2% Weighted Average Remaining Lease Term 4.7 Years 4.7 Years Weighted Average Annual Rent Escalator 1.2% 1.2% Multi Tenant Property / Tenant Type ( Experiential / E Commerce Defensive Entertainment 10% 50% Discount Retail 9% Full Service Restaurant 8% Salon / Beauty 5% Grocery 5% Fast Casual 4% Healthcare 3% Other 6% Other Traditional Retail Specialty Retail 14% 50% Apparel Retail 8% Wireless / Electronics 6% Sporting Goods / Fitness 5% Department Store 5% Pet Supplies 4% Home Furnishing Retail 3% Other 5% Geographic Exposure 12 1) Based on annualized straight line rent as of June 30, 2021. 2) Refer to slide 13 for additional information.
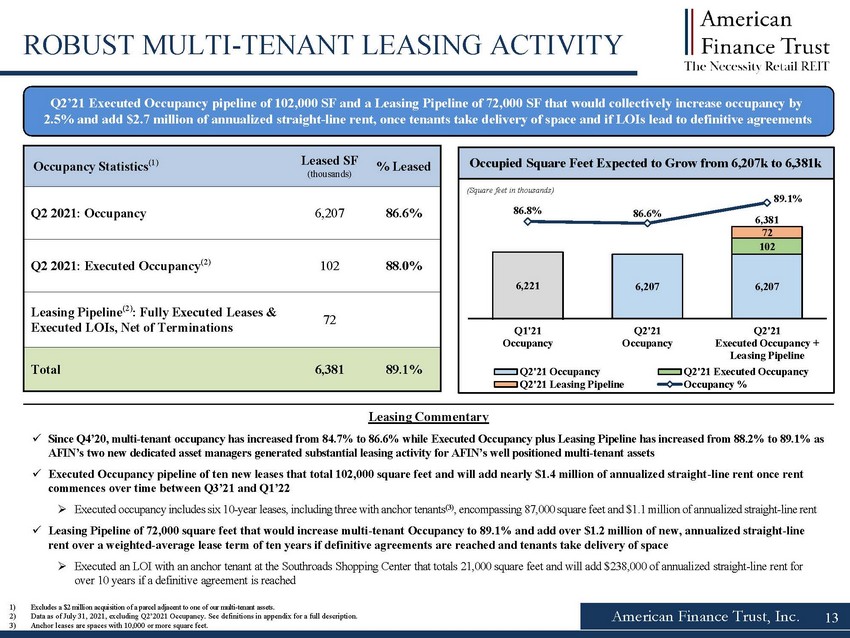
6,207 6,207 102 72 6,221 6,381 86.8% 86.6% 89.1% 75.0% 77.0% 79.0% 81.0% 83.0% 85.0% 87.0% 89.0% 5,800 5,900 6,000 6,100 6,200 6,300 6,400 6,500 6,600 Q1'21 Occupancy Q2'21 Occupancy Q2'21 Executed Occupancy + Leasing Pipeline Q2'21 Occupancy Q2'21 Executed Occupancy Q2'21 Leasing Pipeline Occupancy % American Finance Trust, Inc. 13 ROBUST MULTI TENANT LEASING ACTIVITY 1) Excludes a $2 million acquisition of a parcel adjacent to one of our multi tenant assets. 2) Data as of July 31, 2021, excluding Q2’2021 Occupancy. See definitions in appendix for a full description. 3) Anchor leases are spaces with 10,000 or more square feet. Occupancy Statistics ( Leased SF (thousands) % Leased Q2 2021: Occupancy 6,207 86.6% Q2 2021: Executed Occupancy ( 102 88.0% Leasing Pipeline ( 2): Fully Executed Leases & Executed LOIs , Net of Terminations 72 Total 6,381 89.1% Occupied Square Feet Expected to Grow from 6,207k to 6,381k (Square feet in thousands) Q2’21 Executed Occupancy pipeline of 102,000 SF and a Leasing Pipeline of 72,000 SF that would collectively increase occupanc y b y 2.5% and add $2.7 million of annualized straight line rent, once tenants take delivery of space and if LOIs lead to definitive a greements Leasing Commentary Since Q4’20, multi tenant occupancy has increased from 84.7% to 86.6% while Executed Occupancy plus Leasing Pipeline has increas ed from 88.2% to 89.1% as AFIN’s two new dedicated asset managers generated substantial leasing activity for AFIN’s well positioned multi tenant assets Executed Occupancy pipeline of ten new leases that total 102,000 square feet and will add nearly $1.4 million of annualized straight line rent once rent commences over time between Q3’21 and Q1’22 Executed occupancy includes six 10 year leases, including three with anchor tenants ( 3), encompassing 87,000 square feet and $1.1 million of annualized straight line rent Leasing Pipeline of 72,000 square feet that would increase multi tenant Occupancy to 89.1% and add over $1.2 million of new, ann ualized straight line rent over a weighted average lease term of ten years if definitive agreements are reached and tenants take delivery of space Executed an LOI with an anchor tenant at the Southroads Shopping Center that totals 21,000 square feet and will add $238,000 of annualized straight line rent for over 10 years if a definitive agreement is reached
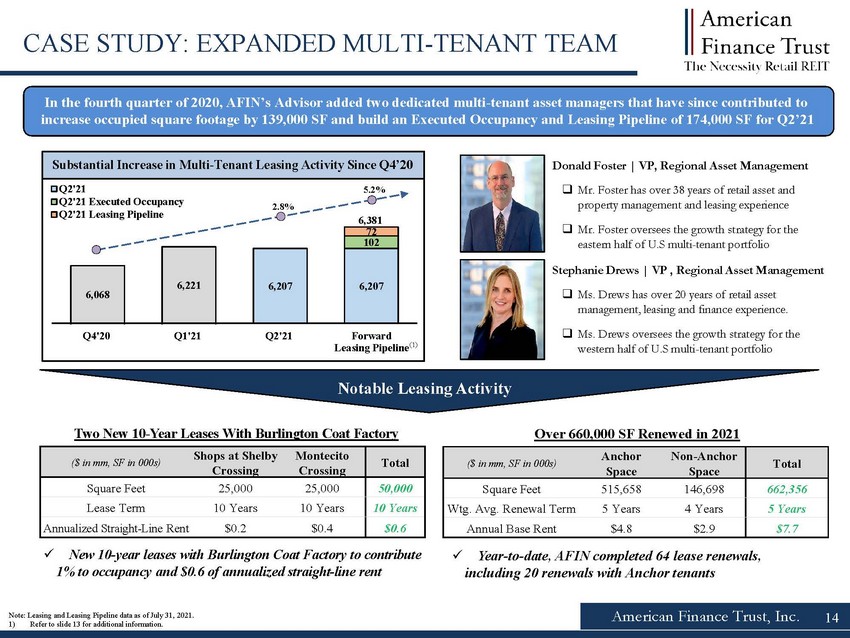
American Finance Trust, Inc. 14 CASE STUDY: EXPANDED MULTI TENANT TEAM Substantial Increase in Multi Tenant Leasing Activity Since Q4’20 In the fourth quarter of 2020, AFIN’s Advisor added two dedicated multi tenant asset managers that have since contributed to increase occupied square footage by 139,000 SF and build an Executed Occupancy and Leasing Pipeline of 174,000 SF for Q2’21 Donald Foster | VP, Regional Asset Management Mr. Foster has over 38 years of retail asset and property management and leasing experience Mr. Foster oversees the growth strategy for the eastern half of U.S multi tenant portfolio Stephanie Drews | VP , Regional Asset Management Ms. Drews has over 20 years of retail asset management, leasing and finance experience. Ms. Drews oversees the growth strategy for the western half of U.S multi tenant portfolio 6,207 6,207 102 72 6,068 6,221 6,381 0.75 0.77 0.79 0.81 0.83 0.85 0.87 5600 5700 5800 5900 6000 6100 6200 6300 6400 6500 Q4'20 Q1'21 Q2'21 Forward Leasing Pipeline Q2'21 Q2'21 Executed Occupancy Q2'21 Leasing Pipeline Over 660,000 SF Renewed in 2021 (1) ($ in mm, SF in 000s) Shops at Shelby Crossing Montecito Crossing Total Square Feet 25,000 25,000 50,000 Lease Term 10 Years 10 Years 10 Years Annualized Straight Line Rent $0.2 $0.4 $0.6 New 10 year leases with Burlington Coat Factory to contribute 1% to occupancy and $0.6 of annualized straight line rent Two New 10 Year Leases With Burlington Coat Factory Notable Leasing Activity 2.8% 5.2% ($ in mm, SF in 000s) Anchor Space Non Anchor Space Total Square Feet 515,658 146,698 662,356 Wtg . Avg. Renewal Term 5 Years 4 Years 5 Years Annual Base Rent $4.8 $2.9 $7.7 Year to date, AFIN completed 64 lease renewals, including 20 renewals with Anchor tenants Note: Leasing and Leasing Pipeline data as of July 31, 2021. 1) Refer to slide 13 for additional information.
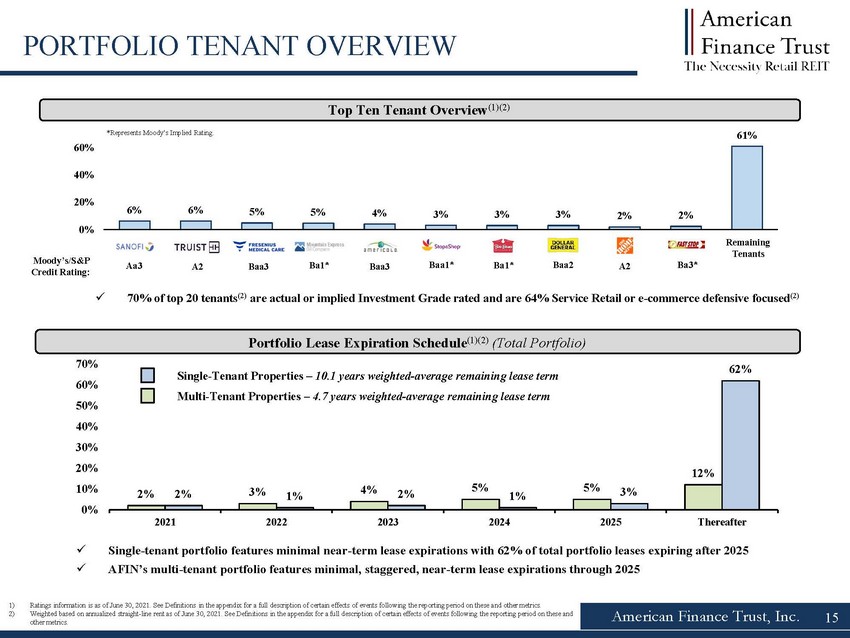
6% 6% 5% 5% 4% 3% 3% 3% 2% 2% 61% 0% 20% 40% 60% Sanofi Truist Fresenius Medical Mountain Express Americold Stop & Shop Bob Evans Home Depot Dollar General IMTAA Remaining Tenants 70 % of top 20 tenants ( are actual or implied Investment Grade rated and are 64 % S ervice Retail or e commerce defensive focused ( 2% 3% 4% 5% 5% 12% 2% 1% 2% 1% 3% 62% 0% 10% 20% 30% 40% 50% 60% 70% 2021 2022 2023 2024 2025 Thereafter American Finance Trust, Inc. PORTFOLIO TENANT OVERVIEW 1) Ratings information is as of June 30, 2021. See Definitions in the appendix for a full description of certain effects of events following the reporting period on these a nd other metrics. 2) Weighted based on annualized straight line rent as of June 30, 2021. See Definitions in the appendix for a full description of certain effects of events following the reporting period on these a nd other metrics. Top Ten Tenant Overview (1)( Remaining Tenants Moody’s/S&P Credit Rating: 15 A2 Portfolio Lease Expiration Schedule (1)( 2)(Total Single tenant portfolio features minimal near term lease expirations with 62% of total portfolio leases expiring after 2025 AFIN’s multi tenant portfolio features minimal, staggered, near term lease expirations through 2025 Multi Tenant Properties 4.7 years weighted average remaining lease term Single Tenant Properties 10.1 years weighted average remaining lease term Aa3 Ba1* Baa3 Baa1* Ba1* A2 Ba3* Baa3 Baa2 *Represents Moody’s Implied Rating.
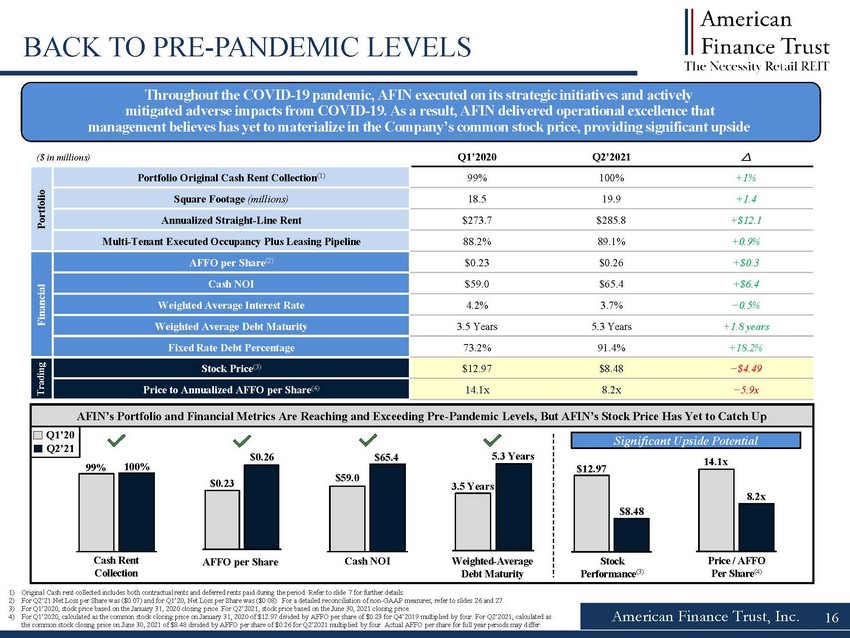
American Finance Trust, Inc. 16 BACK TO PRE-PANDEMIC LEVELS ($ in millions) Q1’2020 Q2’2021 Portfolio Portfolio Original Cash Rent Collection(1) 99% 100% +1% Square Footage (millions) 18.5 19.9 +1.4 Annualized Straight-Line Rent $273.7 $285.8 +$12.1 Multi-Tenant Executed Occupancy Plus Leasing Pipeline 88.2% 89.1% +0.9% Financial AFFO per Share(2) $0.23 $0.26 +$0.3 Cash NOI $59.0 $65.4 +$6.4 Weighted Average Interest Rate 4.2% 3.7% −0.5% Weighted Average Debt Maturity 3.5 Years 5.3 Years +1.8 years Fixed Rate Debt Percentage 73.2% 91.4% +18.2% Stock Price(3) $12.97 $8.48 −$4.49 Price to Annualized AFFO per Share(4) 14.1x 8.2x −5.9x AFIN’s Portfolio and Financial Metrics Are Reaching and Exceeding Pre-Pandemic Levels, But AFIN’s Stock Price Has Yet to Catch Up 99% 100% Q4'19 Q1'21 $0.23 $0.26 Q4'19 Q1'21 3.5 Years 5.3 Years Cash Rent Q4'19 Q1'21 Collection AFFO per Share Weighted-Average Debt Maturity 1) Original Cash rent collected includes both contractual rents and deferred rents paid during the period. Refer to slide 7 for further details. 2) For Q2’21 Net Loss per Share was ($0.07) and for Q1’20, Net Loss per Share was ($0.08). For a detailed reconciliation of non-GAAP measures, refer to slides 26 and 27. 3) For Q1’2020, stock price based on the January 31, 2020 closing price. For Q2’2021, stock price based on the June 30, 2021 closing price. 4) For Q1’2020, calculated as the common stock closing price on January 31, 2020 of $12.97 divided by AFFO per share of $0.23 for Q4’2019 multiplied by four. For Q2’2021, calculated as the common stock closing price on June 30, 2021 of $8.48 divided by AFFO per share of $0.26 for Q2’2021 multiplied by four. Actual AFFO per share for full year periods may differ. $59.0 $65.4 Q4C'1a9sh NQO1I'21 Q1’20 Q2’21 $12.97 $8.48 Q4'19StocQk 1'21 Performance(3) 14.1x 8.2x QP4r'i1c9e / AQFF1'O21 Per Share(4) Significant Upside Potential Trading Throughout the COVID-19 pandemic, AFIN executed on its strategic initiatives and actively mitigated adverse impacts from COVID-19. As a result, AFIN delivered operational excellence that management believes has yet to materialize in the Company’s common stock price, providing significant upside
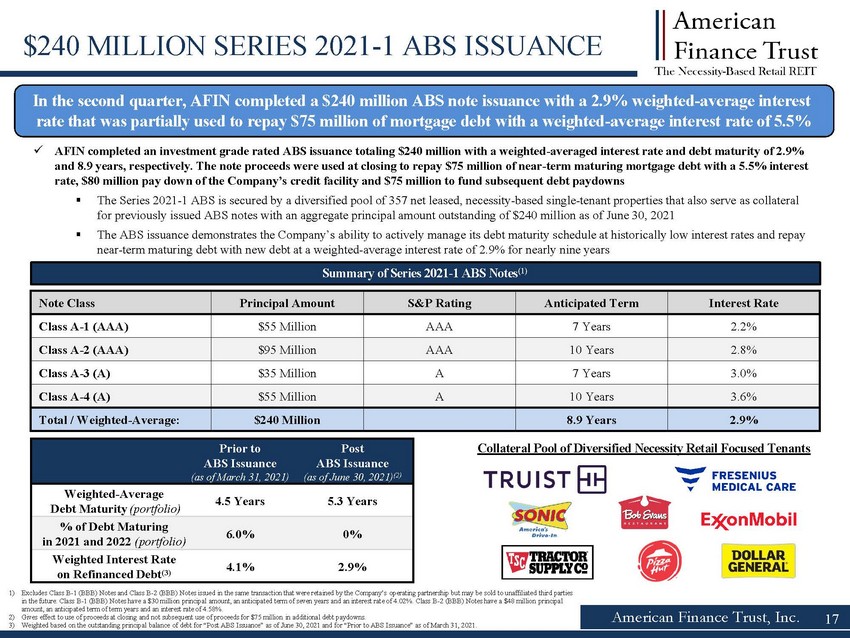
American Finance Trust, Inc. $240 MILLION SERIES 2021 1 ABS ISSUANCE 17 In the second quarter, AFIN completed a $240 million ABS note issuance with a 2.9% weighted average interest rate that was partially used to repay $75 million of mortgage debt with a weighted average interest rate of 5.5% AFIN completed an investment grade rated ABS issuance totaling $240 million with a weighted averaged interest rate and debt matu rity of 2.9% and 8.9 years, respectively. The note proceeds were used at closing to repay $75 million of near term maturing mortgage debt wit h a 5.5% interest rate, $80 million pay down of the Company’s credit facility and $75 million to fund subsequent debt paydowns The Series 2021 1 ABS is secured by a diversified pool of 357 net leased, necessity based single tenant properties that also ser ve as collateral for previously issued ABS notes with an aggregate principal amount outstanding of $240 million as of June 30, 2021 The ABS issuance demonstrates the Company’s ability to actively manage its debt maturity schedule at historically low interes t r ates and repay near term maturing debt with new debt at a weighted average interest rate of 2.9% for nearly nine years Prior to ABS Issuance (as of March 31, 2021) Post ABS Issuance (as of June 30, 2021) 2021)( Weighted Average Debt Maturity ( 4.5 Years 5.3 Years % of Debt Maturing in 2021 and 2022 ( 6.0% 0% Weighted Interest Rate on Refinanced Debt ( 4.1% 2.9% Summary of Series 2021 1 ABS Notes ( Note Class Principal Amount S&P Rating Anticipated Term Interest Rate Class A 1 (AAA) $55 Million AAA 7 Years 2.2% Class A 2 (AAA) $95 Million AAA 10 Years 2.8% Class A 3 (A) $35 Million A 7 Years 3.0% Class A 4 (A) $55 Million A 10 Years 3.6% Total / Weighted Average: $240 Million 8.9 Years 2.9% Collateral Pool of Diversified Necessity Retail Focused Tenants 1) Excludes Class B 1 (BBB) Notes and Class B 2 (BBB) Notes issued in the same transaction that were retained by the Company’s oper ating partnership but may be sold to unaffiliated third parties in the future. Class B 1 (BBB) Notes have a $30 million principal amount, an anticipated term of seven years and an interest rat e of 4.02%. Class B 2 (BBB) Notes have a $48 million principal amount, an anticipated term of term years and an interest rate of 4.58%. 2) Gives effect to use of proceeds at closing and not subsequent use of proceeds for $75 million in additional debt paydowns. 3) Weighted based on the outstanding principal balance of debt for “Post ABS Issuance” as of June 30, 2021 and for “Prior to ABS Issuance” as of March 31, 2021.
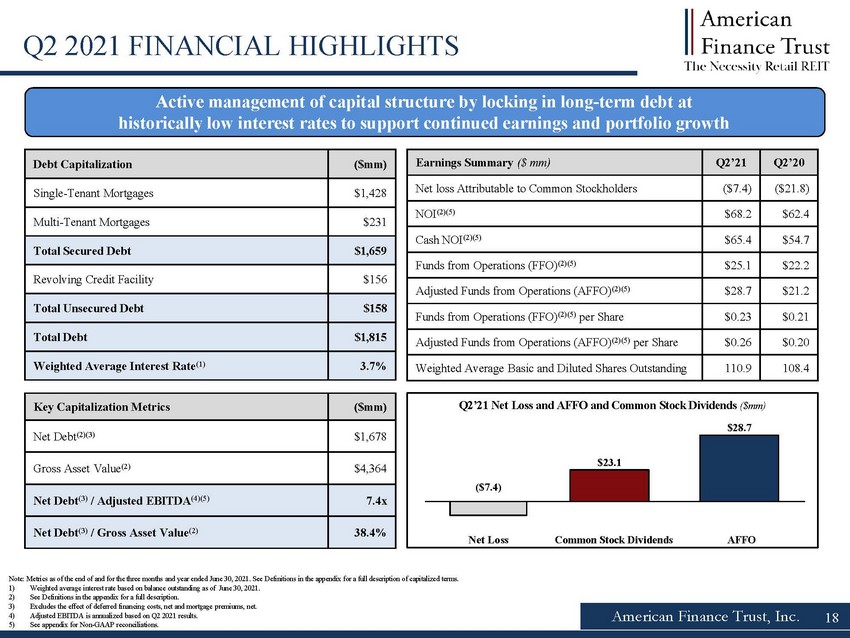
$23.1 $28.7 Net Loss Common Stock Dividends AFFO ($7.4) Net Loss Common Stock Dividends AFFO American Finance Trust, Inc. Q2 2021 FINANCIAL HIGHLIGHTS Note: Metrics as of the end of and for the three months and year ended June 30, 2021 . See Definitions in the appendix for a full description of capitalized terms. 1) Weighted average interest rate based on balance outstanding as of June 30, 2021 2) See Definitions in the appendix for a full description. 3) Excludes the effect of deferred financing costs, net and mortgage premiums, net. 4) Adjusted EBITDA is annualized based on Q2 2021 results. 5) See appendix for Non GAAP reconciliations. Active management of capital structure by locking in long term debt at historically low interest rates to support continued earnings and portfolio growth 18 Debt Capitalization ($mm) Single Tenant Mortgages $ 1,428 Multi Tenant Mortgages $231 Total Secured Debt $ 1,659 Revolving Credit Facility $156 Total Unsecured Debt $ 158 Total Debt $ 1,815 Weighted Average Interest Rate ( 3.7 Key Capitalization Metrics ($mm) Net Debt (2)( $1,678 Gross Asset Value ( $4,364 Net Debt ( 3)/ Adjusted EBITDA (4)( 7.4x Net Debt ( 3)/ Gross Asset Value ( 38.4% Earnings Summary ($ Q2’21 Q2’20 Net loss Attributable to Common Stockholders ($7.4) ($21.8) NOI (2)( $68.2 $62.4 Cash NOI (2)( $65.4 $54.7 Funds from Operations (FFO) FFO)(2)( $ 25.1 $22.2 Adjusted Funds from Operations (AFFO) AFFO)(2)( $ 28.7 $21.2 Funds from Operations (FFO) FFO)(2)( per Share $ 0.23 $0.21 Adjusted Funds from Operations (AFFO) AFFO)(2)( per Share $ 0.26 $0.20 Weighted Average Basic and Diluted Shares Outstanding 110.9 108.4 Q2’21 Net Loss and AFFO and Common Stock Dividends ($
American Finance Trust, Inc. 19 EXPERIENCED MANAGEMENT Jason Slear Executive Vice President of Real Estate Acquisitions and Dispositions Responsible for sourcing, negotiating, and closing AR Global's real estate acquisitions and dispositions Oversaw the acquisition of over $3.5 billion of real estate assets and the lease up of over 10 million square feet during professional career Michael Weil Chief Executive Officer, President and Chairman of the Board of Directors Founding partner of AR Global Previously served as Senior VP of sales and leasing for American Financial Realty Trust Served as president of the Board of Directors of the Real Estate Investment Securities Association (n/k/a ADISA) Boris Korotkin Senior Vice President of Capital Markets and Corporate Strategy Responsible for leading all debt capital market transactions Former Executive Vice President of Transaction Structuring for American Financial Realty Trust Ori Kravel Senior Vice President of Corporate Development Responsible for corporate development and business strategy Executed over $12 billion of capital market transactions and over $25 billion of M&A transactions Jason Doyle Chief Financial Officer, Treasurer and Secretary Mr. Doyle previously served as chief accounting officer of Global Net Lease, Inc. (“GNL”). Prior to joining AR Global and GNL , M r. Doyle held various financial and practice leadership roles, including Acting VP Finance at Markforged , Inc. Associate Controller, Head of Global Accounting Operations at Charles River Associates and VP Finance and Practice Director, Transportation at AST Corporation, a pri vately held software and management consulting firm Mr. Doyle is also the chief financial officer, treasurer and secretary of Healthcare Trust, Inc. (“HTI”)

Confidential Not for Distribution 20 20 Legal Notices
American Finance Trust, Inc. 21 DISCLAIMERS This presentation includes estimated projections of future operating results. These projections were not prepared in accordan ce with published guidelines of the SEC or the guidelines established by the American Institute of Certified Public Accountants for preparation and presentation of f ina ncial projections. This information is not fact and should not be relied upon as being necessarily indicative of future results; the projections were prepared in go od faith by management and are based on numerous assumptions that may prove to be wrong. Important factors that may affect actual results and cause the projections t o n ot be achieved include, but are not limited to, risks and uncertainties relating to the company and other factors described in the “Risk Factors” section of the Com pany's Annual Report on Form 10 K for the year ended December 31, 2019, the Company's subsequent Quarterly Reports on Form 10 Q and in future filings with the SEC . The projections also reflect assumptions as to certain business decisions that are subject to change. As a result, actual results may differ materially fr om those contained in the estimates. Accordingly, there can be no assurance that the estimates will be realized. The industry in which we operate is subject to a hig h degree of uncertainty and risk due to variety of factors, including those described in the “Risk Factors” and "Management's Discussion and Analysis of Financial Co ndi tion and Results of Operations" sections of the Company's Annual Report on Form 10 K for the year ended December 31, 2020, filed with the SEC on February 25, 20 21 and the Company's subsequent Quarterly Reports on Form 10 Q, Current Reports on Form 8 K and Annual Reports on Form 10 K filed with the SEC. These and other factors could cause results to differ materially from those expressed in these publications and reports. This presentation contains estimates and information concerning the Company’s industry and the Company’s peer companies that are based on industry publications, reports and peer company public filings. The Company has not independently verified the accuracy of the data contained in the se industry publications, reports and peer company public filings. These estimates and information involve a number of assumptions and limitations, and you are cautioned not to rely on or give undue weight to this information. The majority of the concessions granted to the Company's tenants as a result of the COVID 19 pandemic are rent deferrals or temporary rent abat ements with the original lease term unchanged and collection of deferred rent deemed probable. The Company's revenue recognition policy requi res that it must be probable that the Company will collect virtually all of the lease payments due and does not provide for partial reserves, or the ability to assume partial recovery. In light of the COVID 19 pandemic, the FASB and SEC agreed that for leases where the total lease cash flows will remain substantially the same o r less than those after the COVID 19 related effects, companies may choose to forgo the evaluation of the enforceable rights and obligations of the original lease contract as a practical expedient and account for rent concessions as if they were part of the enforceable rights and obligations of the parties unde r t he existing lease contract. As a result, rental revenue used to calculate Net Income and NAREIT FFO has not been, and the Company does not expect it to be, significan tly impacted by these types of deferrals. In addition, since the Company currently believes that these deferral amounts are collectable, they have been excl ude d from the increase in straight line rent for AFFO purposes the amounts recognized under GAAP relating to these types of rent deferrals. Conversely, for abatement s w here contractual rent has been reduced, the reduction is reflected over the remaining lease term for accounting purposes but represents a permanent reductio n a nd the Company has, accordingly, reduced its AFFO.
American Finance Trust, Inc. 22 FORWARD LOOKING STATEMENTS Certain statements made in this presentation are “forward looking statements” (as defined in Section 21E of the Exchange Act), w hich reflect the expectations of the Company regarding future events. The forward looking statements involve a number of risks, uncertainties and other factors that could cause actual results to differ materially from those contained in the forwa rd looking statements. Such forward looking statements include, but are not limited to, market and other expectations, objectives, and intentions, as well as any ot her statements that are not historical facts. Our potential risks and uncertainties are presented in the section titled “Item 1A Risk Factors” disclosed in our Annual Report on Form 10 K for the year ended December 31, 2020 filed with the SEC on February 25, 2021, and the Company's subsequent Quarterly Reports on Form 10 Q filed with the SEC. Forward looking statements sp eak as of the date they and, we disclaim any obligation to update and revise statements contained in these materials to reflect changed assumptions, the occurrence of unanticipated events or changes to fut ure operating results over time, unless required by law. The following are some of the risks and uncertainties relating to us, although not all risks and uncertainties, that could cause our actual results to dif fer materially from those presented in our forward looking statements: We may be unable to acquire properties on advantageous terms or our property acquisitions may not perform as we expect. We are subject to risks associated with a pandemic, epidemic or outbreak of a contagious disease, such as the ongoing global COV ID 19 pandemic, including negative impacts on our tenants and their respective businesses. Provisions in our credit facility may limit our ability to pay dividends on our Class A common stock, Series A Preferred Stoc k a nd Series C Preferred Stock. If we are not able to generate sufficient cash from operations, we may have to reduce the amount of dividends we pay or ident ify other financing sources. Funding dividends from other sources such as borrowings, asset sales or equity issuances limits the amount we can use for pro per ty acquisitions, investments and other corporate purposes. Our operating results are affected by economic and regulatory changes that have an adverse impact on the real estate market i n g eneral. Inflation may have an adverse effect on our investments. In owning properties we may experience, among other things, unforeseen costs associated with complying with laws and regulations and other costs, po tential difficulties selling properties and potential damages or losses resulting from climate change. We depend on tenants for our rental revenue and, accordingly, our rental revenue is dependent upon the success and economic v iab ility of our tenants. If a tenant or lease guarantor declares bankruptcy or becomes insolvent, we may be unable to collect balances due under relevant leases. Our tenants may not be diversified including by industry type or geographic location. The performance of our retail portfolio is linked to the market for retail space generally and factors that may impact our re tai l tenants, such as the increasing use of the Internet by retailers and consumers. We depend on our Advisor and Property Manager to provide us with executive officers, key personnel and all services required for us to conduct our operations. All of our executive officers face conflicts of interest, such as conflicts created by the terms of our agreements with our Advisor and compensation payabl e thereunder, conflicts allocating investment opportunities to us, and conflicts in allocating their time and attention to our matters. Conflicts that arise may not be res olv ed in our favor and could result in actions that are adverse to us. We have long term agreements with our Advisor and its affiliates that may be terminated only in limited circumstances. We have substantial indebtedness and may be unable to repay, refinance, restructure or extend our indebtedness as it becomes due . Increases in interest rates could increase the amount of our debt payments. We may incur additional indebtedness in the future. The stockholder rights plan adopted by our board of directors, our classified board and other aspects of our corporate struct ure and Maryland law may discourage a third party from acquiring us in a manner that might result in a premium price to our stockholders. Restrictions on share ownership contained in our charter may inhibit market activity in shares of our stock and restrict our bus iness combination opportunities. We may fail to continue to qualify as a REIT.

Confidential Not for Distribution 23 23 Appendix
American Finance Trust, Inc. 24 DEFINITIONS AFFO In calculating AFFO, we start with FFO, then we exclude certain income or expense items from AFFO that we consider to be more reflective of investing activities, such as non cash income and expense items and the income and expense effects of other activities that are not a fundamental attribute of our day to day operating business plan, such as amounts related to the litigation arising out of AFIN's 2017 merger with American Realty Capital Retail Centers of America, Inc ..(the “ These amounts include legal costs incurred as a result of the litigation, portions of which have been and may in the future be reimbursed under insurance policies maintained by us Insurance reimbursements are deducted from AFFO in the period of reimbursement We believe that excluding the litigation costs and subsequent insurance reimbursements litigation arising out of the Merger helps to provide a better understanding of the operating performance of our business Other income and expense items also include early extinguishment of debt and unrealized gains and losses, which may not ultimately be realized, such as gains or losses on derivative instruments and gains and losses on investments In addition, by excluding non cash income and expense items such as amortization of above market and below market leases intangibles, amortization of deferred financing costs, straight line rent, and share based compensation related to restricted shares and the 2018 outperformance agreement with the Advisor from AFFO, we believe we provide useful information regarding those income and expense items which have a direct impact on our ongoing operating performance By providing AFFO, we believe we are presenting useful information that can be used to better assess the sustainability of our ongoing operating performance without the impact of transactions or other items that are not related to the ongoing performance of our portfolio of properties AFFO presented by us may not be comparable to AFFO reported by other REITs that define AFFO differently Please refer to our Form 10 Q for further details on our calculation of AFFO Annualized Straight Line Rent Straight line rent which is annualized and calculated using most recent available lease terms as of the period end indicated Cap Rate Capitalization rate is a rate of return on a real estate investment property based on the expected, annualized straight lined rental income that the property will generate under its existing lease or leases during its first year of ownership Capitalization rate is calculated by dividing the annualized straight lined rental income the property will generate (before debt service and depreciation and after fixed costs and variable costs) by the purchase price of the property, excluding acquisition costs Weighted average cap rates are based on square feet unless otherwise indicated Cash Cap Rate For acquisitions, cash cap rate is a rate of return on a real estate investment property based on the expected, annualized cash rental income during the first year of ownership that the property will generate under its existing lease or leases For dispositions, cash cap rate is a rate of return based on the annualized cash rental income of the property to be sold For acquisitions, cash cap rate is calculated by dividing this annualized cash rental income the property will generate (before debt service and depreciation and after fixed costs and variable costs) by the purchase price of the property, excluding acquisition costs For dispositions, cash cap rate is calculated by dividing the annualized cash rental income by the contract sales price for the property, excluding acquisition costs Weighted average cash cap rates are based on square feet unless otherwise indicated Cash NOI We define Cash NOI as NOI excluding amortization of above/below market lease intangibles and straight line adjustments that are included in GAAP lease revenues Cash Rent Represents total of all contractual rents on a cash basis due from tenants as stipulated in the originally executed lease agreements at inception or any lease amendments thereafter prior to a Deferral Agreement or rent credit (see slide 7 for further information)information)..“Original Cash Rent” refers to contractual rents on a cash basis due from tenants as stipulated in their originally executed lease agreement at inception or as amended, prior to any rent deferral agreement We calculate “Original Cash Rent collections” by comparing the total amount of rent collected during the period to the original Cash Rent due Total rent collected during the period includes both original Cash Rent due and payments made by tenants pursuant to rent deferral agreements See slide 7 for further information on the impact of eliminating deferred rent paid of original Cash Rent rates Executed Occupancy Includes Occupancy as defined below as of a particular date as well as all leases fully executed by both parties as of the same date where the tenant has yet to take possession as of such date For Q 2 21 and as of July 31 2021 there are ten additional leases executed where rent commences over time between the third quarter of 2021 and the first quarter of 2022 totaling approximately 102 000 square feet For Q 4 20 and as of January 31 2021 there were four additional leases executed where rent commences over time between the first quarter of 2021 and the third quarter of 2021 totaling approximately 34 000 square feet Experiential Retail We define Experiential Retail as multi tenant properties leased to tenants in the restaurant, discount retail, entertainment, salon/beauty, and grocery sectors, among others We also refer to Experiential Retail as e commerce defensive retail FFO We define FFO, a non GAAP measure, consistent with the standards established over time by the Board of Governors of NAREIT, as restated in a White Paper and approved by the Board of Governors of NAREIT effective in December 2018 (the "White Paper") The White Paper defines FFO as net income or loss computed in accordance with GAAP excluding depreciation and amortization related to real estate, gains and losses from sales of certain real estate assets, gain and losses from change in control and impairment write downs of certain real estate assets and investments in entities when the impairment is directly attributable to decreases in the value of depreciable real estate held by the entity Adjustments for unconsolidated partnerships and joint ventures are calculated to exclude the proportionate share of the non controlling interest to arrive at FFO attributable to stockholders Our FFO calculation complies with NAREIT's definition
American Finance Trust, Inc. 25 DEFINITIONS (CONTINUED) GAAP Accounting principles generally accepted in the United States of America Gross Asset Value Total gross asset value of 4 4 billion, comprised of total assets of 3 7 billion plus accumulated depreciation and amortization of 0 7 b illion as of June 30 2021 Investment Grade As used herein, investment grade includes both actual investment grade ratings of the tenant or guarantor, if available, or implied investment grade Implied investment grade may include actual ratings of tenant parent, guarantor parent (regardless of whether or not the parent has guaranteed the tenant’s obligation under the lease) or by using a proprietary Moody’s analytical tool, which generates an implied rating by measuring a company’s probability of default The term “ for these purposes includes any entity, including any governmental entity, owning more than 50 of the voting stock in a tenant Ratings information is as of June 30 2021 Single tenant portfolio tenants are 50 actual investment grade rated and 11 implied investment grade rated See the Definition of Occupancy for a full description of events following the reporting period Leasing Pipeline : Leasing pipeline for Q2’21 i ) all leases fully executed by both parties as of July 31, 2021, but after June 30, 2021 and (ii) all leases under negotiation with an executed LOI by both parties as of July 31, 2021. This represents three executed leases totaling approximately 24,000 square feet and nine LOIs totaling 48,000 squar e f eet. No lease terminations occurred during this period. Leasing pipeline for Q4’20 includes ( i ) all leases fully executed by both parties as of January 31, 2021, but after December 31, 2020 and (ii) all leases under negotiation with an executed LOI by both parties as of January 31, 2021. This represents six new leases totaling approximately 220,000 square feet, net of one lease termination for 5,000 square feet during this per iod . There can be no assurance that LOIs will lead to definitive leases that will commence on their current terms, or at all. Leasing pipeline should not be considered an indication of future performance. Liquidity: As of June 30, 2021, the Company had $137.1 million in cash and cash equivalents, and $252.6 million available for future bor row ings under the Company's credit facility. LOI: Means a non binding letter of intent. Necessity Based AFIN definition of Necessity Based includes properties leased to Service Retail and/or Experiential Retail tenants Net Debt For Q 2 2021 represents total debt of 1 8 billion less cash and cash equivalents of 137 1 million as of June 30 2021 For Q 1 2021 represents total debt of 1 8 billion less cash and cash equivalents of 84 2 million as of March 31 2021 For Q 4 2020 represents total debt of 1 8 billion less cash and cash equivalents of 102 9 million as of December 31 2020 For Q 3 2020 represents total debt of 1 8 billion less cash and cash equivalents of 86 3 million as of September 30 2020 For Q 2 2020 represents total debt of 1 8 billion less cash and cash equivalents of 137 million as of June 30 2020 Net Debt Adjusted EBITDA Represents ratio of net debt as of a particular date, to the Company’s calculation of its adjusted earnings before interest, tax, depreciation and amortization (“ multiplied by four for the three months ended on that date NOI Defined as a non GAAP financial measure used by us to evaluate the operating performance of our real estate NOI is equal to total revenues, excluding contingent purchase price consideration, less property operating and maintenance expense NOI excludes all other items of expense and income included in the financial statements in calculating net ( Occupancy Represents percentage of square footage of which the tenant has taken possession of divided by the respective total rentable square feet as of the date or period end indicated At the beginning of the third quarter of 2021 United Healthcare Services, Inc ..’s lease expired and was not renewed, representing 400 000 square feet and 5 3 million of annualized straight line rent AFIN is working on various alternatives while actively marketing the property for a potential lease up or disposition Giving effect to this lease expiration, Occupancy as of June 30 2021 would have been 93 our top 20 tenants would have been 67 actual or implied Investment Grade, percentage of single tenant leases expiring in 2021 would be 0 and the percentage of single tenant leases expiring after 2025 would be 63 PSA Means a definitive purchase and sale agreement Remaining Lease Term Represents the outstanding tenant lease term Weighted based on annualized straight line rent as of the date or period end indicated Rent Escalators Represents contractual increases of base rent Contractual rent increases include fixed percent or actual increases, or CPI indexed increases Annual averages are weighted based on annualized straight line rent as of June 30 2021 Service Retail AFIN’s definition of Service Retail includes single tenant retail properties leased to tenants in the retail banking, restaurant, grocery, pharmacy, gas/convenience, fitness, healthcare, and auto services sectors Traditional Retail AFIN definition of Traditional Retail includes single tenant retail properties leased to tenants in the discount retail, home improvement, furniture, specialty retail, auto retail, sporting goods sectors, wireless/electronics, department stores, and home improvement
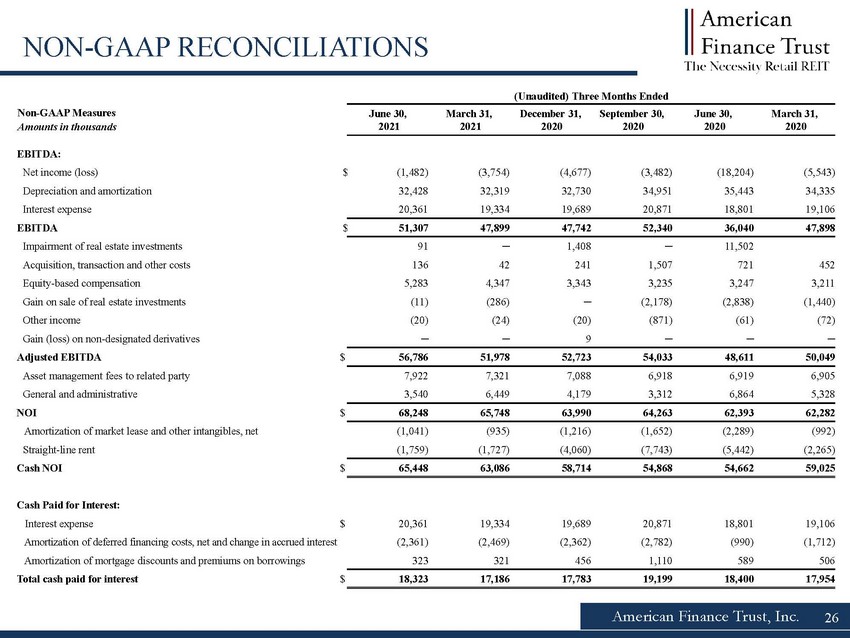
(Unaudited) Three Months Ended June 30, 2021 March 31, 2021 December 31, 2020 September 30, 2020 June 30, 2020 March 31, 2020 EBITDA: Net income (loss) $ (1,482) (3,754) (4,677) (3,482) (18,204) (5,543) Depreciation and amortization 32,428 32,319 32,730 34,951 35,443 34,335 Interest expense 20,361 19,334 19,689 20,871 18,801 19,106 EBITDA $ 51,307 47,899 47,742 52,340 36,040 47,898 Impairment of real estate investments 91 ─ 1,408 ─ 11,502 Acquisition, transaction and other costs 136 42 241 1,507 721 452 Equity based compensation 5,283 4,347 3,343 3,235 3,247 3,211 Gain on sale of real estate investments (11) (286) ─ (2,178) (2,838) (1,440) Other income (20) (24) (20) (871) (61) (72) Gain (loss) on non designated derivatives ─ ─ 9 ─ ─ ─ Adjusted EBITDA $ 56,786 51,978 52,723 54,033 48,611 50,049 Asset management fees to related party 7,922 7,321 7,088 6,918 6,919 6,905 General and administrative 3,540 6,449 4,179 3,312 6,864 5,328 NOI $ 68,248 65,748 63,990 64,263 62,393 62,282 Amortization of market lease and other intangibles, net (1,041) (935) (1,216) (1,652) (2,289) (992) Straight line rent (1,759) (1,727) (4,060) (7,743) (5,442) (2,265) Cash NOI $ 65,448 63,086 58,714 54,868 54,662 59,025 Cash Paid for Interest: Interest expense $ 20,361 19,334 19,689 20,871 18,801 19,106 Amortization of deferred financing costs, net and change in accrued interest (2,361) (2,469) (2,362) (2,782) (990) (1,712) Amortization of mortgage discounts and premiums on borrowings 323 321 456 1,110 589 506 Total cash paid for interest $ 18,323 17,186 17,783 19,199 18,400 17,954 American Finance Trust, Inc. 26 NON GAAP RECONCILIATIONS Non GAAP Measures Amounts in thousands
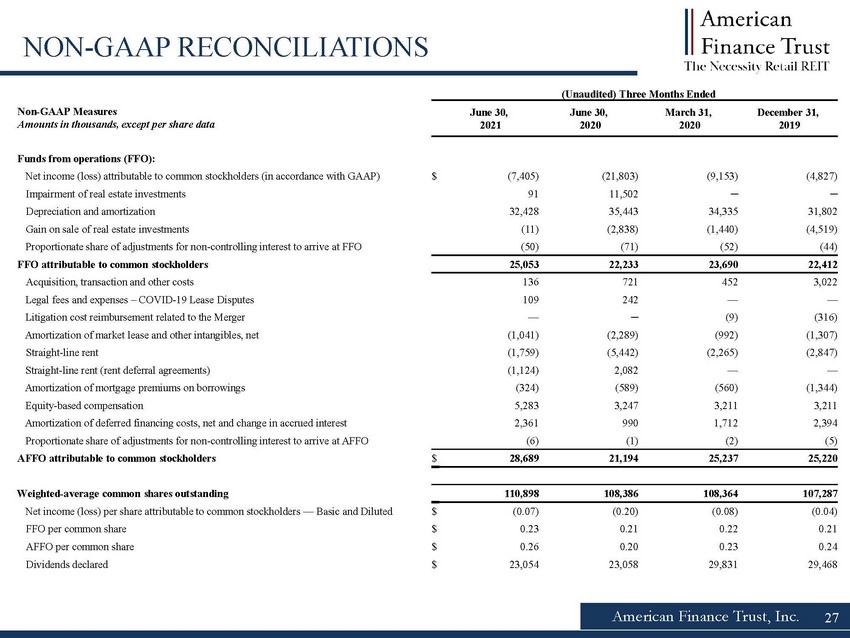
(Unaudited) Three Months Ended June 30, 2021 June 30, 2020 March 31, 2020 December 31, 2019 Funds from operations (FFO): Net income (loss) attributable to common stockholders (in accordance with GAAP) $ (7,405) (21,803) (9,153) (4,827) Impairment of real estate investments 91 11,502 ─ ─ Depreciation and amortization 32,428 35,443 34,335 31,802 Gain on sale of real estate investments (11) (2,838) (1,440) (4,519) Proportionate share of adjustments for non controlling interest to arrive at FFO (50) (71) (52) (44) FFO attributable to common stockholders 25,053 22,233 23,690 22,412 Acquisition, transaction and other costs 136 721 452 3,022 Legal fees and expenses COVID 19 Lease Disputes 109 242 — — Litigation cost reimbursement related to the Merger — ─ (9) (316) Amortization of market lease and other intangibles, net (1,041) (2,289) (992) (1,307) Straight line rent (1,759) (5,442) (2,265) (2,847) Straight line rent (rent deferral agreements) (1,124) 2,082 — — Amortization of mortgage premiums on borrowings (324) (589) (560) (1,344) Equity based compensation 5,283 3,247 3,211 3,211 Amortization of deferred financing costs, net and change in accrued interest 2,361 990 1,712 2,394 Proportionate share of adjustments for non controlling interest to arrive at AFFO (6) (1) (2) (5) AFFO attributable to common stockholders $ 28,689 21,194 25,237 25,220 Weighted average common shares outstanding 110,898 108,386 108,364 107,287 Net income (loss) per share attributable to common stockholders Basic and Diluted $ (0.07) (0.20) (0.08) (0.04) FFO per common share $ 0.23 0.21 0.22 0.21 AFFO per common share $ 0.26 0.20 0.23 0.24 Dividends declared $ 23,054 23,058 29,831 29,468 American Finance Trust, Inc. 27 NON GAAP RECONCILIATIONS Non GAAP Measures Amounts in thousands, except per share data