Attached files
| file | filename |
|---|---|
| EX-99.1 - EX-99.1 - AMERICAN FINANCIAL GROUP INC | d161413dex991.htm |
| 8-K - 8-K - AMERICAN FINANCIAL GROUP INC | d161413d8k.htm |
Exhibit 99.2 American Financial Group, Inc. Investor Supplement - Second Quarter 2021 August 3, 2021 American Financial Group, Inc. Corporate Headquarters Great American Insurance Group Tower 301 E Fourth Street Cincinnati, OH 45202 513 579 6739Exhibit 99.2 American Financial Group, Inc. Investor Supplement - Second Quarter 2021 August 3, 2021 American Financial Group, Inc. Corporate Headquarters Great American Insurance Group Tower 301 E Fourth Street Cincinnati, OH 45202 513 579 6739
American Financial Group, Inc. Table of Contents - Investor Supplement - Second Quarter 2021 Section Page Table of Contents - Investor Supplement - Second Quarter 2021...........................................................................................................................2 ........................................................................................................................................................................................................................................................................................................................................................................................................................................... Financial Highlights..................................................................................................................................................................................................3 .................................................................................................................................................................................................................................................................................................................................................................... Summary of Earnings..............................................................................................................................................................................................4 ........................................................................................................................................................................................................................................................................................................................................................................ Earnings Per Share Summary.................................................................................................................................................................................5 ..................................................................................................................................................................................................................................................................................................................................................................................... Property and Casualty Insurance Segment Property and Casualty Insurance - Summary Underwriting Results (GAAP)...........................................................................................................6 ........................................................................................................................................................................................................................................................................................................................................................................................................................................................... Specialty - Underwriting Results (GAAP).................................................................................................................................................................7 ..................................................................................................................................................................................................................................................................................................................................................................................................... Property and Transportation - Underwriting Results (GAAP)..................................................................................................................................8 .................................................................................................................................................................................................................................................................................................................................................................................................................................... Specialty Casualty - Underwriting Results (GAAP)..................................................................................................................................................9 .................................................................................................................................................................................................................................................................................................................................................................................................................... Specialty Financial - Underwriting Results (GAAP)................................................................................................................................................1 ..0 .................................................................................................................................................................................................................................................................................................................................................................................................................... Other Specialty - Underwriting Results (GAAP)......................................................................................................................................................1 ..1 .............................................................................................................................................................................................................................................................................................................................................................................................................. Annuity Segment Discontinued Annuity Operations............................................................................................................................................................................1 ..2 ........................................................................................................................................................................................................................................................................................................................................................................................ Consolidated Balance Sheet / Book Value / Debt Consolidated Balance Sheet...................................................................................................................................................................................1 ..3 ..................................................................... Book Value Per Share and Price / Book Summary.................................................................................................................................................1 ..4 ....................................................................................................... Capitalization..........................................................................................................................................................................................................1 ..5 .............................................. Additional Supplemental Information......................................................................................................................................................................1 ..6 .................................................................................. Consolidated Investment Supplement Total Cash and Investments...................................................................................................................................................................................1 ..7 ....................................................................................................................... Net Investment Income From Continuing Operations.............................................................................................................................................1 ..8 ............................................................................................................................................................. Alternative Investments - Continuing Operations....................................................................................................................................................1 ..9 ...................................................................................................................................................... Fixed Maturities - By Security Type - AFG Consolidated........................................................................................................................................2 ..0 .................................................................................................................................................................. Appendix A. Fixed Maturities by Credit Rating & NAIC Designation by Type 6/30/2021.......................................................................................................2 ..1 ................................................................................................................................................................................................... B. Fixed Maturities by Credit Rating & NAIC Designation by Type 12/31/2020.....................................................................................................2 ..2 ..................................................................................................................................................................................................... C. Corporate Securities by Credit Rating & NAIC Designation by Industry 6/30/2021..........................................................................................2 ..3 .............................................................................................................................................................................................................. D. Corporate Securities by Credit Rating & NAIC Designation by Industry 12/31/2020........................................................................................2 ..4 .................................................................................................................................................................................................................. E. Asset-Backed Securities by Credit Rating & NAIC Designation by Collateral Type 6/30/2021.........................................................................2 ..5 ................................................................................................................................................................................................................................. F. Asset-Backed Securities by Credit Rating & NAIC Designation by Collateral Type 12/31/2020.......................................................................2 ..6 ................................................................................................................................................................................................................................... G. Real Estate-Related Investments 6/30/2021.....................................................................................................................................................2 ..7 ..................................................................................................................................................... H. Real Estate-Related Investments 12/31/2020...................................................................................................................................................2 ..8 ....................................................................................................................................................... Page 2American Financial Group, Inc. Table of Contents - Investor Supplement - Second Quarter 2021 Section Page Table of Contents - Investor Supplement - Second Quarter 2021...........................................................................................................................2 ........................................................................................................................................................................................................................................................................................................................................................................................................................................... Financial Highlights..................................................................................................................................................................................................3 .................................................................................................................................................................................................................................................................................................................................................................... Summary of Earnings..............................................................................................................................................................................................4 ........................................................................................................................................................................................................................................................................................................................................................................ Earnings Per Share Summary.................................................................................................................................................................................5 ..................................................................................................................................................................................................................................................................................................................................................................................... Property and Casualty Insurance Segment Property and Casualty Insurance - Summary Underwriting Results (GAAP)...........................................................................................................6 ........................................................................................................................................................................................................................................................................................................................................................................................................................................................... Specialty - Underwriting Results (GAAP).................................................................................................................................................................7 ..................................................................................................................................................................................................................................................................................................................................................................................................... Property and Transportation - Underwriting Results (GAAP)..................................................................................................................................8 .................................................................................................................................................................................................................................................................................................................................................................................................................................... Specialty Casualty - Underwriting Results (GAAP)..................................................................................................................................................9 .................................................................................................................................................................................................................................................................................................................................................................................................................... Specialty Financial - Underwriting Results (GAAP)................................................................................................................................................1 ..0 .................................................................................................................................................................................................................................................................................................................................................................................................................... Other Specialty - Underwriting Results (GAAP)......................................................................................................................................................1 ..1 .............................................................................................................................................................................................................................................................................................................................................................................................................. Annuity Segment Discontinued Annuity Operations............................................................................................................................................................................1 ..2 ........................................................................................................................................................................................................................................................................................................................................................................................ Consolidated Balance Sheet / Book Value / Debt Consolidated Balance Sheet...................................................................................................................................................................................1 ..3 ..................................................................... Book Value Per Share and Price / Book Summary.................................................................................................................................................1 ..4 ....................................................................................................... Capitalization..........................................................................................................................................................................................................1 ..5 .............................................. Additional Supplemental Information......................................................................................................................................................................1 ..6 .................................................................................. Consolidated Investment Supplement Total Cash and Investments...................................................................................................................................................................................1 ..7 ....................................................................................................................... Net Investment Income From Continuing Operations.............................................................................................................................................1 ..8 ............................................................................................................................................................. Alternative Investments - Continuing Operations....................................................................................................................................................1 ..9 ...................................................................................................................................................... Fixed Maturities - By Security Type - AFG Consolidated........................................................................................................................................2 ..0 .................................................................................................................................................................. Appendix A. Fixed Maturities by Credit Rating & NAIC Designation by Type 6/30/2021.......................................................................................................2 ..1 ................................................................................................................................................................................................... B. Fixed Maturities by Credit Rating & NAIC Designation by Type 12/31/2020.....................................................................................................2 ..2 ..................................................................................................................................................................................................... C. Corporate Securities by Credit Rating & NAIC Designation by Industry 6/30/2021..........................................................................................2 ..3 .............................................................................................................................................................................................................. D. Corporate Securities by Credit Rating & NAIC Designation by Industry 12/31/2020........................................................................................2 ..4 .................................................................................................................................................................................................................. E. Asset-Backed Securities by Credit Rating & NAIC Designation by Collateral Type 6/30/2021.........................................................................2 ..5 ................................................................................................................................................................................................................................. F. Asset-Backed Securities by Credit Rating & NAIC Designation by Collateral Type 12/31/2020.......................................................................2 ..6 ................................................................................................................................................................................................................................... G. Real Estate-Related Investments 6/30/2021.....................................................................................................................................................2 ..7 ..................................................................................................................................................... H. Real Estate-Related Investments 12/31/2020...................................................................................................................................................2 ..8 ....................................................................................................................................................... Page 2
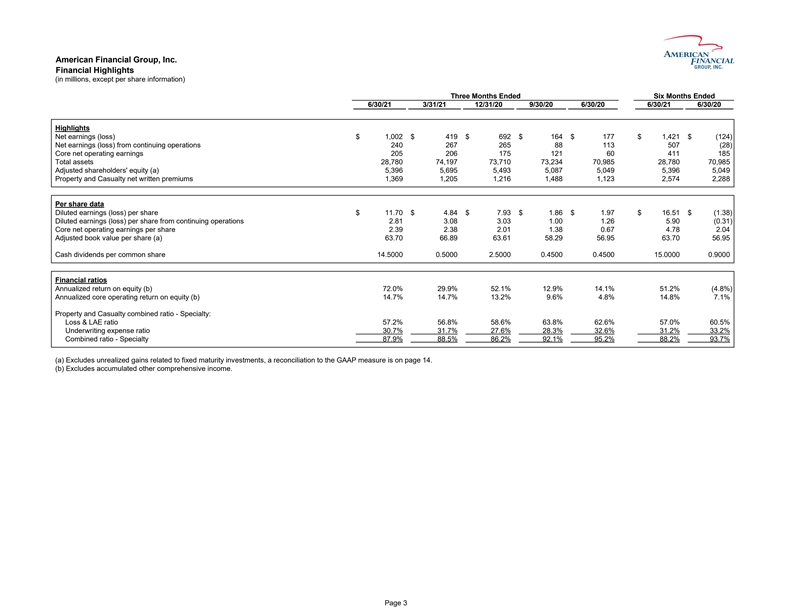
American Financial Group, Inc. Financial Highlights (in millions, except per share information) Three Months Ended Six Months Ended 6/30/21 3/31/21 12/31/20 9/30/20 6/30/20 6/30/21 6/30/20 Highlights Net earnings (loss) $ 1,002 $ 419 $ 692 $ 164 $ 177 $ 1,421 $ (124) Net earnings (loss) from continuing operations 240 267 265 88 113 5 07 (28) Core net operating earnings 205 206 175 121 60 4 11 1 85 Total assets 28,780 74,197 73,710 73,234 70,985 28,780 70,985 Adjusted shareholders' equity (a) 5,396 5,695 5,493 5,087 5,049 5,396 5,049 Property and Casualty net written premiums 1,369 1,205 1,216 1,488 1,123 2,574 2,288 Per share data Diluted earnings (loss) per share $ 11.70 $ 4.84 $ 7.93 $ 1.86 $ 1.97 $ 16.51 $ (1.38) Diluted earnings (loss) per share from continuing operations 2.81 3.08 3.03 1.00 1.26 5 .90 (0.31) Core net operating earnings per share 2.39 2.38 2.01 1.38 0.67 4 .78 2 .04 Adjusted book value per share (a) 63.70 66.89 63.61 58.29 56.95 63.70 56.95 Cash dividends per common share 14.5000 0.5000 2.5000 0.4500 0.4500 15.0000 0.9000 Financial ratios Annualized return on equity (b) 72.0% 2 9.9% 52.1% 12.9% 14.1% 51.2% (4.8%) Annualized core operating return on equity (b) 14.7% 1 4.7% 13.2% 9.6% 4.8% 14.8% 7.1% Property and Casualty combined ratio - Specialty: Loss & LAE ratio 57.2% 5 6.8% 58.6% 63.8% 62.6% 57.0% 60.5% Underwriting expense ratio 30.7% 31.7% 27.6% 28.3% 32.6% 31.2% 33.2% Combined ratio - Specialty 87.9% 8 8.5% 86.2% 92.1% 95.2% 88.2% 93.7% (a) Excludes unrealized gains related to fixed maturity investments, a reconciliation to the GAAP measure is on page 14. (b) Excludes accumulated other comprehensive income. Page 3American Financial Group, Inc. Financial Highlights (in millions, except per share information) Three Months Ended Six Months Ended 6/30/21 3/31/21 12/31/20 9/30/20 6/30/20 6/30/21 6/30/20 Highlights Net earnings (loss) $ 1,002 $ 419 $ 692 $ 164 $ 177 $ 1,421 $ (124) Net earnings (loss) from continuing operations 240 267 265 88 113 5 07 (28) Core net operating earnings 205 206 175 121 60 4 11 1 85 Total assets 28,780 74,197 73,710 73,234 70,985 28,780 70,985 Adjusted shareholders' equity (a) 5,396 5,695 5,493 5,087 5,049 5,396 5,049 Property and Casualty net written premiums 1,369 1,205 1,216 1,488 1,123 2,574 2,288 Per share data Diluted earnings (loss) per share $ 11.70 $ 4.84 $ 7.93 $ 1.86 $ 1.97 $ 16.51 $ (1.38) Diluted earnings (loss) per share from continuing operations 2.81 3.08 3.03 1.00 1.26 5 .90 (0.31) Core net operating earnings per share 2.39 2.38 2.01 1.38 0.67 4 .78 2 .04 Adjusted book value per share (a) 63.70 66.89 63.61 58.29 56.95 63.70 56.95 Cash dividends per common share 14.5000 0.5000 2.5000 0.4500 0.4500 15.0000 0.9000 Financial ratios Annualized return on equity (b) 72.0% 2 9.9% 52.1% 12.9% 14.1% 51.2% (4.8%) Annualized core operating return on equity (b) 14.7% 1 4.7% 13.2% 9.6% 4.8% 14.8% 7.1% Property and Casualty combined ratio - Specialty: Loss & LAE ratio 57.2% 5 6.8% 58.6% 63.8% 62.6% 57.0% 60.5% Underwriting expense ratio 30.7% 31.7% 27.6% 28.3% 32.6% 31.2% 33.2% Combined ratio - Specialty 87.9% 8 8.5% 86.2% 92.1% 95.2% 88.2% 93.7% (a) Excludes unrealized gains related to fixed maturity investments, a reconciliation to the GAAP measure is on page 14. (b) Excludes accumulated other comprehensive income. Page 3
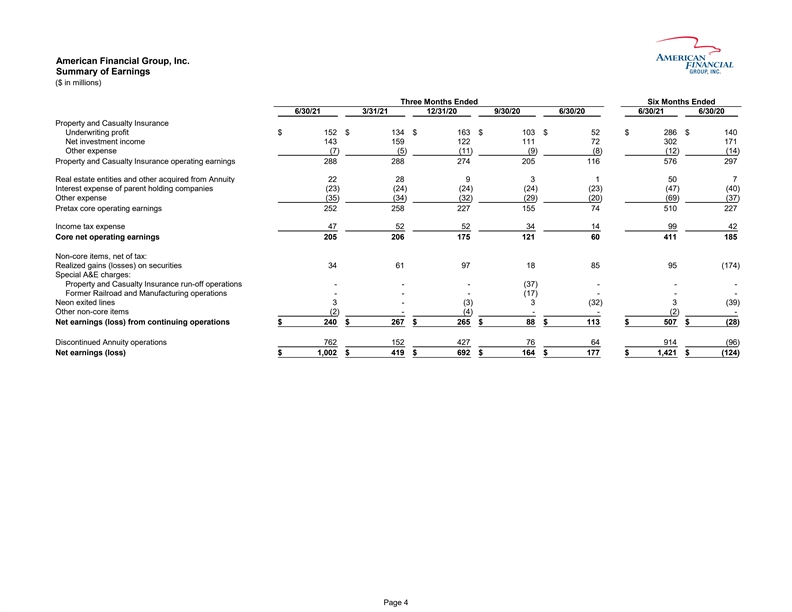
American Financial Group, Inc. Summary of Earnings ($ in millions) Three Months Ended Six Months Ended 6/30/21 3/31/21 12/31/20 9/30/20 6/30/20 6/30/21 6/30/20 Property and Casualty Insurance Underwriting profit $ 152 $ 134 $ 163 $ 103 $ 52 $ 286 $ 140 Net investment income 143 159 122 111 72 302 171 Other expense (7) (5) (11) ( 9) ( 8) ( 12) ( 14) Property and Casualty Insurance operating earnings 288 288 274 205 116 576 297 Real estate entities and other acquired from Annuity 22 28 9 3 1 50 7 Interest expense of parent holding companies (23) (24) (24) ( 24) ( 23) ( 47) ( 40) Other expense (35) (34) (32) ( 29) ( 20) ( 69) ( 37) Pretax core operating earnings 252 258 227 155 74 510 227 Income tax expense 47 52 52 34 14 99 42 Core net operating earnings 205 206 175 121 60 411 185 Non-core items, net of tax: Realized gains (losses) on securities 34 61 97 18 85 95 ( 174) Special A&E charges: Property and Casualty Insurance run-off operations - - - ( 37) - - - Former Railroad and Manufacturing operations - - - ( 17) - - - Neon exited lines 3 - (3) 3 ( 32) 3 ( 39) Other non-core items (2) - (4) - - ( 2) - Net earnings (loss) from continuing operations $ 240 $ 267 $ 265 $ 88 $ 113 $ 507 $ ( 28) Discontinued Annuity operations 762 152 427 76 64 914 ( 96) Net earnings (loss) $ 1,002 $ 419 $ 692 $ 164 $ 177 $ 1,421 $ ( 124) Page 4American Financial Group, Inc. Summary of Earnings ($ in millions) Three Months Ended Six Months Ended 6/30/21 3/31/21 12/31/20 9/30/20 6/30/20 6/30/21 6/30/20 Property and Casualty Insurance Underwriting profit $ 152 $ 134 $ 163 $ 103 $ 52 $ 286 $ 140 Net investment income 143 159 122 111 72 302 171 Other expense (7) (5) (11) ( 9) ( 8) ( 12) ( 14) Property and Casualty Insurance operating earnings 288 288 274 205 116 576 297 Real estate entities and other acquired from Annuity 22 28 9 3 1 50 7 Interest expense of parent holding companies (23) (24) (24) ( 24) ( 23) ( 47) ( 40) Other expense (35) (34) (32) ( 29) ( 20) ( 69) ( 37) Pretax core operating earnings 252 258 227 155 74 510 227 Income tax expense 47 52 52 34 14 99 42 Core net operating earnings 205 206 175 121 60 411 185 Non-core items, net of tax: Realized gains (losses) on securities 34 61 97 18 85 95 ( 174) Special A&E charges: Property and Casualty Insurance run-off operations - - - ( 37) - - - Former Railroad and Manufacturing operations - - - ( 17) - - - Neon exited lines 3 - (3) 3 ( 32) 3 ( 39) Other non-core items (2) - (4) - - ( 2) - Net earnings (loss) from continuing operations $ 240 $ 267 $ 265 $ 88 $ 113 $ 507 $ ( 28) Discontinued Annuity operations 762 152 427 76 64 914 ( 96) Net earnings (loss) $ 1,002 $ 419 $ 692 $ 164 $ 177 $ 1,421 $ ( 124) Page 4
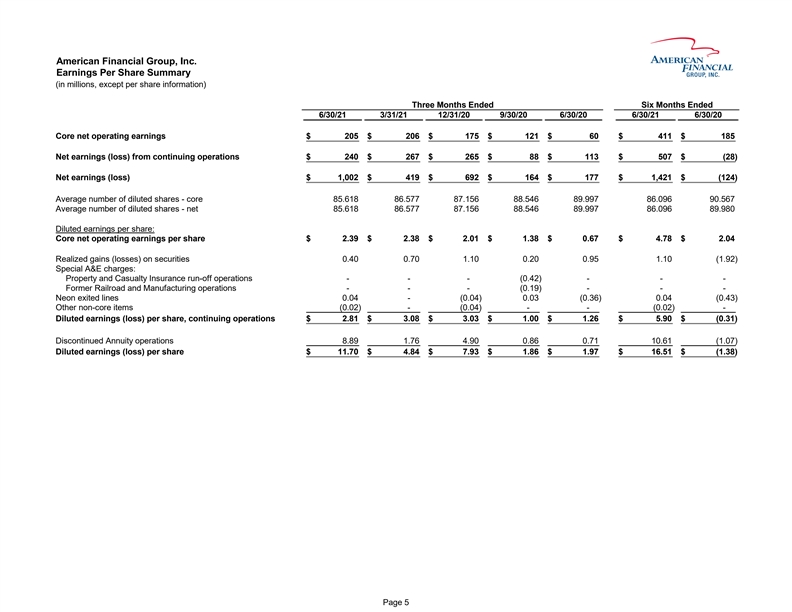
American Financial Group, Inc. Earnings Per Share Summary (in millions, except per share information) Three Months Ended Six Months Ended 6/30/21 3/31/21 12/31/20 9/30/20 6/30/20 6/30/21 6/30/20 Core net operating earnings $ 2 05 $ 2 06 $ 175 $ 121 $ 60 $ 411 $ 185 Net earnings (loss) from continuing operations $ 2 40 $ 2 67 $ 265 $ 88 $ 113 $ 507 $ (28) Net earnings (loss) $ 1 ,002 $ 4 19 $ 692 $ 164 $ 177 $ 1,421 $ (124) Average number of diluted shares - core 8 5.618 8 6.577 87.156 88.546 89.997 86.096 90.567 Average number of diluted shares - net 8 5.618 8 6.577 87.156 88.546 89.997 86.096 89.980 Diluted earnings per share: Core net operating earnings per share $ 2 .39 $ 2 .38 $ 2.01 $ 1.38 $ 0.67 $ 4.78 $ 2.04 Realized gains (losses) on securities 0 .40 0 .70 1.10 0.20 0.95 1.10 (1.92) Special A&E charges: Property and Casualty Insurance run-off operations - - - (0.42) - - - Former Railroad and Manufacturing operations - - - (0.19) - - - Neon exited lines 0 .04 - ( 0.04) 0.03 (0.36) 0.04 (0.43) Other non-core items (0.02) - ( 0.04) - - (0.02) - Diluted earnings (loss) per share, continuing operations $ 2 .81 $ 3 .08 $ 3.03 $ 1.00 $ 1.26 $ 5.90 $ (0.31) Discontinued Annuity operations 8 .89 1 .76 4.90 0.86 0.71 10.61 (1.07) Diluted earnings (loss) per share $ 1 1.70 $ 4 .84 $ 7.93 $ 1.86 $ 1.97 $ 16.51 $ (1.38) Page 5American Financial Group, Inc. Earnings Per Share Summary (in millions, except per share information) Three Months Ended Six Months Ended 6/30/21 3/31/21 12/31/20 9/30/20 6/30/20 6/30/21 6/30/20 Core net operating earnings $ 2 05 $ 2 06 $ 175 $ 121 $ 60 $ 411 $ 185 Net earnings (loss) from continuing operations $ 2 40 $ 2 67 $ 265 $ 88 $ 113 $ 507 $ (28) Net earnings (loss) $ 1 ,002 $ 4 19 $ 692 $ 164 $ 177 $ 1,421 $ (124) Average number of diluted shares - core 8 5.618 8 6.577 87.156 88.546 89.997 86.096 90.567 Average number of diluted shares - net 8 5.618 8 6.577 87.156 88.546 89.997 86.096 89.980 Diluted earnings per share: Core net operating earnings per share $ 2 .39 $ 2 .38 $ 2.01 $ 1.38 $ 0.67 $ 4.78 $ 2.04 Realized gains (losses) on securities 0 .40 0 .70 1.10 0.20 0.95 1.10 (1.92) Special A&E charges: Property and Casualty Insurance run-off operations - - - (0.42) - - - Former Railroad and Manufacturing operations - - - (0.19) - - - Neon exited lines 0 .04 - ( 0.04) 0.03 (0.36) 0.04 (0.43) Other non-core items (0.02) - ( 0.04) - - (0.02) - Diluted earnings (loss) per share, continuing operations $ 2 .81 $ 3 .08 $ 3.03 $ 1.00 $ 1.26 $ 5.90 $ (0.31) Discontinued Annuity operations 8 .89 1 .76 4.90 0.86 0.71 10.61 (1.07) Diluted earnings (loss) per share $ 1 1.70 $ 4 .84 $ 7.93 $ 1.86 $ 1.97 $ 16.51 $ (1.38) Page 5
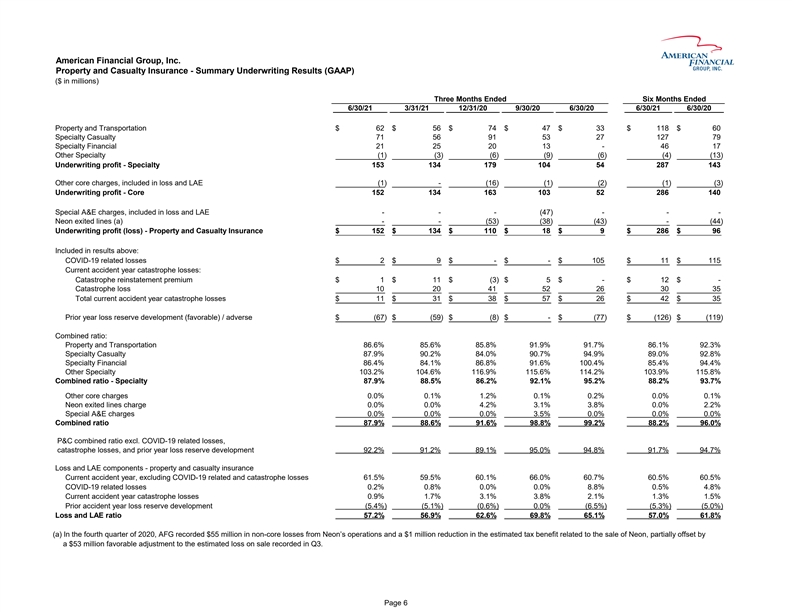
American Financial Group, Inc. Property and Casualty Insurance - Summary Underwriting Results (GAAP) ($ in millions) Three Months Ended Six Months Ended 6/30/21 3/31/21 12/31/20 9/30/20 6/30/20 6/30/21 6/30/20 Property and Transportation $ 6 2 $ 5 6 $ 74 $ 47 $ 33 $ 118 $ 60 Specialty Casualty 7 1 5 6 91 53 27 127 79 Specialty Financial 2 1 2 5 20 13 - 46 17 Other Specialty (1) (3) (6) (9) (6) (4) (13) Underwriting profit - Specialty 1 53 1 34 179 104 54 287 143 Other core charges, included in loss and LAE (1) - (16) (1) (2) (1) (3) Underwriting profit - Core 1 52 1 34 163 103 52 286 140 Special A&E charges, included in loss and LAE - - - (47) - - - Neon exited lines (a) - - (53) (38) (43) - (44) Underwriting profit (loss) - Property and Casualty Insurance $ 1 52 $ 1 34 $ 110 $ 18 $ 9 $ 286 $ 96 Included in results above: COVID-19 related losses $ 2 $ 9 $ - $ - $ 105 $ 11 $ 115 Current accident year catastrophe losses: Catastrophe reinstatement premium $ 1 $ 1 1 $ (3) $ 5 $ - $ 12 $ - Catastrophe loss 1 0 2 0 41 52 26 30 35 Total current accident year catastrophe losses $ 1 1 $ 3 1 $ 38 $ 57 $ 26 $ 42 $ 35 Prior year loss reserve development (favorable) / adverse $ (67) $ (59) $ (8) $ - $ (77) $ (126) $ (119) Combined ratio: Property and Transportation 86.6% 85.6% 85.8% 91.9% 91.7% 86.1% 92.3% Specialty Casualty 87.9% 90.2% 84.0% 90.7% 94.9% 89.0% 92.8% Specialty Financial 86.4% 84.1% 86.8% 91.6% 100.4% 85.4% 94.4% Other Specialty 103.2% 104.6% 116.9% 115.6% 114.2% 103.9% 115.8% Combined ratio - Specialty 8 7.9% 8 8.5% 86.2% 92.1% 95.2% 88.2% 93.7% Other core charges 0.0% 0.1% 1.2% 0.1% 0.2% 0.0% 0.1% Neon exited lines charge 0.0% 0.0% 4.2% 3.1% 3.8% 0.0% 2.2% Special A&E charges 0.0% 0.0% 0.0% 3.5% 0.0% 0.0% 0.0% Combined ratio 8 7.9% 8 8.6% 91.6% 98.8% 99.2% 88.2% 96.0% P&C combined ratio excl. COVID-19 related losses, catastrophe losses, and prior year loss reserve development 92.2% 91.2% 89.1% 95.0% 94.8% 91.7% 94.7% Loss and LAE components - property and casualty insurance Current accident year, excluding COVID-19 related and catastrophe losses 61.5% 59.5% 60.1% 66.0% 60.7% 60.5% 60.5% COVID-19 related losses 0.2% 0.8% 0.0% 0.0% 8.8% 0.5% 4.8% Current accident year catastrophe losses 0.9% 1.7% 3.1% 3.8% 2.1% 1.3% 1.5% Prior accident year loss reserve development (5.4%) (5.1%) ( 0.6%) 0.0% (6.5%) (5.3%) (5.0%) Loss and LAE ratio 5 7.2% 5 6.9% 62.6% 69.8% 65.1% 57.0% 61.8% (a) In the fourth quarter of 2020, AFG recorded $55 million in non-core losses from Neon’s operations and a $1 million reduction in the estimated tax benefit related to the sale of Neon, partially offset by a $53 million favorable adjustment to the estimated loss on sale recorded in Q3. Page 6American Financial Group, Inc. Property and Casualty Insurance - Summary Underwriting Results (GAAP) ($ in millions) Three Months Ended Six Months Ended 6/30/21 3/31/21 12/31/20 9/30/20 6/30/20 6/30/21 6/30/20 Property and Transportation $ 6 2 $ 5 6 $ 74 $ 47 $ 33 $ 118 $ 60 Specialty Casualty 7 1 5 6 91 53 27 127 79 Specialty Financial 2 1 2 5 20 13 - 46 17 Other Specialty (1) (3) (6) (9) (6) (4) (13) Underwriting profit - Specialty 1 53 1 34 179 104 54 287 143 Other core charges, included in loss and LAE (1) - (16) (1) (2) (1) (3) Underwriting profit - Core 1 52 1 34 163 103 52 286 140 Special A&E charges, included in loss and LAE - - - (47) - - - Neon exited lines (a) - - (53) (38) (43) - (44) Underwriting profit (loss) - Property and Casualty Insurance $ 1 52 $ 1 34 $ 110 $ 18 $ 9 $ 286 $ 96 Included in results above: COVID-19 related losses $ 2 $ 9 $ - $ - $ 105 $ 11 $ 115 Current accident year catastrophe losses: Catastrophe reinstatement premium $ 1 $ 1 1 $ (3) $ 5 $ - $ 12 $ - Catastrophe loss 1 0 2 0 41 52 26 30 35 Total current accident year catastrophe losses $ 1 1 $ 3 1 $ 38 $ 57 $ 26 $ 42 $ 35 Prior year loss reserve development (favorable) / adverse $ (67) $ (59) $ (8) $ - $ (77) $ (126) $ (119) Combined ratio: Property and Transportation 86.6% 85.6% 85.8% 91.9% 91.7% 86.1% 92.3% Specialty Casualty 87.9% 90.2% 84.0% 90.7% 94.9% 89.0% 92.8% Specialty Financial 86.4% 84.1% 86.8% 91.6% 100.4% 85.4% 94.4% Other Specialty 103.2% 104.6% 116.9% 115.6% 114.2% 103.9% 115.8% Combined ratio - Specialty 8 7.9% 8 8.5% 86.2% 92.1% 95.2% 88.2% 93.7% Other core charges 0.0% 0.1% 1.2% 0.1% 0.2% 0.0% 0.1% Neon exited lines charge 0.0% 0.0% 4.2% 3.1% 3.8% 0.0% 2.2% Special A&E charges 0.0% 0.0% 0.0% 3.5% 0.0% 0.0% 0.0% Combined ratio 8 7.9% 8 8.6% 91.6% 98.8% 99.2% 88.2% 96.0% P&C combined ratio excl. COVID-19 related losses, catastrophe losses, and prior year loss reserve development 92.2% 91.2% 89.1% 95.0% 94.8% 91.7% 94.7% Loss and LAE components - property and casualty insurance Current accident year, excluding COVID-19 related and catastrophe losses 61.5% 59.5% 60.1% 66.0% 60.7% 60.5% 60.5% COVID-19 related losses 0.2% 0.8% 0.0% 0.0% 8.8% 0.5% 4.8% Current accident year catastrophe losses 0.9% 1.7% 3.1% 3.8% 2.1% 1.3% 1.5% Prior accident year loss reserve development (5.4%) (5.1%) ( 0.6%) 0.0% (6.5%) (5.3%) (5.0%) Loss and LAE ratio 5 7.2% 5 6.9% 62.6% 69.8% 65.1% 57.0% 61.8% (a) In the fourth quarter of 2020, AFG recorded $55 million in non-core losses from Neon’s operations and a $1 million reduction in the estimated tax benefit related to the sale of Neon, partially offset by a $53 million favorable adjustment to the estimated loss on sale recorded in Q3. Page 6
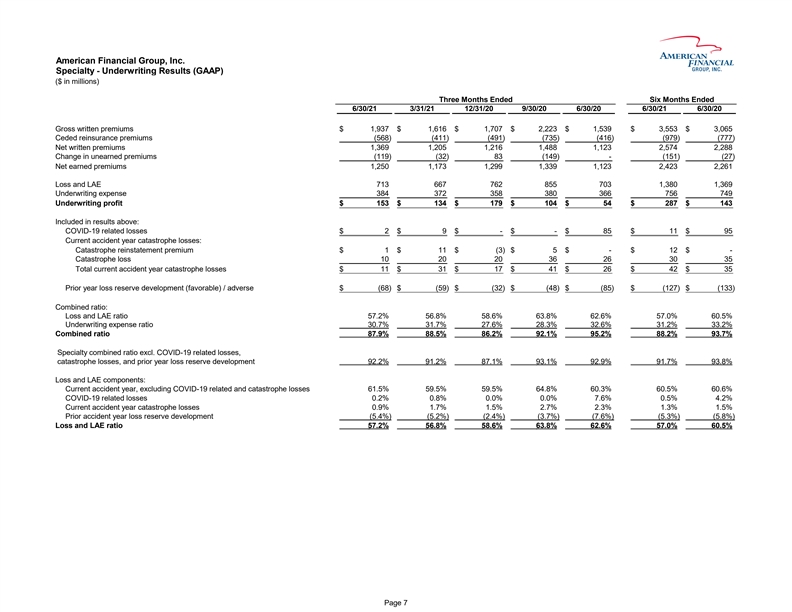
American Financial Group, Inc. Specialty - Underwriting Results (GAAP) ($ in millions) Three Months Ended Six Months Ended 6/30/21 3/31/21 12/31/20 9/30/20 6/30/20 6/30/21 6/30/20 Gross written premiums $ 1,937 $ 1,616 $ 1,707 $ 2,223 $ 1,539 $ 3 ,553 $ 3 ,065 Ceded reinsurance premiums ( 568) ( 411) (491) (735) (416) (979) (777) Net written premiums 1,369 1,205 1,216 1,488 1,123 2 ,574 2 ,288 Change in unearned premiums ( 119) ( 32) 83 (149) - (151) (27) Net earned premiums 1,250 1,173 1,299 1,339 1,123 2 ,423 2 ,261 Loss and LAE 713 667 762 855 703 1 ,380 1 ,369 Underwriting expense 384 372 358 380 366 7 56 7 49 Underwriting profit $ 153 $ 134 $ 179 $ 104 $ 54 $ 2 87 $ 1 43 Included in results above: COVID-19 related losses $ 2 $ 9 $ - $ - $ 85 $ 1 1 $ 9 5 Current accident year catastrophe losses: Catastrophe reinstatement premium $ 1 $ 11 $ (3) $ 5 $ - $ 1 2 $ - Catastrophe loss 10 20 20 36 26 3 0 3 5 Total current accident year catastrophe losses $ 11 $ 31 $ 17 $ 41 $ 26 $ 4 2 $ 3 5 Prior year loss reserve development (favorable) / adverse $ (68) $ (59) $ (32) $ (48) $ (85) $ (127) $ (133) Combined ratio: Loss and LAE ratio 5 7.2% 56.8% 58.6% 63.8% 62.6% 57.0% 60.5% Underwriting expense ratio 3 0.7% 3 1.7% 27.6% 28.3% 32.6% 31.2% 33.2% Combined ratio 8 7.9% 88.5% 86.2% 92.1% 95.2% 88.2% 93.7% Specialty combined ratio excl. COVID-19 related losses, catastrophe losses, and prior year loss reserve development 92.2% 9 1.2% 87.1% 93.1% 92.9% 91.7% 93.8% Loss and LAE components: Current accident year, excluding COVID-19 related and catastrophe losses 61.5% 59.5% 59.5% 64.8% 60.3% 60.5% 60.6% COVID-19 related losses 0.2% 0.8% 0.0% 0.0% 7.6% 0.5% 4.2% Current accident year catastrophe losses 0.9% 1.7% 1.5% 2.7% 2.3% 1.3% 1.5% Prior accident year loss reserve development (5.4%) (5.2%) ( 2.4%) (3.7%) (7.6%) (5.3%) (5.8%) Loss and LAE ratio 57.2% 5 6.8% 58.6% 63.8% 62.6% 57.0% 60.5% Page 7American Financial Group, Inc. Specialty - Underwriting Results (GAAP) ($ in millions) Three Months Ended Six Months Ended 6/30/21 3/31/21 12/31/20 9/30/20 6/30/20 6/30/21 6/30/20 Gross written premiums $ 1,937 $ 1,616 $ 1,707 $ 2,223 $ 1,539 $ 3 ,553 $ 3 ,065 Ceded reinsurance premiums ( 568) ( 411) (491) (735) (416) (979) (777) Net written premiums 1,369 1,205 1,216 1,488 1,123 2 ,574 2 ,288 Change in unearned premiums ( 119) ( 32) 83 (149) - (151) (27) Net earned premiums 1,250 1,173 1,299 1,339 1,123 2 ,423 2 ,261 Loss and LAE 713 667 762 855 703 1 ,380 1 ,369 Underwriting expense 384 372 358 380 366 7 56 7 49 Underwriting profit $ 153 $ 134 $ 179 $ 104 $ 54 $ 2 87 $ 1 43 Included in results above: COVID-19 related losses $ 2 $ 9 $ - $ - $ 85 $ 1 1 $ 9 5 Current accident year catastrophe losses: Catastrophe reinstatement premium $ 1 $ 11 $ (3) $ 5 $ - $ 1 2 $ - Catastrophe loss 10 20 20 36 26 3 0 3 5 Total current accident year catastrophe losses $ 11 $ 31 $ 17 $ 41 $ 26 $ 4 2 $ 3 5 Prior year loss reserve development (favorable) / adverse $ (68) $ (59) $ (32) $ (48) $ (85) $ (127) $ (133) Combined ratio: Loss and LAE ratio 5 7.2% 56.8% 58.6% 63.8% 62.6% 57.0% 60.5% Underwriting expense ratio 3 0.7% 3 1.7% 27.6% 28.3% 32.6% 31.2% 33.2% Combined ratio 8 7.9% 88.5% 86.2% 92.1% 95.2% 88.2% 93.7% Specialty combined ratio excl. COVID-19 related losses, catastrophe losses, and prior year loss reserve development 92.2% 9 1.2% 87.1% 93.1% 92.9% 91.7% 93.8% Loss and LAE components: Current accident year, excluding COVID-19 related and catastrophe losses 61.5% 59.5% 59.5% 64.8% 60.3% 60.5% 60.6% COVID-19 related losses 0.2% 0.8% 0.0% 0.0% 7.6% 0.5% 4.2% Current accident year catastrophe losses 0.9% 1.7% 1.5% 2.7% 2.3% 1.3% 1.5% Prior accident year loss reserve development (5.4%) (5.2%) ( 2.4%) (3.7%) (7.6%) (5.3%) (5.8%) Loss and LAE ratio 57.2% 5 6.8% 58.6% 63.8% 62.6% 57.0% 60.5% Page 7
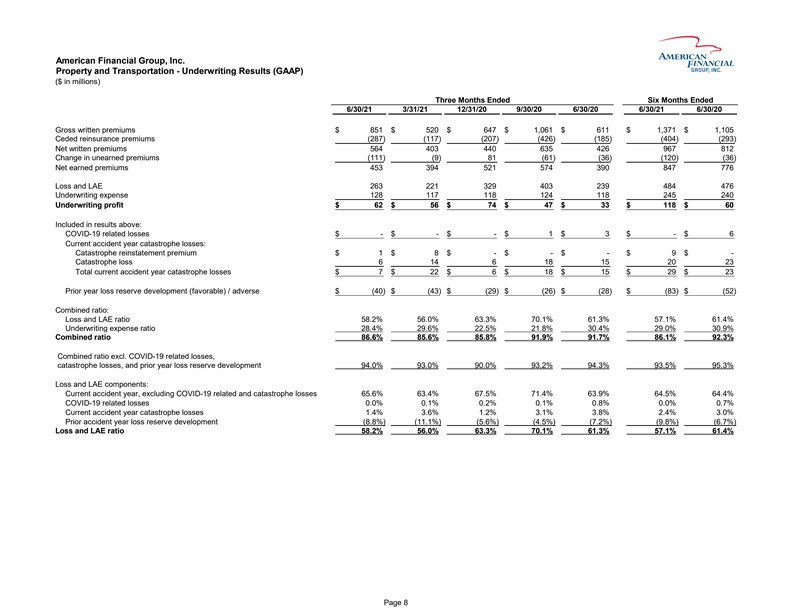
American Financial Group, Inc. Property and Transportation - Underwriting Results (GAAP) ($ in millions) Three Months Ended Six Months Ended 6/30/21 3/31/21 12/31/20 9/30/20 6/30/20 6/30/21 6/30/20 Gross written premiums $ 851 $ 520 $ 647 $ 1,061 $ 611 $ 1,371 $ 1,105 Ceded reinsurance premiums (287) (117) ( 207) (426) (185) ( 404) ( 293) Net written premiums 564 403 440 635 426 967 812 Change in unearned premiums (111) ( 9) 81 (61) (36) ( 120) ( 36) Net earned premiums 453 394 521 574 390 847 776 Loss and LAE 263 221 329 403 239 484 476 Underwriting expense 128 117 118 124 118 245 240 Underwriting profit $ 62 $ 56 $ 74 $ 47 $ 33 $ 118 $ 60 Included in results above: COVID-19 related losses $ - $ - $ - $ 1 $ 3 $ - $ 6 Current accident year catastrophe losses: Catastrophe reinstatement premium $ 1 $ 8 $ - $ - $ - $ 9 $ - Catastrophe loss 6 14 6 18 15 20 23 Total current accident year catastrophe losses $ 7 $ 22 $ 6 $ 18 $ 15 $ 29 $ 23 Prior year loss reserve development (favorable) / adverse $ (40) $ (43) $ ( 29) $ (26) $ (28) $ ( 83) $ ( 52) Combined ratio: Loss and LAE ratio 58.2% 56.0% 63.3% 70.1% 61.3% 57.1% 6 1.4% Underwriting expense ratio 28.4% 29.6% 22.5% 21.8% 30.4% 2 9.0% 3 0.9% Combined ratio 86.6% 85.6% 85.8% 91.9% 91.7% 86.1% 92.3% Combined ratio excl. COVID-19 related losses, catastrophe losses, and prior year loss reserve development 94.0% 93.0% 9 0.0% 93.2% 94.3% 93.5% 95.3% Loss and LAE components: Current accident year, excluding COVID-19 related and catastrophe losses 65.6% 63.4% 67.5% 71.4% 63.9% 64.5% 6 4.4% COVID-19 related losses 0.0% 0.1% 0 .2% 0.1% 0.8% 0 .0% 0 .7% Current accident year catastrophe losses 1.4% 3.6% 1 .2% 3.1% 3.8% 2 .4% 3 .0% Prior accident year loss reserve development ( 8.8%) ( 11.1%) (5.6%) (4.5%) (7.2%) (9.8%) (6.7%) Loss and LAE ratio 58.2% 56.0% 63.3% 70.1% 61.3% 57.1% 61.4% Page 8American Financial Group, Inc. Property and Transportation - Underwriting Results (GAAP) ($ in millions) Three Months Ended Six Months Ended 6/30/21 3/31/21 12/31/20 9/30/20 6/30/20 6/30/21 6/30/20 Gross written premiums $ 851 $ 520 $ 647 $ 1,061 $ 611 $ 1,371 $ 1,105 Ceded reinsurance premiums (287) (117) ( 207) (426) (185) ( 404) ( 293) Net written premiums 564 403 440 635 426 967 812 Change in unearned premiums (111) ( 9) 81 (61) (36) ( 120) ( 36) Net earned premiums 453 394 521 574 390 847 776 Loss and LAE 263 221 329 403 239 484 476 Underwriting expense 128 117 118 124 118 245 240 Underwriting profit $ 62 $ 56 $ 74 $ 47 $ 33 $ 118 $ 60 Included in results above: COVID-19 related losses $ - $ - $ - $ 1 $ 3 $ - $ 6 Current accident year catastrophe losses: Catastrophe reinstatement premium $ 1 $ 8 $ - $ - $ - $ 9 $ - Catastrophe loss 6 14 6 18 15 20 23 Total current accident year catastrophe losses $ 7 $ 22 $ 6 $ 18 $ 15 $ 29 $ 23 Prior year loss reserve development (favorable) / adverse $ (40) $ (43) $ ( 29) $ (26) $ (28) $ ( 83) $ ( 52) Combined ratio: Loss and LAE ratio 58.2% 56.0% 63.3% 70.1% 61.3% 57.1% 6 1.4% Underwriting expense ratio 28.4% 29.6% 22.5% 21.8% 30.4% 2 9.0% 3 0.9% Combined ratio 86.6% 85.6% 85.8% 91.9% 91.7% 86.1% 92.3% Combined ratio excl. COVID-19 related losses, catastrophe losses, and prior year loss reserve development 94.0% 93.0% 9 0.0% 93.2% 94.3% 93.5% 95.3% Loss and LAE components: Current accident year, excluding COVID-19 related and catastrophe losses 65.6% 63.4% 67.5% 71.4% 63.9% 64.5% 6 4.4% COVID-19 related losses 0.0% 0.1% 0 .2% 0.1% 0.8% 0 .0% 0 .7% Current accident year catastrophe losses 1.4% 3.6% 1 .2% 3.1% 3.8% 2 .4% 3 .0% Prior accident year loss reserve development ( 8.8%) ( 11.1%) (5.6%) (4.5%) (7.2%) (9.8%) (6.7%) Loss and LAE ratio 58.2% 56.0% 63.3% 70.1% 61.3% 57.1% 61.4% Page 8
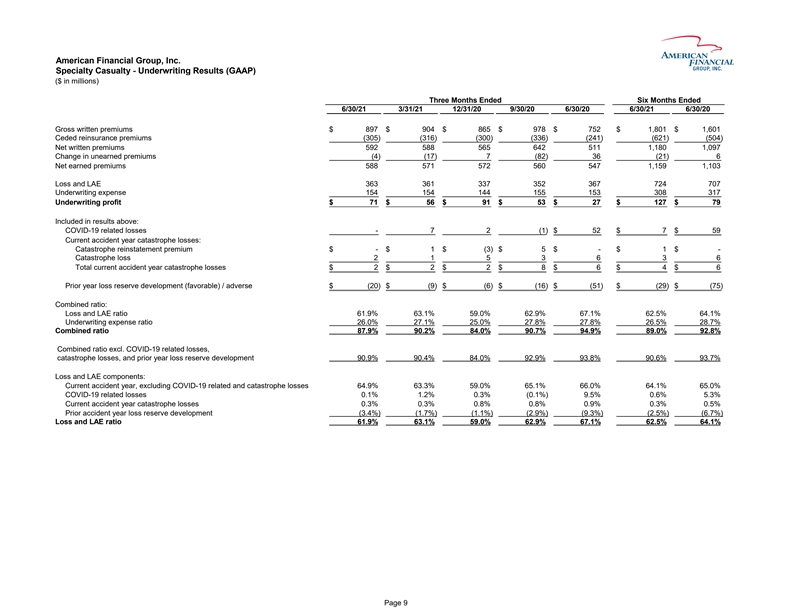
American Financial Group, Inc. Specialty Casualty - Underwriting Results (GAAP) ($ in millions) Three Months Ended Six Months Ended 6/30/21 3/31/21 12/31/20 9/30/20 6/30/20 6/30/21 6/30/20 Gross written premiums $ 8 97 $ 9 04 $ 865 $ 978 $ 752 $ 1,801 $ 1,601 Ceded reinsurance premiums (305) (316) (300) ( 336) ( 241) (621) (504) Net written premiums 5 92 5 88 565 642 511 1,180 1,097 Change in unearned premiums (4) (17) 7 ( 82) 36 (21) 6 Net earned premiums 5 88 5 71 572 560 547 1,159 1,103 Loss and LAE 3 63 3 61 337 352 367 724 707 Underwriting expense 1 54 1 54 144 155 153 308 317 Underwriting profit $ 7 1 $ 5 6 $ 91 $ 53 $ 27 $ 127 $ 79 Included in results above: COVID-19 related losses - 7 2 ( 1) $ 52 $ 7 $ 59 Current accident year catastrophe losses: Catastrophe reinstatement premium $ - $ 1 $ (3) $ 5 $ - $ 1 $ - Catastrophe loss 2 1 5 3 6 3 6 Total current accident year catastrophe losses $ 2 $ 2 $ 2 $ 8 $ 6 $ 4 $ 6 Prior year loss reserve development (favorable) / adverse $ (20) $ (9) $ (6) $ ( 16) $ ( 51) $ (29) $ (75) Combined ratio: Loss and LAE ratio 61.9% 63.1% 59.0% 6 2.9% 6 7.1% 62.5% 64.1% Underwriting expense ratio 26.0% 27.1% 25.0% 2 7.8% 2 7.8% 26.5% 28.7% Combined ratio 8 7.9% 9 0.2% 84.0% 90.7% 94.9% 89.0% 92.8% Combined ratio excl. COVID-19 related losses, catastrophe losses, and prior year loss reserve development 90.9% 90.4% 84.0% 9 2.9% 9 3.8% 90.6% 93.7% Loss and LAE components: Current accident year, excluding COVID-19 related and catastrophe losses 64.9% 63.3% 59.0% 6 5.1% 6 6.0% 64.1% 65.0% COVID-19 related losses 0.1% 1.2% 0.3% (0.1%) 9 .5% 0.6% 5.3% Current accident year catastrophe losses 0.3% 0.3% 0.8% 0 .8% 0 .9% 0.3% 0.5% Prior accident year loss reserve development (3.4%) (1.7%) (1.1%) (2.9%) (9.3%) (2.5%) (6.7%) Loss and LAE ratio 6 1.9% 6 3.1% 59.0% 62.9% 67.1% 62.5% 64.1% Page 9American Financial Group, Inc. Specialty Casualty - Underwriting Results (GAAP) ($ in millions) Three Months Ended Six Months Ended 6/30/21 3/31/21 12/31/20 9/30/20 6/30/20 6/30/21 6/30/20 Gross written premiums $ 8 97 $ 9 04 $ 865 $ 978 $ 752 $ 1,801 $ 1,601 Ceded reinsurance premiums (305) (316) (300) ( 336) ( 241) (621) (504) Net written premiums 5 92 5 88 565 642 511 1,180 1,097 Change in unearned premiums (4) (17) 7 ( 82) 36 (21) 6 Net earned premiums 5 88 5 71 572 560 547 1,159 1,103 Loss and LAE 3 63 3 61 337 352 367 724 707 Underwriting expense 1 54 1 54 144 155 153 308 317 Underwriting profit $ 7 1 $ 5 6 $ 91 $ 53 $ 27 $ 127 $ 79 Included in results above: COVID-19 related losses - 7 2 ( 1) $ 52 $ 7 $ 59 Current accident year catastrophe losses: Catastrophe reinstatement premium $ - $ 1 $ (3) $ 5 $ - $ 1 $ - Catastrophe loss 2 1 5 3 6 3 6 Total current accident year catastrophe losses $ 2 $ 2 $ 2 $ 8 $ 6 $ 4 $ 6 Prior year loss reserve development (favorable) / adverse $ (20) $ (9) $ (6) $ ( 16) $ ( 51) $ (29) $ (75) Combined ratio: Loss and LAE ratio 61.9% 63.1% 59.0% 6 2.9% 6 7.1% 62.5% 64.1% Underwriting expense ratio 26.0% 27.1% 25.0% 2 7.8% 2 7.8% 26.5% 28.7% Combined ratio 8 7.9% 9 0.2% 84.0% 90.7% 94.9% 89.0% 92.8% Combined ratio excl. COVID-19 related losses, catastrophe losses, and prior year loss reserve development 90.9% 90.4% 84.0% 9 2.9% 9 3.8% 90.6% 93.7% Loss and LAE components: Current accident year, excluding COVID-19 related and catastrophe losses 64.9% 63.3% 59.0% 6 5.1% 6 6.0% 64.1% 65.0% COVID-19 related losses 0.1% 1.2% 0.3% (0.1%) 9 .5% 0.6% 5.3% Current accident year catastrophe losses 0.3% 0.3% 0.8% 0 .8% 0 .9% 0.3% 0.5% Prior accident year loss reserve development (3.4%) (1.7%) (1.1%) (2.9%) (9.3%) (2.5%) (6.7%) Loss and LAE ratio 6 1.9% 6 3.1% 59.0% 62.9% 67.1% 62.5% 64.1% Page 9
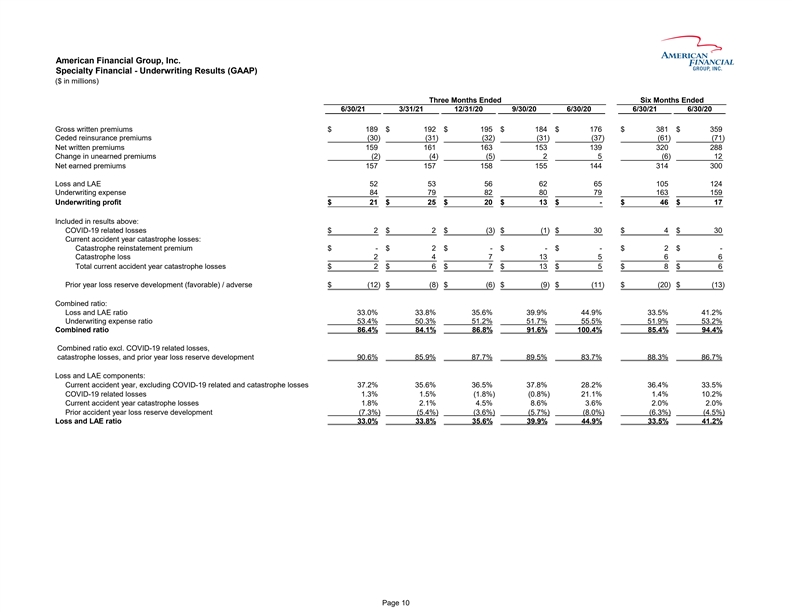
American Financial Group, Inc. Specialty Financial - Underwriting Results (GAAP) ($ in millions) Three Months Ended Six Months Ended 6/30/21 3/31/21 12/31/20 9/30/20 6/30/20 6/30/21 6/30/20 Gross written premiums $ 189 $ 192 $ 1 95 $ 1 84 $ 1 76 $ 381 $ 359 Ceded reinsurance premiums (30) (31) (32) (31) (37) (61) (71) Net written premiums 159 161 1 63 1 53 1 39 320 288 Change in unearned premiums (2) (4) (5) 2 5 (6) 12 Net earned premiums 157 157 1 58 1 55 1 44 314 300 Loss and LAE 52 53 5 6 6 2 6 5 105 124 Underwriting expense 84 79 8 2 8 0 7 9 163 159 Underwriting profit $ 21 $ 25 $ 2 0 $ 1 3 $ - $ 46 $ 17 Included in results above: COVID-19 related losses $ 2 $ 2 $ (3) $ (1) $ 3 0 $ 4 $ 30 Current accident year catastrophe losses: Catastrophe reinstatement premium $ - $ 2 $ - $ - $ - $ 2 $ - Catastrophe loss 2 4 7 1 3 5 6 6 Total current accident year catastrophe losses $ 2 $ 6 $ 7 $ 1 3 $ 5 $ 8 $ 6 Prior year loss reserve development (favorable) / adverse $ (12) $ (8) $ (6) $ (9) $ (11) $ (20) $ (13) Combined ratio: Loss and LAE ratio 33.0% 33.8% 35.6% 39.9% 44.9% 33.5% 41.2% Underwriting expense ratio 53.4% 50.3% 51.2% 51.7% 55.5% 51.9% 53.2% Combined ratio 86.4% 84.1% 8 6.8% 9 1.6% 1 00.4% 85.4% 94.4% Combined ratio excl. COVID-19 related losses, catastrophe losses, and prior year loss reserve development 90.6% 85.9% 87.7% 89.5% 83.7% 88.3% 86.7% Loss and LAE components: Current accident year, excluding COVID-19 related and catastrophe losses 37.2% 35.6% 36.5% 37.8% 28.2% 36.4% 33.5% COVID-19 related losses 1.3% 1.5% (1.8%) (0.8%) 21.1% 1.4% 10.2% Current accident year catastrophe losses 1.8% 2.1% 4.5% 8.6% 3.6% 2.0% 2.0% Prior accident year loss reserve development (7.3%) (5.4%) (3.6%) (5.7%) (8.0%) ( 6.3%) (4.5%) Loss and LAE ratio 33.0% 33.8% 3 5.6% 3 9.9% 4 4.9% 33.5% 41.2% Page 10American Financial Group, Inc. Specialty Financial - Underwriting Results (GAAP) ($ in millions) Three Months Ended Six Months Ended 6/30/21 3/31/21 12/31/20 9/30/20 6/30/20 6/30/21 6/30/20 Gross written premiums $ 189 $ 192 $ 1 95 $ 1 84 $ 1 76 $ 381 $ 359 Ceded reinsurance premiums (30) (31) (32) (31) (37) (61) (71) Net written premiums 159 161 1 63 1 53 1 39 320 288 Change in unearned premiums (2) (4) (5) 2 5 (6) 12 Net earned premiums 157 157 1 58 1 55 1 44 314 300 Loss and LAE 52 53 5 6 6 2 6 5 105 124 Underwriting expense 84 79 8 2 8 0 7 9 163 159 Underwriting profit $ 21 $ 25 $ 2 0 $ 1 3 $ - $ 46 $ 17 Included in results above: COVID-19 related losses $ 2 $ 2 $ (3) $ (1) $ 3 0 $ 4 $ 30 Current accident year catastrophe losses: Catastrophe reinstatement premium $ - $ 2 $ - $ - $ - $ 2 $ - Catastrophe loss 2 4 7 1 3 5 6 6 Total current accident year catastrophe losses $ 2 $ 6 $ 7 $ 1 3 $ 5 $ 8 $ 6 Prior year loss reserve development (favorable) / adverse $ (12) $ (8) $ (6) $ (9) $ (11) $ (20) $ (13) Combined ratio: Loss and LAE ratio 33.0% 33.8% 35.6% 39.9% 44.9% 33.5% 41.2% Underwriting expense ratio 53.4% 50.3% 51.2% 51.7% 55.5% 51.9% 53.2% Combined ratio 86.4% 84.1% 8 6.8% 9 1.6% 1 00.4% 85.4% 94.4% Combined ratio excl. COVID-19 related losses, catastrophe losses, and prior year loss reserve development 90.6% 85.9% 87.7% 89.5% 83.7% 88.3% 86.7% Loss and LAE components: Current accident year, excluding COVID-19 related and catastrophe losses 37.2% 35.6% 36.5% 37.8% 28.2% 36.4% 33.5% COVID-19 related losses 1.3% 1.5% (1.8%) (0.8%) 21.1% 1.4% 10.2% Current accident year catastrophe losses 1.8% 2.1% 4.5% 8.6% 3.6% 2.0% 2.0% Prior accident year loss reserve development (7.3%) (5.4%) (3.6%) (5.7%) (8.0%) ( 6.3%) (4.5%) Loss and LAE ratio 33.0% 33.8% 3 5.6% 3 9.9% 4 4.9% 33.5% 41.2% Page 10
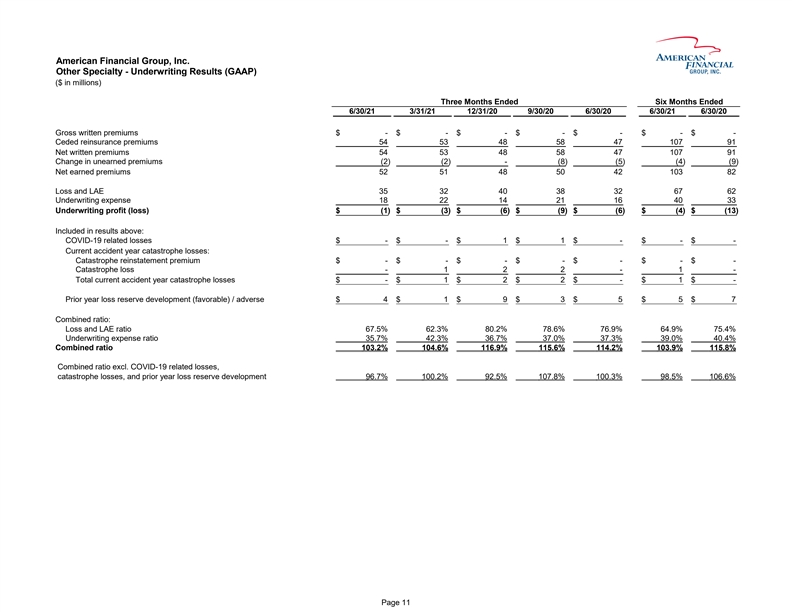
American Financial Group, Inc. Other Specialty - Underwriting Results (GAAP) ($ in millions) Three Months Ended Six Months Ended 6/30/21 3/31/21 12/31/20 9/30/20 6/30/20 6/30/21 6/30/20 Gross written premiums $ - $ - $ - $ - $ - $ - $ - Ceded reinsurance premiums 54 53 48 58 47 107 91 Net written premiums 54 53 48 58 47 107 91 Change in unearned premiums ( 2) ( 2) - (8) (5) ( 4) (9) Net earned premiums 52 51 48 50 42 103 82 Loss and LAE 35 32 40 38 32 67 62 Underwriting expense 18 22 14 21 16 40 33 Underwriting profit (loss) $ ( 1) $ ( 3) $ (6) $ (9) $ (6) $ ( 4) $ (13) Included in results above: COVID-19 related losses $ - $ - $ 1 $ 1 $ - $ - $ - Current accident year catastrophe losses: Catastrophe reinstatement premium $ - $ - $ - $ - $ - $ - $ - Catastrophe loss - 1 2 2 - 1 - Total current accident year catastrophe losses $ - $ 1 $ 2 $ 2 $ - $ 1 $ - Prior year loss reserve development (favorable) / adverse $ 4 $ 1 $ 9 $ 3 $ 5 $ 5 $ 7 Combined ratio: Loss and LAE ratio 6 7.5% 6 2.3% 80.2% 78.6% 76.9% 6 4.9% 75.4% Underwriting expense ratio 3 5.7% 4 2.3% 36.7% 37.0% 37.3% 3 9.0% 40.4% Combined ratio 1 03.2% 1 04.6% 116.9% 115.6% 114.2% 1 03.9% 115.8% Combined ratio excl. COVID-19 related losses, catastrophe losses, and prior year loss reserve development 9 6.7% 1 00.2% 92.5% 107.8% 100.3% 9 8.5% 106.6% Page 11American Financial Group, Inc. Other Specialty - Underwriting Results (GAAP) ($ in millions) Three Months Ended Six Months Ended 6/30/21 3/31/21 12/31/20 9/30/20 6/30/20 6/30/21 6/30/20 Gross written premiums $ - $ - $ - $ - $ - $ - $ - Ceded reinsurance premiums 54 53 48 58 47 107 91 Net written premiums 54 53 48 58 47 107 91 Change in unearned premiums ( 2) ( 2) - (8) (5) ( 4) (9) Net earned premiums 52 51 48 50 42 103 82 Loss and LAE 35 32 40 38 32 67 62 Underwriting expense 18 22 14 21 16 40 33 Underwriting profit (loss) $ ( 1) $ ( 3) $ (6) $ (9) $ (6) $ ( 4) $ (13) Included in results above: COVID-19 related losses $ - $ - $ 1 $ 1 $ - $ - $ - Current accident year catastrophe losses: Catastrophe reinstatement premium $ - $ - $ - $ - $ - $ - $ - Catastrophe loss - 1 2 2 - 1 - Total current accident year catastrophe losses $ - $ 1 $ 2 $ 2 $ - $ 1 $ - Prior year loss reserve development (favorable) / adverse $ 4 $ 1 $ 9 $ 3 $ 5 $ 5 $ 7 Combined ratio: Loss and LAE ratio 6 7.5% 6 2.3% 80.2% 78.6% 76.9% 6 4.9% 75.4% Underwriting expense ratio 3 5.7% 4 2.3% 36.7% 37.0% 37.3% 3 9.0% 40.4% Combined ratio 1 03.2% 1 04.6% 116.9% 115.6% 114.2% 1 03.9% 115.8% Combined ratio excl. COVID-19 related losses, catastrophe losses, and prior year loss reserve development 9 6.7% 1 00.2% 92.5% 107.8% 100.3% 9 8.5% 106.6% Page 11
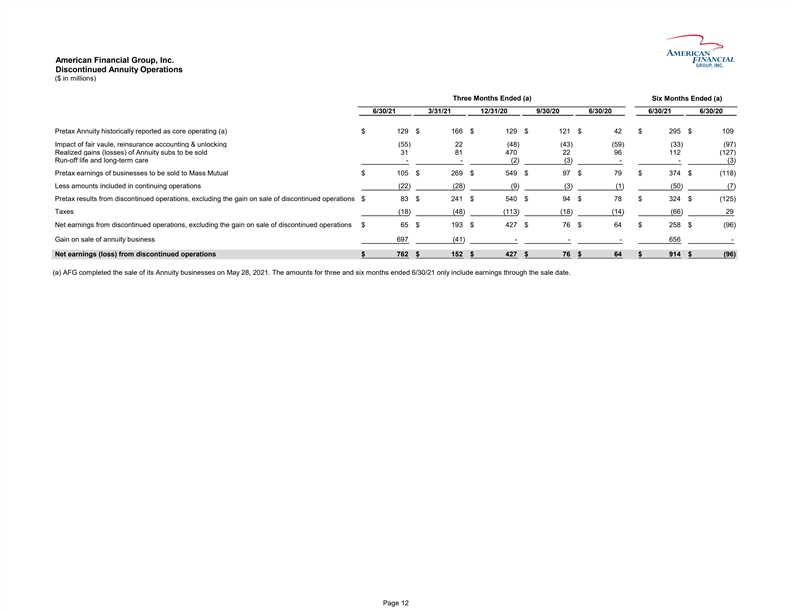
American Financial Group, Inc. Discontinued Annuity Operations ($ in millions) Three Months Ended (a) Six Months Ended (a) 6/30/21 3/31/21 12/31/20 9/30/20 6/30/20 6/30/21 6/30/20 Pretax Annuity historically reported as core operating (a) $ 129 $ 166 $ 129 $ 1 21 $ 4 2 $ 295 $ 109 Impact of fair vaule, reinsurance accounting & unlocking (55) 22 ( 48) (43) ( 59) (33) ( 97) Realized gains (losses) of Annuity subs to be sold 31 8 1 4 70 2 2 96 112 (127) Run-off life and long-term care - - (2) (3) - - (3) Pretax earnings of businesses to be sold to Mass Mutual $ 105 $ 269 $ 549 $ 9 7 $ 7 9 $ 374 $ (118) Less amounts included in continuing operations ( 22) ( 28) (9) ( 3) ( 1) (50) (7) Pretax results from discontinued operations, excluding the gain on sale of discontinued operations $ 83 $ 241 $ 540 $ 9 4 $ 7 8 $ 324 $ (125) Taxes (18) (48) ( 113) ( 18) ( 14) (66) 29 Net earnings from discontinued operations, excluding the gain on sale of discontinued operations $ 65 $ 193 $ 427 $ 7 6 $ 6 4 $ 258 $ (96) Gain on sale of annuity business 6 97 (41) - - - 656 - Net earnings (loss) from discontinued operations $ 762 $ 152 $ 427 $ 7 6 $ 6 4 $ 914 $ (96) (a) AFG completed the sale of its Annuity businesses on May 28, 2021. The amounts for three and six months ended 6/30/21 only include earnings through the sale date. Page 12American Financial Group, Inc. Discontinued Annuity Operations ($ in millions) Three Months Ended (a) Six Months Ended (a) 6/30/21 3/31/21 12/31/20 9/30/20 6/30/20 6/30/21 6/30/20 Pretax Annuity historically reported as core operating (a) $ 129 $ 166 $ 129 $ 1 21 $ 4 2 $ 295 $ 109 Impact of fair vaule, reinsurance accounting & unlocking (55) 22 ( 48) (43) ( 59) (33) ( 97) Realized gains (losses) of Annuity subs to be sold 31 8 1 4 70 2 2 96 112 (127) Run-off life and long-term care - - (2) (3) - - (3) Pretax earnings of businesses to be sold to Mass Mutual $ 105 $ 269 $ 549 $ 9 7 $ 7 9 $ 374 $ (118) Less amounts included in continuing operations ( 22) ( 28) (9) ( 3) ( 1) (50) (7) Pretax results from discontinued operations, excluding the gain on sale of discontinued operations $ 83 $ 241 $ 540 $ 9 4 $ 7 8 $ 324 $ (125) Taxes (18) (48) ( 113) ( 18) ( 14) (66) 29 Net earnings from discontinued operations, excluding the gain on sale of discontinued operations $ 65 $ 193 $ 427 $ 7 6 $ 6 4 $ 258 $ (96) Gain on sale of annuity business 6 97 (41) - - - 656 - Net earnings (loss) from discontinued operations $ 762 $ 152 $ 427 $ 7 6 $ 6 4 $ 914 $ (96) (a) AFG completed the sale of its Annuity businesses on May 28, 2021. The amounts for three and six months ended 6/30/21 only include earnings through the sale date. Page 12
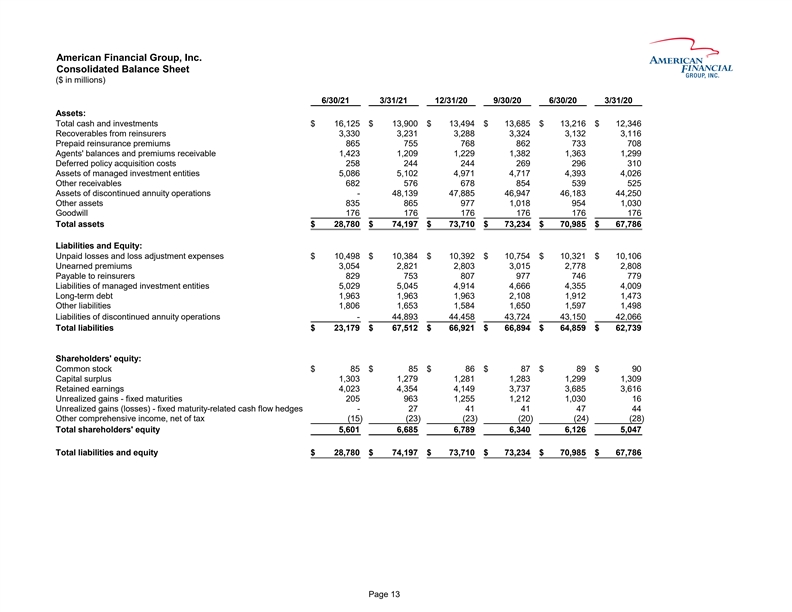
American Financial Group, Inc. Consolidated Balance Sheet ($ in millions) 6/30/21 3/31/21 12/31/20 9/30/20 6/30/20 3/31/20 Assets: Total cash and investments $ 16,125 $ 13,900 $ 13,494 $ 13,685 $ 13,216 $ 12,346 Recoverables from reinsurers 3,330 3,231 3 ,288 3,324 3,132 3,116 Prepaid reinsurance premiums 865 755 7 68 862 733 708 Agents' balances and premiums receivable 1,423 1,209 1 ,229 1,382 1,363 1,299 Deferred policy acquisition costs 258 244 2 44 269 296 310 Assets of managed investment entities 5,086 5,102 4 ,971 4,717 4,393 4,026 Other receivables 682 576 6 78 854 539 525 Assets of discontinued annuity operations - 48,139 47,885 46,947 46,183 44,250 Other assets 835 865 9 77 1,018 954 1,030 Goodwill 176 176 1 76 176 176 176 Total assets $ 28,780 $ 74,197 $ 73,710 $ 73,234 $ 70,985 $ 67,786 Liabilities and Equity: Unpaid losses and loss adjustment expenses $ 10,498 $ 10,384 $ 10,392 $ 10,754 $ 10,321 $ 10,106 Unearned premiums 3,054 2,821 2 ,803 3,015 2,778 2,808 Payable to reinsurers 829 753 8 07 977 746 779 Liabilities of managed investment entities 5,029 5,045 4 ,914 4,666 4,355 4,009 Long-term debt 1,963 1,963 1 ,963 2,108 1,912 1,473 Other liabilities 1,806 1,653 1 ,584 1,650 1,597 1,498 Liabilities of discontinued annuity operations - 44,893 44,458 43,724 43,150 42,066 Total liabilities $ 23,179 $ 67,512 $ 66,921 $ 66,894 $ 64,859 $ 62,739 Shareholders' equity: Common stock $ 85 $ 85 $ 8 6 $ 87 $ 89 $ 90 Capital surplus 1,303 1,279 1 ,281 1,283 1,299 1,309 Retained earnings 4,023 4,354 4 ,149 3,737 3,685 3,616 Unrealized gains - fixed maturities 205 963 1 ,255 1,212 1,030 16 Unrealized gains (losses) - fixed maturity-related cash flow hedges - 27 4 1 41 47 44 Other comprehensive income, net of tax (15) (23) (23) (20) (24) (28) Total shareholders' equity 5,601 6,685 6 ,789 6,340 6,126 5,047 Total liabilities and equity $ 28,780 $ 74,197 $ 73,710 $ 73,234 $ 70,985 $ 67,786 Page 13American Financial Group, Inc. Consolidated Balance Sheet ($ in millions) 6/30/21 3/31/21 12/31/20 9/30/20 6/30/20 3/31/20 Assets: Total cash and investments $ 16,125 $ 13,900 $ 13,494 $ 13,685 $ 13,216 $ 12,346 Recoverables from reinsurers 3,330 3,231 3 ,288 3,324 3,132 3,116 Prepaid reinsurance premiums 865 755 7 68 862 733 708 Agents' balances and premiums receivable 1,423 1,209 1 ,229 1,382 1,363 1,299 Deferred policy acquisition costs 258 244 2 44 269 296 310 Assets of managed investment entities 5,086 5,102 4 ,971 4,717 4,393 4,026 Other receivables 682 576 6 78 854 539 525 Assets of discontinued annuity operations - 48,139 47,885 46,947 46,183 44,250 Other assets 835 865 9 77 1,018 954 1,030 Goodwill 176 176 1 76 176 176 176 Total assets $ 28,780 $ 74,197 $ 73,710 $ 73,234 $ 70,985 $ 67,786 Liabilities and Equity: Unpaid losses and loss adjustment expenses $ 10,498 $ 10,384 $ 10,392 $ 10,754 $ 10,321 $ 10,106 Unearned premiums 3,054 2,821 2 ,803 3,015 2,778 2,808 Payable to reinsurers 829 753 8 07 977 746 779 Liabilities of managed investment entities 5,029 5,045 4 ,914 4,666 4,355 4,009 Long-term debt 1,963 1,963 1 ,963 2,108 1,912 1,473 Other liabilities 1,806 1,653 1 ,584 1,650 1,597 1,498 Liabilities of discontinued annuity operations - 44,893 44,458 43,724 43,150 42,066 Total liabilities $ 23,179 $ 67,512 $ 66,921 $ 66,894 $ 64,859 $ 62,739 Shareholders' equity: Common stock $ 85 $ 85 $ 8 6 $ 87 $ 89 $ 90 Capital surplus 1,303 1,279 1 ,281 1,283 1,299 1,309 Retained earnings 4,023 4,354 4 ,149 3,737 3,685 3,616 Unrealized gains - fixed maturities 205 963 1 ,255 1,212 1,030 16 Unrealized gains (losses) - fixed maturity-related cash flow hedges - 27 4 1 41 47 44 Other comprehensive income, net of tax (15) (23) (23) (20) (24) (28) Total shareholders' equity 5,601 6,685 6 ,789 6,340 6,126 5,047 Total liabilities and equity $ 28,780 $ 74,197 $ 73,710 $ 73,234 $ 70,985 $ 67,786 Page 13
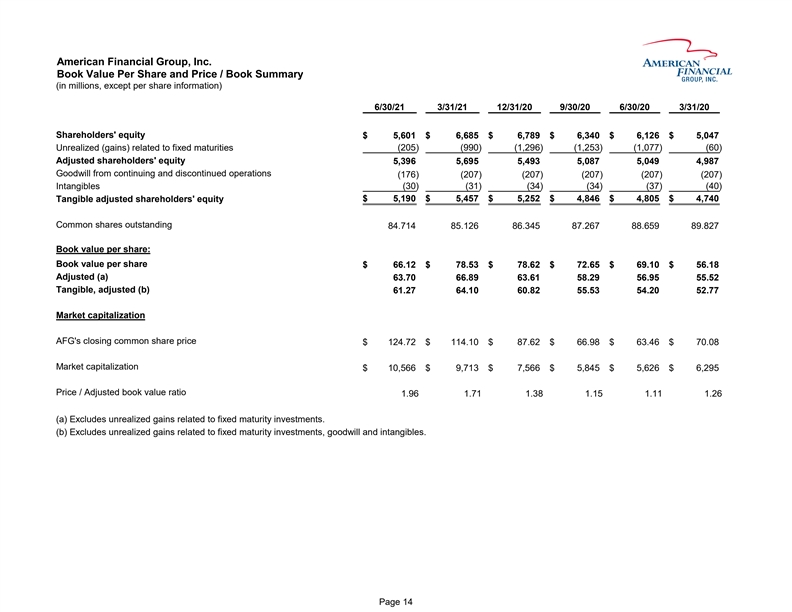
American Financial Group, Inc. Book Value Per Share and Price / Book Summary (in millions, except per share information) 6/30/21 3/31/21 12/31/20 9/30/20 6/30/20 3/31/20 Shareholders' equity $ 5,601 $ 6,685 $ 6,789 $ 6 ,340 $ 6 ,126 $ 5 ,047 Unrealized (gains) related to fixed maturities ( 205) ( 990) (1,296) (1,253) (1,077) (60) Adjusted shareholders' equity 5,396 5,695 5,493 5 ,087 5 ,049 4 ,987 Goodwill from continuing and discontinued operations ( 176) ( 207) (207) (207) (207) (207) Intangibles ( 30) ( 31) (34) (34) (37) (40) $ 5,190 $ 5,457 $ 5,252 $ 4 ,846 $ 4 ,805 $ 4 ,740 Tangible adjusted shareholders' equity Common shares outstanding 84.714 85.126 86.345 8 7.267 8 8.659 8 9.827 Book value per share: Book value per share $ 66.12 $ 78.53 $ 78.62 $ 7 2.65 $ 6 9.10 $ 5 6.18 Adjusted (a) 63.70 66.89 63.61 5 8.29 5 6.95 5 5.52 Tangible, adjusted (b) 61.27 64.10 60.82 5 5.53 5 4.20 5 2.77 Market capitalization AFG's closing common share price $ 124.72 $ 114.10 $ 87.62 $ 6 6.98 $ 6 3.46 $ 7 0.08 Market capitalization $ 10,566 $ 9,713 $ 7,566 $ 5 ,845 $ 5 ,626 $ 6 ,295 Price / Adjusted book value ratio 1.96 1.71 1.38 1.15 1.11 1.26 (a) Excludes unrealized gains related to fixed maturity investments. (b) Excludes unrealized gains related to fixed maturity investments, goodwill and intangibles. Page 14American Financial Group, Inc. Book Value Per Share and Price / Book Summary (in millions, except per share information) 6/30/21 3/31/21 12/31/20 9/30/20 6/30/20 3/31/20 Shareholders' equity $ 5,601 $ 6,685 $ 6,789 $ 6 ,340 $ 6 ,126 $ 5 ,047 Unrealized (gains) related to fixed maturities ( 205) ( 990) (1,296) (1,253) (1,077) (60) Adjusted shareholders' equity 5,396 5,695 5,493 5 ,087 5 ,049 4 ,987 Goodwill from continuing and discontinued operations ( 176) ( 207) (207) (207) (207) (207) Intangibles ( 30) ( 31) (34) (34) (37) (40) $ 5,190 $ 5,457 $ 5,252 $ 4 ,846 $ 4 ,805 $ 4 ,740 Tangible adjusted shareholders' equity Common shares outstanding 84.714 85.126 86.345 8 7.267 8 8.659 8 9.827 Book value per share: Book value per share $ 66.12 $ 78.53 $ 78.62 $ 7 2.65 $ 6 9.10 $ 5 6.18 Adjusted (a) 63.70 66.89 63.61 5 8.29 5 6.95 5 5.52 Tangible, adjusted (b) 61.27 64.10 60.82 5 5.53 5 4.20 5 2.77 Market capitalization AFG's closing common share price $ 124.72 $ 114.10 $ 87.62 $ 6 6.98 $ 6 3.46 $ 7 0.08 Market capitalization $ 10,566 $ 9,713 $ 7,566 $ 5 ,845 $ 5 ,626 $ 6 ,295 Price / Adjusted book value ratio 1.96 1.71 1.38 1.15 1.11 1.26 (a) Excludes unrealized gains related to fixed maturity investments. (b) Excludes unrealized gains related to fixed maturity investments, goodwill and intangibles. Page 14
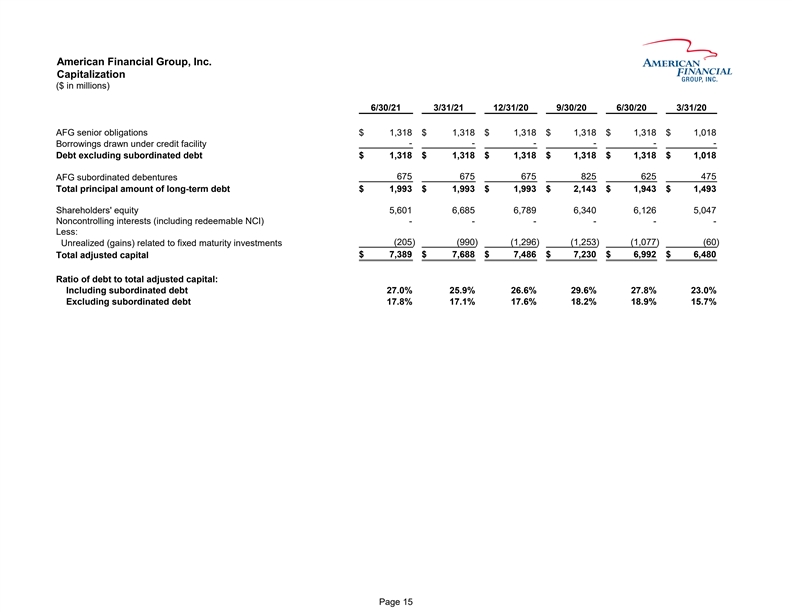
American Financial Group, Inc. Capitalization ($ in millions) 6/30/21 3/31/21 12/31/20 9/30/20 6/30/20 3/31/20 AFG senior obligations $ 1,318 $ 1,318 $ 1,318 $ 1,318 $ 1,318 $ 1 ,018 - - - - - - Borrowings drawn under credit facility Debt excluding subordinated debt $ 1,318 $ 1,318 $ 1,318 $ 1,318 $ 1,318 $ 1,018 AFG subordinated debentures 675 675 675 8 25 6 25 4 75 Total principal amount of long-term debt $ 1,993 $ 1,993 $ 1,993 $ 2,143 $ 1 ,943 $ 1 ,493 Shareholders' equity 5,601 6,685 6,789 6,340 6,126 5,047 Noncontrolling interests (including redeemable NCI) - - - - - - Less: ( 205) ( 990) (1,296) (1,253) (1,077) (60) Unrealized (gains) related to fixed maturity investments Total adjusted capital $ 7,389 $ 7,688 $ 7,486 $ 7 ,230 $ 6 ,992 $ 6 ,480 Ratio of debt to total adjusted capital: Including subordinated debt 27.0% 25.9% 26.6% 2 9.6% 2 7.8% 2 3.0% Excluding subordinated debt 17.8% 17.1% 17.6% 1 8.2% 1 8.9% 1 5.7% Page 15
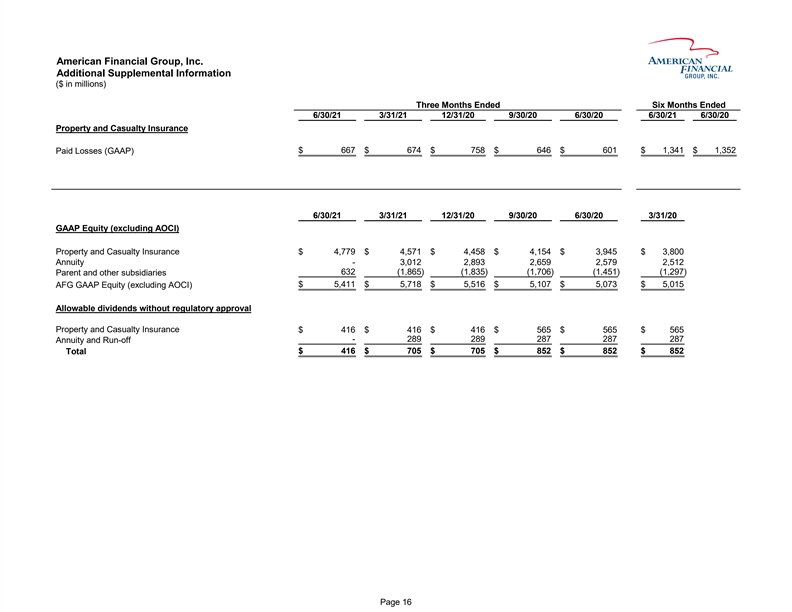
American Financial Group, Inc. Additional Supplemental Information ($ in millions) Three Months Ended Six Months Ended 6/30/21 3/31/21 12/31/20 9/30/20 6/30/20 6/30/21 6/30/20 Property and Casualty Insurance $ 6 67 $ 6 74 $ 7 58 $ 6 46 $ 6 01 $ 1,341 $ 1,352 Paid Losses (GAAP) 6/30/21 3/31/21 12/31/20 9/30/20 6/30/20 3/31/20 GAAP Equity (excluding AOCI) Property and Casualty Insurance $ 4 ,779 $ 4 ,571 $ 4,458 $ 4 ,154 $ 3 ,945 $ 3,800 Annuity - 3 ,012 2 ,893 2 ,659 2 ,579 2,512 6 32 ( 1,865) ( 1,835) ( 1,706) ( 1,451) (1,297) Parent and other subsidiaries $ 5 ,411 $ 5 ,718 $ 5 ,516 $ 5 ,107 $ 5 ,073 $ 5,015 AFG GAAP Equity (excluding AOCI) Allowable dividends without regulatory approval Property and Casualty Insurance $ 4 16 $ 4 16 $ 4 16 $ 5 65 $ 5 65 $ 565 - 2 89 289 2 87 2 87 287 Annuity and Run-off Total $ 4 16 $ 7 05 $ 7 05 $ 8 52 $ 8 52 $ 852 Page 16American Financial Group, Inc. Additional Supplemental Information ($ in millions) Three Months Ended Six Months Ended 6/30/21 3/31/21 12/31/20 9/30/20 6/30/20 6/30/21 6/30/20 Property and Casualty Insurance $ 6 67 $ 6 74 $ 7 58 $ 6 46 $ 6 01 $ 1,341 $ 1,352 Paid Losses (GAAP) 6/30/21 3/31/21 12/31/20 9/30/20 6/30/20 3/31/20 GAAP Equity (excluding AOCI) Property and Casualty Insurance $ 4 ,779 $ 4 ,571 $ 4,458 $ 4 ,154 $ 3 ,945 $ 3,800 Annuity - 3 ,012 2 ,893 2 ,659 2 ,579 2,512 6 32 ( 1,865) ( 1,835) ( 1,706) ( 1,451) (1,297) Parent and other subsidiaries $ 5 ,411 $ 5 ,718 $ 5 ,516 $ 5 ,107 $ 5 ,073 $ 5,015 AFG GAAP Equity (excluding AOCI) Allowable dividends without regulatory approval Property and Casualty Insurance $ 4 16 $ 4 16 $ 4 16 $ 5 65 $ 5 65 $ 565 - 2 89 289 2 87 2 87 287 Annuity and Run-off Total $ 4 16 $ 7 05 $ 7 05 $ 8 52 $ 8 52 $ 852 Page 16
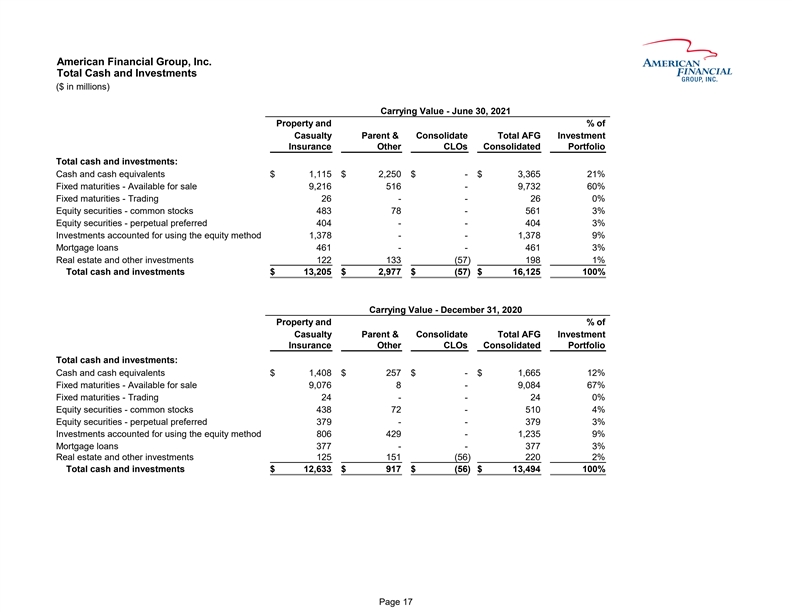
American Financial Group, Inc. Total Cash and Investments ($ in millions) Carrying Value - June 30, 2021 Property and % of Casualty Parent & Consolidate Total AFG Investment Insurance Other CLOs Consolidated Portfolio Total cash and investments: Cash and cash equivalents $ 1,115 $ 2 ,250 $ - $ 3,365 21% Fixed maturities - Available for sale 9,216 5 16 - 9,732 60% Fixed maturities - Trading 26 - - 26 0% Equity securities - common stocks 483 7 8 - 561 3% Equity securities - perpetual preferred 404 - - 404 3% Investments accounted for using the equity method 1,378 - - 1,378 9% Mortgage loans 461 - - 461 3% Real estate and other investments 122 1 33 (57) 198 1% Total cash and investments $ 13,205 $ 2 ,977 $ (57) $ 16,125 100% Carrying Value - December 31, 2020 Property and % of Casualty Parent & Consolidate Total AFG Investment Insurance Other CLOs Consolidated Portfolio Total cash and investments: Cash and cash equivalents $ 1,408 $ 2 57 $ - $ 1,665 12% Fixed maturities - Available for sale 9,076 8 - 9,084 67% Fixed maturities - Trading 24 - - 24 0% Equity securities - common stocks 438 7 2 - 510 4% Equity securities - perpetual preferred 379 - - 379 3% Investments accounted for using the equity method 806 4 29 - 1,235 9% Mortgage loans 377 - - 377 3% Real estate and other investments 125 1 51 (56) 220 2% Total cash and investments $ 12,633 $ 9 17 $ (56) $ 13,494 100% Page 17American Financial Group, Inc. Total Cash and Investments ($ in millions) Carrying Value - June 30, 2021 Property and % of Casualty Parent & Consolidate Total AFG Investment Insurance Other CLOs Consolidated Portfolio Total cash and investments: Cash and cash equivalents $ 1,115 $ 2 ,250 $ - $ 3,365 21% Fixed maturities - Available for sale 9,216 5 16 - 9,732 60% Fixed maturities - Trading 26 - - 26 0% Equity securities - common stocks 483 7 8 - 561 3% Equity securities - perpetual preferred 404 - - 404 3% Investments accounted for using the equity method 1,378 - - 1,378 9% Mortgage loans 461 - - 461 3% Real estate and other investments 122 1 33 (57) 198 1% Total cash and investments $ 13,205 $ 2 ,977 $ (57) $ 16,125 100% Carrying Value - December 31, 2020 Property and % of Casualty Parent & Consolidate Total AFG Investment Insurance Other CLOs Consolidated Portfolio Total cash and investments: Cash and cash equivalents $ 1,408 $ 2 57 $ - $ 1,665 12% Fixed maturities - Available for sale 9,076 8 - 9,084 67% Fixed maturities - Trading 24 - - 24 0% Equity securities - common stocks 438 7 2 - 510 4% Equity securities - perpetual preferred 379 - - 379 3% Investments accounted for using the equity method 806 4 29 - 1,235 9% Mortgage loans 377 - - 377 3% Real estate and other investments 125 1 51 (56) 220 2% Total cash and investments $ 12,633 $ 9 17 $ (56) $ 13,494 100% Page 17
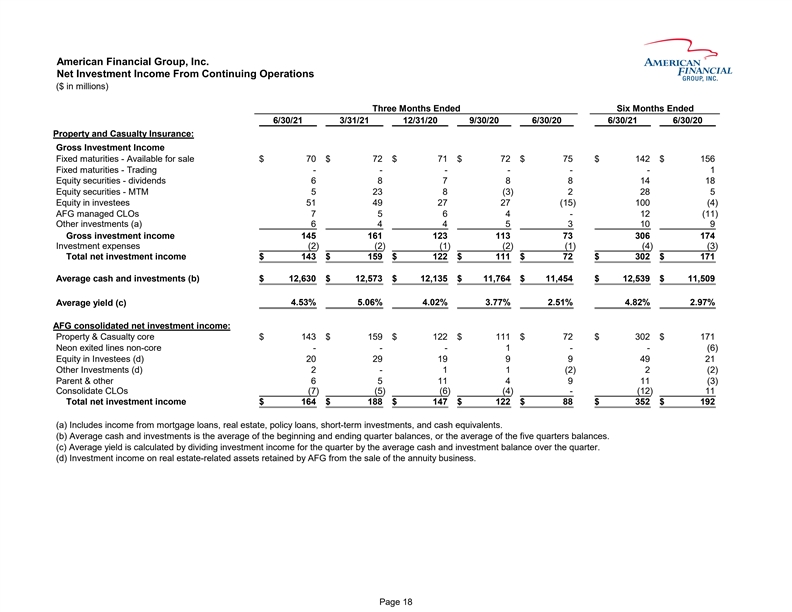
American Financial Group, Inc. Net Investment Income From Continuing Operations ($ in millions) Three Months Ended Six Months Ended 6/30/21 3/31/21 12/31/20 9/30/20 6/30/20 6/30/21 6/30/20 Property and Casualty Insurance: Gross Investment Income Fixed maturities - Available for sale $ 70 $ 72 $ 71 $ 72 $ 75 $ 142 $ 156 Fixed maturities - Trading - - - - - - 1 Equity securities - dividends 6 8 7 8 8 14 18 Equity securities - MTM 5 23 8 (3) 2 28 5 Equity in investees 51 49 27 27 ( 15) 100 ( 4) AFG managed CLOs 7 5 6 4 - 12 ( 11) Other investments (a) 6 4 4 5 3 10 9 Gross investment income 145 161 123 113 73 306 174 Investment expenses (2) (2) ( 1) (2) (1) ( 4) ( 3) Total net investment income $ 143 $ 159 $ 122 $ 111 $ 72 $ 302 $ 171 Average cash and investments (b) $ 1 2,630 $ 1 2,573 $ 12,135 $ 11,764 $ 11,454 $ 12,539 $ 11,509 4.53% 5.06% 4.02% 3.77% 2.51% 4.82% 2.97% Average yield (c) AFG consolidated net investment income: Property & Casualty core $ 143 $ 159 $ 122 $ 111 $ 72 $ 302 $ 171 Neon exited lines non-core - - - 1 - - ( 6) Equity in Investees (d) 20 29 19 9 9 49 21 Other Investments (d) 2 - 1 1 (2) 2 ( 2) Parent & other 6 5 11 4 9 11 ( 3) Consolidate CLOs (7) (5) ( 6) ( 4) - ( 12) 11 Total net investment income $ 164 $ 188 $ 147 $ 122 $ 88 $ 352 $ 192 (a) Includes income from mortgage loans, real estate, policy loans, short-term investments, and cash equivalents. (b) Average cash and investments is the average of the beginning and ending quarter balances, or the average of the five quarters balances. (c) Average yield is calculated by dividing investment income for the quarter by the average cash and investment balance over the quarter. (d) Investment income on real estate-related assets retained by AFG from the sale of the annuity business. Page 18American Financial Group, Inc. Net Investment Income From Continuing Operations ($ in millions) Three Months Ended Six Months Ended 6/30/21 3/31/21 12/31/20 9/30/20 6/30/20 6/30/21 6/30/20 Property and Casualty Insurance: Gross Investment Income Fixed maturities - Available for sale $ 70 $ 72 $ 71 $ 72 $ 75 $ 142 $ 156 Fixed maturities - Trading - - - - - - 1 Equity securities - dividends 6 8 7 8 8 14 18 Equity securities - MTM 5 23 8 (3) 2 28 5 Equity in investees 51 49 27 27 ( 15) 100 ( 4) AFG managed CLOs 7 5 6 4 - 12 ( 11) Other investments (a) 6 4 4 5 3 10 9 Gross investment income 145 161 123 113 73 306 174 Investment expenses (2) (2) ( 1) (2) (1) ( 4) ( 3) Total net investment income $ 143 $ 159 $ 122 $ 111 $ 72 $ 302 $ 171 Average cash and investments (b) $ 1 2,630 $ 1 2,573 $ 12,135 $ 11,764 $ 11,454 $ 12,539 $ 11,509 4.53% 5.06% 4.02% 3.77% 2.51% 4.82% 2.97% Average yield (c) AFG consolidated net investment income: Property & Casualty core $ 143 $ 159 $ 122 $ 111 $ 72 $ 302 $ 171 Neon exited lines non-core - - - 1 - - ( 6) Equity in Investees (d) 20 29 19 9 9 49 21 Other Investments (d) 2 - 1 1 (2) 2 ( 2) Parent & other 6 5 11 4 9 11 ( 3) Consolidate CLOs (7) (5) ( 6) ( 4) - ( 12) 11 Total net investment income $ 164 $ 188 $ 147 $ 122 $ 88 $ 352 $ 192 (a) Includes income from mortgage loans, real estate, policy loans, short-term investments, and cash equivalents. (b) Average cash and investments is the average of the beginning and ending quarter balances, or the average of the five quarters balances. (c) Average yield is calculated by dividing investment income for the quarter by the average cash and investment balance over the quarter. (d) Investment income on real estate-related assets retained by AFG from the sale of the annuity business. Page 18
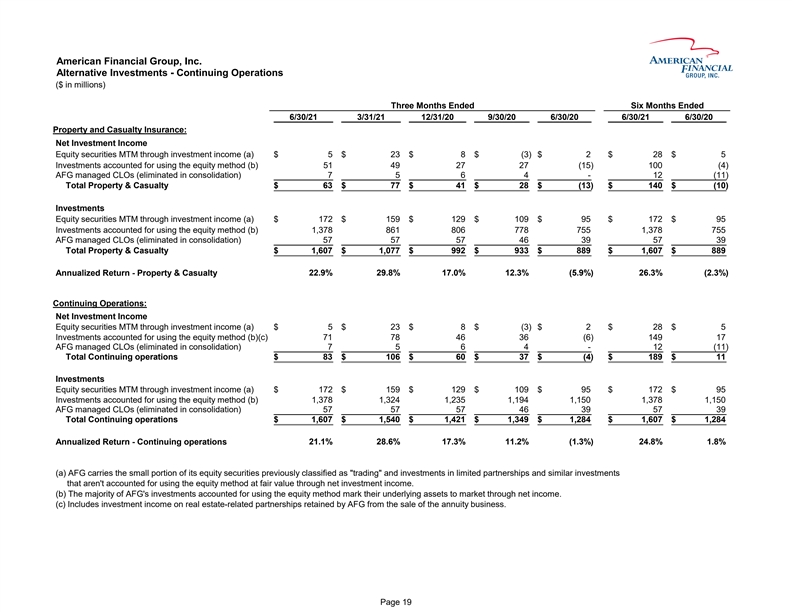
American Financial Group, Inc. Alternative Investments - Continuing Operations ($ in millions) Three Months Ended Six Months Ended 6/30/21 3/31/21 12/31/20 9/30/20 6/30/20 6/30/21 6/30/20 Property and Casualty Insurance: Net Investment Income Equity securities MTM through investment income (a) $ 5 $ 23 $ 8 $ (3) $ 2 $ 28 $ 5 Investments accounted for using the equity method (b) 51 49 27 27 (15) 100 (4) AFG managed CLOs (eliminated in consolidation) 7 5 6 4 - 12 (11) Total Property & Casualty $ 63 $ 77 $ 41 $ 28 $ ( 13) $ 140 $ (10) Investments Equity securities MTM through investment income (a) $ 172 $ 159 $ 129 $ 109 $ 95 $ 172 $ 95 Investments accounted for using the equity method (b) 1,378 861 806 778 755 1,378 755 AFG managed CLOs (eliminated in consolidation) 57 57 57 46 39 57 39 Total Property & Casualty $ 1,607 $ 1,077 $ 992 $ 933 $ 889 $ 1,607 $ 889 Annualized Return - Property & Casualty 22.9% 29.8% 17.0% 12.3% ( 5.9%) 26.3% (2.3%) Continuing Operations: Net Investment Income Equity securities MTM through investment income (a) $ 5 $ 23 $ 8 $ (3) $ 2 $ 28 $ 5 Investments accounted for using the equity method (b)(c) 71 78 46 36 (6) 149 17 AFG managed CLOs (eliminated in consolidation) 7 5 6 4 - 12 (11) Total Continuing operations $ 83 $ 106 $ 60 $ 37 $ (4) $ 189 $ 11 Investments Equity securities MTM through investment income (a) $ 172 $ 159 $ 129 $ 109 $ 95 $ 172 $ 95 Investments accounted for using the equity method (b) 1,378 1,324 1,235 1,194 1,150 1,378 1,150 AFG managed CLOs (eliminated in consolidation) 57 57 57 46 39 57 39 Total Continuing operations $ 1,607 $ 1,540 $ 1,421 $ 1,349 $ 1,284 $ 1,607 $ 1,284 Annualized Return - Continuing operations 21.1% 28.6% 17.3% 11.2% ( 1.3%) 24.8% 1.8% (a) AFG carries the small portion of its equity securities previously classified as trading and investments in limited partnerships and similar investments that aren't accounted for using the equity method at fair value through net investment income. (b) The majority of AFG's investments accounted for using the equity method mark their underlying assets to market through net income. (c) Includes investment income on real estate-related partnerships retained by AFG from the sale of the annuity business. Page 19American Financial Group, Inc. Alternative Investments - Continuing Operations ($ in millions) Three Months Ended Six Months Ended 6/30/21 3/31/21 12/31/20 9/30/20 6/30/20 6/30/21 6/30/20 Property and Casualty Insurance: Net Investment Income Equity securities MTM through investment income (a) $ 5 $ 23 $ 8 $ (3) $ 2 $ 28 $ 5 Investments accounted for using the equity method (b) 51 49 27 27 (15) 100 (4) AFG managed CLOs (eliminated in consolidation) 7 5 6 4 - 12 (11) Total Property & Casualty $ 63 $ 77 $ 41 $ 28 $ ( 13) $ 140 $ (10) Investments Equity securities MTM through investment income (a) $ 172 $ 159 $ 129 $ 109 $ 95 $ 172 $ 95 Investments accounted for using the equity method (b) 1,378 861 806 778 755 1,378 755 AFG managed CLOs (eliminated in consolidation) 57 57 57 46 39 57 39 Total Property & Casualty $ 1,607 $ 1,077 $ 992 $ 933 $ 889 $ 1,607 $ 889 Annualized Return - Property & Casualty 22.9% 29.8% 17.0% 12.3% ( 5.9%) 26.3% (2.3%) Continuing Operations: Net Investment Income Equity securities MTM through investment income (a) $ 5 $ 23 $ 8 $ (3) $ 2 $ 28 $ 5 Investments accounted for using the equity method (b)(c) 71 78 46 36 (6) 149 17 AFG managed CLOs (eliminated in consolidation) 7 5 6 4 - 12 (11) Total Continuing operations $ 83 $ 106 $ 60 $ 37 $ (4) $ 189 $ 11 Investments Equity securities MTM through investment income (a) $ 172 $ 159 $ 129 $ 109 $ 95 $ 172 $ 95 Investments accounted for using the equity method (b) 1,378 1,324 1,235 1,194 1,150 1,378 1,150 AFG managed CLOs (eliminated in consolidation) 57 57 57 46 39 57 39 Total Continuing operations $ 1,607 $ 1,540 $ 1,421 $ 1,349 $ 1,284 $ 1,607 $ 1,284 Annualized Return - Continuing operations 21.1% 28.6% 17.3% 11.2% ( 1.3%) 24.8% 1.8% (a) AFG carries the small portion of its equity securities previously classified as trading and investments in limited partnerships and similar investments that aren't accounted for using the equity method at fair value through net investment income. (b) The majority of AFG's investments accounted for using the equity method mark their underlying assets to market through net income. (c) Includes investment income on real estate-related partnerships retained by AFG from the sale of the annuity business. Page 19
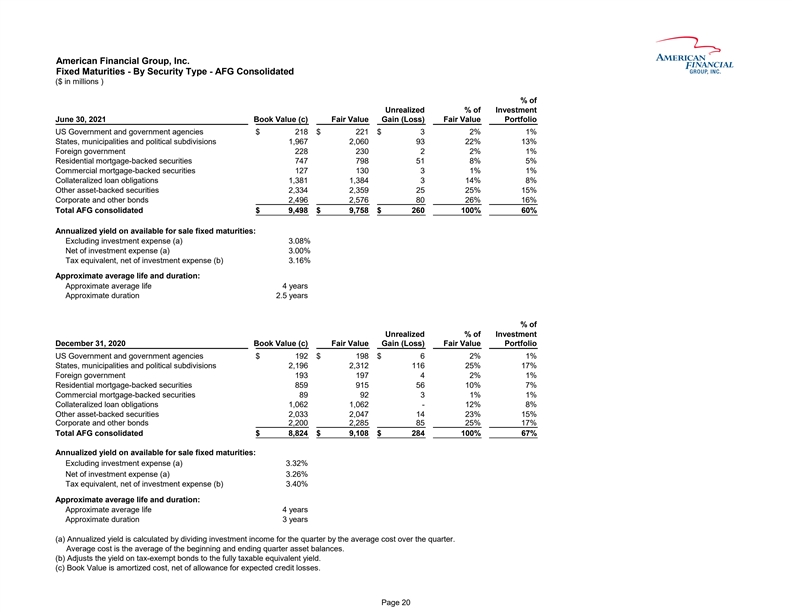
American Financial Group, Inc. Fixed Maturities - By Security Type - AFG Consolidated ($ in millions ) % of Unrealized % of Investment June 30, 2021 Book Value (c) Fair Value Gain (Loss) Fair Value Portfolio US Government and government agencies $ 218 $ 221 $ 3 2 % 1 % States, municipalities and political subdivisions 1,967 2,060 93 2 2% 1 3% Foreign government 228 230 2 2 % 1 % Residential mortgage-backed securities 747 798 51 8 % 5 % Commercial mortgage-backed securities 127 130 3 1 % 1 % Collateralized loan obligations 1,381 1,384 3 1 4% 8 % Other asset-backed securities 2,334 2,359 25 2 5% 1 5% Corporate and other bonds 2,496 2,576 80 26% 16% Total AFG consolidated $ 9,498 $ 9,758 $ 260 100% 60% Annualized yield on available for sale fixed maturities: Excluding investment expense (a) 3.08% Net of investment expense (a) 3.00% Tax equivalent, net of investment expense (b) 3.16% Approximate average life and duration: Approximate average life 4 years Approximate duration 2.5 years % of Unrealized % of Investment December 31, 2020 Book Value (c) Fair Value Gain (Loss) Fair Value Portfolio US Government and government agencies $ 192 $ 198 $ 6 2 % 1 % States, municipalities and political subdivisions 2,196 2,312 116 2 5% 1 7% Foreign government 193 197 4 2 % 1 % Residential mortgage-backed securities 859 915 56 1 0% 7 % Commercial mortgage-backed securities 89 92 3 1 % 1 % Collateralized loan obligations 1,062 1,062 - 1 2% 8 % Other asset-backed securities 2,033 2,047 14 2 3% 1 5% Corporate and other bonds 2,200 2,285 85 25% 17% Total AFG consolidated $ 8,824 $ 9,108 $ 284 100% 67% Annualized yield on available for sale fixed maturities: Excluding investment expense (a) 3.32% Net of investment expense (a) 3.26% Tax equivalent, net of investment expense (b) 3.40% Approximate average life and duration: Approximate average life 4 years Approximate duration 3 years (a) Annualized yield is calculated by dividing investment income for the quarter by the average cost over the quarter. Average cost is the average of the beginning and ending quarter asset balances. (b) Adjusts the yield on tax-exempt bonds to the fully taxable equivalent yield. (c) Book Value is amortized cost, net of allowance for expected credit losses. Page 20American Financial Group, Inc. Fixed Maturities - By Security Type - AFG Consolidated ($ in millions ) % of Unrealized % of Investment June 30, 2021 Book Value (c) Fair Value Gain (Loss) Fair Value Portfolio US Government and government agencies $ 218 $ 221 $ 3 2 % 1 % States, municipalities and political subdivisions 1,967 2,060 93 2 2% 1 3% Foreign government 228 230 2 2 % 1 % Residential mortgage-backed securities 747 798 51 8 % 5 % Commercial mortgage-backed securities 127 130 3 1 % 1 % Collateralized loan obligations 1,381 1,384 3 1 4% 8 % Other asset-backed securities 2,334 2,359 25 2 5% 1 5% Corporate and other bonds 2,496 2,576 80 26% 16% Total AFG consolidated $ 9,498 $ 9,758 $ 260 100% 60% Annualized yield on available for sale fixed maturities: Excluding investment expense (a) 3.08% Net of investment expense (a) 3.00% Tax equivalent, net of investment expense (b) 3.16% Approximate average life and duration: Approximate average life 4 years Approximate duration 2.5 years % of Unrealized % of Investment December 31, 2020 Book Value (c) Fair Value Gain (Loss) Fair Value Portfolio US Government and government agencies $ 192 $ 198 $ 6 2 % 1 % States, municipalities and political subdivisions 2,196 2,312 116 2 5% 1 7% Foreign government 193 197 4 2 % 1 % Residential mortgage-backed securities 859 915 56 1 0% 7 % Commercial mortgage-backed securities 89 92 3 1 % 1 % Collateralized loan obligations 1,062 1,062 - 1 2% 8 % Other asset-backed securities 2,033 2,047 14 2 3% 1 5% Corporate and other bonds 2,200 2,285 85 25% 17% Total AFG consolidated $ 8,824 $ 9,108 $ 284 100% 67% Annualized yield on available for sale fixed maturities: Excluding investment expense (a) 3.32% Net of investment expense (a) 3.26% Tax equivalent, net of investment expense (b) 3.40% Approximate average life and duration: Approximate average life 4 years Approximate duration 3 years (a) Annualized yield is calculated by dividing investment income for the quarter by the average cost over the quarter. Average cost is the average of the beginning and ending quarter asset balances. (b) Adjusts the yield on tax-exempt bonds to the fully taxable equivalent yield. (c) Book Value is amortized cost, net of allowance for expected credit losses. Page 20
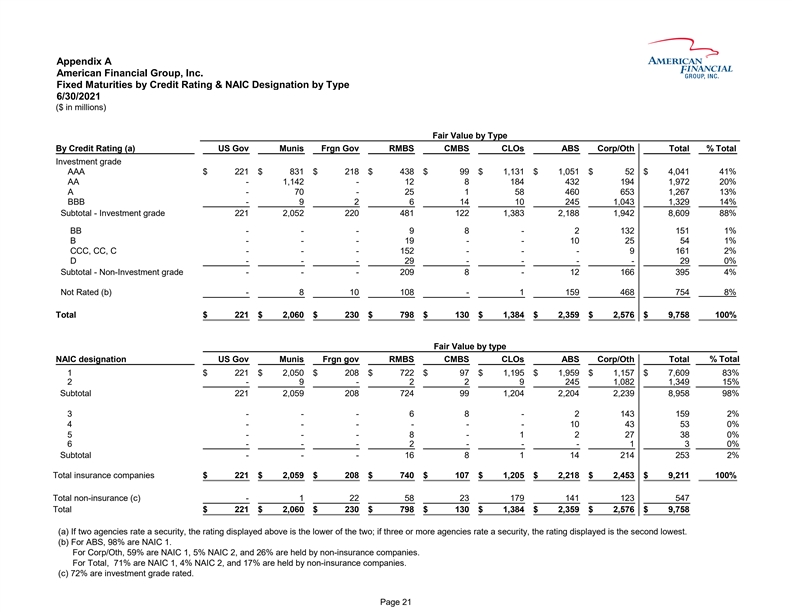
Appendix A American Financial Group, Inc. Fixed Maturities by Credit Rating & NAIC Designation by Type 6/30/2021 ($ in millions) Fair Value by Type By Credit Rating (a) US Gov Munis Frgn Gov RMBS CMBS CLOs ABS Corp/Oth Total % Total Investment grade AAA $ 221 $ 831 $ 218 $ 438 $ 99 $ 1,131 $ 1,051 $ 52 $ 4,041 41% AA - 1,142 - 12 8 184 432 194 1,972 20% A - 70 - 25 1 58 460 653 1,267 13% BBB - 9 2 6 14 10 245 1,043 1,329 14% Subtotal - Investment grade 221 2,052 220 481 122 1,383 2,188 1,942 8,609 88% BB - - - 9 8 - 2 132 151 1% B - - - 19 - - 10 25 54 1% CCC, CC, C - - - 152 - - - 9 161 2% D - - - 29 - - - - 29 0% Subtotal - Non-Investment grade - - - 209 8 - 12 166 395 4% Not Rated (b) - 8 10 108 - 1 159 468 7 54 8% Total $ 221 $ 2,060 $ 230 $ 798 $ 130 $ 1,384 $ 2,359 $ 2,576 $ 9,758 100% Fair Value by type NAIC designation US Gov Munis Frgn gov RMBS CMBS CLOs ABS Corp/Oth Total % Total 1 $ 221 $ 2,050 $ 208 $ 722 $ 97 $ 1,195 $ 1,959 $ 1,157 $ 7,609 83% 2 - 9 - 2 2 9 245 1,082 1,349 15% Subtotal 221 2,059 208 724 99 1,204 2,204 2,239 8,958 98% 3 - - - 6 8 - 2 143 159 2% 4 - - - - - - 10 43 53 0% 5 - - - 8 - 1 2 27 38 0% 6 - - - 2 - - - 1 3 0% Subtotal - - - 16 8 1 14 214 253 2% Total insurance companies $ 221 $ 2,059 $ 208 $ 740 $ 107 $ 1,205 $ 2,218 $ 2,453 $ 9,211 100% Total non-insurance (c) - 1 22 58 23 179 141 123 547 Total $ 221 $ 2,060 $ 230 $ 798 $ 130 $ 1,384 $ 2,359 $ 2,576 $ 9,758 (a) If two agencies rate a security, the rating displayed above is the lower of the two; if three or more agencies rate a security, the rating displayed is the second lowest. (b) For ABS, 98% are NAIC 1. For Corp/Oth, 59% are NAIC 1, 5% NAIC 2, and 26% are held by non-insurance companies. For Total, 71% are NAIC 1, 4% NAIC 2, and 17% are held by non-insurance companies. (c) 72% are investment grade rated. Page 21Appendix A American Financial Group, Inc. Fixed Maturities by Credit Rating & NAIC Designation by Type 6/30/2021 ($ in millions) Fair Value by Type By Credit Rating (a) US Gov Munis Frgn Gov RMBS CMBS CLOs ABS Corp/Oth Total % Total Investment grade AAA $ 221 $ 831 $ 218 $ 438 $ 99 $ 1,131 $ 1,051 $ 52 $ 4,041 41% AA - 1,142 - 12 8 184 432 194 1,972 20% A - 70 - 25 1 58 460 653 1,267 13% BBB - 9 2 6 14 10 245 1,043 1,329 14% Subtotal - Investment grade 221 2,052 220 481 122 1,383 2,188 1,942 8,609 88% BB - - - 9 8 - 2 132 151 1% B - - - 19 - - 10 25 54 1% CCC, CC, C - - - 152 - - - 9 161 2% D - - - 29 - - - - 29 0% Subtotal - Non-Investment grade - - - 209 8 - 12 166 395 4% Not Rated (b) - 8 10 108 - 1 159 468 7 54 8% Total $ 221 $ 2,060 $ 230 $ 798 $ 130 $ 1,384 $ 2,359 $ 2,576 $ 9,758 100% Fair Value by type NAIC designation US Gov Munis Frgn gov RMBS CMBS CLOs ABS Corp/Oth Total % Total 1 $ 221 $ 2,050 $ 208 $ 722 $ 97 $ 1,195 $ 1,959 $ 1,157 $ 7,609 83% 2 - 9 - 2 2 9 245 1,082 1,349 15% Subtotal 221 2,059 208 724 99 1,204 2,204 2,239 8,958 98% 3 - - - 6 8 - 2 143 159 2% 4 - - - - - - 10 43 53 0% 5 - - - 8 - 1 2 27 38 0% 6 - - - 2 - - - 1 3 0% Subtotal - - - 16 8 1 14 214 253 2% Total insurance companies $ 221 $ 2,059 $ 208 $ 740 $ 107 $ 1,205 $ 2,218 $ 2,453 $ 9,211 100% Total non-insurance (c) - 1 22 58 23 179 141 123 547 Total $ 221 $ 2,060 $ 230 $ 798 $ 130 $ 1,384 $ 2,359 $ 2,576 $ 9,758 (a) If two agencies rate a security, the rating displayed above is the lower of the two; if three or more agencies rate a security, the rating displayed is the second lowest. (b) For ABS, 98% are NAIC 1. For Corp/Oth, 59% are NAIC 1, 5% NAIC 2, and 26% are held by non-insurance companies. For Total, 71% are NAIC 1, 4% NAIC 2, and 17% are held by non-insurance companies. (c) 72% are investment grade rated. Page 21
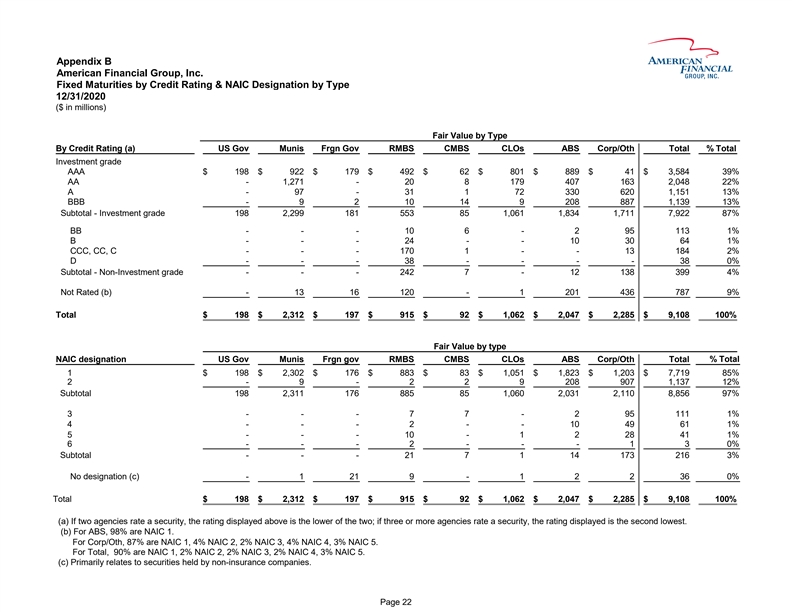
Appendix B American Financial Group, Inc. Fixed Maturities by Credit Rating & NAIC Designation by Type 12/31/2020 ($ in millions) Fair Value by Type By Credit Rating (a) US Gov Munis Frgn Gov RMBS CMBS CLOs ABS Corp/Oth Total % Total Investment grade AAA $ 198 $ 922 $ 179 $ 492 $ 62 $ 801 $ 889 $ 41 $ 3,584 39% AA - 1,271 - 20 8 179 407 163 2,048 22% A - 97 - 31 1 72 330 620 1,151 13% BBB - 9 2 10 14 9 208 887 1,139 13% Subtotal - Investment grade 198 2,299 181 553 85 1,061 1,834 1,711 7,922 87% BB - - - 10 6 - 2 95 113 1% B - - - 24 - - 10 30 64 1% CCC, CC, C - - - 170 1 - - 13 184 2% D - - - 38 - - - - 38 0% Subtotal - Non-Investment grade - - - 242 7 - 12 138 399 4% Not Rated (b) - 13 16 120 - 1 201 4 36 7 87 9% Total $ 198 $ 2,312 $ 197 $ 915 $ 92 $ 1,062 $ 2,047 $ 2,285 $ 9,108 100% Fair Value by type NAIC designation US Gov Munis Frgn gov RMBS CMBS CLOs ABS Corp/Oth Total % Total 1 $ 198 $ 2,302 $ 176 $ 883 $ 83 $ 1,051 $ 1,823 $ 1,203 $ 7,719 85% 2 - 9 - 2 2 9 208 907 1,137 12% Subtotal 198 2,311 176 885 85 1,060 2,031 2,110 8,856 97% 3 - - - 7 7 - 2 95 111 1% 4 - - - 2 - - 10 49 61 1% 5 - - - 10 - 1 2 28 41 1% 6 - - - 2 - - - 1 3 0% Subtotal - - - 21 7 1 14 173 216 3% No designation (c) - 1 21 9 - 1 2 2 36 0% Total $ 198 $ 2,312 $ 197 $ 915 $ 92 $ 1,062 $ 2,047 $ 2,285 $ 9,108 100% (a) If two agencies rate a security, the rating displayed above is the lower of the two; if three or more agencies rate a security, the rating displayed is the second lowest. (b) For ABS, 98% are NAIC 1. For Corp/Oth, 87% are NAIC 1, 4% NAIC 2, 2% NAIC 3, 4% NAIC 4, 3% NAIC 5. For Total, 90% are NAIC 1, 2% NAIC 2, 2% NAIC 3, 2% NAIC 4, 3% NAIC 5. (c) Primarily relates to securities held by non-insurance companies. Page 22
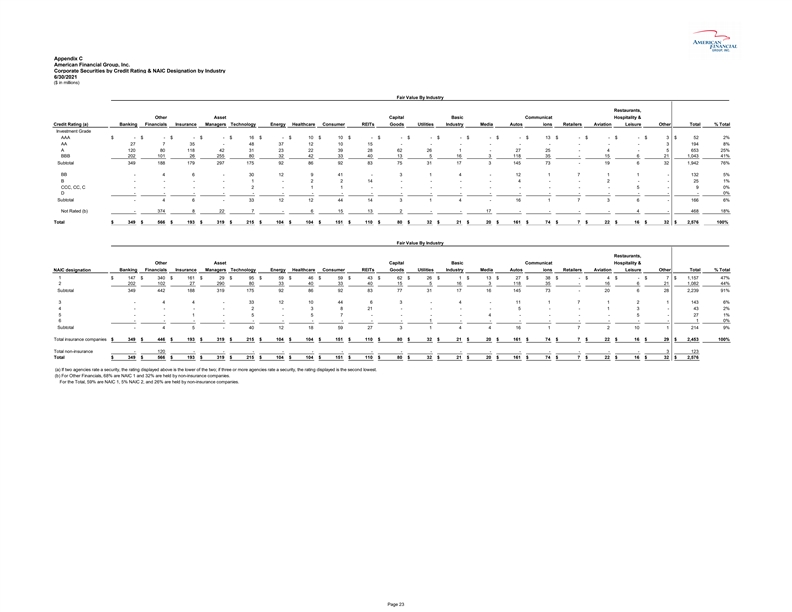
Appendix C American Financial Group, Inc. Corporate Securities by Credit Rating & NAIC Designation by Industry 6/30/2021 ($ in millions) Fair Value By Industry Restaurants, Other Asset Capital Basic Communicat Hospitality & Credit Rating (a) Banking Financials Insurance Managers Technology Energy Healthcare Consumer REITs Goods Utilities Industry Media Autos ions Retailers Aviation Leisure Other Total % Total Investment Grade AAA $ - $ - $ - $ - $ 16 $ - $ 10 $ 10 $ - $ - $ - $ - $ - $ - $ 13 $ - $ - $ - $ 3 $ 52 2% AA 2 7 7 3 5 - 4 8 3 7 1 2 1 0 1 5 - - - - - - - - - 3 194 8% A 1 20 80 1 18 42 31 2 3 22 39 28 62 26 1 - 27 25 - 4 - 5 6 53 25% BBB 202 1 01 26 2 55 80 32 42 33 40 13 5 16 3 1 18 35 - 15 6 21 1 ,043 41% Subtotal 3 49 1 88 1 79 2 97 1 75 92 86 92 83 75 31 17 3 1 45 73 - 19 6 32 1 ,942 76% BB - 4 6 - 30 12 9 41 - 3 1 4 - 12 1 7 1 1 - 1 32 5% B - - - - 1 - 2 2 14 - - - - 4 - - 2 - - 25 1% CCC, CC, C - - - - 2 - 1 1 - - - - - - - - - 5 - 9 0% D - - - - - - - - - - - - - - - - - - - - 0% Subtotal - 4 6 - 33 12 12 44 14 3 1 4 - 16 1 7 3 6 - 1 66 6% Not Rated (b) - 3 74 8 22 7 - 6 15 13 2 - - 17 - - - - 4 - 4 68 18% Total $ 3 49 $ 5 66 $ 1 93 $ 3 19 $ 2 15 $ 1 04 $ 1 04 $ 1 51 $ 1 10 $ 8 0 $ 3 2 $ 2 1 $ 2 0 $ 1 61 $ 74 $ 7 $ 2 2 $ 1 6 $ 32 $ 2 ,576 100% Fair Value By Industry Restaurants, Other Asset Capital Basic Communicat Hospitality & Banking Financials Insurance Managers Technology Energy Healthcare Consumer REITs Goods Utilities Industry Media Autos ions Retailers Aviation Leisure Other Total % Total NAIC designation 1 $ 147 $ 340 $ 161 $ 2 9 $ 95 $ 59 $ 46 $ 59 $ 43 $ 62 $ 26 $ 1 $ 13 $ 27 $ 38 $ - $ 4 $ - $ 7 $ 1,157 47% 2 202 1 02 27 290 80 3 3 4 0 3 3 4 0 1 5 5 16 3 1 18 35 - 1 6 6 21 1 ,082 44% Subtotal 3 49 4 42 1 88 3 19 1 75 9 2 8 6 9 2 8 3 7 7 3 1 1 7 1 6 1 45 73 - 2 0 6 2 8 2,239 91% 3 - 4 4 - 33 1 2 10 44 6 3 - 4 - 11 1 7 1 2 1 1 43 6% 4 - - - - 2 - 3 8 21 - - - - 5 - - 1 3 - 43 2% 5 - - 1 - 5 - 5 7 - - - - 4 - - - - 5 - 27 1% 6 - - - - - - - - - - 1 - - - - - - - - 1 0% Subtotal - 4 5 - 40 12 18 59 27 3 1 4 4 16 1 7 2 10 1 2 14 9% Total insurance companies $ 3 49 $ 4 46 $ 1 93 $ 3 19 $ 2 15 $ 1 04 $ 1 04 $ 1 51 $ 1 10 $ 8 0 $ 3 2 $ 2 1 $ 2 0 $ 1 61 $ 7 4 $ 7 $ 2 2 $ 1 6 $ 2 9 $ 2 ,453 100% Total non-insurance - 1 20 - - - - - - - - - - - - - - - - 3 1 23 Total $ 3 49 $ 5 66 $ 1 93 $ 3 19 $ 2 15 $ 1 04 $ 1 04 $ 1 51 $ 1 10 $ 8 0 $ 3 2 $ 2 1 $ 2 0 $ 1 61 $ 7 4 $ 7 $ 2 2 $ 1 6 $ 3 2 $ 2 ,576 (a) If two agencies rate a security, the rating displayed above is the lower of the two; if three or more agencies rate a security, the rating displayed is the second lowest. (b) For Other Financials, 68% are NAIC 1 and 32% are held by non-insurance companies. For the Total, 59% are NAIC 1, 5% NAIC 2, and 26% are held by non-insurance companies. Page 23Appendix C American Financial Group, Inc. Corporate Securities by Credit Rating & NAIC Designation by Industry 6/30/2021 ($ in millions) Fair Value By Industry Restaurants, Other Asset Capital Basic Communicat Hospitality & Credit Rating (a) Banking Financials Insurance Managers Technology Energy Healthcare Consumer REITs Goods Utilities Industry Media Autos ions Retailers Aviation Leisure Other Total % Total Investment Grade AAA $ - $ - $ - $ - $ 16 $ - $ 10 $ 10 $ - $ - $ - $ - $ - $ - $ 13 $ - $ - $ - $ 3 $ 52 2% AA 2 7 7 3 5 - 4 8 3 7 1 2 1 0 1 5 - - - - - - - - - 3 194 8% A 1 20 80 1 18 42 31 2 3 22 39 28 62 26 1 - 27 25 - 4 - 5 6 53 25% BBB 202 1 01 26 2 55 80 32 42 33 40 13 5 16 3 1 18 35 - 15 6 21 1 ,043 41% Subtotal 3 49 1 88 1 79 2 97 1 75 92 86 92 83 75 31 17 3 1 45 73 - 19 6 32 1 ,942 76% BB - 4 6 - 30 12 9 41 - 3 1 4 - 12 1 7 1 1 - 1 32 5% B - - - - 1 - 2 2 14 - - - - 4 - - 2 - - 25 1% CCC, CC, C - - - - 2 - 1 1 - - - - - - - - - 5 - 9 0% D - - - - - - - - - - - - - - - - - - - - 0% Subtotal - 4 6 - 33 12 12 44 14 3 1 4 - 16 1 7 3 6 - 1 66 6% Not Rated (b) - 3 74 8 22 7 - 6 15 13 2 - - 17 - - - - 4 - 4 68 18% Total $ 3 49 $ 5 66 $ 1 93 $ 3 19 $ 2 15 $ 1 04 $ 1 04 $ 1 51 $ 1 10 $ 8 0 $ 3 2 $ 2 1 $ 2 0 $ 1 61 $ 74 $ 7 $ 2 2 $ 1 6 $ 32 $ 2 ,576 100% Fair Value By Industry Restaurants, Other Asset Capital Basic Communicat Hospitality & Banking Financials Insurance Managers Technology Energy Healthcare Consumer REITs Goods Utilities Industry Media Autos ions Retailers Aviation Leisure Other Total % Total NAIC designation 1 $ 147 $ 340 $ 161 $ 2 9 $ 95 $ 59 $ 46 $ 59 $ 43 $ 62 $ 26 $ 1 $ 13 $ 27 $ 38 $ - $ 4 $ - $ 7 $ 1,157 47% 2 202 1 02 27 290 80 3 3 4 0 3 3 4 0 1 5 5 16 3 1 18 35 - 1 6 6 21 1 ,082 44% Subtotal 3 49 4 42 1 88 3 19 1 75 9 2 8 6 9 2 8 3 7 7 3 1 1 7 1 6 1 45 73 - 2 0 6 2 8 2,239 91% 3 - 4 4 - 33 1 2 10 44 6 3 - 4 - 11 1 7 1 2 1 1 43 6% 4 - - - - 2 - 3 8 21 - - - - 5 - - 1 3 - 43 2% 5 - - 1 - 5 - 5 7 - - - - 4 - - - - 5 - 27 1% 6 - - - - - - - - - - 1 - - - - - - - - 1 0% Subtotal - 4 5 - 40 12 18 59 27 3 1 4 4 16 1 7 2 10 1 2 14 9% Total insurance companies $ 3 49 $ 4 46 $ 1 93 $ 3 19 $ 2 15 $ 1 04 $ 1 04 $ 1 51 $ 1 10 $ 8 0 $ 3 2 $ 2 1 $ 2 0 $ 1 61 $ 7 4 $ 7 $ 2 2 $ 1 6 $ 2 9 $ 2 ,453 100% Total non-insurance - 1 20 - - - - - - - - - - - - - - - - 3 1 23 Total $ 3 49 $ 5 66 $ 1 93 $ 3 19 $ 2 15 $ 1 04 $ 1 04 $ 1 51 $ 1 10 $ 8 0 $ 3 2 $ 2 1 $ 2 0 $ 1 61 $ 7 4 $ 7 $ 2 2 $ 1 6 $ 3 2 $ 2 ,576 (a) If two agencies rate a security, the rating displayed above is the lower of the two; if three or more agencies rate a security, the rating displayed is the second lowest. (b) For Other Financials, 68% are NAIC 1 and 32% are held by non-insurance companies. For the Total, 59% are NAIC 1, 5% NAIC 2, and 26% are held by non-insurance companies. Page 23
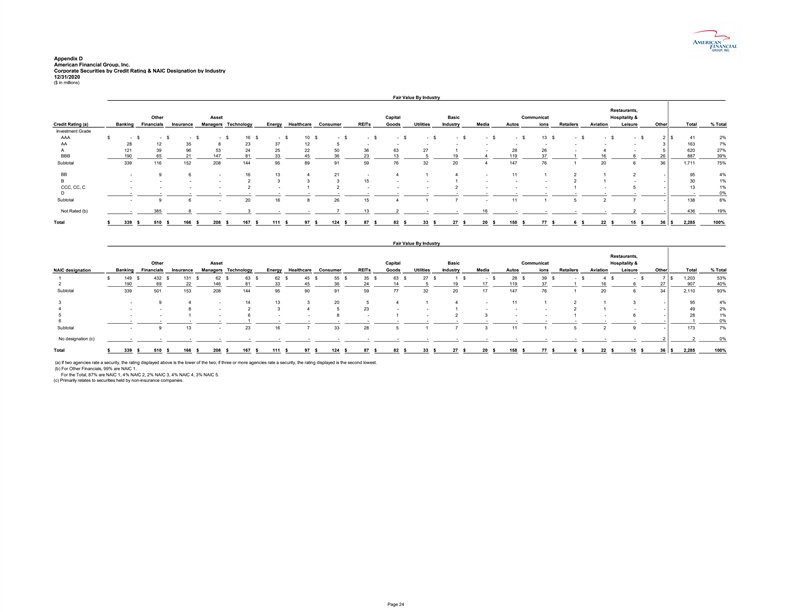
Appendix D American Financial Group, Inc. Corporate Securities by Credit Rating & NAIC Designation by Industry 12/31/2020 ($ in millions) Fair Value By Industry Restaurants, Other Asset Capital Basic Communicat Hospitality & Credit Rating (a) Banking Financials Insurance Managers Technology Energy Healthcare Consumer REITs Goods Utilities Industry Media Autos ions Retailers Aviation Leisure Other Total % Total Investment Grade AAA $ - $ - $ - $ - $ 16 $ - $ 10 $ - $ - $ - $ - $ - $ - $ - $ 13 $ - $ - $ - $ 2 $ 41 2% AA 2 8 1 2 3 5 8 2 3 3 7 1 2 5 - - - - - - - - - - 3 163 7% A 1 21 39 96 53 24 2 5 22 50 36 63 27 1 - 28 26 - 4 - 5 6 20 27% BBB 190 65 21 1 47 81 33 45 36 23 13 5 19 4 1 19 37 1 16 6 26 8 87 39% Subtotal 3 39 1 16 1 52 2 08 1 44 95 89 91 59 76 32 20 4 1 47 76 1 20 6 36 1 ,711 75% BB - 9 6 - 16 13 4 21 - 4 1 4 - 11 1 2 1 2 - 95 4% B - - - - 2 3 3 3 15 - - 1 - - - 2 1 - - 30 1% CCC, CC, C - - - - 2 - 1 2 - - - 2 - - - 1 - 5 - 13 1% D - - - - - - - - - - - - - - - - - - - - 0% Subtotal - 9 6 - 20 16 8 26 15 4 1 7 - 11 1 5 2 7 - 1 38 6% Not Rated (b) - 3 85 8 - 3 - - 7 13 2 - - 16 - - - - 2 - 4 36 19% Total $ 3 39 $ 5 10 $ 1 66 $ 2 08 $ 1 67 $ 1 11 $ 9 7 $ 1 24 $ 8 7 $ 8 2 $ 3 3 $ 2 7 $ 2 0 $ 1 58 $ 7 7 $ 6 $ 2 2 $ 1 5 $ 3 6 $ 2 ,285 100% Fair Value By Industry Restaurants, Other Asset Capital Basic Communicat Hospitality & NAIC designation Banking Financials Insurance Managers Technology Energy Healthcare Consumer REITs Goods Utilities Industry Media Autos ions Retailers Aviation Leisure Other Total % Total 1 $ 149 $ 432 $ 131 $ 6 2 $ 63 $ 62 $ 45 $ 55 $ 35 $ 63 $ 27 $ 1 $ - $ 28 $ 39 $ - $ 4 $ - $ 7 $ 1,203 53% 2 1 90 69 2 2 146 81 3 3 4 5 3 6 2 4 1 4 5 19 1 7 119 37 1 16 6 27 907 40% Subtotal 3 39 5 01 1 53 2 08 1 44 9 5 9 0 9 1 5 9 7 7 3 2 2 0 1 7 1 47 7 6 1 2 0 6 3 4 2,110 93% 3 - 9 4 - 14 1 3 3 20 5 4 1 4 - 11 1 2 1 3 - 95 4% 4 - - 8 - 2 3 4 5 23 - - 1 - - - 2 1 - - 49 2% 5 - - 1 - 6 - - 8 - 1 - 2 3 - - 1 - 6 - 28 1% 6 - - - - 1 - - - - - - - - - - - - - - 1 0% Subtotal - 9 13 - 23 16 7 33 28 5 1 7 3 11 1 5 2 9 - 1 73 7% No designation (c) - - - - - - - - - - - - - - - - - - 2 2 0% Total $ 3 39 $ 5 10 $ 1 66 $ 2 08 $ 1 67 $ 1 11 $ 9 7 $ 1 24 $ 8 7 $ 8 2 $ 3 3 $ 2 7 $ 2 0 $ 1 58 $ 7 7 $ 6 $ 2 2 $ 1 5 $ 3 6 $ 2 ,285 100% (a) If two agencies rate a security, the rating displayed above is the lower of the two; if three or more agencies rate a security, the rating displayed is the second lowest. (b) For Other Financials, 99% are NAIC 1. For the Total, 87% are NAIC 1, 4% NAIC 2, 2% NAIC 3, 4% NAIC 4, 3% NAIC 5. (c) Primarily relates to securities held by non-insurance companies. Page 24Appendix D American Financial Group, Inc. Corporate Securities by Credit Rating & NAIC Designation by Industry 12/31/2020 ($ in millions) Fair Value By Industry Restaurants, Other Asset Capital Basic Communicat Hospitality & Credit Rating (a) Banking Financials Insurance Managers Technology Energy Healthcare Consumer REITs Goods Utilities Industry Media Autos ions Retailers Aviation Leisure Other Total % Total Investment Grade AAA $ - $ - $ - $ - $ 16 $ - $ 10 $ - $ - $ - $ - $ - $ - $ - $ 13 $ - $ - $ - $ 2 $ 41 2% AA 2 8 1 2 3 5 8 2 3 3 7 1 2 5 - - - - - - - - - - 3 163 7% A 1 21 39 96 53 24 2 5 22 50 36 63 27 1 - 28 26 - 4 - 5 6 20 27% BBB 190 65 21 1 47 81 33 45 36 23 13 5 19 4 1 19 37 1 16 6 26 8 87 39% Subtotal 3 39 1 16 1 52 2 08 1 44 95 89 91 59 76 32 20 4 1 47 76 1 20 6 36 1 ,711 75% BB - 9 6 - 16 13 4 21 - 4 1 4 - 11 1 2 1 2 - 95 4% B - - - - 2 3 3 3 15 - - 1 - - - 2 1 - - 30 1% CCC, CC, C - - - - 2 - 1 2 - - - 2 - - - 1 - 5 - 13 1% D - - - - - - - - - - - - - - - - - - - - 0% Subtotal - 9 6 - 20 16 8 26 15 4 1 7 - 11 1 5 2 7 - 1 38 6% Not Rated (b) - 3 85 8 - 3 - - 7 13 2 - - 16 - - - - 2 - 4 36 19% Total $ 3 39 $ 5 10 $ 1 66 $ 2 08 $ 1 67 $ 1 11 $ 9 7 $ 1 24 $ 8 7 $ 8 2 $ 3 3 $ 2 7 $ 2 0 $ 1 58 $ 7 7 $ 6 $ 2 2 $ 1 5 $ 3 6 $ 2 ,285 100% Fair Value By Industry Restaurants, Other Asset Capital Basic Communicat Hospitality & NAIC designation Banking Financials Insurance Managers Technology Energy Healthcare Consumer REITs Goods Utilities Industry Media Autos ions Retailers Aviation Leisure Other Total % Total 1 $ 149 $ 432 $ 131 $ 6 2 $ 63 $ 62 $ 45 $ 55 $ 35 $ 63 $ 27 $ 1 $ - $ 28 $ 39 $ - $ 4 $ - $ 7 $ 1,203 53% 2 1 90 69 2 2 146 81 3 3 4 5 3 6 2 4 1 4 5 19 1 7 119 37 1 16 6 27 907 40% Subtotal 3 39 5 01 1 53 2 08 1 44 9 5 9 0 9 1 5 9 7 7 3 2 2 0 1 7 1 47 7 6 1 2 0 6 3 4 2,110 93% 3 - 9 4 - 14 1 3 3 20 5 4 1 4 - 11 1 2 1 3 - 95 4% 4 - - 8 - 2 3 4 5 23 - - 1 - - - 2 1 - - 49 2% 5 - - 1 - 6 - - 8 - 1 - 2 3 - - 1 - 6 - 28 1% 6 - - - - 1 - - - - - - - - - - - - - - 1 0% Subtotal - 9 13 - 23 16 7 33 28 5 1 7 3 11 1 5 2 9 - 1 73 7% No designation (c) - - - - - - - - - - - - - - - - - - 2 2 0% Total $ 3 39 $ 5 10 $ 1 66 $ 2 08 $ 1 67 $ 1 11 $ 9 7 $ 1 24 $ 8 7 $ 8 2 $ 3 3 $ 2 7 $ 2 0 $ 1 58 $ 7 7 $ 6 $ 2 2 $ 1 5 $ 3 6 $ 2 ,285 100% (a) If two agencies rate a security, the rating displayed above is the lower of the two; if three or more agencies rate a security, the rating displayed is the second lowest. (b) For Other Financials, 99% are NAIC 1. For the Total, 87% are NAIC 1, 4% NAIC 2, 2% NAIC 3, 4% NAIC 4, 3% NAIC 5. (c) Primarily relates to securities held by non-insurance companies. Page 24
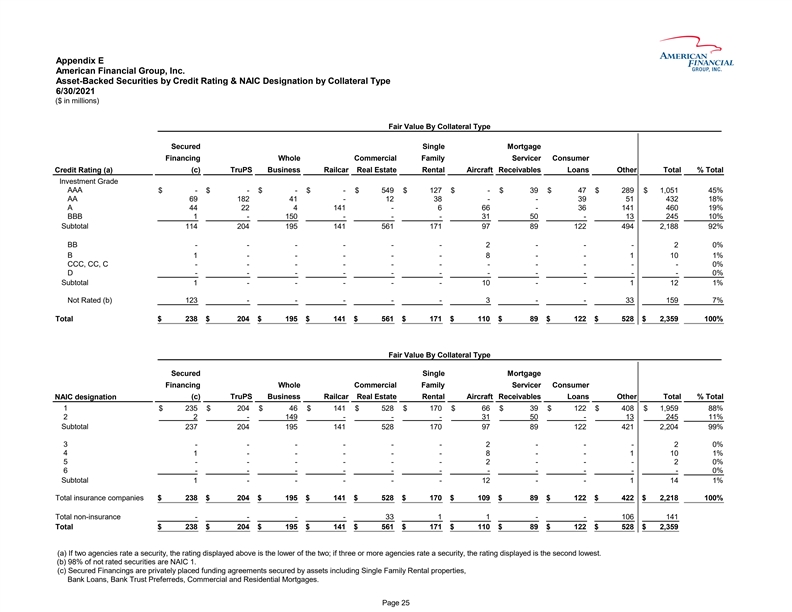
Appendix E American Financial Group, Inc. Asset-Backed Securities by Credit Rating & NAIC Designation by Collateral Type 6/30/2021 ($ in millions) Fair Value By Collateral Type Secured Single Mortgage Financing Whole Commercial Family Servicer Consumer (c) TruPS Business Railcar Real Estate Rental Aircraft Receivables Loans Other Total % Total Credit Rating (a) Investment Grade AAA $ - $ - $ - $ - $ 549 $ 127 $ - $ 3 9 $ 47 $ 289 $ 1,051 45% AA 69 182 41 - 12 38 - - 39 51 432 18% A 44 22 4 141 - 6 66 - 36 141 460 19% BBB 1 - 150 - - - 31 50 - 13 245 10% Subtotal 114 204 195 141 561 171 97 89 122 494 2,188 92% BB - - - - - - 2 - - - 2 0% B 1 - - - - - 8 - - 1 10 1% CCC, CC, C - - - - - - - - - - - 0% D - - - - - - - - - - - 0% Subtotal 1 - - - - - 10 - - 1 12 1% Not Rated (b) 123 - - - - - 3 - - 33 159 7% Total $ 238 $ 204 $ 195 $ 141 $ 561 $ 171 $ 110 $ 89 $ 122 $ 528 $ 2,359 100% Fair Value By Collateral Type Secured Single Mortgage Financing Whole Commercial Family Servicer Consumer NAIC designation (c) TruPS Business Railcar Real Estate Rental Aircraft Receivables Loans Other Total % Total 1 $ 2 35 $ 204 $ 4 6 $ 141 $ 528 $ 170 $ 6 6 $ 39 $ 122 $ 4 08 $ 1,959 88% 2 2 - 149 - - - 31 5 0 - 1 3 2 45 11% Subtotal 237 204 195 141 528 170 97 89 122 421 2,204 99% 3 - - - - - - 2 - - - 2 0% 4 1 - - - - - 8 - - 1 10 1% 5 - - - - - - 2 - - - 2 0% 6 - - - - - - - - - - - 0% Subtotal 1 - - - - - 12 - - 1 14 1% Total insurance companies $ 238 $ 204 $ 195 $ 141 $ 528 $ 170 $ 109 $ 89 $ 122 $ 422 $ 2,218 100% Total non-insurance - - - - 33 1 1 - - 106 141 Total $ 238 $ 204 $ 195 $ 141 $ 561 $ 171 $ 110 $ 89 $ 122 $ 528 $ 2,359 (a) If two agencies rate a security, the rating displayed above is the lower of the two; if three or more agencies rate a security, the rating displayed is the second lowest. (b) 98% of not rated securities are NAIC 1. (c) Secured Financings are privately placed funding agreements secured by assets including Single Family Rental properties, Bank Loans, Bank Trust Preferreds, Commercial and Residential Mortgages. Page 25Appendix E American Financial Group, Inc. Asset-Backed Securities by Credit Rating & NAIC Designation by Collateral Type 6/30/2021 ($ in millions) Fair Value By Collateral Type Secured Single Mortgage Financing Whole Commercial Family Servicer Consumer (c) TruPS Business Railcar Real Estate Rental Aircraft Receivables Loans Other Total % Total Credit Rating (a) Investment Grade AAA $ - $ - $ - $ - $ 549 $ 127 $ - $ 3 9 $ 47 $ 289 $ 1,051 45% AA 69 182 41 - 12 38 - - 39 51 432 18% A 44 22 4 141 - 6 66 - 36 141 460 19% BBB 1 - 150 - - - 31 50 - 13 245 10% Subtotal 114 204 195 141 561 171 97 89 122 494 2,188 92% BB - - - - - - 2 - - - 2 0% B 1 - - - - - 8 - - 1 10 1% CCC, CC, C - - - - - - - - - - - 0% D - - - - - - - - - - - 0% Subtotal 1 - - - - - 10 - - 1 12 1% Not Rated (b) 123 - - - - - 3 - - 33 159 7% Total $ 238 $ 204 $ 195 $ 141 $ 561 $ 171 $ 110 $ 89 $ 122 $ 528 $ 2,359 100% Fair Value By Collateral Type Secured Single Mortgage Financing Whole Commercial Family Servicer Consumer NAIC designation (c) TruPS Business Railcar Real Estate Rental Aircraft Receivables Loans Other Total % Total 1 $ 2 35 $ 204 $ 4 6 $ 141 $ 528 $ 170 $ 6 6 $ 39 $ 122 $ 4 08 $ 1,959 88% 2 2 - 149 - - - 31 5 0 - 1 3 2 45 11% Subtotal 237 204 195 141 528 170 97 89 122 421 2,204 99% 3 - - - - - - 2 - - - 2 0% 4 1 - - - - - 8 - - 1 10 1% 5 - - - - - - 2 - - - 2 0% 6 - - - - - - - - - - - 0% Subtotal 1 - - - - - 12 - - 1 14 1% Total insurance companies $ 238 $ 204 $ 195 $ 141 $ 528 $ 170 $ 109 $ 89 $ 122 $ 422 $ 2,218 100% Total non-insurance - - - - 33 1 1 - - 106 141 Total $ 238 $ 204 $ 195 $ 141 $ 561 $ 171 $ 110 $ 89 $ 122 $ 528 $ 2,359 (a) If two agencies rate a security, the rating displayed above is the lower of the two; if three or more agencies rate a security, the rating displayed is the second lowest. (b) 98% of not rated securities are NAIC 1. (c) Secured Financings are privately placed funding agreements secured by assets including Single Family Rental properties, Bank Loans, Bank Trust Preferreds, Commercial and Residential Mortgages. Page 25
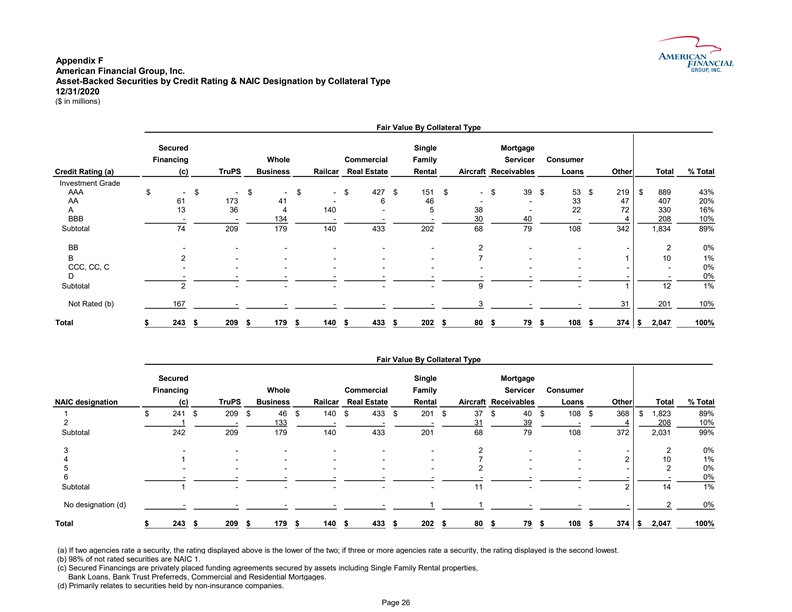
Appendix F American Financial Group, Inc. Asset-Backed Securities by Credit Rating & NAIC Designation by Collateral Type 12/31/2020 ($ in millions) Fair Value By Collateral Type Secured Single Mortgage Financing Whole Commercial Family Servicer Consumer Credit Rating (a) (c) TruPS Business Railcar Real Estate Rental Aircraft Receivables Loans Other Total % Total Investment Grade AAA $ - $ - $ - $ - $ 4 27 $ 1 51 $ - $ 39 $ 53 $ 219 $ 8 89 43% AA 61 173 4 1 - 6 46 - - 3 3 47 407 20% A 13 36 4 140 - 5 38 - 2 2 72 330 16% BBB - - 134 - - - 3 0 40 - 4 208 10% Subtotal 74 209 179 140 433 202 6 8 79 108 3 42 1,834 89% BB - - - - - - 2 - - - 2 0% B 2 - - - - - 7 - - 1 10 1% CCC, CC, C - - - - - - - - - - - 0% D - - - - - - - - - - - 0% Subtotal 2 - - - - - 9 - - 1 12 1% Not Rated (b) 167 - - - - - 3 - - 31 201 10% Total $ 243 $ 2 09 $ 179 $ 140 $ 433 $ 202 $ 80 $ 79 $ 108 $ 3 74 $ 2,047 100% Fair Value By Collateral Type Secured Single Mortgage Financing Whole Commercial Family Servicer Consumer NAIC designation (c) TruPS Business Railcar Real Estate Rental Aircraft Receivables Loans Other Total % Total 1 $ 241 $ 209 $ 4 6 $ 140 $ 433 $ 2 01 $ 3 7 $ 40 $ 1 08 $ 3 68 $ 1 ,823 89% 2 1 - 133 - - - 31 3 9 - 4 2 08 10% Subtotal 2 42 2 09 179 140 4 33 201 68 79 1 08 3 72 2,031 99% 3 - - - - - - 2 - - - 2 0% 4 1 - - - - - 7 - - 2 10 1% 5 - - - - - - 2 - - - 2 0% 6 - - - - - - - - - - - 0% Subtotal 1 - - - - - 11 - - 2 14 1% No designation (d) - - - - - 1 1 - - - 2 0% Total $ 243 $ 2 09 $ 179 $ 140 $ 433 $ 202 $ 80 $ 79 $ 108 $ 3 74 $ 2,047 100% (a) If two agencies rate a security, the rating displayed above is the lower of the two; if three or more agencies rate a security, the rating displayed is the second lowest. (b) 98% of not rated securities are NAIC 1. (c) Secured Financings are privately placed funding agreements secured by assets including Single Family Rental properties, Bank Loans, Bank Trust Preferreds, Commercial and Residential Mortgages. (d) Primarily relates to securities held by non-insurance companies. Page 26Appendix F American Financial Group, Inc. Asset-Backed Securities by Credit Rating & NAIC Designation by Collateral Type 12/31/2020 ($ in millions) Fair Value By Collateral Type Secured Single Mortgage Financing Whole Commercial Family Servicer Consumer Credit Rating (a) (c) TruPS Business Railcar Real Estate Rental Aircraft Receivables Loans Other Total % Total Investment Grade AAA $ - $ - $ - $ - $ 4 27 $ 1 51 $ - $ 39 $ 53 $ 219 $ 8 89 43% AA 61 173 4 1 - 6 46 - - 3 3 47 407 20% A 13 36 4 140 - 5 38 - 2 2 72 330 16% BBB - - 134 - - - 3 0 40 - 4 208 10% Subtotal 74 209 179 140 433 202 6 8 79 108 3 42 1,834 89% BB - - - - - - 2 - - - 2 0% B 2 - - - - - 7 - - 1 10 1% CCC, CC, C - - - - - - - - - - - 0% D - - - - - - - - - - - 0% Subtotal 2 - - - - - 9 - - 1 12 1% Not Rated (b) 167 - - - - - 3 - - 31 201 10% Total $ 243 $ 2 09 $ 179 $ 140 $ 433 $ 202 $ 80 $ 79 $ 108 $ 3 74 $ 2,047 100% Fair Value By Collateral Type Secured Single Mortgage Financing Whole Commercial Family Servicer Consumer NAIC designation (c) TruPS Business Railcar Real Estate Rental Aircraft Receivables Loans Other Total % Total 1 $ 241 $ 209 $ 4 6 $ 140 $ 433 $ 2 01 $ 3 7 $ 40 $ 1 08 $ 3 68 $ 1 ,823 89% 2 1 - 133 - - - 31 3 9 - 4 2 08 10% Subtotal 2 42 2 09 179 140 4 33 201 68 79 1 08 3 72 2,031 99% 3 - - - - - - 2 - - - 2 0% 4 1 - - - - - 7 - - 2 10 1% 5 - - - - - - 2 - - - 2 0% 6 - - - - - - - - - - - 0% Subtotal 1 - - - - - 11 - - 2 14 1% No designation (d) - - - - - 1 1 - - - 2 0% Total $ 243 $ 2 09 $ 179 $ 140 $ 433 $ 202 $ 80 $ 79 $ 108 $ 3 74 $ 2,047 100% (a) If two agencies rate a security, the rating displayed above is the lower of the two; if three or more agencies rate a security, the rating displayed is the second lowest. (b) 98% of not rated securities are NAIC 1. (c) Secured Financings are privately placed funding agreements secured by assets including Single Family Rental properties, Bank Loans, Bank Trust Preferreds, Commercial and Residential Mortgages. (d) Primarily relates to securities held by non-insurance companies. Page 26
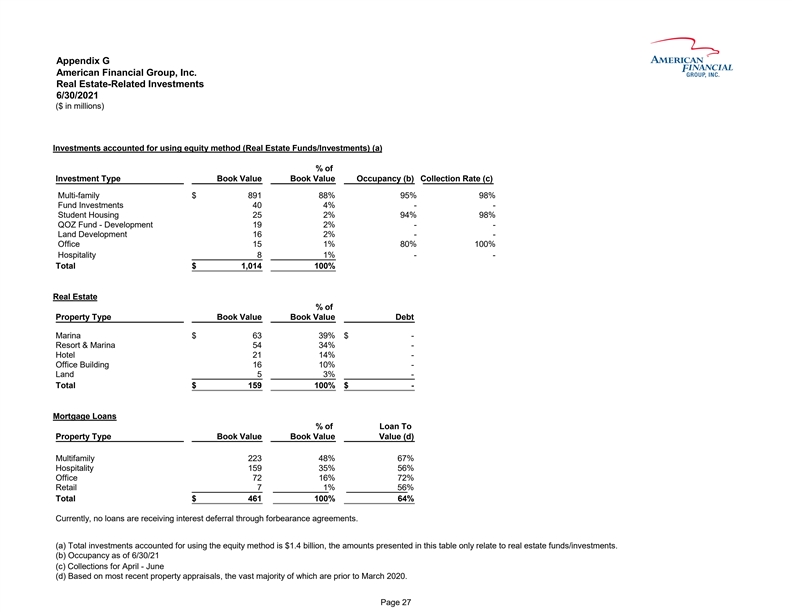
Appendix G American Financial Group, Inc. Real Estate-Related Investments 6/30/2021 ($ in millions) Investments accounted for using equity method (Real Estate Funds/Investments) (a) % of Investment Type Book Value Book Value Occupancy (b) Collection Rate (c) Multi-family $ 891 88% 95% 98% Fund Investments 40 4% - - Student Housing 25 2% 94% 98% QOZ Fund - Development 19 2% - - Land Development 16 2% - - Office 15 1% 80% 100% Hospitality 8 1% - - Total $ 1,014 100% Real Estate % of Property Type Book Value Book Value Debt Marina $ 63 39% $ - Resort & Marina 54 34% - Hotel 21 14% - Office Building 16 10% - Land 5 3% - Total $ 159 100% $ - Mortgage Loans % of Loan To Property Type Book Value Book Value Value (d) Multifamily 223 48% 67% Hospitality 159 35% 56% Office 72 16% 72% Retail 7 1% 56% Total $ 461 100% 64% Currently, no loans are receiving interest deferral through forbearance agreements. (a) Total investments accounted for using the equity method is $1.4 billion, the amounts presented in this table only relate to real estate funds/investments. (b) Occupancy as of 6/30/21 (c) Collections for April - June (d) Based on most recent property appraisals, the vast majority of which are prior to March 2020. Page 27Appendix G American Financial Group, Inc. Real Estate-Related Investments 6/30/2021 ($ in millions) Investments accounted for using equity method (Real Estate Funds/Investments) (a) % of Investment Type Book Value Book Value Occupancy (b) Collection Rate (c) Multi-family $ 891 88% 95% 98% Fund Investments 40 4% - - Student Housing 25 2% 94% 98% QOZ Fund - Development 19 2% - - Land Development 16 2% - - Office 15 1% 80% 100% Hospitality 8 1% - - Total $ 1,014 100% Real Estate % of Property Type Book Value Book Value Debt Marina $ 63 39% $ - Resort & Marina 54 34% - Hotel 21 14% - Office Building 16 10% - Land 5 3% - Total $ 159 100% $ - Mortgage Loans % of Loan To Property Type Book Value Book Value Value (d) Multifamily 223 48% 67% Hospitality 159 35% 56% Office 72 16% 72% Retail 7 1% 56% Total $ 461 100% 64% Currently, no loans are receiving interest deferral through forbearance agreements. (a) Total investments accounted for using the equity method is $1.4 billion, the amounts presented in this table only relate to real estate funds/investments. (b) Occupancy as of 6/30/21 (c) Collections for April - June (d) Based on most recent property appraisals, the vast majority of which are prior to March 2020. Page 27
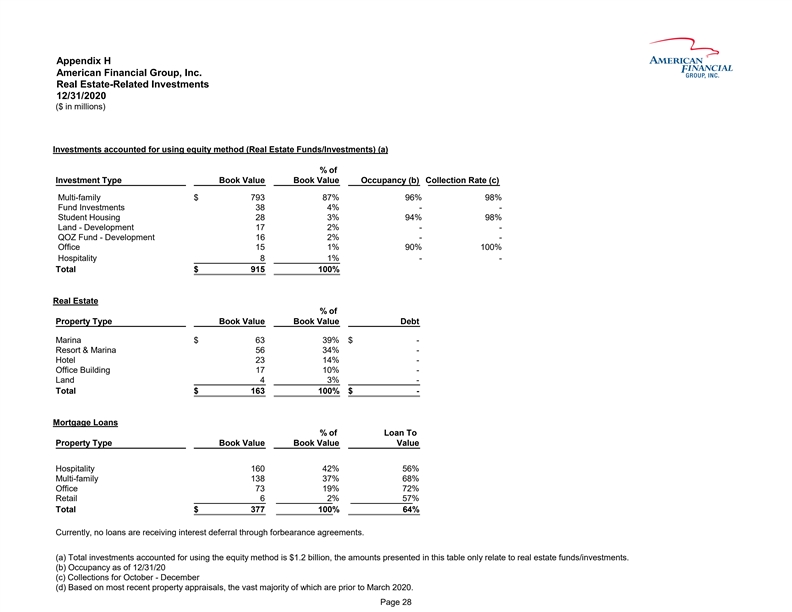
Appendix H American Financial Group, Inc. Real Estate-Related Investments 12/31/2020 ($ in millions) Investments accounted for using equity method (Real Estate Funds/Investments) (a) % of Investment Type Book Value Book Value Occupancy (b) Collection Rate (c) Multi-family $ 7 93 87% 96% 98% Fund Investments 38 4% - - Student Housing 28 3% 94% 98% Land - Development 17 2% - - QOZ Fund - Development 16 2% - - Office 15 1% 90% 100% Hospitality 8 1% - - Total $ 9 15 100% Real Estate % of Property Type Book Value Book Value Debt Marina $ 6 3 39% $ - Resort & Marina 56 34% - Hotel 23 14% - Office Building 17 10% - Land 4 3% - Total $ 1 63 100% $ - Mortgage Loans % of Loan To Property Type Book Value Book Value Value Hospitality 160 42% 56% Multi-family 138 37% 68% Office 73 19% 72% Retail 6 2% 57% Total $ 3 77 100% 64% Currently, no loans are receiving interest deferral through forbearance agreements. (a) Total investments accounted for using the equity method is $1.2 billion, the amounts presented in this table only relate to real estate funds/investments. (b) Occupancy as of 12/31/20 (c) Collections for October - December (d) Based on most recent property appraisals, the vast majority of which are prior to March 2020. Page 28