Attached files
| file | filename |
|---|---|
| 8-K - FORM 8-K - QCR HOLDINGS INC | f8k_073021.htm |
Exhibit 99.1
Investor Presentation Updated July 31, 2021
A number of factors, many of which are beyond the ability of the Company to control or predict, could cause actual results to differ materially from those in its forward - looking statements. These factors include, among others, the following: (i) the strength of the local, state, national and international economies (including the impact of the new presidential administration; (ii) the economic impact of any future terrorist threats and attacks, widespread disease or pandemics (including the COVID - 19 pandemic in the United States), acts of war or threats thereof, or other adverse external events that could cause economic deterioration or instability in credit markets, and the response of the local, state and national governments to any such adverse external events; (iii) changes in accounting policies and practices as may be adopted by the state and federal regulatory agencies, the FASB, the Securities Exchange Commission, or the PCAOB, including FASB’s CECL impairment standards; (iv) changes in state and federal laws, regulations and governmental policies concerning the Company’s general business; (v) changes in interest rates and prepayment rates of the Company’s assets (including the impact of LIBOR phase - out); (vi) increased competition in the financial services sector and the inability to attract new customers; (vii) changes in technology and the ability to develop and maintain secure and reliable electronic systems; (viii) unexpected results of acquisitions, which may include failure to realize the anticipated benefits of acquisitions and the possibility that transaction costs may be greater than anticipated; (ix) the loss of key executives or employees; (x) changes in consumer spending; (xi) unexpected outcomes of existing or new litigation involving the Company; (xii) the economic impact of exceptional weather occurrence, such as tornados, floods and blizzards, and; (xiii) the ability of the Company to manage the risks associated with the foregoing as well as anticipated. These risks and uncertainties should be considered in evaluating forward - looking statements and undue reliance should not be placed on such statements. Additional information concerning the Company and its business, including additional factors that could materially affect the Company’s financial results, is included in the Company’s filings with the Securities and Exchange Commission. NON - GAAP FINANCIAL MEASURES These slides contain non - GAAP financial measures. For purposes of Regulation G, a non - GAAP financial measure is a numerical measure of the registrant ’ s historical or future financial performance, financial position or cash flows that excludes amounts, or is subject to adjustments that have the effect of excluding amounts, that are included in the most directly comparable measure calculated and presented in accordance with GAAP in the statement of income, balance sheet or statement of cash flows (or equivalent statements) of the issuer; or includes amounts, or is subject to adjustments that have the effect of including amounts, that are excluded from the most directly comparable measure so calculated and presented. In this regard, GAAP refers to generally accepted accounting principles in the United States. Pursuant to the requirement of Regulation G, the Company has provided reconciliations within the slides, as necessary, of the non - GAAP financial measure to the most directly comparable GAAP financial measure. For more details on the Company’s non - GAAP measures, refer to the Company’s Annual Report on Form 10 - K for the year ended December 31, 2020. FORWARD - LOOKING STATEMENTS
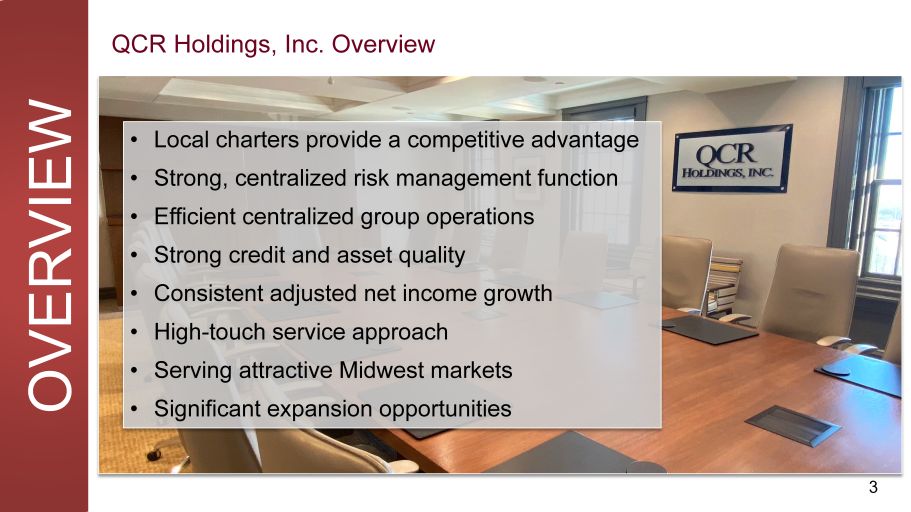
• Local charters provide a competitive advantage • Strong, centralized risk management function • Efficient centralized group operations • Strong credit and asset quality • Consistent adjusted net income growth • High - touch service approach • Serving attractive Midwest markets • Significant expansion opportunities OVE R VIEW QCR Holdings, Inc. Overview 3
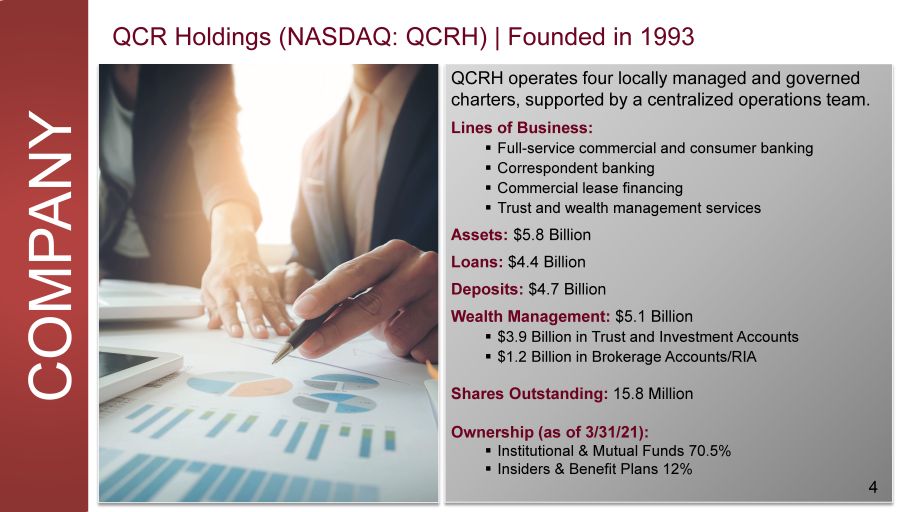
QCRH operates four locally managed and governed charters, supported by a centralized operations team. Lines of Business: ▪ Full - service commercial and consumer banking ▪ Correspondent banking ▪ Commercial lease financing ▪ Trust and wealth management services Assets: $5.8 Billion Loans: $4.4 Billion Deposits: $4.7 Billion Wealth Management: $5.1 Billion ▪ $3.9 Billion in Trust and Investment Accounts ▪ $1.2 Billion in Brokerage Accounts/RIA Shares Outstanding: 15.8 Million Ownership (as of 3/31/21): ▪ Institutional & Mutual Funds 70.5% ▪ Insiders & Benefit Plans 12% 4 QCR Holdings (NASDAQ: QCRH) | Founded in 1993 COM P ANY
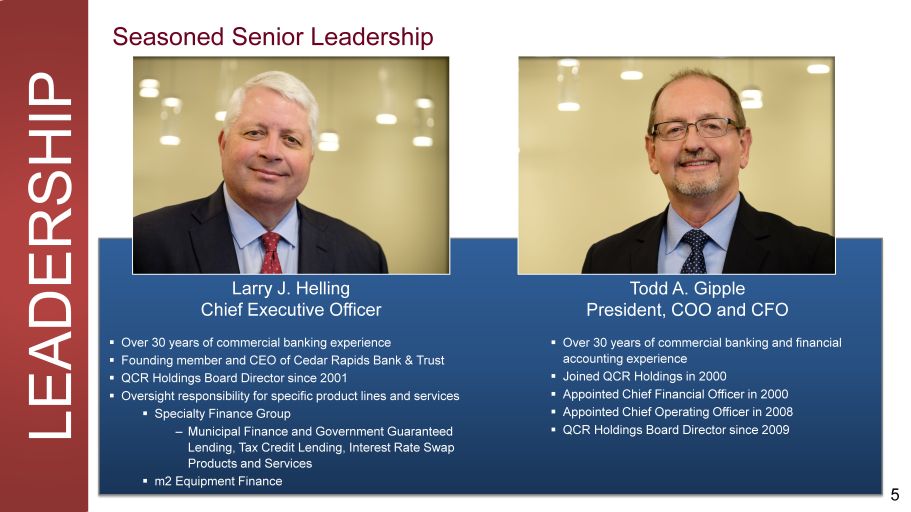
5 T odd A . G i pp l e President, COO and CFO ▪ Over 30 years of commercial banking and financial accounting experience ▪ Joined QCR Holdings in 2000 ▪ Appointed Chief Financial Officer in 2000 ▪ Appointed Chief Operating Officer in 2008 ▪ QCR Holdings Board Director since 2009 Larry J. Helling Chief Executive Officer ▪ Over 30 years of commercial banking experience ▪ Founding member and CEO of Cedar Rapids Bank & Trust ▪ QCR Holdings Board Director since 2001 ▪ Oversight responsibility for specific product lines and services ▪ Specialty Finance Group – Municipal Finance and Government Guaranteed Lending, Tax Credit Lending, Interest Rate Swap Products and Services ▪ m 2 Equipment Finance LEADERSHIP Seasoned Senior Leadership
WHO WE ARE Our Mission, Vision and Values 6 Our Vision Exceptional people providing extraordinary performance for our clients, shareholders and comm u ni t i e s. Our Mission We make financial dreams a reality. Our Values PASSION | We care. ACHIEVEMENT | We expect to win. ACCOUNTABILITY | We drive it. COLLABORATION | We work together. INNOVATION | We embrace change. INCLUSION | We respect all.
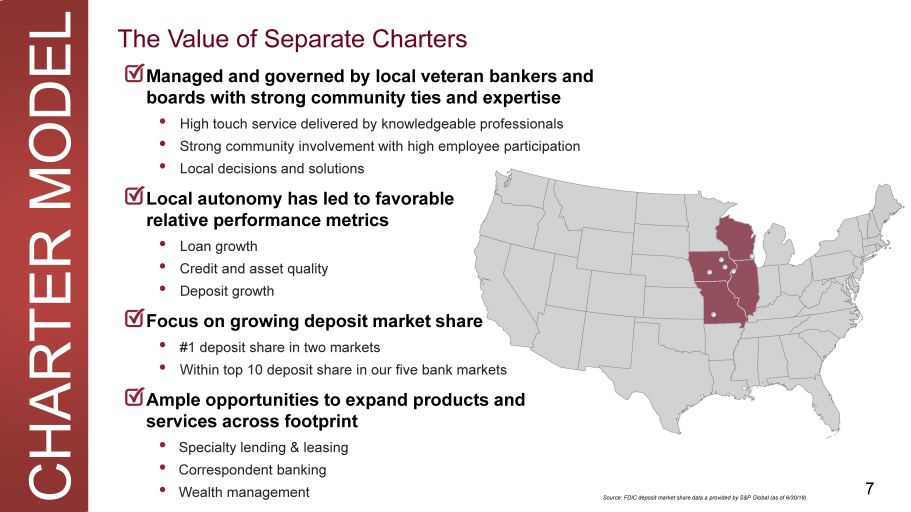
The Value of Separate Charters Source: FDIC deposit market share data a provided by S&P Global (as of 6/30/19). Managed and governed by local veteran bankers and boards with strong community ties and expertise • High touch service delivered by knowledgeable professionals • Strong community involvement with high employee participation • Local decisions and solutions Local autonomy has led to favorable relative performance metrics • Loan growth • Credit and asset quality • Deposit growth Focus on growing deposit market share • #1 deposit share in two markets • Within top 10 deposit share in our five bank markets Ample opportunities to expand products and services across footprint • Specialty lending & leasing • Correspondent banking • Wealth management CHARTER MODEL 7
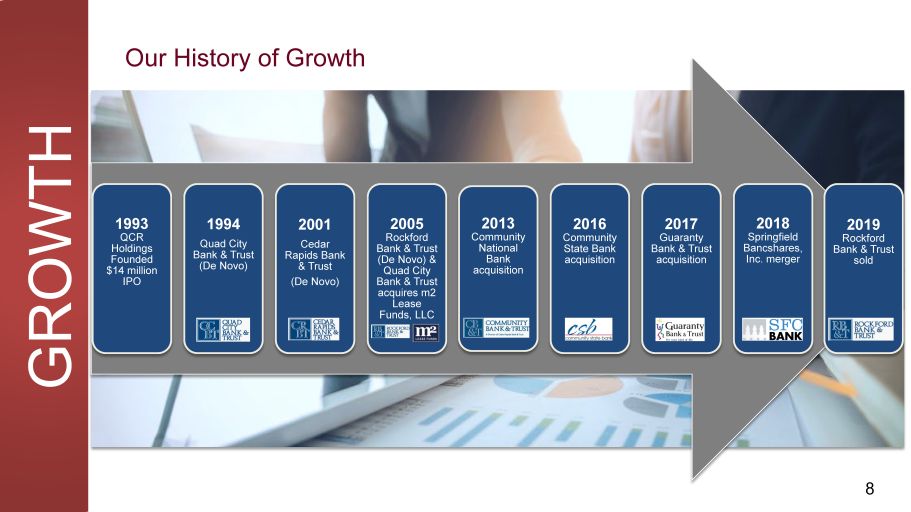
8 1993 QCR Holdings F ounded $14 million IPO 1994 Quad City Bank & Trust (De Novo) 2001 Cedar Rapids Bank & Trust (De Novo) 2005 Rockford Bank & Trust (De Novo) & Quad City Bank & Trust acquires m2 Lease Funds, LLC 2013 C o mm un i ty National Bank acquisition 2016 C o mm un i ty State Bank acquisition 2017 Guaranty Bank & Trust acquisition 2018 Springfield Ban c sha r e s , Inc. merger 2019 Rockford Bank & Trust sold Our History of Growth GROWTH
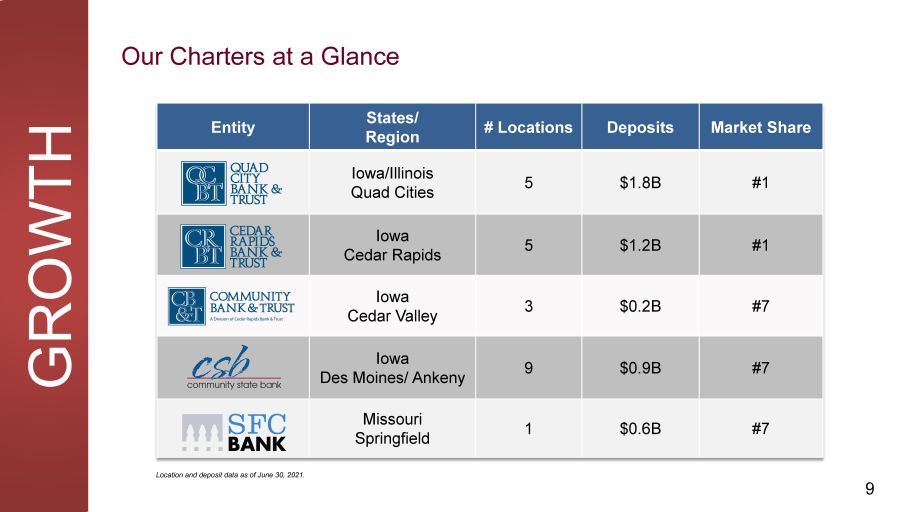
9 GROWTH Our Charters at a Glance Entity States/ R e gion # Locations Deposits Market Share Iowa/Illinois Quad Cities 5 $1.8B #1 Iowa Cedar Rapids 5 $1.2B #1 Iowa Cedar Valley 3 $0.2B #7 Iowa Des Moines/ Ankeny 9 $0.9B #7 Missouri S p r i ng f i e l d 1 $0.6B #7 Location and deposit data as of June 30, 2021.
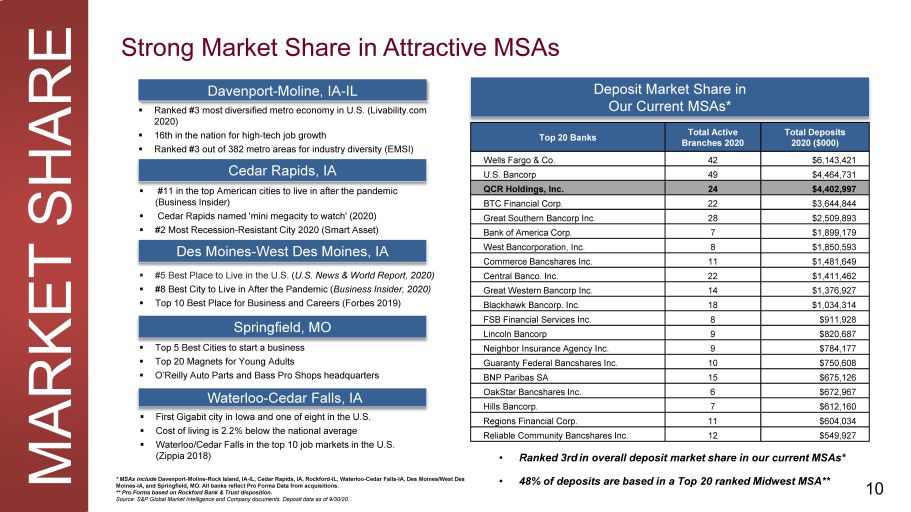
Strong Market Share in Attractive MSAs * MSAs include Davenport - Moline - Rock Island, IA - IL, Cedar Rapids, IA, Rockford - IL, Waterloo - Cedar Falls - IA, Des Moines/West Des Moines - IA, and Springfield, MO. All banks reflect Pro Forma Data from acquisitions. ** Pro Forma based on Rockford Bank & Trust disposition. Source: S&P Global Market Intelligence and Company documents. Deposit data as of 9/30/20. Davenport - Moline, IA - IL Cedar Rapids, IA Des Moines - West Des Moines, IA Springfield, MO Waterloo - Cedar Falls, IA ▪ Ranked #3 most diversified metro economy in U.S. (Livability.com 2020) ▪ 16th in the nation for high - tech job growth ▪ Ranked #3 out of 382 metro areas for industry diversity (EMSI) ▪ #11 in the top American cities to live in after the pandemic (Business Insider) ▪ Cedar Rapids named 'mini megacity to watch' (2020) ▪ #2 Most Recession - Resistant City 2020 (Smart Asset) ▪ #5 Best Place to Live in the U.S . ( U.S. News & World Report, 2020) ▪ #8 Best City to Live in After the Pandemic ( Business Insider, 2020) ▪ Top 10 Best Place for Business and Careers (Forbes 2019) ▪ Top 5 Best Cities to start a business ▪ Top 20 Magnets for Young Adults ▪ O’Reilly Auto Parts and Bass Pro Shops headquarters ▪ First Gigabit city in Iowa and one of eight in the U.S. ▪ Cost of living is 2.2% below the national average ▪ Waterloo/Cedar Falls in the top 10 job markets in the U.S. (Zippia 2018) Deposit Market Share in Our Current MSAs* • Ranked 3rd in overall deposit market share in our current MSAs* • 48% of deposits are based in a Top 20 ranked Midwest MSA** Top 20 Banks Total Active B ra n c h e s 2020 T ot a l D e po si ts 2020 ($000) Wells Fargo & Co. 42 $6,143,421 U.S. Bancorp 49 $4,464,731 QCR Holdings, Inc. 24 $4,402,997 BTC Financial Corp. 22 $3,644,844 Great Southern Bancorp Inc. 28 $2,509,893 Bank of America Corp. 7 $1,899,179 West Bancorporation, Inc. 8 $1,850,593 Commerce Bancshares Inc. 11 $1,481,649 Central Banco. Inc. 22 $1,411,462 Great Western Bancorp Inc. 14 $1,376,927 Blackhawk Bancorp. Inc. 18 $1,034,314 FSB Financial Services Inc. 8 $911,928 Lincoln Bancorp 9 $820,687 Neighbor Insurance Agency Inc. 9 $784,177 Guaranty Federal Bancshares Inc. 10 $750,608 BNP Paribas SA 15 $675,126 OakStar Bancshares Inc. 6 $672,967 Hills Bancorp. 7 $612,160 Regions Financial Corp. 11 $604,034 Reliable Community Bancshares Inc. 12 $549,927 MARKET SHARE 10
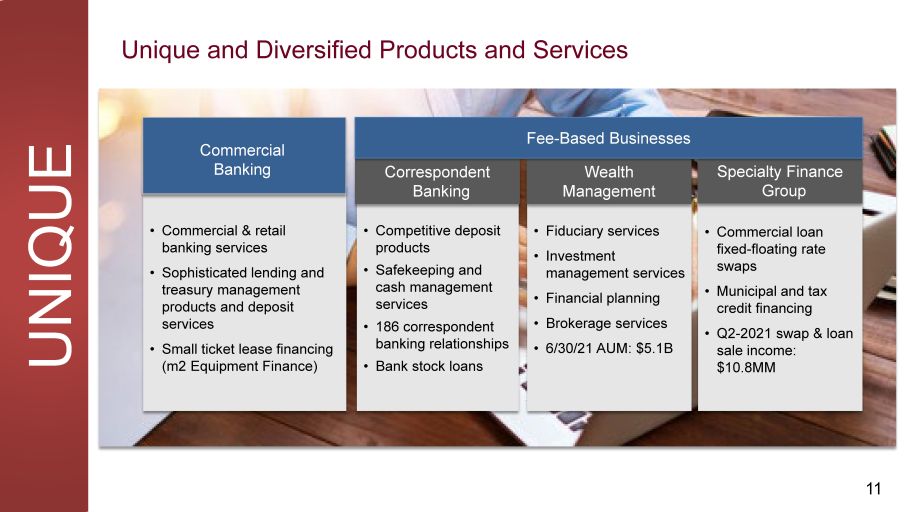
Unique and Diversified Products and Services • Fiduciary services • Investment management services • Financial planning • Brokerage services • 6/30/21 AUM: $5.1B • Competitive deposit products • Safekeeping and cash management services • 186 correspondent banking relationships • Bank stock loans • Commercial & retail banking services • Sophisticated lending and treasury management products and deposit services • Small ticket lease financing (m2 Equipment Finance) C o mm e rc i a l Banking C o rr e s pondent Banking Wealth M anage m ent • Commercial loan fixed - floating rate swaps • Municipal and tax credit financing • Q 2 - 2021 swap & loan sale income : $10.8MM Specialty Finance Gr oup UNIQUE Fee - Based Businesses 11
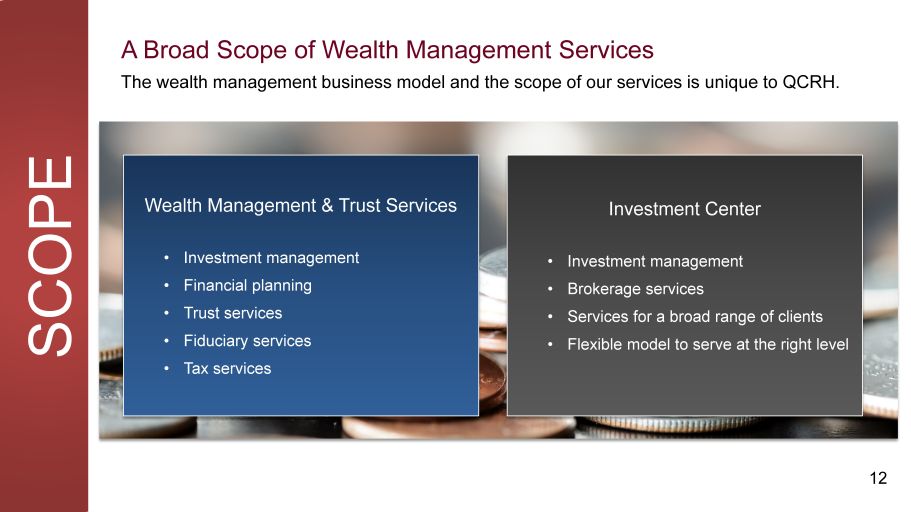
12 A Broad Scope of Wealth Management Services SCOPE The wealth management business model and the scope of our services is unique to QCRH. Wealth Management & Trust Services • Investment management • Financial planning • Trust services • Fiduciary services • Tax services Investment Center • Investment management • Brokerage services • Services for a broad range of clients • Flexible model to serve at the right level
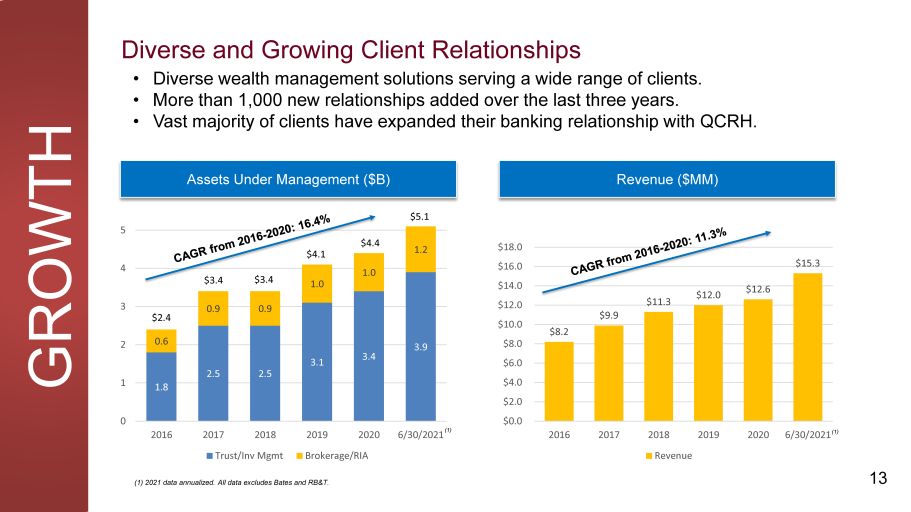
13 Diverse and Growing Client Relationships GROWTH $8 . 2 $9 . 9 $11 . 3 $12 . 0 $12 . 6 $15 . 3 $ 1 8 . 0 $ 1 6 . 0 $ 1 4 . 0 $ 1 2 . 0 $ 1 0 . 0 $8.0 $6.0 $4.0 $2.0 $0.0 2 0 16 2 0 17 2 0 18 2 0 19 2020 6/30/2021 (1) R e v e n u e (1) 2021 data annualized. All data excludes Bates and RB&T. Revenue ($MM) 1.8 2 .5 2 .5 3.1 3.4 3.9 0.6 0.9 0.9 1.0 1.0 1.2 0 1 2 3 4 5 6 2 0 16 (1) 2019 2020 6/30/2021 Brokerage/RIA 2017 2018 Trust/Inv Mgmt $4 . 1 $4 . 4 $5 . 1 Assets Under Management ($B) • Diverse wealth management solutions serving a wide range of clients. • More than 1,000 new relationships added over the last three years. • Vast majority of clients have expanded their banking relationship with QCRH. $2 . 4 $3 . 4 $3 . 4
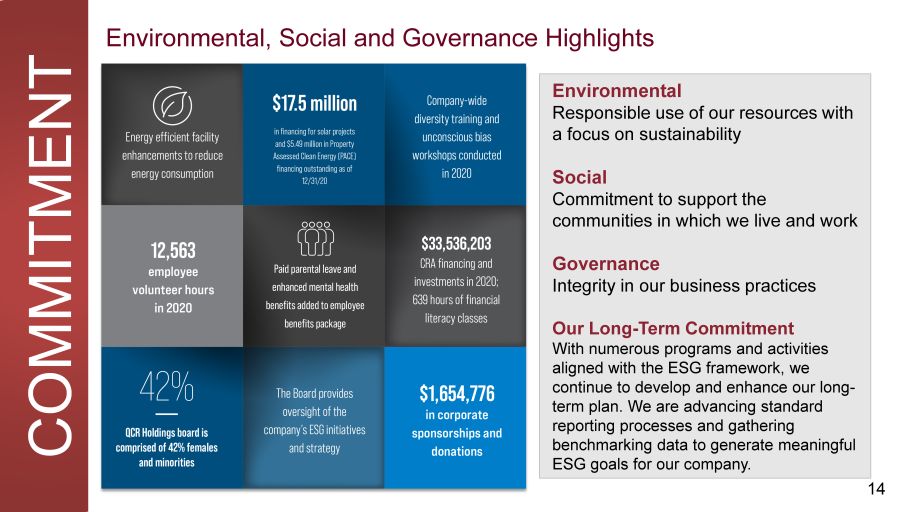
COMMITMENT Environmental, Social and Governance Highlights Environmental Responsible use of our resources with a focus on sustainability Social Commitment to support the communities in which we live and work Governance Integrity in our business practices Our Long - Term Commitment With numerous programs and activities aligned with the ESG framework, we continue to develop and enhance our long - term plan. We are advancing standard reporting processes and gathering benchmarking data to generate meaningful ESG goals for our company. 14
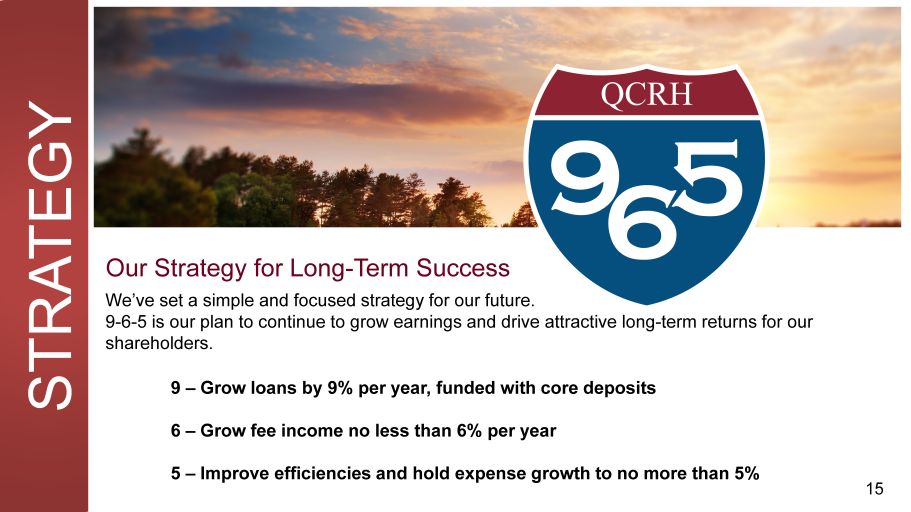
Our Strategy for Long - Term Success We’ve set a simple and focused strategy for our future. 9 - 6 - 5 is our plan to continue to grow earnings and drive attractive long - term returns for our shareholders. 9 – Grow loans by 9% per year, funded with core deposits 6 – Grow fee income no less than 6% per year 5 – Improve efficiencies and hold expense growth to no more than 5% 15 STRATEGY

F inan c ia l H igh ligh ts 16
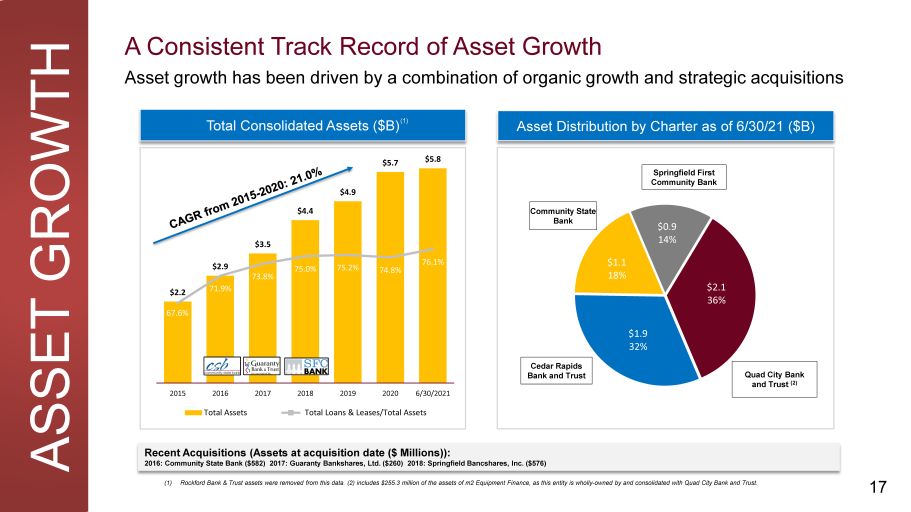
ASSET GROWTH 17 $2. 2 $2. 9 $3. 5 $4. 4 $4. 9 $5. 7 $5. 8 67.6% 71.9% 73.8% 75.0% 75.2% 74.8% 76.1% 2015 2016 2017 Total Assets 2018 2019 2020 6/30/2021 Total Loans & Leases/Total Assets A Consistent Track Record of Asset Growth Asset growth has been driven by a combination of organic growth and strategic acquisitions (1) Rockford Bank & Trust assets were removed from this data. (2) includes $255.3 million of the assets of m2 Equipment Finance, as this entity is wholly - owned by and consolidated with Quad City Bank and Trust. Recent Acquisitions (Assets at acquisition date ($ Millions)): 2016: Community State Bank ($582) 2017: Guaranty Bankshares, Ltd. ($260) 2018: Springfield Bancshares, Inc. ($576) $0 . 9 14% $1 . 1 18% $2.1 36% $1 . 9 32% Quad City Bank and Trust (2) Cedar Rapids Bank and Trust C ommunity State Bank Springfield First Community Bank Asset Distribution by Charter as of 6/30/21 ($B) T ota l Con s o li date d A ss et s ($ B ) ( 1)
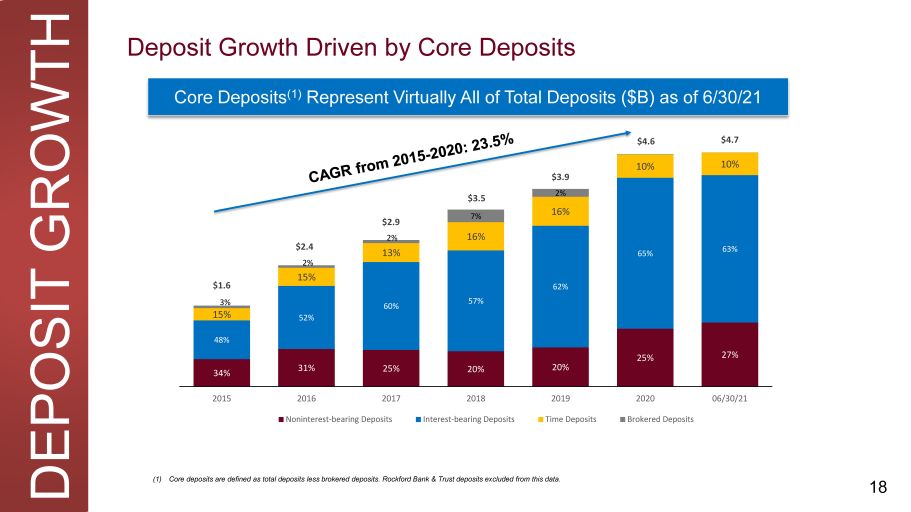
34% 31% 25% 20% 20% 25% 27% 48% 52% 60% 57% 62% 65% 63% 15% 15% 13% 16% 16% 10% 10% 7% 2% $1 . 6 3% $2 . 4 2% $2 . 9 2% $3 . 5 $3 . 9 $4 . 6 $4 . 7 2 0 15 2 0 1 6 2 0 17 Noninterest - bearing Deposits 2 0 18 2 0 19 2 0 20 0 6 / 3 0 / 21 Interest - bearing Deposits Time Deposits Brokered Deposits Deposit Growth Driven by Core Deposits Core Deposits (1) Represent Virtually All of Total Deposits ($B) as of 6/30/21 (1) Core deposits are defined as total deposits less brokered deposits. Rockford Bank & Trust deposits excluded from this data. DEPOSIT GROWTH 18
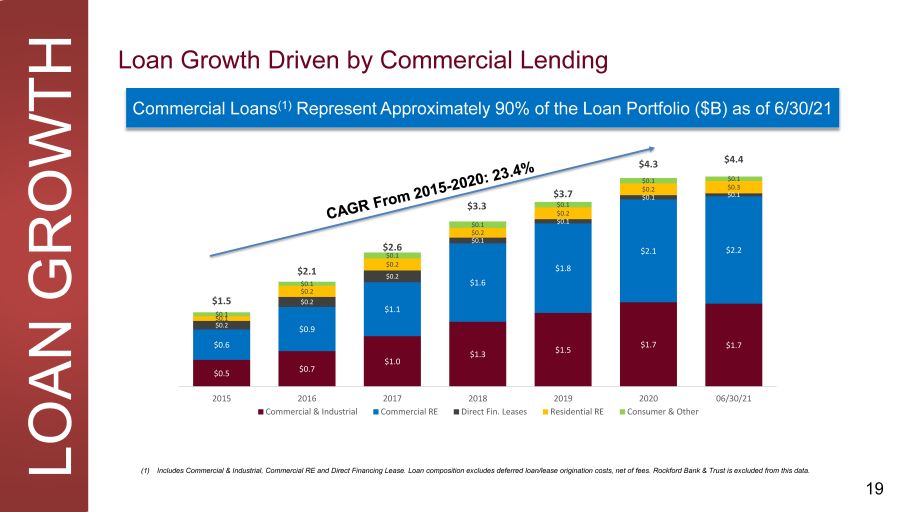
$0 .5 $0 .7 $1 .0 $1 .3 $1 .5 $1 .7 $1 .7 $0 .6 $0 .9 $1 .1 $1 .6 $1 .8 $2 .1 $2 .2 $0.2 $0.2 $0.2 $0.1 $0.2 $0.2 $0.2 $0.1 $0.2 $0.1 $0.2 $0.1 $0.3 $0.1 $0.1 $0.1 $0.1 $0.1 $0.1 $2.1 $0.1 $2.6 $0.1 $1.5 $3.3 $3.7 $4.3 $4.4 2 0 15 2016 Commercial & Industrial 2017 Commercial RE 2018 Direct Fin. Leases 2019 Residential RE 2020 Consumer & Other 0 6 / 3 0 / 21 Loan Growth Driven by Commercial Lending Commercial Loans (1) Represent Approximately 90% of the Loan Portfolio ($B) as of 6/30/21 (1) Includes Commercial & Industrial, Commercial RE and Direct Financing Lease. Loan composition excludes deferred loan/lease origination costs, net of fees. Rockford Bank & Trust is excluded from this data. LOAN GROWTH 19
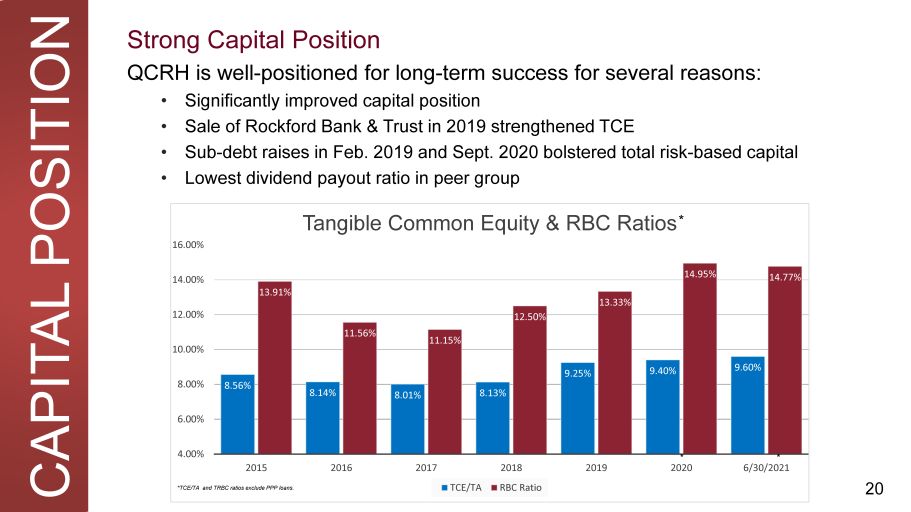
20 CAPITAL POSITION Strong Capital Position 8 . 56% 8 . 14% 8 . 01% 8 . 13% 9 . 25% 9 . 40% 9 . 60% 13.91% 11.56% 11.15% 12.50% 13.33% 14.95% 14.77% 4 . 0 0% 6 . 0 0% 8 . 0 0% 10.00% 12.00% 14.00% 16.00% 2015 2016 2017 2018 2019 2020 6 / 30 / 20 2 1 TCE/TA RBC Ratio * *TCE/TA and TRBC ratios exclude PPP loans. * QCRH is well - positioned for long - term success for several reasons: • Significantly improved capital position • Sale of Rockford Bank & Trust in 2019 strengthened TCE • Sub - debt raises in Feb. 2019 and Sept. 2020 bolstered total risk - based capital • Lowest dividend payout ratio in peer group Tangible Common Equity & RBC Ratios *
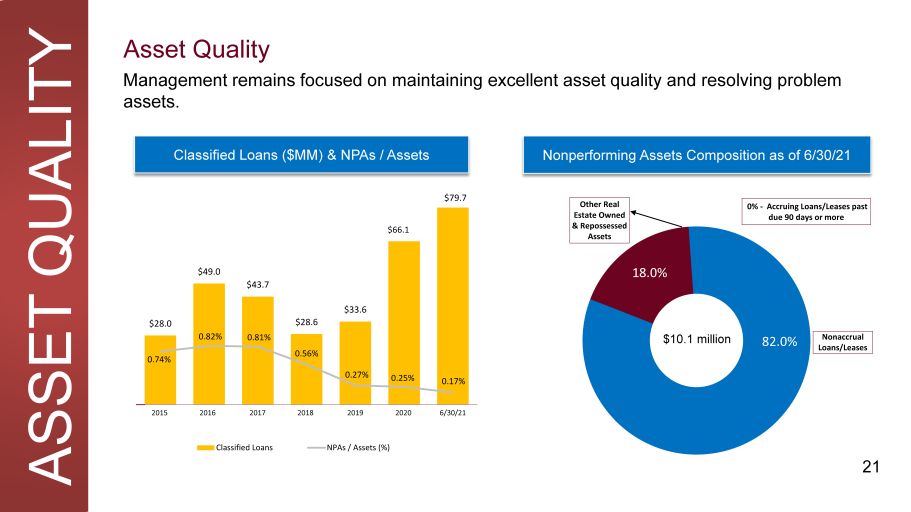
ASSET QUALITY 21 82 . 0% 18 . 0% Nonaccrual Loans/Leases Other Real Estate Owned & Re p o ss e ss ed Assets Asset Quality Management remains focused on maintaining excellent asset quality and resolving problem assets. $10.1 million Classified Loans ($MM) & NPAs / Assets Nonperforming Assets Composition as of 6/30/21 $28 . 0 $49 . 0 $43 . 7 $28 . 6 $33 . 6 $79 . 7 0.74% 0.82% 0.81% 0.56% 0.27% 0.25% 0.17% 1 2 3 4 5 6 7 Classified Loans NPAs / Assets (%) $66 . 1 2015 2016 2017 2018 2019 2020 6/30 / 21 0% - Accruing Loans/Leases past due 90 days or more
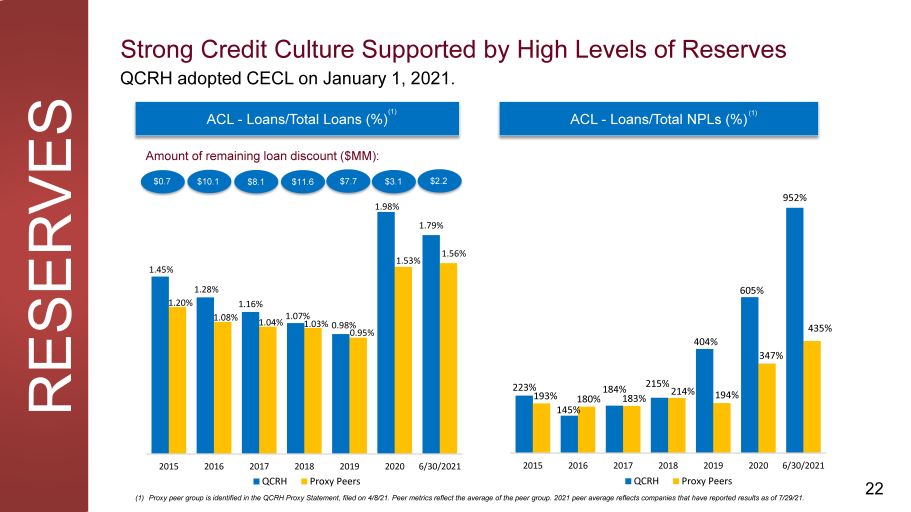
223% 145% 184% 605% 952% 193% 180% 183% 215% 214% 194% 404% 347% 435% 2019 Proxy Peers 2020 6/30/2021 1 . 45% 1 . 28% 1 . 16% 0 . 98% 1.98% 1 . 79% 1 . 20% 1 . 08% 1.04% 1.07% 1 . 03% 0 . 95% 1 . 53% 1 . 56% 2 0 15 2 0 16 2017 QCRH 2018 2019 2020 6/30/2021 2015 2016 2017 2018 Proxy Peers QCRH (1) Proxy peer group is identified in the QCRH Proxy Statement, filed on 4/8/21. Peer metrics reflect the average of the peer group. 2021 peer average reflects companies that have reported results as of 7/29/21. Strong Credit Culture Supported by High Levels of Reserves ACL - Loans/Total Loans (%) ACL - Loans/Total NPLs (%) (1) $3. 1 Amount of remaining loan discount ($MM): $0.7 $10.1 $8.1 $11.6 $7.7 (1 ) RESE R VES QCRH adopted CECL on January 1, 2021. 22 $2. 2
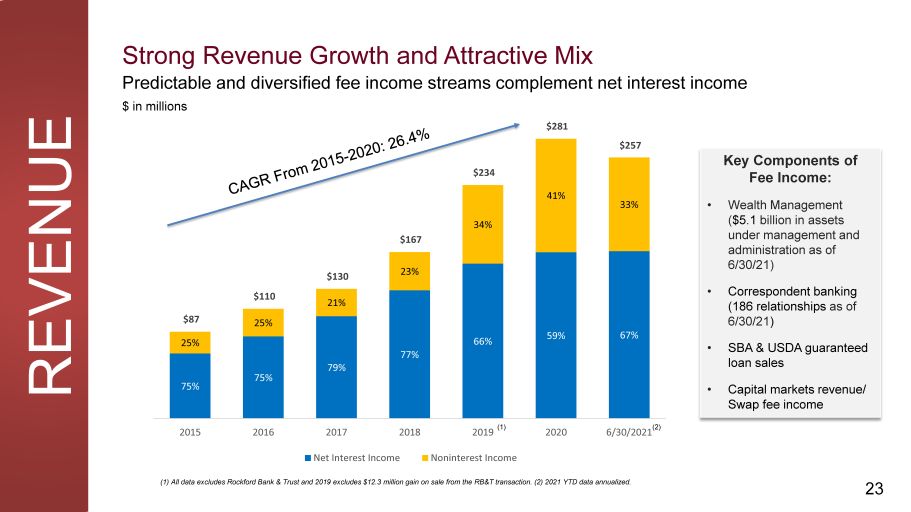
75% 75% 79% 77% 66% 59% 67% 25% 25% 21% 23% 34% 41% 33% $87 $110 $130 $167 $234 $257 2 0 15 2 0 16 2 0 20 (2) 6/30/2021 (1) 2017 2018 2019 Net Interest Income Noninterest Income Strong Revenue Growth and Attractive Mix Predictable and diversified fee income streams complement net interest income $ in millions $281 Key Components of Fee Income: • Wealth Management ( $5.1 billion in assets under management and administration as of 6/30/21) • Correspondent banking ( 186 relationships as of 6 / 30 / 21 ) • SB A & U S D A gua r an t e e d loan sales • Capital markets revenue/ Swap fee income (1) All data excludes Rockford Bank & Trust and 2019 excludes $12.3 million gain on sale from the RB&T transaction. (2) 2021 YTD data annualized. REVENUE 23
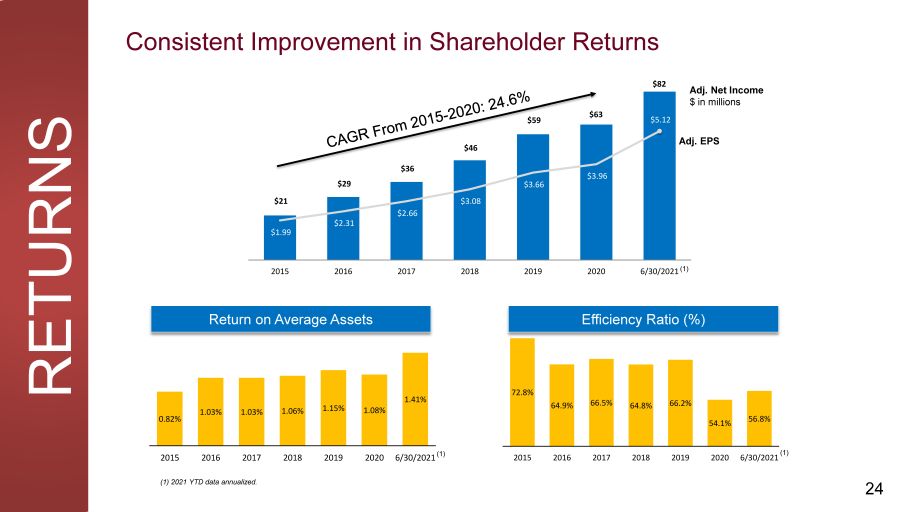
$21 $29 $36 $46 $59 $63 $2.66 $2.31 $1.99 $3.08 $3.66 $3.96 $5.12 2 0 15 2 0 16 2 0 17 2 0 18 2 0 19 2 0 20 6/ 3 0/2 0 2 1 (1 ) Consistent Improvement in Shareholder Returns 0.82% 1.03% 1.03% 1.06% 1.15% 1.08% 1.41% 2 0 1 5 2 0 1 6 2 0 17 (1) 2021 YTD data annualized. 2 0 18 2 0 19 2 0 2 0 6 / 3 0/ 20 21 (1 ) Retur n o n A v erag e A ss ets 72.8% 64.9% 66.5% 64.8% 66.2% 54.1% 56.8% 2 0 15 2 0 16 2 0 17 2 0 18 2 0 19 (1) 2020 6/30/2021 Efficiency Ratio (%) Adj. Net Income $ in millions Adj. EPS RETURNS 24 $82

Appendix 25
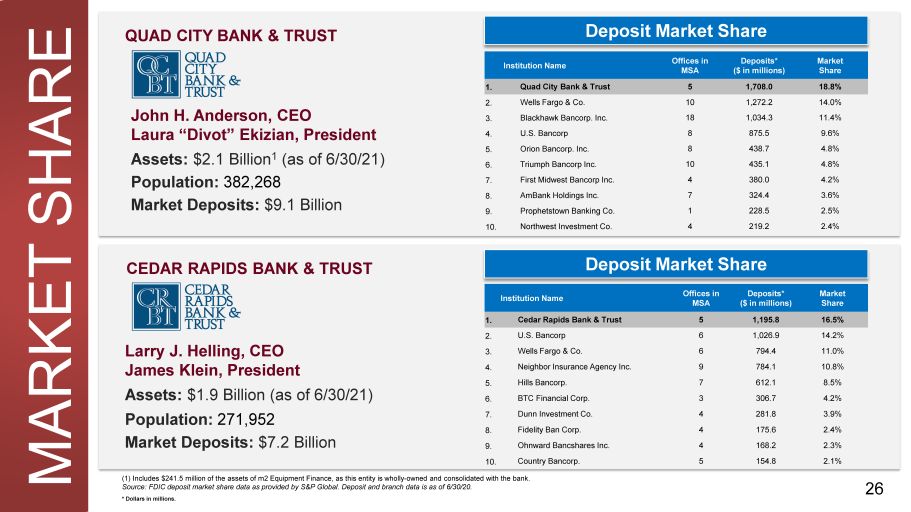
QUAD CITY BANK & TRUST John H. Anderson, CEO Laura “Divot” Ekizian, President Assets: $2.1 Billion 1 (as of 6/30/21) Population: 382,268 Market Deposits: $9.1 Billion (1) Includes $241.5 million of the assets of m2 Equipment Finance, as this entity is wholly - owned and consolidated with the bank. Source: FDIC deposit market share data as provided by S&P Global. Deposit and branch data is as of 6/30/20. * Dollars in millions. Institution Name O ffices in MSA Deposits* ($ in millions) M a r ket Share 1. Quad City Bank & Trust 5 1,708.0 18.8% 2. W e lls Fargo & C o. 10 1,272.2 14.0% 3. Blackhawk Bancorp. Inc. 18 1,034.3 11.4% 4. U.S. Bancorp 8 875.5 9.6% 5. Orion Bancorp. Inc. 8 438.7 4.8% 6. Triumph Bancorp Inc. 10 435.1 4.8% 7. First Midwest Bancorp Inc. 4 380.0 4.2% 8. AmBank Holdings Inc. 7 324.4 3.6% 9. Prophetstown Banking Co. 1 228.5 2.5% 10. Northwest Investment Co. 4 219.2 2.4% MARKET SHARE Deposit Market Share 26 CEDAR RAPIDS BANK & TRUST Larry J. Helling, CEO James Klein, President Assets: $1.9 Billion (as of 6/30/21) Population: 271,952 Market Deposits: $7.2 Billion Institution Name O ffices in MSA Deposits* ($ in millions) M a r ket Share 1. Cedar Rapids Bank & Trust 5 1,195.8 16.5% 2. U.S. Bancorp 6 1,026.9 14.2% 3. W e lls Fargo & C o. 6 794.4 11.0% 4. Neighbor Insurance Agency Inc. 9 784.1 10.8% 5. Hills Bancorp. 7 612.1 8.5% 6. BTC Financial Corp. 3 306.7 4.2% 7. Dunn Investment Co. 4 281.8 3.9% 8. Fidelity Ban Corp. 4 175.6 2.4% 9. Ohnward Bancshares Inc. 4 168.2 2.3% 10. Country Bancorp. 5 154.8 2.1% Deposit Market Share
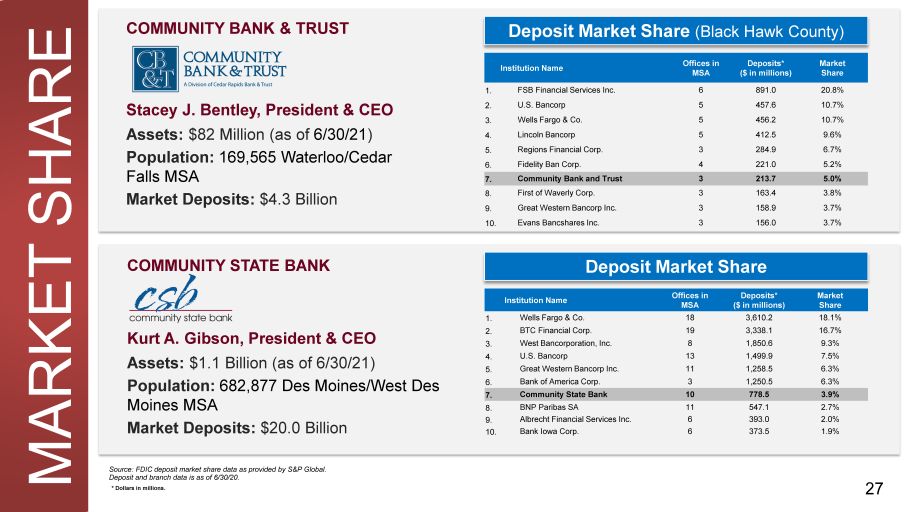
Source: FDIC deposit market share data as provided by S&P Global. Deposit and branch data is as of 6/30/20. * Dollars in millions. COMMUNITY BANK & TRUST Stacey J. Bentley, President & CEO Assets: $82 Million (as of 6/30/21 ) Population: 169,565 Waterloo/Cedar Falls MSA Market Deposits: $4.3 Billion Institution Name O ffices in MSA Deposits* ($ in millions) M a r ket Share 1. FSB Financial Services Inc. 6 891.0 20.8% 2. U.S. Bancorp 5 457.6 10.7% 3. W e lls Fargo & C o. 5 456.2 10.7% 4. Lin c oln B an c orp 5 412.5 9.6% 5. Regions Financial Corp. 3 284.9 6.7% 6. Fidelity Ban Corp. 4 221.0 5.2% 7. Community Bank and Trust 3 213.7 5.0% 8. First of Waverly Corp. 3 163.4 3.8% 9. Great Western Bancorp Inc. 3 158.9 3.7% 10. Evans Bancshares Inc. 3 156.0 3.7% MARKET SHARE Deposit Market Share (Black Hawk County) 27 COMMUNITY STATE BANK Kurt A. Gibson, President & CEO Assets: $1.1 Billion (as of 6/30/21) Population: 682,877 Des Moines/West Des Moines MSA Market Deposits: $20.0 Billion Institution Name O ffices in MSA Deposits* ($ in millions) M a r ket Share 1. W e lls Fargo & C o. 18 3,610.2 18.1% 2. BTC Financial Corp. 19 3,338.1 16.7% 3. West Bancorporation, Inc. 8 1,850.6 9.3% 4. U.S. Bancorp 13 1,499.9 7.5% 5. Great Western Bancorp Inc. 11 1,258.5 6.3% 6. Bank of America Corp. 3 1,250.5 6.3% 7. Community State Bank 10 778.5 3.9% 8. BNP Paribas SA 11 547.1 2.7% 9. Albrecht Financial Services Inc. 6 393.0 2.0% 10. Bank Iowa Corp. 6 373.5 1.9% Deposit Market Share
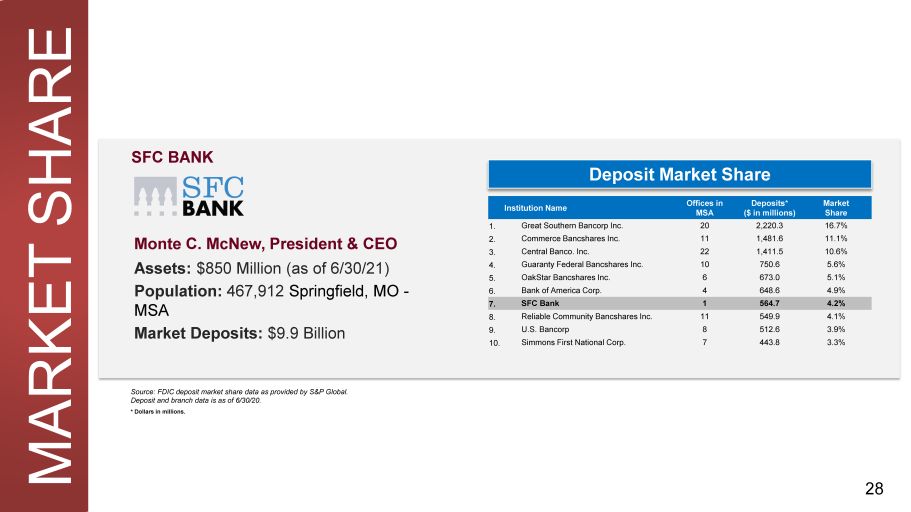
SFC BANK Monte C. McNew, President & CEO Assets: $850 Million (as of 6/30/21) Population: 467,912 Springfield, MO - MSA Market Deposits: $9.9 Billion Source: FDIC deposit market share data as provided by S&P Global. Deposit and branch data is as of 6/30/20. * Dollars in millions. Institution Name O ffices in MSA Deposits* ($ in millions) M a r ket Share 1. Great Southern Bancorp Inc. 20 2,220.3 16.7% 2. Commerce Bancshares Inc. 11 1,481.6 11.1% 3. Central Banco. Inc. 22 1,411.5 10.6% 4. Guaranty Federal Bancshares Inc. 10 750.6 5.6% 5. OakStar Bancshares Inc. 6 673.0 5.1% 6. Bank of America Corp. 4 648.6 4.9% 7. SFC Bank 1 564.7 4.2% 8. Reliable Community Bancshares Inc. 11 549.9 4.1% 9. U.S. Bancorp 8 512.6 3.9% 10. Simmons First National Corp. 7 443.8 3.3% MARKET SHARE Deposit Market Share 28
3551 Seventh Street Moline, IL 61265 ww w . Q CRH. c om
© Copyright 2021 QCR Holdings, Inc. All Rights Reserved