Attached files
| file | filename |
|---|---|
| EX-99.1 - EX-99.1 - EverQuote, Inc. | d186828dex991.htm |
| 8-K - 8-K - EverQuote, Inc. | d186828d8k.htm |

Exhibit 99.2 Investor Presentation August 2021 Proprietary Information Proprietary Information 1Exhibit 99.2 Investor Presentation August 2021 Proprietary Information Proprietary Information 1

Disclaimer This presentation contains forward-looking statements. All statements other than statements of historical facts contained in this presentation, including statements regarding possible or assumed future results of operations, business strategies, development plans, regulatory activities, competitive position, potential growth opportunities, & the effects of competition are forward-looking statements. These statements involve known & unknown risks, uncertainties & other important factors that may cause actual results, performance or achievements of EverQuote, Inc. (“the Company”) to be materially different from any future results, performance or achievements expressed or implied by the forward-looking statements. In some cases, you can identify forward- looking statements by terms such as “may,” “should,” “expect,” “plan,” “project,” “estimate,” “guidance,” or “potential” or the negative of these terms or other similar expressions. The forward-looking statements in this presentation are only predictions. The Company has based these forward-looking statements largely on its current expectations & projections about future events & financial trends that it believes may affect the Company’s business, financial condition & results of operations. These forward-looking statements speak only as of the date of this presentation & are subject to a number of risks, uncertainties & assumptions, some of which cannot be predicted or quantified & some of which are beyond the Company’s control. The events & circumstances reflected in the Company’s forward-looking statements may not be achieved or occur, & actual results could differ materially from those projected in the forward-looking statements, including as a result of: (1) the Company’s ability to attract & retain consumers & insurance providers using the Company’s marketplace; (2) the Company’s ability to maintain or increase the amount providers spend per quote request; (3) the effectiveness of the Company’s growth strategies & its ability to effectively manage growth; (4) the Company’s ability to maintain & build its brand; (5) the Company’s reliance on its third-party service providers; (6) the Company’s ability to develop new & enhanced products & services to attract & retain consumers & insurance providers& the Company’s ability to successfully monetize them; (7) the impact of competition in the Company’s industry & innovation by the Company’s competitors; (8) the Company’s expected use of proceeds from its initial public offering; & (9) developments regarding the insurance industry & the transition to online marketing; (10) the effects of the COVID-19 pandemic; (11) the Company’s ability to successfully acquire and operate PolicyFuel; & (12) as a result of the risks described in the “Risk Factors” section of the Company’s most recent Annual Report on Form 10-K, Quarterly Report on Form 10-Q & the other filings that the Company makes with the Securities & Exchange Commission from time to time. Moreover, new risk factors & uncertainties may emerge from time to time, & it is not possible for management to predict all risk factors & uncertainties that the Company may face. Except as required by applicable law, the Company does not plan to publicly update or revise any forward- looking statements contained herein, whether as a result of any new information, future events, changed circumstances or otherwise. The Company’s presentation also contains estimates, projections, & other information concerning the Company’s industry, the Company’s business & the markets for certain of the Company’s products & services, including data regarding the estimated size of those markets. Information that is based on estimates, forecasts, projections, market research, or similar methodologies is inherently subject to uncertainties & actual events or circumstances may differ materially from events & circumstances reflected in this information. Unless otherwise expressly stated, the Company obtained this industry, business, market & other data from reports, research surveys, studies & similar data prepared by market research firms & other third parties, from industry, general publications, & from government data & similar sources. The Company presents Adjusted EBITDA as a non-GAAP measure, which is not a substitute for or superior to, other measures of financial performance prepared in accordance with U.S. GAAP. A reconciliation of Adjusted EBITDA to the most directly comparable GAAP measure is included in the Appendix to these slides. Proprietary Information 2Disclaimer This presentation contains forward-looking statements. All statements other than statements of historical facts contained in this presentation, including statements regarding possible or assumed future results of operations, business strategies, development plans, regulatory activities, competitive position, potential growth opportunities, & the effects of competition are forward-looking statements. These statements involve known & unknown risks, uncertainties & other important factors that may cause actual results, performance or achievements of EverQuote, Inc. (“the Company”) to be materially different from any future results, performance or achievements expressed or implied by the forward-looking statements. In some cases, you can identify forward- looking statements by terms such as “may,” “should,” “expect,” “plan,” “project,” “estimate,” “guidance,” or “potential” or the negative of these terms or other similar expressions. The forward-looking statements in this presentation are only predictions. The Company has based these forward-looking statements largely on its current expectations & projections about future events & financial trends that it believes may affect the Company’s business, financial condition & results of operations. These forward-looking statements speak only as of the date of this presentation & are subject to a number of risks, uncertainties & assumptions, some of which cannot be predicted or quantified & some of which are beyond the Company’s control. The events & circumstances reflected in the Company’s forward-looking statements may not be achieved or occur, & actual results could differ materially from those projected in the forward-looking statements, including as a result of: (1) the Company’s ability to attract & retain consumers & insurance providers using the Company’s marketplace; (2) the Company’s ability to maintain or increase the amount providers spend per quote request; (3) the effectiveness of the Company’s growth strategies & its ability to effectively manage growth; (4) the Company’s ability to maintain & build its brand; (5) the Company’s reliance on its third-party service providers; (6) the Company’s ability to develop new & enhanced products & services to attract & retain consumers & insurance providers& the Company’s ability to successfully monetize them; (7) the impact of competition in the Company’s industry & innovation by the Company’s competitors; (8) the Company’s expected use of proceeds from its initial public offering; & (9) developments regarding the insurance industry & the transition to online marketing; (10) the effects of the COVID-19 pandemic; (11) the Company’s ability to successfully acquire and operate PolicyFuel; & (12) as a result of the risks described in the “Risk Factors” section of the Company’s most recent Annual Report on Form 10-K, Quarterly Report on Form 10-Q & the other filings that the Company makes with the Securities & Exchange Commission from time to time. Moreover, new risk factors & uncertainties may emerge from time to time, & it is not possible for management to predict all risk factors & uncertainties that the Company may face. Except as required by applicable law, the Company does not plan to publicly update or revise any forward- looking statements contained herein, whether as a result of any new information, future events, changed circumstances or otherwise. The Company’s presentation also contains estimates, projections, & other information concerning the Company’s industry, the Company’s business & the markets for certain of the Company’s products & services, including data regarding the estimated size of those markets. Information that is based on estimates, forecasts, projections, market research, or similar methodologies is inherently subject to uncertainties & actual events or circumstances may differ materially from events & circumstances reflected in this information. Unless otherwise expressly stated, the Company obtained this industry, business, market & other data from reports, research surveys, studies & similar data prepared by market research firms & other third parties, from industry, general publications, & from government data & similar sources. The Company presents Adjusted EBITDA as a non-GAAP measure, which is not a substitute for or superior to, other measures of financial performance prepared in accordance with U.S. GAAP. A reconciliation of Adjusted EBITDA to the most directly comparable GAAP measure is included in the Appendix to these slides. Proprietary Information 2

Our vision Become the largest online source of insurance policies by using data and technology to make insurance simpler, more affordable and personalized, ultimately reducing cost and risk. Proprietary Information 3Our vision Become the largest online source of insurance policies by using data and technology to make insurance simpler, more affordable and personalized, ultimately reducing cost and risk. Proprietary Information 3

Key Investment Highlights Leading online insurance marketplace providing compelling benefits for Insurance Marketplace consumers and insurance providers $154bn in annual distribution and advertising spend in the early phases of Massive Market Opportunity shifting online provides multi-year secular tailwind Proprietary platforms built on highly integrated machine learning & data assets Proprietary Tech & Data support rapid growth, drive network effects and create competitive moat Rd 3 Party Platform with 100+ carriers and 8,500+ local agents and Extensive Distribution St 1 Party Platform with Direct-to-Consumer (DTC) Agency offerings Track record of delivering strong growth and expanding adjusted EBITDA Strong Financial Profile profitability; re-occurring revenue, asset-light model Proprietary Information 4

EverQuote Company Snapshot Founded* IPO 2011 June 28, 2018 * First year of revenue LTM LTM Variable Marketing LTM Adjusted Revenue Growth Margin Growth EBITDA Growth 32% 40% 38% Headquarters Employees Cambridge, MA 450+ Insurance Verticals Commercial Auto Home & Renters Life Health Proprietary Information 5 Last Twelve Months (”LTM”) financial information as of June 30, 2021, with growth relative to the twelve months ended June 30, 2020..EverQuote Company Snapshot Founded* IPO 2011 June 28, 2018 * First year of revenue LTM LTM Variable Marketing LTM Adjusted Revenue Growth Margin Growth EBITDA Growth 32% 40% 38% Headquarters Employees Cambridge, MA 450+ Insurance Verticals Commercial Auto Home & Renters Life Health Proprietary Information 5 Last Twelve Months (”LTM”) financial information as of June 30, 2021, with growth relative to the twelve months ended June 30, 2020..

Large & Expanding TAM U.S. Insurance Market: Projected Annual Growth Drivers Distribution & Ad Spend Growth to 2024 Continued shift of Total Market Growth: ~4% $154bn consumer time spent EVER Share: <1% Total Market online Continued shift of $16.7bn acquisition spend Total Advertising online Spend Total Digital Spending Growth: ~ 16% EVER Share: <10% Continued shift to $6.5bn digitization of Total Digital Spend 1 insurance products $443.0mm & workflows EverQuote 2021 revenue guidance midpoint Source: Stax Consulting, Inc., S&P Global Market Intelligence SNL Insurance Data, IIABA and Company estimates. 1. EverQuote is not reaffirming this guidance as of the date of this presentation & makes no statement with respect to this guidance other than such guidance was provided by EverQuote as of August 2, 2021. Proprietary Information 6Large & Expanding TAM U.S. Insurance Market: Projected Annual Growth Drivers Distribution & Ad Spend Growth to 2024 Continued shift of Total Market Growth: ~4% $154bn consumer time spent EVER Share: <1% Total Market online Continued shift of $16.7bn acquisition spend Total Advertising online Spend Total Digital Spending Growth: ~ 16% EVER Share: <10% Continued shift to $6.5bn digitization of Total Digital Spend 1 insurance products $443.0mm & workflows EverQuote 2021 revenue guidance midpoint Source: Stax Consulting, Inc., S&P Global Market Intelligence SNL Insurance Data, IIABA and Company estimates. 1. EverQuote is not reaffirming this guidance as of the date of this presentation & makes no statement with respect to this guidance other than such guidance was provided by EverQuote as of August 2, 2021. Proprietary Information 6

Compelling Model Benefits Both Consumers & Providers Consumers Insurance Providers Consumers Save Time & Money More Efficient Acquisition for Providers Match & connect for multiple quotes Large volume of high intent consumers 1 Average Savings ~$600 per year Target based consumer attributes tied to ROI Addresses the alignment challenges inherent in the fragmented insurance market 1. Estimated average annual premium savings based on a countrywide survey in 2020 of EverQuote users that reported old & new premiums. Proprietary Information 7Compelling Model Benefits Both Consumers & Providers Consumers Insurance Providers Consumers Save Time & Money More Efficient Acquisition for Providers Match & connect for multiple quotes Large volume of high intent consumers 1 Average Savings ~$600 per year Target based consumer attributes tied to ROI Addresses the alignment challenges inherent in the fragmented insurance market 1. Estimated average annual premium savings based on a countrywide survey in 2020 of EverQuote users that reported old & new premiums. Proprietary Information 7

Marketplace Arrival to Policy Sale Journey Customer Acquisition Marketplace Distribution Traffic Arrives at the Marketplace Matched with EverQuote Channels Marketplace Workflows Providers Monetization 3rd Party (All Verticals) Monetize Display “Per Referral” SEM Bidding Carriers Local Agents Email St 1 Party – Direct to Consumer Agency TV / Offline Alignment 1 Other Performance Monetize 3 EQ acts as EQ offers PSaaS “Per Policy Verified Partners “independent EQ “advisor team” Sold” agent” for exclusive to each several carriers carrier (Health & Life (Auto & Home Traffic Platforms Verticals) Verticals) 2 Verified Partner Network Performance Marketing 3 “ rd PSaaS” refers to Policy-Sales-as-a-Service offerings (3 Party) (Owned & Operated) 1. Other includes organic search, direct-to-site, inbound calls,, social & other traffic sources.. Proprietary Information 8 2. Performance Marketing relates to managing traffic directed to owned and operated websites..Marketplace Arrival to Policy Sale Journey Customer Acquisition Marketplace Distribution Traffic Arrives at the Marketplace Matched with EverQuote Channels Marketplace Workflows Providers Monetization 3rd Party (All Verticals) Monetize Display “Per Referral” SEM Bidding Carriers Local Agents Email St 1 Party – Direct to Consumer Agency TV / Offline Alignment 1 Other Performance Monetize 3 EQ acts as EQ offers PSaaS “Per Policy Verified Partners “independent EQ “advisor team” Sold” agent” for exclusive to each several carriers carrier (Health & Life (Auto & Home Traffic Platforms Verticals) Verticals) 2 Verified Partner Network Performance Marketing 3 “ rd PSaaS” refers to Policy-Sales-as-a-Service offerings (3 Party) (Owned & Operated) 1. Other includes organic search, direct-to-site, inbound calls,, social & other traffic sources.. Proprietary Information 8 2. Performance Marketing relates to managing traffic directed to owned and operated websites..

Distribution Strength of our Marketplace 100+ carriers available via the 1 marketplace 19 of 20 1 top auto insurance carriers 8,500+ rd 3 party local agents 1. Based on Company data & representative of the insurance provider partners on the platform as of December 31, 2020 Proprietary Information 9Distribution Strength of our Marketplace 100+ carriers available via the 1 marketplace 19 of 20 1 top auto insurance carriers 8,500+ rd 3 party local agents 1. Based on Company data & representative of the insurance provider partners on the platform as of December 31, 2020 Proprietary Information 9

Growing Data & Tech Assets Strengthen Competitive Moat Traffic Sources Multi-Vertical Marketplace Property & Casualty Marketing Consumer Distribution B2B Display (Auto, Home, Commercial) Platforms Platforms Platforms Platforms SEM Email Multi-Channel Personalized User Consumer Enterprise & Automated Experiences Alignment Agency Campaign Bidding Algorithms Management TV / Offline Life & Health Minimize Cost Maximize Maximize Maximize Value per Acquisition Conversion Rates Bind Rates per Acquisition 1 Other ML Platforms (Automated Selection, Prediction & Anomaly Detection) Verified Partners Data Platform (Growing Data Assets, Rapid Data Onboarding, Rich Analytics Tools) Diverse Customer Proprietary Platforms Built on Highly Integrated Machine Learning Broad Distribution with Carriers Acquisition and Data Assets Support Growth of all Marketplace Verticals & 3rd Party Agents; 1st Party EQ Agents in Life & Health 1. Other includes organic search, direct-to-site, inbound calls, social & other traffic sources.. Proprietary Information 10 .Growing Data & Tech Assets Strengthen Competitive Moat Traffic Sources Multi-Vertical Marketplace Property & Casualty Marketing Consumer Distribution B2B Display (Auto, Home, Commercial) Platforms Platforms Platforms Platforms SEM Email Multi-Channel Personalized User Consumer Enterprise & Automated Experiences Alignment Agency Campaign Bidding Algorithms Management TV / Offline Life & Health Minimize Cost Maximize Maximize Maximize Value per Acquisition Conversion Rates Bind Rates per Acquisition 1 Other ML Platforms (Automated Selection, Prediction & Anomaly Detection) Verified Partners Data Platform (Growing Data Assets, Rapid Data Onboarding, Rich Analytics Tools) Diverse Customer Proprietary Platforms Built on Highly Integrated Machine Learning Broad Distribution with Carriers Acquisition and Data Assets Support Growth of all Marketplace Verticals & 3rd Party Agents; 1st Party EQ Agents in Life & Health 1. Other includes organic search, direct-to-site, inbound calls, social & other traffic sources.. Proprietary Information 10 .

Multiple Levers Driving Future Growth Expand Non-Auto Verticals Deepen Consumer & Provider Engagement Increase Provider Coverage & Attract Budget More Leverage Consumers Secular Shift Online Proprietary Information 11Multiple Levers Driving Future Growth Expand Non-Auto Verticals Deepen Consumer & Provider Engagement Increase Provider Coverage & Attract Budget More Leverage Consumers Secular Shift Online Proprietary Information 11
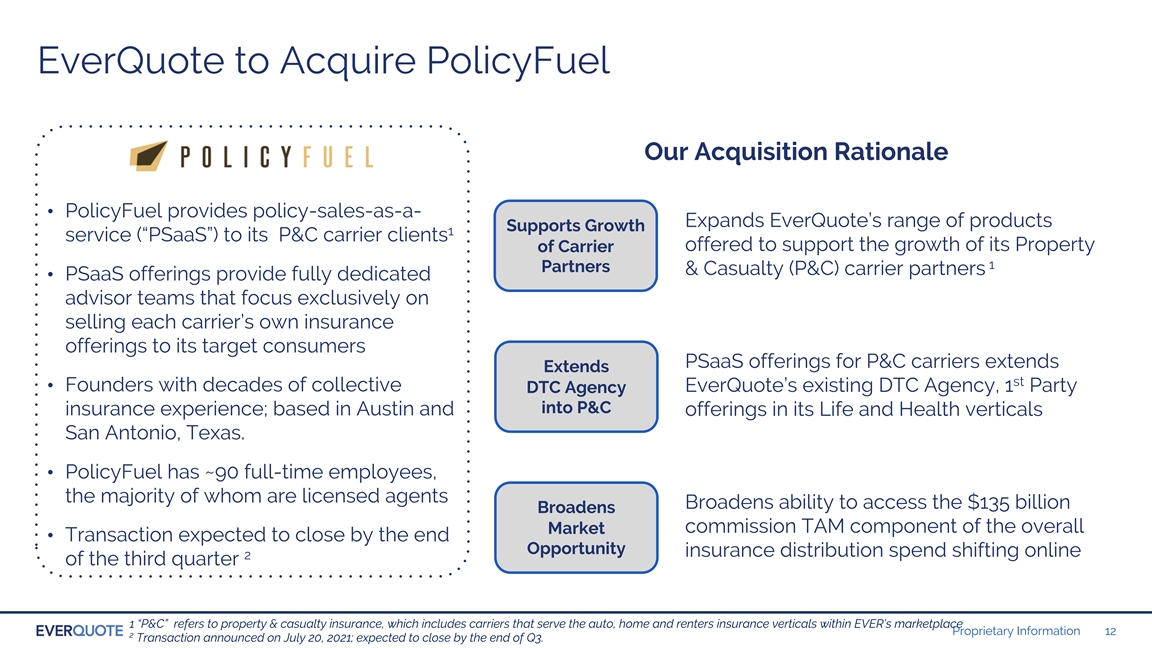
EverQuote to Acquire PolicyFuel Our Acquisition Rationale • PolicyFuel provides policy-sales-as-a- Expands EverQuote’s range of products Supports Growth 1 service (“PSaaS”) to its P&C carrier clients offered to support the growth of its Property of Carrier 1 Partners & Casualty (P&C) carrier partners • PSaaS offerings provide fully dedicated advisor teams that focus exclusively on selling each carrier’s own insurance offerings to its target consumers PSaaS offerings for P&C carriers extends Extends st • Founders with decades of collective EverQuote’s existing DTC Agency, 1 Party DTC Agency into P&C insurance experience; based in Austin and offerings in its Life and Health verticals San Antonio, Texas. • PolicyFuel has ~90 full-time employees, the majority of whom are licensed agents Broadens ability to access the $135 billion Broadens commission TAM component of the overall Market • Transaction expected to close by the end Opportunity insurance distribution spend shifting online 2 of the third quarter 1 “P&C” refers to property & casualty insurance, which includes carriers that serve the auto, home and renters insurance verticals within EVER’s marketplace Proprietary Information 12 2 Transaction announced on July 20, 2021; expected to close by the end of Q3.EverQuote to Acquire PolicyFuel Our Acquisition Rationale • PolicyFuel provides policy-sales-as-a- Expands EverQuote’s range of products Supports Growth 1 service (“PSaaS”) to its P&C carrier clients offered to support the growth of its Property of Carrier 1 Partners & Casualty (P&C) carrier partners • PSaaS offerings provide fully dedicated advisor teams that focus exclusively on selling each carrier’s own insurance offerings to its target consumers PSaaS offerings for P&C carriers extends Extends st • Founders with decades of collective EverQuote’s existing DTC Agency, 1 Party DTC Agency into P&C insurance experience; based in Austin and offerings in its Life and Health verticals San Antonio, Texas. • PolicyFuel has ~90 full-time employees, the majority of whom are licensed agents Broadens ability to access the $135 billion Broadens commission TAM component of the overall Market • Transaction expected to close by the end Opportunity insurance distribution spend shifting online 2 of the third quarter 1 “P&C” refers to property & casualty insurance, which includes carriers that serve the auto, home and renters insurance verticals within EVER’s marketplace Proprietary Information 12 2 Transaction announced on July 20, 2021; expected to close by the end of Q3.

Financial Overview Proprietary Information 13Financial Overview Proprietary Information 13

Highlights on Second Quarter 2021 34% 40% Revenue increased 34% YoY VMM increased 40% YoY Adjusted EBITDA expanded to $105.1 mm to $32.8 mm to record $6.6 mm +120 34% bps VMM as a percentage 0f Revenue per Quote Request Revenue increased by 120 basis increased 34% YoY points YoY, to 31.2% Note: Adjusted EBITDA is a non-GAAP metric, refer to financial reconciliation for additional detail. Proprietary Information 14Highlights on Second Quarter 2021 34% 40% Revenue increased 34% YoY VMM increased 40% YoY Adjusted EBITDA expanded to $105.1 mm to $32.8 mm to record $6.6 mm +120 34% bps VMM as a percentage 0f Revenue per Quote Request Revenue increased by 120 basis increased 34% YoY points YoY, to 31.2% Note: Adjusted EBITDA is a non-GAAP metric, refer to financial reconciliation for additional detail. Proprietary Information 14

Track Record of Strong Growth Track Record of Strong Growth Revenue ($mm) 34% 29% Q2’21 YoY Growth CAGR 2015-2020 $346.9 $105.1 $103.8 $97.3 $90.0 $78.3 $248.8 $163.3 $126.2 $122.8 $96.8 Q2 2020 Q3 2020 Q4 2020 Q1 2021 Q2 2021 2015 2016 2017 2018 2019 2020 Proprietary Information 15Track Record of Strong Growth Track Record of Strong Growth Revenue ($mm) 34% 29% Q2’21 YoY Growth CAGR 2015-2020 $346.9 $105.1 $103.8 $97.3 $90.0 $78.3 $248.8 $163.3 $126.2 $122.8 $96.8 Q2 2020 Q3 2020 Q4 2020 Q1 2021 Q2 2021 2015 2016 2017 2018 2019 2020 Proprietary Information 15

Delivering Incremental Variable Marketing Margin 40% Variable Marketing Margin ($mm) Q2’21 YoY Growth Variable Marketing Margin % $32.8 31.3% $31.9 29.5% $31.4 $120 28.3% 28.2% 27.4% $29.4 $108.6 24.2% $100 36% $23.5 $80 CAGR 2015-2020 $73.3 $60 $40 $46.1 $35.8 $33.6 $20 $23.4 $0 Q2 2020 Q3 2020 Q4 2020 Q1 2021 Q2 2021 2015 2016 2017 2018 2019 2020 1. Beginning in the first quarter of 2019, we revised our definition of variable marketing margin, or VMM. The VMM displayed above reflects our revised definition of VMM for all years presented. Refer to Key Metrics Definitions in the Appendix for a definition of VMM. Proprietary Information 16Delivering Incremental Variable Marketing Margin 40% Variable Marketing Margin ($mm) Q2’21 YoY Growth Variable Marketing Margin % $32.8 31.3% $31.9 29.5% $31.4 $120 28.3% 28.2% 27.4% $29.4 $108.6 24.2% $100 36% $23.5 $80 CAGR 2015-2020 $73.3 $60 $40 $46.1 $35.8 $33.6 $20 $23.4 $0 Q2 2020 Q3 2020 Q4 2020 Q1 2021 Q2 2021 2015 2016 2017 2018 2019 2020 1. Beginning in the first quarter of 2019, we revised our definition of variable marketing margin, or VMM. The VMM displayed above reflects our revised definition of VMM for all years presented. Refer to Key Metrics Definitions in the Appendix for a definition of VMM. Proprietary Information 16
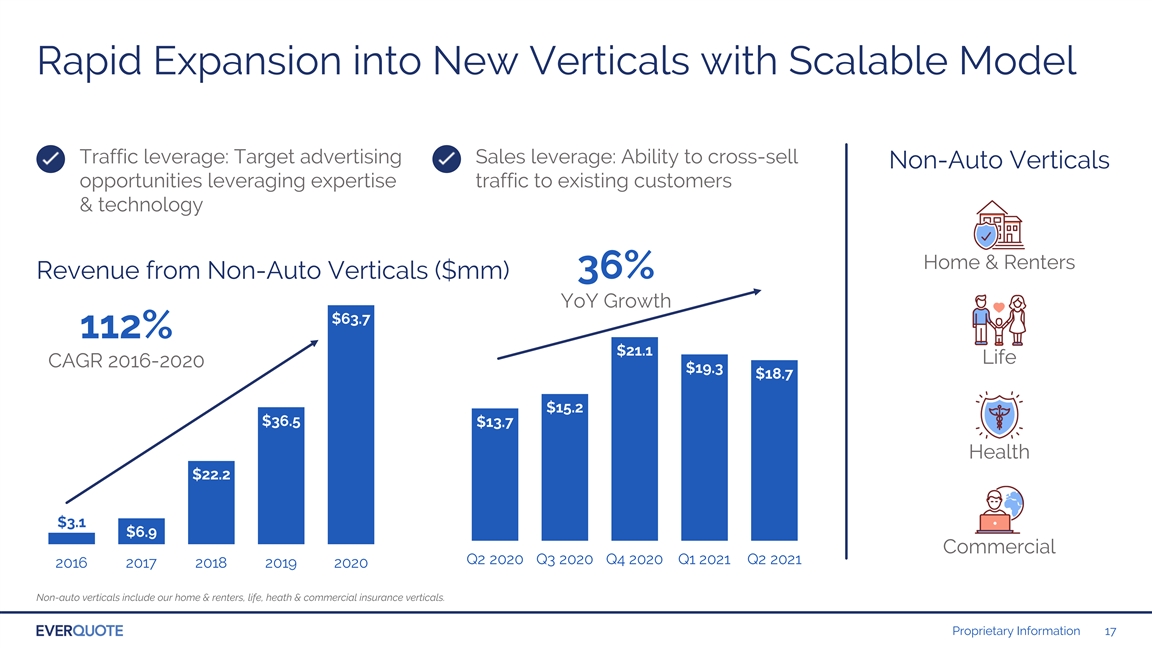
Rapid Expansion into New Verticals with Scalable Model Traffic leverage: Target advertising Sales leverage: Ability to cross-sell Non-Auto Verticals opportunities leveraging expertise traffic to existing customers & technology Home & Renters Revenue from Non-Auto Verticals ($mm) 36% YoY Growth $63.7 112% $21.1 Life CAGR 2016-2020 $19.3 $18.7 $15.2 $36.5 $13.7 Health $22.2 $3.1 $6.9 Commercial Q2 2020 Q3 2020 Q4 2020 Q1 2021 Q2 2021 2016 2017 2018 2019 2020 Non-auto verticals include our home & renters, life, heath & commercial insurance verticals. Proprietary Information 17Rapid Expansion into New Verticals with Scalable Model Traffic leverage: Target advertising Sales leverage: Ability to cross-sell Non-Auto Verticals opportunities leveraging expertise traffic to existing customers & technology Home & Renters Revenue from Non-Auto Verticals ($mm) 36% YoY Growth $63.7 112% $21.1 Life CAGR 2016-2020 $19.3 $18.7 $15.2 $36.5 $13.7 Health $22.2 $3.1 $6.9 Commercial Q2 2020 Q3 2020 Q4 2020 Q1 2021 Q2 2021 2016 2017 2018 2019 2020 Non-auto verticals include our home & renters, life, heath & commercial insurance verticals. Proprietary Information 17

Driving Growth & Profitability 65% Adjusted EBITDA ($mm) Q2’21 YoY Growth $6.6 $18.4 $5.4 $5.2 $4.8 $4.0 $8.3 2018 2018 2018 2019 2020 Q2 2020 Q3 2020 Q4 2020 Q1 2021 Q2 2021 -$5.5 Note: Adjusted EBITDA is a non-GAAP metric, refer to financial reconciliation for additional detail. Proprietary Information 18Driving Growth & Profitability 65% Adjusted EBITDA ($mm) Q2’21 YoY Growth $6.6 $18.4 $5.4 $5.2 $4.8 $4.0 $8.3 2018 2018 2018 2019 2020 Q2 2020 Q3 2020 Q4 2020 Q1 2021 Q2 2021 -$5.5 Note: Adjusted EBITDA is a non-GAAP metric, refer to financial reconciliation for additional detail. Proprietary Information 18

NASDAQ: EVER Proprietary Information 19NASDAQ: EVER Proprietary Information 19

Appendix Proprietary Information 20Appendix Proprietary Information 20

Key Metrics Definitions Quote requests are consumer-initiated requests for an insurance quote that result from a website form, telephones calls with a consumer, or other interactions we have with consumers through third-party websites that result in a revenue generating transaction. Quote As we attract more consumers to our platform & they complete quote requests, we are able to refer them to our insurance provider customers, selling more referrals while also collecting data, which we use to improve user experience, conversion rates & consumer Requests satisfaction. We define variable marketing margin, or VMM, as revenue, as reported in our consolidated statements of operations and Variable comprehensive income (loss), less advertising costs (a component of sales and marketing expense, as reported in our statements of operations and comprehensive income (loss)). We use VMM to measure the efficiency of individual advertising and consumer Marketing acquisition sources and to make trade-off decisions to manage our return on advertising. We do not use VMM as a measure of Margin profitability. We define Adjusted EBITDA as net income (loss), adjusted to exclude: stock-based compensation expense, depreciation and Adjusted amortization expense, acquisition-related costs, legal settlement expense, interest income and the provision for (benefit from) income taxes. We monitor & present Adjusted EBITDA because it is a key measure used by our management & board of directors to EBITDA understand & evaluate our operating performance, to establish budgets & to develop operational goals for managing our business. Proprietary Information 21Key Metrics Definitions Quote requests are consumer-initiated requests for an insurance quote that result from a website form, telephones calls with a consumer, or other interactions we have with consumers through third-party websites that result in a revenue generating transaction. Quote As we attract more consumers to our platform & they complete quote requests, we are able to refer them to our insurance provider customers, selling more referrals while also collecting data, which we use to improve user experience, conversion rates & consumer Requests satisfaction. We define variable marketing margin, or VMM, as revenue, as reported in our consolidated statements of operations and Variable comprehensive income (loss), less advertising costs (a component of sales and marketing expense, as reported in our statements of operations and comprehensive income (loss)). We use VMM to measure the efficiency of individual advertising and consumer Marketing acquisition sources and to make trade-off decisions to manage our return on advertising. We do not use VMM as a measure of Margin profitability. We define Adjusted EBITDA as net income (loss), adjusted to exclude: stock-based compensation expense, depreciation and Adjusted amortization expense, acquisition-related costs, legal settlement expense, interest income and the provision for (benefit from) income taxes. We monitor & present Adjusted EBITDA because it is a key measure used by our management & board of directors to EBITDA understand & evaluate our operating performance, to establish budgets & to develop operational goals for managing our business. Proprietary Information 21

Reconciliation of Adjusted EBITDA Three Months Ended 12 Months Ended ($ in June 30, 2021 March 31, 2021 December 31, 2020 September 30, 2020 June 30, 2020 December 31, 2020 December 31, 2019 December 31, 2018 Thousands) Net income (loss) ($1,881) ($3,801) ($3,768) ($3,184) ($2,808) ($11,202) ($7,117) ($13,791) Stock-based $7,089 $7,520 $6,189 $7,200 $6,250 $12,721 $7,121 compensation $24,179 Depreciation & $3,350 $1,136 $1,174 $1,176 $731 $594 $2,186 $1,341 amortization Legal settlement - - - - - $1,227 - Acquisition- related costs/ $265 ($79) $1,778 $480 - $2,258 - - earnout Interest (income) ($10) ($14) ($13) ($18) ($47) (189) ($669) ($121) expense, net Adjusted EBITDA $6,599 $4,800 $5,362 $5,209 $3,989 $18,396 $8,348 ($5,450) Proprietary Information 22