Attached files
| file | filename |
|---|---|
| EX-23.1 - EX-23.1 - Southern States Bancshares, Inc. | d121570dex231.htm |
| EX-5.1 - EX-5.1 - Southern States Bancshares, Inc. | d121570dex51.htm |
| EX-1.1 - EX-1.1 - Southern States Bancshares, Inc. | d121570dex11.htm |
Table of Contents
As filed with the United States Securities and Exchange Commission on July 30, 2021
Registration No. 333-257915
UNITED STATES
SECURITIES AND EXCHANGE COMMISSION
Washington, D.C. 20549
AMENDMENT NO. 1
to
FORM S-1
REGISTRATION STATEMENT
UNDER THE SECURITIES ACT OF 1933
Southern States Bancshares, Inc.
(Exact name of registrant as specified in its charter)
| Alabama | 6022 | 26-2518085 | ||
| (State or other jurisdiction of Incorporation or organization) |
(Primary Standard Industrial Classification Code Number)
|
(I.R.S. Employer Identification Number) |
615 Quintard Ave.
Anniston, AL 36201
(256) 241-1092
(Address, including zip code, and telephone number, including area code, of registrant’s principal executive offices)
Stephen W. Whatley
Chairman and Chief Executive Officer
Southern States Bancshares, Inc.
615 Quintard Ave.
Anniston, AL 36201
(256) 241-1092
(Name, address, including zip code, and telephone number, including area code, of agent for service)
Copies to:
| Michael D. Waters Clinton H. Smith Jones Walker LLP 420 20th Street North Suite 1100 Birmingham, AL 35203 (205) 244-5210 (205) 244-5410 (facsimile) |
Ralph F. MacDonald, III, Esq. Jones Day 1221 Peachtree St., N.E. Suite 400 Atlanta, Georgia 30361 (404) 521-3939 (404) 581-8330 (facsimile) |
Approximate date of commencement of proposed sale to the public: As soon as practicable after this Registration Statement becomes effective.
If any of the securities being registered on this Form are to be offered on a delayed or continuous basis pursuant to Rule 415 under the Securities Act of 1933, check the following box. ☐
If this Form is filed to register additional securities for an offering pursuant to Rule 462(b) under the Securities Act, check the following box and list the Securities Act registration statement number of the earlier effective registration statement for the same offering. ☐
If this Form is a post-effective amendment filed pursuant to Rule 462(c) under the Securities Act, check the following box and list the Securities Act registration statement number of the earlier effective registration statement for the same offering. ☐
If this Form is a post-effective amendment filed pursuant to Rule 462(d) under the Securities Act, check the following box and list the Securities Act registration statement number of the earlier effective registration statement for the same offering. ☐
Indicate by check mark whether the registrant is a large accelerated filer, an accelerated filer, a non-accelerated filer, a smaller reporting company or an emerging growth company. See definitions of “large accelerated filer,” “accelerated filer,” “smaller reporting company,” and “emerging growth company” in Rule 12b-2 of the Exchange Act.
| Large accelerated filer | ☐ | Accelerated filer | ☐ | |||
| Non-accelerated filer | ☒ | Smaller reporting company | ☒ | |||
| Emerging growth company | ☒ | |||||
If an emerging growth company, indicate by check mark if the registrant has elected not to use the extended transition period for complying with any new or revised financial accounting standards provided pursuant to Section 7(a)(2(B) of the Securities Act. ☐
CALCULATION OF REGISTRATION FEE
|
| ||||||||
| Title of Each Class of Securities to be Registered |
Amount to be Registered(1) |
Proposed Maximum Offering Price Per Share(2) |
Proposed Maximum Aggregate Offering Price(1)(2) |
Amount of Registration Fee | ||||
| Common stock, $5.00 par value per share |
2,300,000 | $21.00 | $48,300,000 | $5,269.53(3) | ||||
|
| ||||||||
|
| ||||||||
| (1) | Includes shares of common stock to be sold by the selling stockholders and shares of common stock that may be purchased by the underwriters pursuant to their option to purchase additional shares in this offering. |
| (2) | Estimated solely for purposes of calculating the registration fee in accordance with Rule 457(o) under the Securities Act of 1933. |
| (3) | The registrant previously paid a registration fee of $3,818.50 in relation to its filing of its initial registration statement on Form S-1 (File No. 333-257915) on July 15, 2021. The registrant has paid the remaining balance of $1,451.03 herewith. |
The registrant hereby amends this registration statement on such date or dates as may be necessary to delay its effective date until the registrant shall file a further amendment which specifically states that this registration statement shall thereafter become effective in accordance with Section 8(a) of the Securities Act of 1933, or until this registration statement will become effective on such date as the Securities and Exchange Commission, acting pursuant to said Section 8(a), may determine.
Table of Contents
The information in this preliminary prospectus is not complete and may be changed. Neither we nor the selling stockholders may sell these securities until the registration statement filed with the Securities and Exchange Commission is effective. This preliminary prospectus is not an offer to sell nor is it soliciting an offer to buy these securities in any jurisdiction where the offer or sale is not permitted.
Subject to Completion, dated July 30, 2021
PRELIMINARY PROSPECTUS
2,000,000 Shares

Common Stock
This is the initial public offering of shares of common stock of Southern States Bancshares, Inc. We are a bank holding company for Southern States Bank, an Alabama state-chartered commercial bank with executive offices in Anniston, Alabama.
We are offering 996,429 shares of our voting common stock. The selling stockholders identified in this prospectus are offering an additional 1,003,571 shares. We will not receive any of the proceeds from the sale of the shares being sold by the selling stockholders.
Prior to this offering, there has been no established public trading market for our common stock. We have applied to list our common stock on the NASDAQ Global Select Market (“NASDAQ”) under the symbol “SSBK.” We currently estimate that the initial public offering price per share of our common stock will be between $19.00 and $21.00 per share.
We are an “emerging growth company” under applicable federal securities law and, as such, will be subject to reduced public company reporting requirements. See “Implications of Being an Emerging Growth Company.”
Investing in our common stock involves risks. See “Risk Factors,” beginning on page 25, for a discussion of certain risks that you should consider before investing in our common stock.
| Per Share |
Total | |||||||
| Initial public offering price |
$ | $ | ||||||
| Underwriting discount(1) |
$ | $ | ||||||
| Proceeds to us before expenses |
$ | $ | ||||||
| Proceeds to the selling stockholders before expenses |
$ | $ | ||||||
| (1) | See “Underwriting” for additional information regarding the underwriting discounts and commissions and certain expenses payable to the underwriters by us. |
The underwriters have an option for a period of 30 days to purchase up to an additional 300,000 shares of our common stock from us on the same terms set forth above.
Neither the Securities and Exchange Commission, nor any state securities commission nor any other regulatory body has approved or disapproved of these securities or passed upon the adequacy or accuracy of this prospectus. Any representation to the contrary is a criminal offense.
Our common stock is not a deposit and is not insured or guaranteed by the FDIC or any other governmental agency.
The underwriters expect to deliver the shares of our common stock to purchasers on or about , 2021 through the book-entry facilities of The Depository Trust Company.
Joint Book-Running Managers
| KEEFE, BRUYETTE & WOODS A Stifel Company |
TRUIST SECURITIES |
Co-Managers
| Hovde Group, LLC | Performance Trust Capital Partners, LLC |
The date of this Prospectus is , 2021
Table of Contents

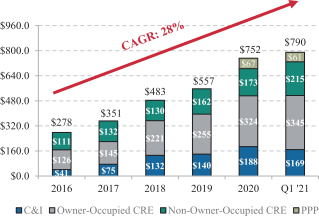
TOTAL ASSETS
(Dollars in millions)
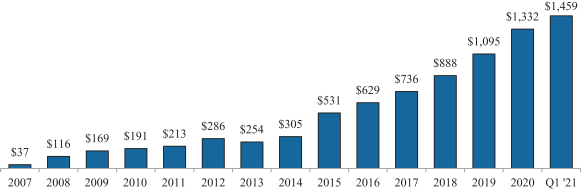
Table of Contents
| Page | ||||
| 1 | ||||
| 14 | ||||
| Selected Historical Consolidated Financial Data and Other Information |
16 | |||
| 21 | ||||
| 25 | ||||
| 52 | ||||
| 55 | ||||
| 56 | ||||
| 57 | ||||
| 59 | ||||
| Management’s Discussion and Analysis of Financial Condition and Results of Operations |
61 | |||
| 100 | ||||
| 111 | ||||
| 119 | ||||
| 129 | ||||
| 132 | ||||
| 134 | ||||
| 140 | ||||
| 152 | ||||
| 154 | ||||
| 159 | ||||
| 159 | ||||
| 159 | ||||
| F-1 | ||||
i
Table of Contents
ABOUT THIS PROSPECTUS
You should rely only on the information contained in this prospectus. Neither we, the selling stockholders nor the underwriters have authorized anyone to provide you with information different from that contained in this prospectus. If anyone provides you with additional, different or inconsistent information, you should not rely on it. Neither we, the selling stockholders nor the underwriters take responsibility for, or can provide any assurance as to the reliability of, any other information that others may give you. This prospectus is an offer to sell only the shares of our common stock offered hereby, and only under circumstances and in jurisdictions where it is lawful to do so. Neither we, the selling stockholders nor the underwriters are making an offer of shares of our common stock in any state, country or other jurisdiction where the offer is not permitted. You should not assume that the information in this prospectus or any free writing prospectus that we provide to you is accurate as of any date other than the date of the applicable document regardless of its time of delivery or the time of any sales of our common stock. Our business, financial condition, results of operations and cash flows may have changed since the date of the applicable document.
Unless otherwise indicated, this prospectus describes the specific details regarding this offering, which we refer to as the “offering,” and the terms and conditions of our common stock, $5.00 par value per share, which we refer to as “common stock,” being offered hereby and the risks of investing in our common stock. For additional information, please see the section entitled “Where You Can Find More Information.”
You should not interpret the contents of this prospectus or any free writing prospectus that we authorize to be delivered to you to be legal, business, financial or tax advice. You should consult with your own advisors for that type of advice and consult with them about the legal, tax, business, financial and other issues that you should consider before investing in our common stock.
Basis of Presentation
In this prospectus, “we,” “our,” “us,” “Southern States Bancshares,” “Southern States,” or “the Company” refers to Southern States Bancshares, Inc., an Alabama corporation, and all consolidated subsidiaries including Southern States Bank, an Alabama banking corporation, unless the context indicates that we refer only to the parent company, Southern States Bancshares. In this prospectus, “Bank” or “Southern States Bank” refers to Southern States Bank, our wholly-owned bank subsidiary.
Industry and Market Data
This prospectus includes industry and market data, forecasts and information that we have prepared based, in part, upon data, forecasts and information that we obtained from regulatory sources, periodic industry publications, third-party studies and surveys, as well as filings of public companies in our industry, internal company surveys and other independent information publicly available to us. These sources include government and industry sources. Industry publications and surveys generally state that the information contained therein has been obtained from sources believed to be reliable. Although we believe information regarding the industry and market data to be reliable and are not aware of any inaccuracies as of the date of this prospectus, we have not independently verified this information and this information could prove to be inaccurate or incomplete. Industry and market data could be wrong because of the method by which sources obtained their data and because information cannot always be verified with complete certainty due to the limits on the availability and reliability of raw data, the voluntary nature of the data gathering process and other limitations and uncertainties, including possible future corrections and updates. In addition, we do not know all of the assumptions regarding general economic conditions or growth that were used in preparing the forecasts from the sources relied upon or cited herein. Some data is also based on our good faith estimates, which are derived from management’s knowledge of the industry and independent sources. We believe our internal research is reliable, even though such research has not been verified by any independent sources. Our estimates involve risks and uncertainties that are subject to
ii
Table of Contents
change based on various factors. Forward-looking information obtained from these sources is subject to the same qualifications and the additional uncertainties regarding the other forward-looking statements in this prospectus. See “Risk Factors.” Trademarks used in this prospectus are the property of their respective owners, although for presentational convenience, we may not use the ® or the TM symbols to identify such trademarks.
Implications of Being an Emerging Growth Company
We qualify as an “emerging growth company” as defined in Section 2(a) of the Securities Act of 1933 (the “Securities Act”), as modified by the Jumpstart Our Business Startups Act of 2012 (“JOBS Act”). An emerging growth company may take advantage of reduced reporting requirements and is relieved of certain other significant requirements that are otherwise generally applicable to public companies. As an emerging growth company:
| • | we are required to present only two years of audited financial statements and only two years of related management’s discussion and analysis of financial condition and results of operations, and provide less than five years of selected financial data in this prospectus; |
| • | we are exempt from the requirement to obtain an attestation report from auditors on management’s assessment of internal control over financial reporting under the Sarbanes-Oxley Act of 2002 (“Sarbanes-Oxley Act”); |
| • | we are not required to comply with any new requirements adopted by the Public Accounting Oversight Board (“PCAOB”), requiring mandatory audit firm rotation or a supplement to the auditor’s report in which the auditor would be required to provide additional information about the audit and the financial statements of the issuer; |
| • | we are permitted to provide less extensive disclosure about our executive compensation arrangements pursuant to the rules applicable to smaller reporting companies, which means we do not have to include a compensation discussion and analysis and certain other disclosures regarding our executive compensation; and |
| • | we are not required to give our stockholders non-binding advisory votes on executive compensation or golden parachute arrangements. |
We will cease to be an emerging growth company upon the earliest of: (i) the last day of the fiscal year in which we have at least $1.07 billion in annual gross revenues, (ii) the date on which we become a “large accelerated filer” as defined in Rule 12b-2 under the Securities Exchange Act of 1934, as amended (the “Exchange Act”) (the last day of the fiscal year in which we have more than $700 million in market value of our common stock held by non-affiliates as of the prior June 30), (iii) the date on which we issue more than $1.00 billion of non-convertible debt during the prior three-year period, or (iv) the last day of the fiscal year following the fifth anniversary of our initial public offering. We may choose to take advantage of some but not all of these reduced burdens. We have elected to adopt certain of the reduced disclosure requirements described above for purposes of the registration statement of which this prospectus is a part.
We expect to take advantage of certain of the reduced reporting and other requirements of the JOBS Act with respect to the periodic reports we will file with the U.S. Securities and Exchange Commission (“SEC”) and proxy statements that we use to solicit proxies from our stockholders. As a result, the information that we provide to our stockholders may be different than what you might receive from public reporting companies from which you hold equity interests. In addition, the JOBS Act permits us to take advantage of an extended transition period for complying with new or revised accounting standards affecting public companies. We have elected to use this extended transition period, which means that the financial statements included in this prospectus, as well as any financial statements that we file in the future, may not be subject to all new or revised accounting standards generally applicable to public companies for the transition period as long as we remain an emerging growth company or until we affirmatively and irrevocably opt out of the extended transition period under the JOBS Act. As a result, our financial statements may not be comparable to the financial statements of public companies that comply with such new or revised accounting standards on a non-delayed basis.
iii
Table of Contents
This summary highlights selected information contained in this prospectus. This summary does not contain all of the information that you should consider before investing in our common stock. You should read the entire prospectus carefully, including the “Risk Factors,” “Cautionary Note Regarding Forward-Looking Statements” and “Management’s Discussion and Analysis of Financial Condition and Results of Operations” sections, and our historical financial statements and the accompanying notes included in this prospectus before deciding to invest in our common stock.
Company Overview
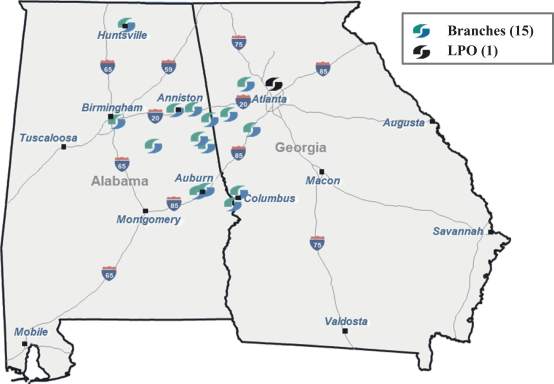
We are a bank holding company headquartered in Anniston, Alabama. We operate primarily through our wholly-owned subsidiary, Southern States Bank, an Alabama banking corporation formed in 2007. The Bank is a full service community banking institution, which offers an array of deposit, loan and other banking-related products and services to businesses and individuals in our communities. Our franchise is focused on personalized, relationship-driven service combined with local market management and expertise to serve small and medium size businesses and individuals. We believe that these services will build stronger, growing communities that will drive our success. As of March 31, 2021, we had total assets of $1.5 billion, gross loans of $1.1 billion, total deposits of $1.3 billion and total stockholders’ equity of $144.6 million.
We provide banking services from 15 offices in Alabama and Georgia. Our primary service areas in Alabama are Anniston, Auburn, Birmingham and Huntsville with a presence extending into Calhoun, Lee, Jefferson, Talladega, Madison, Cleburne and Randolph Counties of Alabama and their surrounding areas. In Georgia, we serve the Columbus metropolitan statistical area (“MSA”), as well as Carroll, Coweta, and Dallas Counties in the greater Atlanta MSA. The Bank also operates a loan production office (“LPO”) in Atlanta, Georgia.
Recent Developments
Our unaudited consolidated financial statements as of and for the three and six month periods ended June 30, 2021, are not yet available. Our independent registered public accounting firm, Mauldin and Jenkins, LLC, has not performed any review procedures with respect to this preliminary financial information.
The following preliminary financial information should be read together with “Management’s Discussion and Analysis of Financial Condition and Results of Operations” and our consolidated financial statements and the related notes to those financial statements for prior periods, as well as “Risk Factors” and “Cautionary Note Regarding Forward-Looking Statements” included elsewhere in this prospectus.
Selected Financial Highlights
| • | Total assets were $1.5 billion as of June 30, 2021, representing a $55.2 million, or 3.8%, increase from March 31, 2021 and a $218.3 million, or 16.8%, increase from $1.3 billion as of June 30, 2020. |
| • | Gross loans, net of unearned income, were $1.1 billion as of June 30, 2021, a $14.3 million, or 1.3%, increase compared to $1.1 billion as of March 31, 2021 and a $113.7 million, or 11.6%, increase compared to $983.9 million as of June 30, 2020. During the quarter ended June 30, 2021, we received net PPP loan payoffs of $23.1 million. Gross loans, net of unearned income (excluding PPP loans), were $1.1 billion as of June 30, 2021, representing a $37.4 million, or 3.7%, increase compared to $1.0 billion as of March 31, 2021 and a $147.6 million, or 16.2%, increase compared to $912.2 million as of June 30, 2020. There is currently only one loan for $3.1 million in deferral, and such deferral ends in October 2021. |
1
Table of Contents
| • | Total deposits were $1.3 billion as of June 30, 2021, representing a $52.6 million, or 4.2%, increase from March 31, 2021 and a $199.8 million, or 18.0%, increase compared to $1.1 billion as of June 30, 2020. This growth is substantially comprised of core deposits. |
| • | Asset quality improved with nonperforming assets to total assets of 0.81% as of June 30, 2021, down from 0.97% and 1.40% as of March 31, 2021 and June 30, 2020, respectively. The allowance for loan losses to total loans (excluding PPP loans) was 1.25% as of June 30, 2021 compared to 1.23% as of March 31, 2021 and 1.15% as of June 30, 2020. Net charge-offs were $16,000 for the three months ended June 30, 2021, compared to $4,000 for the three months ended March 31, 2021 and net recoveries of $3,000 for the three months ended June 30, 2020. Net charge-offs were $20,000 for the six months ended June 30, 2021, compared to net recoveries of $137,000 for the six months ended June 30, 2020. |
| • | Total shareholders’ equity was $148.9 million as of June 30, 2021, up 3.0% from $144.6 million as of March 31, 2021 and up 11.1% from $134.0 million as of June 30, 2020. |
| • | As of June 30, 2021, we exceeded the minimum requirements to be well-capitalized for bank regulatory purposes, with a total risk-based capital ratio of 11.15%, a tier 1 risk-based capital ratio of 10.10%, a common equity tier 1 capital ratio of 10.10%, and a tier 1 leverage ratio of 8.57%. |
Results of Operation
| • | We had net income of $3.9 million for the three months ended June 30, 2021, compared to net income of $5.7 million for the three months March 31, 2021, a decrease of $1.8 million, or 31.6%, and $2.9 million for the three months ended June 30, 2020, an increase of $1.0 million, or 34.5% compared to the same period a year earlier. The decrease from the three months ended March 31, 2021 was substantially the result of a $2.8 million gain on the sale of a USDA loan in the first quarter of 2021. We had net income of $9.6 million for the six months ended June 30, 2021 compared to net income of $5.6 million for the six months ended June 30, 2020, an increase of $4.0 million, or 71.4%, also substantially the result of the $2.8 million gain on the sale of the USDA loan. Excluding the gain on sale of the USDA loan, net income in the first six months of 2021 increased $1.2 million, or 21.4%. The increases in net income for both the three and six months ended June 30, 2021 compared to the same periods ended June 30, 2020 were primarily the result of higher net interest income, which was fueled by higher loan growth. This was partially offset by an increase in noninterest expense for the three and six months ended June 30, 2021, which was the result of an investment in human capital as we develop the metro Atlanta market. |
| • | Net interest margin was 3.75% (3.67% without PPP loans) for the three months ended June 30, 2021, compared to 3.97% (3.79% without PPP loans) for the three months ended March 31, 2021 and 3.31% (3.41% without PPP loans) for the three months ended June 30, 2020. Net interest margin was 3.85% (3.73% without PPP loans) for the six months ended June 30, 2021, compared to 3.56% (3.62% without PPP loans) for the six months ended June 30, 2020. |
| • | Our earnings per common share were $0.51 for the three months ended June 30, 2021, compared to $0.74 for the three months March 31, 2021 and $0.38 for the three months ended June 30, 2020. Our earnings per share was $1.25 for the six months ended June 30, 2021, compared to $0.73 for the six months ended June 30, 2020. Our diluted earnings per common share was $0.50 for the three months ended June 30, 2021, compared to $0.73 for the three months March 31, 2021 and $0.37 for the three months ended June 30, 2020. Our diluted earnings per share was $1.23 for the six months ended June 30, 2021, compared to $0.72 for the six months ended June 30, 2020. |
| • | Our annualized return on average assets (“ROAA”) was 1.05% for the three months ended June 30, 2021, compared to 0.93% for the three months ended June 30, 2020. Our annualized ROAA was 1.35% |
2
Table of Contents
| for the six months ended June 30, 2021, which reflects the gain on sale of the USDA loan in the first quarter of 2021, compared to 0.95% for the six months ended June 30, 2020. Excluding such gain on sale, our annualized ROAA for the first six months of 2021 was 0.96%. |
| • | Our annualized return on average equity (“ROAE”) was 10.62% for the three months ended June 30, 2021, compared to 8.92% for the three months ended June 30, 2020. Our annualized ROAE was 13.31% for the six months ended June 30, 2021, compared to 8.87% for the six months ended June 30, 2020. Excluding the gain on sale of the USDA loan in 2021, our annualized ROAE was 9.41% in the first six months of 2021. |
Redemption of Subordinated Notes
| • | On June 23, 2021, we redeemed all our $4.5 million in outstanding subordinated notes (the “Subordinated Notes”) that had a 6.625% fixed rate of interest at the date of redemption. We used proceeds from our line of credit (the “Line of Credit”) from First Horizon Bank to redeem the Subordinated Notes. Our Line of Credit bears interest at three-month LIBOR plus 2.50%. |
Dividend
On July 21, 2021, we declared a dividend of $0.09 per share, payable on August 11, 2021 to holders of record as of July 29, 2021. Purchasers of common stock in this offering will not receive the dividend.
Our History and Growth
The Bank was organized on August 23, 2007 by a group of financial executives and prominent business leaders with a shared vision to invest in highly experienced people and technology to offer high levels of personal service to our clients. Chartered with approximately $31 million of common equity, the Bank opened its Anniston, Alabama headquarters along with an office in Opelika, Alabama. We opened our Birmingham office six months later in February 2008.
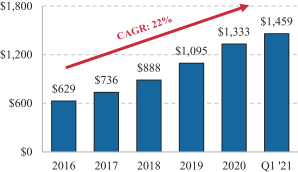
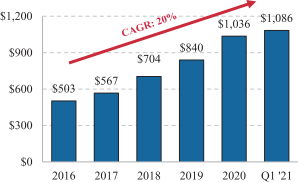
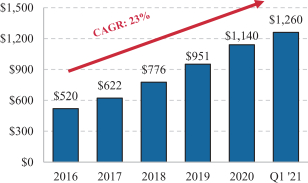
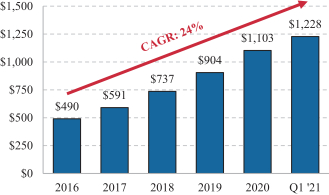
In the following years, our growth has been driven by expansion in existing markets and into new markets. Over the last five years, we have an asset compound annual growth rate (“CAGR”) of over 20% while maintaining profitability, credit quality and prudent capital management. The following information summarizes our history and the tables illustrate our balance sheet and income statement growth as well as trends in other performance metrics as of or for the years ended December 31, 2016 through 2020, and the three months ended March 31, 2021:
| • | On May 18, 2012, we acquired Alabama Trust Bank’s Sylacauga, Alabama branch and approximately $40 million in core deposits through an FDIC-assisted transaction. |
| • | We opened full-service de novo branches in Huntsville, Alabama and Carrollton, Georgia in January and June of 2015, respectively, along with an LPO in Atlanta, Georgia in August 2015. |
| • | In October 2015, we completed our acquisition of Columbus Community Bank in Columbus, Georgia and subsequently opened a second Columbus location in December 2015. We have successfully grown our deposits in this market from approximately $100 million at the time of acquisition to $233 million as of March 31, 2021. |
| • | In 2016, we completed two rounds of private growth capital, issuing $4.5 million in subordinated debt in June and another $41.2 million in equity in December to several institutional investors. All outstanding Subordinated Notes were repaid in June 2021. In January 2017, we raised $3.4 million of common equity from local investors. We used the proceeds from these transactions to improve our capital ratios and to support our growth. Using the newly issued capital, our loans grew by 40.4% during 2017 and 2018 and deposits grew by 49.2% during the same period. We also opened a full service branch in Newnan, Georgia and hired four experienced lenders in Georgia. |
3
Table of Contents
| • | On May 8, 2019, we announced the acquisition of Wedowee, Alabama based East Alabama Financial Group, Inc. (“East Alabama”) and its subsidiary bank, Small Town Bank (“Small Town Bank”) and closed the transaction in September of 2019. The aggregate consideration paid was approximately $24.0 million in cash and the issuance of 1,142,846 shares of common stock. As of June 30, 2019, Small Town Bank had $240.6 million in assets, $120.8 million in gross loans and $199.9 million in deposits, of which $192.1 million were core deposits. Small Town Bank operated six branches along the Alabama-Georgia border, and the acquisition allowed us to enter three new counties: Cleburne and Randolph County, Alabama and Paulding County, Georgia. Small Town Bank also operated a branch in Carroll County, Georgia, which we combined with an existing branch, and an LPO in Oxford, Alabama, which we consolidated with our branch there to expand our existing Anniston footprint. |
| • | In 2020, we achieved record net income of approximately $12.1 million, which represents a 116% increase from 2019. We also had significant balance sheet and customer growth in 2020; our total assets increased 22%, deposits increased 20%, noninterest bearing deposits increased 52% and loans increased 15%, excluding Paycheck Protection Program (“PPP”) loans. Since March 2020, we have been an active participant in the PPP, providing 420 existing customers $71.7 million in loans through the first program and $26.2 million through the second program. In aggregate, we anticipate the realization $3.7 million in fees from this program. Over the course of the pandemic, we granted deferrals on 396 loans totaling $280.1 million, or approximately 28.0% of our loan portfolio. As of March 31, 2021, only two loans totaling $1.1 million remain. |
| Total Assets ($mm)
|
Total Loans ($mm)
| |
|
|
| |
| Total Deposits ($mm)
|
Net Income ($mm)
| |
|
|
|
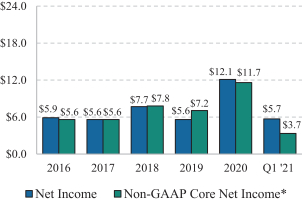
| * | Core net income is a non-GAAP financial measure. Please see “Non-GAAP Financial Measures” for a definition of core net income and a reconciliation of core net income to its most directly comparable GAAP financial measure. |
4
Table of Contents
Return on Average Assets (%)
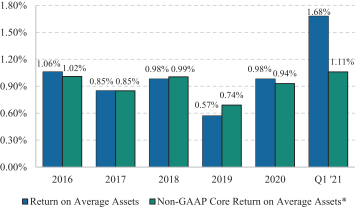
| * | Core return on average assets is a non-GAAP financial measure. Please see “Non-GAAP Financial Measures” for a definition of core return on average assets and a reconciliation of core return on average assets to its most directly comparable GAAP financial measure. |
Business Strategy
Our business strategy is to deliver best-in-class customer service and to be the most trusted bank serving our markets, while maintaining our asset quality and profitability. We intend to execute our strategic plan through the following:
| • | Continuing Our Organic Growth Strategy. Organic loan and deposit growth have been our primary tenet since establishing the Bank, and we believe it is paramount in driving long-term stockholder value. We seek to continue to focus on organic growth throughout our footprint by deepening ties within our communities, building upon current client relationships and further leveraging the extensive experience of our senior management team, board of directors and commercial bankers. We have successfully grown our balance sheet with loan growth of 103.2% (excluding PPP loans) and deposit growth of 142.3% since 2016. We believe that our teams of engaged, experienced employees will continue to be an important factor in cultivating relationships with current and potential clients and driving growth. In addition to our employee focus, we have made significant investments in technology and risk management systems, and we believe that we have developed an infrastructure that can support significant additional growth with minimal capital investment. |
| • | Emphasizing Commercial Banking in Local Communities. We intend to continue operating as a community banking organization focused on meeting the specific needs of small and medium-sized businesses and individuals in our market areas. We will continue to provide a high degree of responsiveness and a wide variety of banking products and services to our customers. We are focused on being a dominant bank in the smaller markets we serve and a competitive player in our larger metropolitan markets. Our consistent corporate message is that the success of our communities and their businesses and individuals will drive the success of the Bank. |
| • | Pursuing Strategic Growth Opportunities through Acquisitions and New Market Development. We anticipate continuing to selectively pursue future acquisitions and new market expansions to supplement organic growth in our legacy markets. Our organic growth has been complemented by synergistic acquisitions and de novo expansion. We seek to expand our operations in attractive and adjacent markets with experienced banking teams that are a cultural fit and knowledgeable of our target client base. We may also make acquisitions or open additional offices in our existing markets. We seek acquisitions that |
5
Table of Contents
| provide meaningful financial benefits, long-term organic growth opportunities and economies of scale without compromising asset quality to the overall organization. Generally, we seek acquisitions of banks with $250.0 million to $750.0 million of assets headquartered in Alabama, Georgia, and select southeastern Tennessee markets, with an emphasis along the I-20, I-85 and I-75 corridors. Currently, we believe that there are approximately 103 potential banks that meet our size and location targets. |
| • | Funding Asset Growth through Core Deposits and Relationship Banking. We fund our loan growth primarily through low-cost core customer deposits. Our ratio of core deposits (total deposits less time deposits greater than $250,000) were 97.4% of total deposits as of March 31, 2021. Our loan to deposit ratio, excluding PPP, as of March 31, 2021 was 81.1%. The strength of our deposit franchise results from our development and maintenance of long-standing customer relationships. Our relationship managers and branch managers actively seek lending relationships with our existing depositors. Today, we believe approximately 65% of our lending relationships have deposits with our bank and our top 25 loans all have deposit relationships as of March 31, 2021. Additionally, we attract deposits from our commercial customers by providing them with personal service, a broad suite of commercial banking and treasury management products and convenient services such as remote deposit capture and commercial internet banking. |
| • | Leveraging Technology to Enhance the Client Experience and Improve Productivity. We provide client convenience through the use of technology and our mobile banking applications, along with our strategically placed banking locations. Since our founding, we have made significant investments in technology to offer online and mobile banking products that we believe are comparable to those offered by many similar-sized competitors and those of the nation’s largest banks. We utilize Jack Henry & Associates, Inc. (“Jack Henry”) as a core processing service provider that we believe can support our growth plan. We also leverage technology solutions to manage cyber security risks and data privacy. In addition to client-facing technology, significant investments have been made in the technology and software utilized by our employees. This technology and software enables our employees to be more productive by enhancing workflow and internal and external management reporting, removing unnecessary steps and reducing manual errors. For example, in 2020, we initiated a new customer platform through Jack Henry, which allows for electronic signatures on new and existing deposit accounts. In 2021, we are implementing a new lending platform to provide more digital capabilities to our borrowers and create internal efficiencies throughout our loan underwriting and processing. |
Competitive Strengths
We believe that the following strengths will help us execute our business strategy:
| • | Experienced and Invested Leadership. Our board of directors has decades of combined business experience from a variety of backgrounds. Our directors actively participate in and support community activities, which we believe significantly benefit our business development efforts. Our executive leadership team is comprised of established industry veterans with a track record of profitable growth, operating efficiencies and strong risk management. Collectively, our directors and senior executives own approximately 15.0% of the total common stock outstanding as of March 31, 2021, excluding stock held by a private equity fund with a representative on our board of directors. |
| • | Stephen W. Whatley, founder of the Bank, serves as Chief Executive Officer of Southern States, a position he has held since 2007, and Chairman of the Board of Southern States, a position he has held since 2014. Prior to founding Southern States, Mr. Whatley served as Market President at Colonial Bank covering several counties in East Alabama and West Georgia. Mr. Whatley has over 40 years of experience in the banking industry in multiple states across the country. |
6
Table of Contents
| • | Mark Chambers serves as President of Southern States. Mr. Chambers has worked at Southern States since 2007, including as Senior Executive Vice President and President of the Southeast Region. He has served as President since 2019. Mr. Chambers held the position of Market President (Auburn and Opelika, Alabama) at Wachovia Bank before his time at Southern States. He has over 30 years of banking experience. |
| • | Lynn Joyce serves as Senior Executive Vice President and Chief Financial Officer of Southern States. She has held this position since joining Southern States in 2013. Prior to joining Southern States, Ms. Joyce served in various positions with First Financial Bank, Bessemer, Alabama, which was publicly traded on NASDAQ, and prior to that worked in public accounting at a national firm. |
| • | Greg Smith is Senior Executive Vice President and Chief Risk Officer, positions he has held since 2019. From 2006 until 2019, he served as Senior Vice President and Chief Credit Officer of Southern States. Prior to joining Southern States, he worked as Commercial Loan Officer and Market President (Anniston, Alabama) at Regions Bank, a regional bank. Mr. Smith has over 30 years of experience in the banking industry. |
| • | Jack Swift is Senior Executive Vice President and Chief Operating Officer of Southern States. He has held this position since 2019. Previously, he served as Senior Executive Vice President and President of the Central Region of Southern States from 2006 until 2019. Prior to joining Southern States, Mr. Swift worked as Senior Vice President at Colonial Bank. Mr. Swift has over 30 years of experience in the banking industry. |
In addition to our executive leadership team, we believe that we are supported by a deep and talented bench of market leaders, many of whom have been with us for much of our existence.
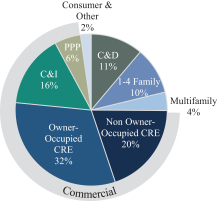
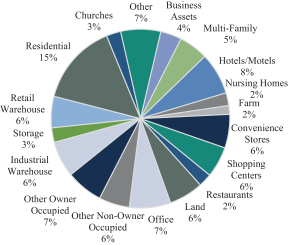
| • | Diversified Loan Portfolio. We have an attractive, commercially focused loan portfolio, with 15.6% commercial and industrial, or C&I, loans, 31.7% owner-occupied commercial real estate, or CRE loans, 19.8% non-owner-occupied CRE loans, and 10.0% one- to-four-family residential loans at March 31, 2021. Approximately 47.3% of our loan portfolio is comprised of owner-operated business loans, which includes C&I and owner-occupied CRE loans on a combined basis, and 34.8% of our portfolio consists of loans for investor-owned properties and projects, which includes non-owner-occupied CRE loans, multi-family loans and construction and land development loans, or C&D loans, on a combined basis. We have had loan growth of 18.2% CAGR, excluding PPP, since 2016. Our loans are in market, except where we follow a local loan customer out of market. We believe that our knowledgeable and prudent approach to commercial lending results in relatively lower losses caused by defaults. |
7
Table of Contents
| Loan Portfolio
|
Commercial and CRE Loan Portfolio
| |
|
|
| |
| Loans by Geography*
|
CRE by Type
| |
|
|
| |
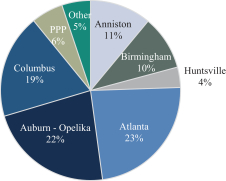
| * | Other markets include Sylacauga, Wedowee, Ranburne, Roanoke and Heflin; Atlanta includes the Carrolton, Newnan and Dallas markets |
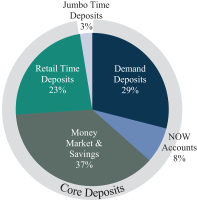
| • | Core-Deposit Base. We have built a strong core deposit base by providing quality products and services to customers in our market areas. We offer retail deposit services through our existing branch network, as well as mobile and online banking services. Core deposits totaled $1.2 billion, or 97.4% of total deposits, and noninterest-bearing deposits totaled $365.1 million, or 28.9% of total deposits, as of March 31, 2021. Our commercial lending has led to strong core deposit growth with a 24.1% CAGR since 2016. Our cost of total deposits was 0.39% for the three months ended March 31, 2021. |
8
Table of Contents
| Deposit Portfolio
|
Core Deposits ($mm)
| |
|
|
|
| • | History of Successful Acquisitions. We have pursued a strategy of disciplined organic and acquisitive growth. Since 2012, we have successfully completed three acquisitions, including one bank purchased from the FDIC and two whole-bank acquisitions. Our management team has demonstrated success in identifying and integrating strategic transactions that either added density to our footprint or expanded our presence into attractive markets to ultimately build long-term stockholder value. Following each transaction, we retained the majority of the acquired deposit and desired lending relationships, which we believe reflects the strength of our relationship-based community banking focus and the quality of our established integration processes. When negotiating a transaction, we are disciplined on price and structure in order to manage the initial tangible book value dilution and earnback period. We modeled our two whole-bank acquisitions of Columbus Community Bank and Small Town Bank on a projected 3-year or less tangible book value earnback period with double digit accretion to projected earnings per share. We believe our approach to acquisitions and the availability of a publicly traded stock after this offering will position us well to be the acquirer of choice for other institutions in our target markets. |
| • | Prudent Credit Risk Management. We have a culture of well-developed risk management procedures at all levels of our organization. Our loan portfolio is primarily originated from borrowers within our footprint and is subject to a rigorous credit evaluation process that seeks to balance responsiveness with prudent underwriting and pricing practices. A centralized credit underwriting group underwrites all credit exposures, ensuring consistent application of credit standards. We have established processes to monitor our loan portfolio on a regular basis. Our management team and board of directors have established concentration limits by loan type, industry, and related borrowers, which are regularly reviewed in light of current conditions in our targeted market areas to mitigate developing risk areas within our loan portfolio and to ensure that the asset quality of our loan portfolio remains strong. Our CRE, C&D, and hospitality loans as a percentage of total capital at March 31, 2021 was 338.4%, 147.7%, and 54.0%, respectively. When credit issues arise, our management team takes an active approach in handling the problem. For example, we capped our hospitality loans at existing levels in January 2020 given market conditions, and similarly capped our multifamily loans in September 2020; both measures are still in effect today. We monitor our loan loss reserve and seek to maintain an adequate reserve for future losses. |
| • | Stockholder Focus. We started the Bank with a strategic plan to provide consistent, long-term growth and returns to our stockholders. Our tangible book value per share increased 16.1% from December 31, 2019 to March 31, 2021, while increasing dividends and generating strong returns on capital. We changed from an annual to a quarterly dividend in April 2020 when we declared a $0.08 dividend per share. In January 2021, we increased our quarterly dividend to $0.09 per share. We believe that our experienced leadership team, commitment to organic and acquisitive growth, and prudent risk management will allow us to consistently build value for our stockholders. |
9
Table of Contents
Our Markets
We provide banking services from 15 offices in Alabama and in the Atlanta and Columbus, Georgia MSAs. Our markets are a mix of higher-growth areas and stable markets with strong core deposits. We have a top five deposit market share in four counties of operation and have outperformed the deposit growth in the majority of our markets. We find strength in the stability of our rural markets coupled with higher growth potential in metropolitan areas such as Atlanta, Birmingham, Huntsville and Auburn. Below is a description of our operations in the MSAs and selected counties:
| Market Area* |
Total Population 2021 (Estimated) |
Projected Population Change 2021-2026 (%) |
Projected Median Household Income 2026 ($) |
Projected Household Income Change 2021-2026 (%) |
Unemployment Rate** (%) |
|||||||||||||||
| Anniston-Oxford MSA |
112,767 | (1.2 | ) | 52,934 | 7.9 | 3.4 | ||||||||||||||
| Atlanta-Sandy Springs-Alpharetta MSA |
6,137,994 | 5.9 | 75,740 | 12.2 | 3.9 | |||||||||||||||
| Auburn-Opelika MSA |
167,412 | 4.6 | 56,718 | 8.7 | 2.4 | |||||||||||||||
| Birmingham-Hoover MSA |
1,094,169 | 0.4 | 69,086 | 13.1 | 2.6 | |||||||||||||||
| Columbus MSA |
321,811 | 2.1 | 54,764 | 9.7 | 4.2 | |||||||||||||||
| Huntsville MSA |
481,729 | 4.3 | 72,962 | 7.2 | 2.2 | |||||||||||||||
| Cleburne County, AL |
14,883 | 0.2 | 48,082 | 6.8 | 2.2 | |||||||||||||||
| Randolph County, AL |
22,747 | 0.5 | 49,772 | 6.6 | 2.2 | |||||||||||||||
| Talladega County, AL |
79,589 | (0.7 | ) | 47,451 | 7.3 | 3.6 | ||||||||||||||
| Market Area*** |
Market Rank |
Deposit Market Share (%) |
Number of Branches |
Market Deposits ($mm) |
Deposits Per Branch ($mm) |
YoY Deposit Growth (%) |
||||||||||||||||||
| Anniston-Oxford MSA |
5 | 10.7 | 1 | 234.4 | 234.4 | (11.7 | ) | |||||||||||||||||
| Atlanta-Sandy Springs-Alpharetta MSA |
49 | 0.1 | 3 | 140.9 | 50.0 | 28.4 | ||||||||||||||||||
| Auburn-Opelika MSA |
7 | 6.7 | 2 | 239.5 | 119.8 | 40.3 | ||||||||||||||||||
| Birmingham-Hoover MSA |
31 | 0.1 | 1 | 48.3 | 48.2 | (9.6 | ) | |||||||||||||||||
| Columbus MSA |
6 | 1.4 | 2 | 171.4 | 85.7 | (3.7 | ) | |||||||||||||||||
| Huntsville MSA |
22 | 0.5 | 1 | 49.7 | 49.7 | 29.3 | ||||||||||||||||||
| Cleburne County, AL |
2 | 31.3 | 2 | 51.6 | 25.8 | (9.4 | ) | |||||||||||||||||
| Randolph County, AL |
1 | 35.7 | 2 | 125.4 | 62.7 | 5.3 | ||||||||||||||||||
| Talladega County, AL |
5 | 5.3 | 1 | 52.2 | 52.2 | 29.3 | ||||||||||||||||||
| * | Demographic data provided by Claritas based on U.S. Census data |
| ** | Source: U.S. Bureau of Labor Statistics for MSAs; Alabama Department of Labor for counties; data as of May 2021 |
| *** | Source: FDIC; Deposit data as of 6/30/20 |
Atlanta, Georgia. The Atlanta MSA is the ninth largest metro area in the United States with a 2020 population of 6.1 million. Atlanta has strong demographics and is projected by the U.S. Census Bureau to exceed the national average in population growth, median 2021 household income and change in household income from 2021 to 2026. Atlanta was voted the second best city for people between the ages of 21 and 36 by Money.com, and it was also ranked the thirteenth Best Places for Business and Careers by Forbes. In 2020, Atlanta was the number one growth leader for becoming a metro area tech hub and was voted the number three metro area for corporate headquarters by Business Facilities. In fact, it serves as the headquarters of 16 Fortune 500 companies including Coca-Cola, Home Depot, UPS, WestRock and Delta Air Lines. The Atlanta MSA is home to multiple universities and professional sports teams. Businesses are attracted to Atlanta by its strong economic opportunities, talent-rich labor pool, and position as the central hub of the Southeast.
10
Table of Contents
Auburn-Opelika, Alabama. The Auburn-Opelika MSA was the fourth-highest ranked MSA in the country in terms of migration growth, according to U-Haul’s ‘2020 Migration Trends’ study. In addition to being home to Auburn University, the largest employer in the MSA, accounting for approximately a quarter of the city’s workforce, The East Alabama Medical Center, a Wal-Mart Distribution Center, Mando America Corporation, and Briggs & Stratton, have helped make Auburn-Opelika the second fastest growing MSA in Alabama.
Birmingham, Alabama. Birmingham is the largest market in Alabama by population and has a history of strong economic performance. In 2020, Birmingham was one of the cities with the lowest cost of living in America. Its healthcare, financial services and materials industries have continued to drive economic development and to attract new corporations across all sectors. Birmingham ranks in the top ten as a moving destination for new college graduates based on an April 2020 report by Smartasset Financial Technology. Also, Birmingham was the number eight best city for jobs in 2020 per Glassdoor. The most prominent companies headquartered in the city are Altec Industries, Encompass Health, Vulcan Materials and Alabama Power. Additionally, University of Alabama Birmingham serves as an international leader in health care and as one of the top transplant centers in the world.
Huntsville, Alabama. Huntsville is home to the Redstone Arsenal, which includes the U.S. Space and Rocket Center, NASA’s Marshall Space Flight Center, and the United States Army Aviation and Missile Command. Huntsville’s focus on space and technology attracts well-regarded professionals and businesses alike. Over 40% of the city has obtained a Bachelor’s Degree or higher education, ranking it among the top-educated cities in the nation. Huntsville is one of the top 10 best cities for jobs in STEM by Forbes, and employers in Huntsville hire the third most high-tech employees in the county. The city was voted Top Ten Best Places for Business and Careers by Forbes with strong projected economic growth. The largest employer in Huntsville is the U.S. Army, but NASA and Boeing combine for nearly 9,000 employees as well. Huntsville’s median household income is second to Atlanta in our markets. The City of Huntsville is the second largest city and the fastest growing major city in Alabama.
Columbus, Georgia. Columbus is the third most populous MSA in Georgia. The most notable employer is Fort Benning Military Base, located just south of the city, which employs over 40,000 people. The Columbus Chamber of Commerce estimates that Ft. Benning has an economic impact of more than $4 billion on the surrounding area. Other companies headquartered in Columbus include Aflac and the Total Systems group of Global Payments.
Corporate Information
Our principal executive office is located at 615 Quintard Avenue, Anniston, Alabama 36201, and our telephone number is (256) 241-1092. We maintain an Internet website at www.southernstatesbank.net. The information contained on or accessible from our website is not part of this prospectus and is not incorporated by reference herein.
Summary Risk Factors
You should carefully consider the risks described under “Risk Factors” beginning on page 25 of this prospectus, as well as other information included in this prospectus, including our financial statements and the notes thereto, before making an investment decision. These risks include, but are not limited to:
Risks Related to Our Business
| • | The long-term effects of the current COVID-19 pandemic are unknown, continue to evolve, and could ultimately impact general economic activity, financial resources, demand for banking services, and result in governmental responses, which could result in negative effects on our business, financial condition, liquidity and results of operations. |
11
Table of Contents
| • | We may face risks in participating as a lender in the PPP program. |
| • | Our business is concentrated in, and largely dependent upon, the continued growth of, and economic conditions in, the markets where we operate. |
| • | Our profitability is vulnerable to interest rate fluctuations. |
| • | The elimination of the London Interbank Offered Rate (“LIBOR”) and its replacement by other benchmark rates and the market acceptance of alternative indexes could adversely impact our business and results of operations. |
| • | We could suffer losses from a decline in the credit quality of our assets. |
| • | A significant portion of our loan portfolio is secured by real estate, and events that negatively impact the real estate market (such as the impact of COVID-19 on the hospitality industry) could negatively affect our business. |
| • | Our allowance for estimated loan losses may not be adequate, which may require us to take a charge to earnings and adversely impact our financial condition and results of operations. |
| • | Acquisitions may disrupt our business and dilute stockholder value, and integrating acquired companies may be more difficult, costly, or time-consuming than we expect. |
| • | Our financial performance will be negatively impacted if we are unable to execute our growth strategy, including branch expansions into new markets. |
| • | Our liquidity needs might adversely affect our financial condition and results of operations. |
| • | We may not be able to adequately measure and limit the credit risks associated with our loan portfolio, which could adversely affect our profitability. |
| • | As a community banking institution, we have smaller lending limits and different lending risks than certain of our larger, more diversified competitors. |
| • | Our business success and growth depends significantly on key management personnel and our ability to attract and retain key people. |
Risks Related to Banking Regulation
| • | The banking industry is subject to extensive regulation. |
| • | Banking agencies periodically conduct examinations, and failure to comply with any supervisory actions could result in materially adverse effects. |
| • | FDIC deposit insurance assessments may materially increase in the future, which would have an adverse effect on earnings. |
| • | Banks are subject to minimum capital requirements by regulators. |
| • | The Federal Reserve may require us to commit capital resources to support the Bank. |
| • | The Bank may need to raise additional capital in the future, including as a result of potential increased minimum capital thresholds established by regulators, but that capital may not be available when it is needed or may be dilutive to stockholders. |
| • | The Company is an entity separate and distinct from the Bank. |
| • | The Bank is the Company’s principal asset, and all of the Bank’s outstanding stock has been pledged to secure a line of credit. |
12
Table of Contents
| • | The Company depends on dividends from the Bank, and a bank’s ability to pay dividends is subject to restriction. |
| • | The banking industry is highly competitive and technology in the industry is continually evolving. |
Risks Related to this Offering and an Investment in Our Common Stock
| • | No prior public market exists for our common stock, and an active, liquid market for our common stock may not develop or be sustained following this offering. |
| • | The market price of our common stock may be subject to substantial fluctuations. |
| • | Institutional holders own a significant amount of our common stock. |
| • | Future sales or the availability for sale of substantial amounts of our common stock in the public market could adversely affect the prevailing market price of our common stock and could impair our ability to raise capital through future sales of equity securities. |
| • | Investors in this offering will experience immediate and substantial dilution. |
| • | We have broad discretion in the use of the net proceeds from this offering, and our use of those proceeds may not yield a favorable return on your investment. |
| • | The rights of our common stockholders are subordinate to the rights of the holders of any debt and may be subordinate to any series of preferred stock that we may issue in the future. |
| • | Our corporate governance documents, and certain corporate and banking laws applicable to us, could make a takeover more difficult, which could adversely affect our common stock. |
| • | There are also substantial regulatory limitations on changes of control of bank holding companies that may discourage investors from purchasing shares of our common stock. |
| • | We are an “emerging growth company” and subject to reduced SEC reporting requirements. |
| • | Any deficiencies in our financial reporting or internal controls could materially and adversely affect our business and the market price of our common stock. |
| • | Securities analysts may not initiate or continue coverage on us. |
| • | An investment in our common stock is not an insured deposit and is subject to risk of loss. |
General Risk Factors
We are also subject to a number of general risks as described in “Risk Factors—General Risk Factors,” which could adversely affect our business.
13
Table of Contents
This summary highlights information presented in greater detail elsewhere in this prospectus. This summary is not complete and does not contain all the information you should consider before investing in our common stock. You should carefully read this entire prospectus before investing in our common stock including “Risk Factors” and our consolidated financial statements and related notes appearing elsewhere in this prospectus.
| Common stock offered by us |
996,429 shares (or 1,296,429 shares if the underwriters exercise in full their option to purchase additional shares of our common stock). |
| Common stock offered by selling stockholders |
1,003,571 shares. |
| Common stock outstanding immediately after completion of this offering |
8,712,857 shares of common stock (or 9,012,857 shares if the underwriters exercise in full their option to purchase additional shares of our common stock). |
| Use of proceeds |
Assuming an initial public offering price of $20.00 per share, which is the midpoint of the offering price range set forth on the cover page of this prospectus, we estimate that the net proceeds to us from the sale of our common stock in this offering will be $16.7 million (or $22.3 million if the underwriters exercise in full their option to purchase additional shares of our common stock), after deducting the estimated underwriting discounts and commissions and offering expenses. We intend to use the net proceeds for general corporate purposes, which may include capital and liquidity to support our growth, and potential acquisitions of other banks or closely related businesses. |
| We will not receive any proceeds from the sale of shares by selling stockholders. |
| See “Use of Proceeds” for more information. |
| Dividends |
Our stockholders are entitled to receive dividends on common stock only if, when and as declared by our board of directors from funds legally available therefor under Alabama corporate law and as limited by our banking regulators. We have paid a regular annual cash dividend on our common stock since 2012. We declared and paid dividends of $0.08 per share following the quarters ended March 31, 2020, June 30, 2020 and September 31, 2020 and a dividend of $0.09 per share following the quarters ended December 31, 2020 and March 31, 2021. On July 21, 2021, we declared a dividend of $0.09 per share, payable on August 11, 2021 to holders of record as of July 29, 2021. Purchasers of common stock in this offering will not receive the dividend. However, any future determination relating to dividends will be made at the discretion of our board of directors and will depend on our financial condition, liquidity, results of operations and other factors deemed relevant by our board of directors. See “Dividend Policy” and “Risk Factors.” |
14
Table of Contents
| Directed share program |
At our request, the underwriters have reserved for sale at the initial public offering price approximately 5.2% of the shares offered hereby for Company and Bank executive officers and directors. The number of shares available for sale to the general public will be reduced to the extent such persons purchase reserved shares. Any reserved shares not so purchased will be offered by the underwriters to the general public on the same basis as the other shares offered hereby. Directors and executive officers have expressed an intent to buy approximately $2.1 million of shares in the offering through the directed share program. See “Underwriting—Directed Share Program.” |
| Listing |
We have applied to list our common stock with NASDAQ under the trading symbol “SSBK.” |
| Risk factors |
Investing in our common stock involves risks. See “Risk Factors,” beginning on page 25, for a discussion of factors that you should carefully consider before making an investment decision. |
Except as otherwise indicated, all information in this prospectus relating to the number of shares of common stock to be outstanding immediately after the completion of this offering is based on 7,716,428 shares outstanding as of July 30, 2021, and:
| • | includes 43,389 shares of unvested restricted stock and excludes 501,492 shares of stock subject to unexercised stock options; |
| • | assumes no exercise by the underwriters of their option to purchase additional shares of our common stock; and |
| • | assumes that all shares reserved under the Directed Share Program are purchased in such program or otherwise sold in the offering. This does not include any shares purchased by our directors, executive officers and principal stockholders in the offering, including through the Directed Share Program. |
Following this offering, holders of non-voting common stock are expected to convert non-voting common stock into voting common stock and hold an aggregate of 9.9% of the outstanding shares of Southern States voting common stock. See “Principal and Selling Stockholders.”
15
Table of Contents
Selected Historical Consolidated Financial Data and Other Information
The following tables set forth selected historical consolidated financial information for each of the periods indicated. The selected historical financial information as of and for the years ended December 31, 2020 and 2019, except for the selected ratios, is derived from our audited financial statements included elsewhere in this prospectus. The selected historical financial information as of and for the years ended December 31, 2018, 2017 and 2016, except for the selected ratios, is derived from our audited financial statements not included in this prospectus. The selected historical financial information as of March 31, 2021, and for the three months ended March 31, 2021 and 2020, except for the selected ratios, is derived from our unaudited financial statements included elsewhere in this prospectus. The selected financial data as of March 31, 2020, except for the selected ratios, is derived from our unaudited financial statements not included in this prospectus.
You should read the information set forth below in conjunction with the sections titled “Management’s Discussion and Analysis of Financial Condition and Results of Operations” and “Capitalization,” as well as our consolidated financial statements and the related notes included elsewhere in this prospectus.
| As of and for the Three Months Ended March 31, |
As of and for the Year Ended December 31, | |||||||||||||||||||||||||||
| 2021 | 2020 | 2020 | 2019 | 2018 | 2017 | 2016 | ||||||||||||||||||||||
| (Dollars in thousands, except per share data) |
||||||||||||||||||||||||||||
| Statement of Income Data: |
||||||||||||||||||||||||||||
| Interest Income |
$ | 13,677 | $ | 12,509 | $ | 50,285 | $ | 46,955 | $ | 37,193 | $ | 29,567 | $ |
26,327 |
| |||||||||||||
| Interest Expense |
1,393 | 2,727 | 8,708 | 12,106 | 7,528 | 3,858 | |
3,190 |
| |||||||||||||||||||
| Net Interest Income |
12,284 | 9,782 | 41,577 | 34,849 | 29,665 | 25,709 | |
23,136 |
| |||||||||||||||||||
| Provision for Loan Losses |
750 | 800 | 3,300 | 5,700 | 2,196 | 1,315 | |
1,016 |
| |||||||||||||||||||
| Noninterest Income |
4,496 | 2,402 | 8,541 | 6,710 | 3,464 | 3,072 | |
4,176 |
| |||||||||||||||||||
| Merger Related Expenses |
— | — | — | 3,373 | — | — | |
— |
| |||||||||||||||||||
| Other Noninterest Expense |
8,532 | 7,886 | 32,185 | 24,398 | 20,924 | 18,081 | |
17,234 |
| |||||||||||||||||||
| Income before Income Taxes |
7,498 | 3,498 | 14,633 | 8,088 | 10,009 | 9,385 | |
9,062 |
| |||||||||||||||||||
| Income Tax Expense |
1,817 | 823 | 2,526 | 2,486 | 2,296 | 3,785 | |
3,200 |
| |||||||||||||||||||
| Net Income |
5,681 | 2,675 | 12,107 | 5,602 | 7,713 | 5,600 | |
5,862 |
| |||||||||||||||||||
| Balance Sheet Data (Period End): |
||||||||||||||||||||||||||||
| Cash and Cash Equivalents |
$ | 170,728 | $ | 109,517 | $ | 84,907 | $ | 115,235 | $ | 86,428 | $ | 68,528 | $ |
41,571 |
| |||||||||||||
| Securities |
106,217 | 76,021 | 114,001 | 59,947 | 52,133 | 53,483 | |
42,153 |
| |||||||||||||||||||
| Loans held for sale |
2,268 | 11,940 | 5,696 | 2,578 | 233 | 851 | |
1,573 |
| |||||||||||||||||||
| Loans, net of unearned income(1) |
1,083,274 | 887,731 | 1,030,115 | 837,441 | 703,746 | 566,333 | |
501,283 |
| |||||||||||||||||||
| Allowance for Loan Losses |
12,605 | 10,199 | 11,859 | 9,265 | 7,833 | 5,754 | |
4,949 |
| |||||||||||||||||||
| Loans, net |
1,070,669 | 877,532 | 1,018,256 | 828,176 | 695,913 | 560,579 | |
496,334 |
| |||||||||||||||||||
| Goodwill |
16,862 | 16,862 | 16,862 | 16,862 | 6,041 | 6,041 | |
6,041 |
| |||||||||||||||||||
| Other Intangibles |
1,698 | 1,961 | 1,764 | 2,027 | 334 | 462 | |
590 |
| |||||||||||||||||||
16
Table of Contents
| As of and for the Three Months Ended March 31, |
As of and for the Year Ended December 31, | |||||||||||||||||||||||||||
| 2021 | 2020 | 2020 | 2019 | 2018 | 2017 | 2016 | ||||||||||||||||||||||
| (Dollars in thousands, except per share data) |
||||||||||||||||||||||||||||
| Total Assets |
1,459,236 | 1,170,381 | 1,332,506 | 1,095,491 | 887,607 | 735,531 | |
628,578 |
| |||||||||||||||||||
| Deposits |
1,260,044 | 1,004,252 | 1,139,661 | 950,513 | 775,785 | 621,600 | |
520,058 |
| |||||||||||||||||||
| FHLB Advances |
31,900 | 20,850 | 30,900 | — | 7,500 | 16,510 | |
19,279 |
| |||||||||||||||||||
| Other Borrowings |
12,480 | 12,473 | 12,468 | 12,462 | 4,462 | 4,446 | |
4,430 |
| |||||||||||||||||||
| Other Liabilities |
10,212 | 5,408 | 8,821 | 5,879 | 4,385 | 3,164 | |
2,778 |
| |||||||||||||||||||
| Total Liabilities |
1,314,636 | 1,042,983 | 1,191,850 | 968,854 | 792,131 | 645,719 | 546,546 | |||||||||||||||||||||
| Total Stockholders’ Equity |
144,600 | 127,398 | 140,656 | 126,637 | 95,475 | 89,812 | |
82,033 |
| |||||||||||||||||||
| Per Share Data: |
||||||||||||||||||||||||||||
| Shares of common stock issued and outstanding |
7,716,428 | 7,675,024 | 7,678,195 | 7,650,772 | 6,483,183 | 6,475,950 | |
5,418,724 |
| |||||||||||||||||||
| Basic Weighted average shares outstanding |
7,681,578 | 7,654,192 | 7,673,085 | 6,840,411 | 6,473,652 | 6,208,498 | |
3,284,848 |
| |||||||||||||||||||
| Diluted weighted average shares outstanding |
7,794,859 | 7,791,229 | 7,765,863 | 6,901,621 | 6,515,173 | 6,246,065 | |
3,308,890 |
| |||||||||||||||||||
| Basic earnings per share |
0.74 | 0.35 | 1.58 | 0.82 | 1.19 | 0.90 | |
1.70 |
| |||||||||||||||||||
| Diluted earnings per share |
0.73 | 0.34 | 1.56 | 0.81 | 1.18 | 0.89 | |
1.69 |
| |||||||||||||||||||
| Book Value Per Share |
18.74 | 16.60 | 18.32 | 16.55 | 14.73 | 13.87 | |
15.14 |
| |||||||||||||||||||
| Dividends Per Share(2) |
0.09 | — | 0.24 | 0.31 | 0.29 | 0.27 | |
0.25 |
| |||||||||||||||||||
| Performance Ratios: |
||||||||||||||||||||||||||||
| Return on Average Assets(3) |
1.68 | % | 0.96 | % | 0.98 | % | 0.57 | % | 0.98 | % | 0.85 | % | |
1.06 |
% | |||||||||||||
| Return on Average Stockholders’ Equity(4) |
16.11 | % | 8.46 | % | 9.49 | % | 5.22 | % | 8.29 | % | 6.31 | % | |
12.69 |
% | |||||||||||||
| Net Interest Margin |
3.97 | % | 3.85 | % | 3.64 | % | 3.81 | % | 4.06 | % | 4.24 | % | |
4.53 |
% | |||||||||||||
| Efficiency Ratio(5) |
50.15 | % | 68.90 | % | 65.18 | % | 66.85 | % | 63.12 | % | 62.84 | % | |
63.80 |
% | |||||||||||||
| Noninterest Income / Average Assets(3) |
1.33 | % | 0.86 | % | 0.69 | % | 0.68 | % | 0.44 | % | 0.47 | % | |
0.76 |
% | |||||||||||||
| Noninterest Expense / Average Assets(3) |
2.53 | % | 2.84 | % | 2.59 | % | 2.82 | % | 2.66 | % | 2.75 | % | |
3.12 |
% | |||||||||||||
| Yield on Loans |
4.87 | % | 5.43 | % | 4.93 | % | 5.68 | % | 5.43 | % | 5.25 | % | |
5.53 |
% | |||||||||||||
| Cost of Deposits |
0.39 | % | 1.04 | % | 0.74 | % | 1.34 | % | 1.03 | % | 0.60 | % | |
0.52 |
% | |||||||||||||
| Loans to Deposits |
85.97 | % | 88.40 | % | 90.39 | % | 88.12 | % | 90.04 | % | 90.17 | % | |
95.49 |
% | |||||||||||||
| Credit Quality Ratios: |
||||||||||||||||||||||||||||
| Nonperforming Assets to Total Assets(6) |
0.97 | % | 1.63 | % | 1.03 | % | 1.90 | % | 0.50 | % | 0.17 | % | |
0.34 |
% | |||||||||||||
17
Table of Contents
| As of and for the Three Months Ended March 31, |
As of and for the Year Ended December 31, | |||||||||||||||||||||||||||
| 2021 | 2020 | 2020 | 2019 | 2018 | 2017 | 2016 | ||||||||||||||||||||||
| (Dollars in thousands, except per share data) |
||||||||||||||||||||||||||||
| Nonperforming Assets to Total Loans and OREO(6) |
1.29 | % | 2.14 | % | 1.32 | % | 2.47 | % | 0.63 | % | 0.22 | % | |
0.42 |
% | |||||||||||||
| Nonperforming Loans to Total Loans |
0.36 | % | 1.55 | % | 0.34 | % | 1.65 | % | 0.55 | % | 0.13 | % | |
0.40 |
% | |||||||||||||
| Allowance for Loan Losses to Total Loans |
1.16 | % | 1.15 | % | 1.15 | % | 1.11 | % | 1.11 | % | 1.02 | % | |
0.99 |
% | |||||||||||||
| Allowance for Loan Losses to Nonperforming Loans |
326.81 | % | 74.03 | % | 338.00 | % | 67.13 | % | 202.20 | % | 761.78 | % | |
244.70 |
% | |||||||||||||
| Net Loan Charge-offs to Average Loans(7) |
0.00 | % | -0.02 | % | 0.10 | % | 0.57 | % | 0.02 | % | 0.10 | % | |
-0.04 |
% | |||||||||||||
| Capital Ratios: |
||||||||||||||||||||||||||||
| Common Equity Tier 1 Capital Ratio(8) |
10.19 | % | 10.67 | % | 10.63 | % | 11.24 | % | 11.50 | % | 13.59 | % | |
13.44 |
% | |||||||||||||
| Tier 1 Leverage Ratio |
9.21 | % | 10.06 | % | 9.24 | % | 9.78 | % | 10.58 | % | 12.19 | % | |
12.80 |
% | |||||||||||||
| Tier 1 Risk-based Ratio |
10.19 | % | 10.67 | % | 10.63 | % | 11.24 | % | 11.50 | % | 13.59 | % | |
13.44 |
% | |||||||||||||
| Total Risk-based Capital Ratio |
11.60 | % | 12.09 | % | 12.09 | % | 12.68 | % | 13.07 | % | 15.25 | % | |
15.09 |
% | |||||||||||||
| Composition of Loan Portfolio: |
||||||||||||||||||||||||||||
| Owner-occupied Commercial Real Estate |
$ | 344,731 | $ | 292,073 | $ | 324,047 | $ | 255,305 | $ | 221,099 | $ | 144,784 | $ |
125,853 |
| |||||||||||||
| Nonowner- occupied Commercial Real Estate |
214,818 | 153,919 | 173,413 | 161,830 | 130,194 | 131,782 | |
111,020 |
| |||||||||||||||||||
| Commercial and Industrial |
169,311 | 155,014 | 187,839 | 139,765 | 132,061 | 74,896 | |
41,252 |
| |||||||||||||||||||
| Construction and Development |
121,199 | 114,774 | 102,559 | 93,011 | 77,197 | 82,217 | |
94,745 |
| |||||||||||||||||||
| 1-4 Family |
109,299 | 111,644 | 107,690 | 119,010 | 96,939 | 94,164 | |
90,951 |
| |||||||||||||||||||
| Multi-Family |
42,584 | 28,362 | 44,522 | 33,302 | 28,087 | 24,264 | |
22,345 |
| |||||||||||||||||||
| Consumer and other loans |
9,200 | 11,066 | 9,644 | 11,955 | 7,479 | 7,131 | |
6,293 |
| |||||||||||||||||||
| PPP loans |
60,846 | — | 66,556 | — | — | — | — | |||||||||||||||||||||
| Agriculture |
15,473 | 22,656 | 17,463 | 24,811 | 12,243 | 8,347 | |
9,817 |
| |||||||||||||||||||
18
Table of Contents
| As of and for the Three Months Ended March 31, |
As of and for the Year Ended December 31, | |||||||||||||||||||||||||||
| 2021 | 2020 | 2020 | 2019 | 2018 | 2017 | 2016 | ||||||||||||||||||||||
| (Dollars in thousands, except per share data) |
||||||||||||||||||||||||||||
| Composition of Deposits: |
||||||||||||||||||||||||||||
| NOW Accounts |
$ | 95,187 | $ | 81,009 | $ | 102,428 | $ | 89,126 | $ | 41,881 | $ | 37,749 | $ |
28,227 |
| |||||||||||||
| Noninterest- bearing Demand |
365,114 | 197,869 | 290,867 | 188,270 | 117,413 | 111,064 | |
98,704 |
| |||||||||||||||||||
| Savings |
46,495 | 32,654 | 42,731 | 31,362 | 8,581 | 11,023 | |
7,452 |
| |||||||||||||||||||
| Money Market Accounts |
424,804 | 335,385 | 373,329 | 283,625 | 269,986 | 221,773 | |
163,970 |
| |||||||||||||||||||
| Certificates of Deposit—$250,000 and Less(9) |
296,042 | 313,594 | 293,707 | 311,888 | 298,652 | 209,002 | |
191,718 |
| |||||||||||||||||||
| Certificates of Deposit—More than $250,000 |
32,402 | 43,741 | 36,599 | 46,242 | 39,272 | 30,989 | |
29,987 |
| |||||||||||||||||||
| Non-GAAP Financial Measures:(10) |
||||||||||||||||||||||||||||
| Core Net Income |
3,750 | 2,411 | 11,722 | 7,272 | 7,757 | 5,572 | 5,615 | |||||||||||||||||||||
| Core Return on Average Assets |
1.11 | % | 0.87 | % | 0.94 | % | 0.74 | % | 0.99 | % | 0.85 | % | 1.02 | % | ||||||||||||||
| Pretax Pre-provision Core |
5,673 | 3,946 | 17,420 | 15,091 | 12,264 | 10,662 | 9,715 | |||||||||||||||||||||
| Pretax Pre-provision Core Return on Average Assets |
1.68 | % | 1.42 | % | 1.40 | % | 1.53 | % | 1.56 | % | 1.62 | % | 1.76 | % | ||||||||||||||
| Tangible Common Equity |
126,040 | 108,575 | 122,030 | 107,748 | 89,100 | 83,309 | 75,402 | |||||||||||||||||||||
| Diluted Core Earnings Per Share |
0.48 | 0.31 | 1.51 | 1.05 | 1.19 | 0.89 | 1.70 | |||||||||||||||||||||
| Tangible Book Value Per Share |
16.34 | 14.15 | 15.89 | 14.08 | 13.74 | 12.86 | 13.92 | |||||||||||||||||||||
| Tangible Common Equity to Tangible Assets |
8.75 | % | 9.43 | % | 9.29 | % | 10.01 | % | 10.11 | % | 11.43 | % | 12.12 | % | ||||||||||||||
| Return on Average Tangible Common Equity |
18.51 | % | 9.76 | % | 10.50 | % | 5.78 | % | 8.90 | % | 6.82 | % | 14.83 | % | ||||||||||||||
| Core Return on Average Tangible Common Equity |
12.22 | % | 8.80 | % | 10.17 | % | 7.50 | % | 8.95 | % | 6.78 | % | 14.20 | % | ||||||||||||||
| Core Efficiency Ratio (excludes merger expenses) |
60.06 | % | 65.53 | % | 64.27 | % | 61.84 | % | 63.01 | % | 62.95 | % | 64.04 | % | ||||||||||||||
| (1) | Includes non-accrual loans and loans 90 days and more past due. 2020 includes $66.6 million of PPP loans. |
| (2) | The Company converted to a quarterly dividend in 2020. A dividend of $0.08 per share was paid following the first three quarters of 2020, with a dividend of $0.09 per share paid in January 2021 and May 2021. A dividend was also declared on July 21, 2021 and is payable on August 11, 2021 to holders of record as of July 29, 2021. Purchasers of common stock in this offering will not receive the dividend. |
| (3) | Calculated based upon the average daily balance of total assets. |
| (4) | Calculated based upon the average daily balance of total stockholders’ equity. |
19
Table of Contents
| (5) | Efficiency ratio is defined as operating revenue, divided by non-interest expenses. |
| (6) | Non-performing assets include all non-performing loans and other real estate owned, or OREO, properties acquired through or in lieu of foreclosure. |
| (7) | Calculated based upon the average daily balance of the outstanding loan principal balance. |
| (8) | 2016 amounts reflect conversion of preferred stock to nonvoting common stock. |
| (9) | Includes Qwickrate and Brokered Deposits. |
| (10) | Please see “Non-GAAP Financial Measures” for a definition of these measures and reconciliation of these non-GAAP financial measures to their most directly comparable financial measure calculated in accordance with GAAP. |
20
Table of Contents
This prospectus contains “non-GAAP financial measures” within the meaning of Item 10(e) of Regulation S-K. Non-GAAP financial measures are financial measures that are not presented in accordance with generally accepted accounting principles in the U.S., or GAAP. We use these and other non-GAAP financial measures both to explain our results to stockholders and the investment community and in the internal evaluation and management of our businesses. The following non-GAAP financial measures appear in this prospectus:
| • | Core Net Income. We define core net income as net income less acquisition related expenses, the related tax effect of acquisition related expenses, the gain on a historically large USDA loan sale, the Alabama Loan Guarantee Program refund, bank owned life insurance, or BOLI benefit, OREO losses/(gains), and gains/(losses) on sale of securities. |
| • | Core Return on Average Assets. We define core return on average assets as core net income divided by average assets, with average assets based upon the average daily balance of total assets in each year. |
| • | Pretax Pre-provision Core Net Income. We define pretax pre-provision core net income as core net income less loan loss provision and income taxes. |
| • | Pretax Pre-provision Core Return on Average Assets. We define pretax pre-provision core return on average assets as pretax pre-provision core net income divided by average assets, with average assets based upon the average daily balance of total assets in each year. |
| • | Tangible Common Equity. We define tangible common equity as our total stockholders’ equity less intangible assets (goodwill and core deposit intangibles). |
| • | Diluted Core Earnings Per Share. We define diluted core earnings per share as core net income divided by diluted weighted average shares outstanding. |
| • | Tangible Book Value Per Share. We define tangible book value per share as our tangible common equity divided by the number of shares of common stock outstanding as of the applicable date. |
| • | Tangible Common Equity to Tangible Assets. We define tangible common equity to tangible assets as tangible common equity divided by total assets (less intangible assets of goodwill and core deposit intangibles). |
| • | Return on Average Tangible Common Equity. We define return on average tangible common equity as net income divided by total average shareholders’ equity less average intangible assets (goodwill and core deposit intangibles). |
| • | Core Return on Average Tangible Common Equity. We define core return on average tangible common equity as core net income divided by total average shareholders’ equity less average intangible assets (goodwill and core deposit intangibles). |
| • | Core Efficiency Ratio. We define core efficiency ratio as operating revenue (net interest income, plus total non-interest income, less the gain on a historically large USDA loan sale, refund received upon the termination of the Alabama Loan Guarantee Program, a BOLI death benefit payment received, and gains/(losses) on sale of securities), divided by non-interest expenses (less acquisition related expenses, and OREO losses/(gains)). |
Our management believes that these non-GAAP financial measures and the information they provide are useful to investors since these measures permit investors to view our performance using the same tools that our management uses to evaluate our performance, especially in light of the additional costs we incurred in 2019 in connection with certain acquisition-related expenses. While we believe that these non-GAAP financial measures are useful in evaluating our performance, this information should be considered as supplemental in nature and not as a substitute for or superior to the related financial information prepared in accordance with GAAP. Additionally, these non-GAAP financial measures may differ from similar measures presented by other companies.
21
Table of Contents
The following table provides a reconciliation of the above non-GAAP financial measures to their most directly comparable financial measure presented in accordance with GAAP.
Non-GAAP Financial Measures Reconciliations
| As of and for the Three Months Ended March 31, |
As of and for the Year Ended December 31, | |||||||||||||||||||||||||||
| 2021 | 2020 | 2020 | 2019 | 2018 | 2017 | 2016 | ||||||||||||||||||||||
| (Dollars in thousands, except per share information) |
||||||||||||||||||||||||||||
| Net income |
$ | 5,681 | $ | 2,675 | $ | 12,107 | $ | 5,602 | $ | 7,713 | $ | 5,600 | $ | 5,862 | ||||||||||||||
| Add: merger expenses |
— | — | — | 3,373 | — | — | — | |||||||||||||||||||||
| Add: net OREO write-downs (gains) |
— | 386 | 844 | (64 | ) | 37 | (31 | ) | (64 | ) | ||||||||||||||||||
| Less: gain on sale of USDA loan |
2,807 | — | — | — | — | — | — | |||||||||||||||||||||
| Less: non-recurring noninterest income |
— | — | 615 | 1,992 | — | — | — | |||||||||||||||||||||
| Less: gain (loss) on sale of securities |
(232 | ) | 738 | 742 | 14 | (22 | ) | 7 | 299 | |||||||||||||||||||
| Less: tax effect |
(644 | ) | (88 | ) | (128 | ) | (367 | ) | 15 | (10 | ) | (116 | ) | |||||||||||||||
|
|
|
|
|
|
|
|
|
|
|
|
|
|
|
|||||||||||||||
| Core Net Income |
$ | 3,750 | $ | 2,411 | $ | 11,722 | $ | 7,272 | $ | 7,757 | $ | 5,572 | $ | 5,615 | ||||||||||||||
|
|
|
|
|
|
|
|
|
|
|
|
|
|
|
|||||||||||||||
| Average Assets |
$ | 1,368,119 | $ | 1,117,560 | $ | 1,241,440 | $ | 985,273 | $ | 787,202 | $ | 656,481 | $ | 552,394 | ||||||||||||||
|
|
|
|
|
|
|
|
|
|
|
|
|
|
|
|||||||||||||||
| Core return on average assets |
1.11 | % | 0.87 | % | 0.94 | % | 0.74 | % | 0.99 | % | 0.85 | % | 1.02 | % | ||||||||||||||
|
|
|
|
|
|
|
|
|
|
|
|
|
|
|
|||||||||||||||
| Net income |
$ | 5,681 | $ | 2,675 | $ | 12,107 | $ | 5,602 | $ | 7,713 | $ | 5,600 | $ | 5,862 | ||||||||||||||
| Add: merger expenses |
— | — | — | 3,373 | — | — | — | |||||||||||||||||||||
| Add: net OREO write-downs (gains) |
— | 386 | 844 | (64 | ) | 37 | (31 | ) | (64 | ) | ||||||||||||||||||
| Add: provision |
750 | 800 | 3,300 | 5,700 | 2,196 | 1,315 | 1,016 | |||||||||||||||||||||
| Less: gain on sale of USDA loan |
2,807 | — | — | — | — | — | — | |||||||||||||||||||||
| Less: Non-recurring noninterest income |
|
— |
|
— | 615 | 1,992 | — | — | — | |||||||||||||||||||
| Less: gain (loss) on sale of securities |
(232 | ) | 738 | 742 | 14 | (22 | ) | 7 | 299 | |||||||||||||||||||
| Add: income taxes |
1,817 | 823 | 2,526 | 2,486 | 2,296 | 3,785 | 3,200 | |||||||||||||||||||||
|
|
|
|
|
|
|
|
|
|
|
|
|
|
|
|||||||||||||||
| Pretax pre-provision core net income |
$ | 5,673 | $ | 3,946 | $ | 17,420 | $ | 15,091 | $ | 12,264 | $ | 10,662 | $ | 9,715 | ||||||||||||||
|
|
|
|
|
|
|
|
|
|
|
|
|
|
|
|||||||||||||||
| Average Assets |
$ | 1,368,119 | $ | 1,117,560 | $ | 1,241,440 | $ | 985,273 | $ | 787,202 | $ | 656,481 | $ | 552,394 | ||||||||||||||
|
|
|
|
|
|
|
|
|
|
|
|
|
|
|
|||||||||||||||
| Pretax pre-provision core return on average assets |
1.68 | % | 1.42 | % | 1.40 | % | 1.53 | % | 1.56 | % | 1.62 | % | 1.76 | % | ||||||||||||||
|
|
|
|
|
|
|
|
|
|
|
|
|
|
|
|||||||||||||||
| Total stockholders’ equity |
$ | 144,600 | $ | 127,398 | $ | 140,656 | $ |
126,637 |
|
$ | 95,475 | $ | 89,812 | $ | 82,033 | |||||||||||||
| Less: intangible assets |
18,560 | 18,823 | 18,626 | 18,889 | 6,375 | 6,503 | 6,631 | |||||||||||||||||||||
| Less: monitory interest not included in tangible assets |
— | — | — | — | — | — | — | |||||||||||||||||||||
|
|
|
|
|
|
|
|
|
|
|
|
|
|
|
|||||||||||||||
22
Table of Contents
| As of and for the Three Months Ended March 31, |
As of and for the Year Ended December 31, | |||||||||||||||||||||||||||
| 2021 | 2020 | 2020 | 2019 | 2018 | 2017 | 2016 | ||||||||||||||||||||||
| (Dollars in thousands, except per share information) |
||||||||||||||||||||||||||||
| Tangible common equity |
$ | 126,040 | $ | 108,575 | $ | 122,030 | $ | 107,748 | $ | 89,100 | $ | 83,309 | $ | 75,402 | ||||||||||||||
|
|
|
|
|
|
|
|
|
|
|
|
|
|
|
|||||||||||||||
| Core Net Income |
3,750 | 2,411 | 11,722 | 7,272 | 7,757 | 5,572 | 5,615 | |||||||||||||||||||||
| Diluted weighted average shares outstanding |
7,794,859 | 7,791,229 | 7,765,863 | 6,901,621 | 6,515,173 | 6,246,065 | 3,308,890 | |||||||||||||||||||||
|
|
|
|
|
|
|
|
|
|
|
|
|
|
|
|||||||||||||||
| Diluted core earnings per share |
$ | 0.48 | $ | 0.31 | $ | 1.51 | $ | 1.05 | $ | 1.19 | $ | 0.89 | $ | 1.70 | ||||||||||||||
|
|
|
|
|
|
|
|
|
|
|
|
|
|
|
|||||||||||||||
| Common shares outstanding at year end |
7,715,529 | 7,675,024 | 7,678,195 | 7,650,772 | 6,483,183 | 6,475,950 | 5,418,724 | |||||||||||||||||||||
| Tangible book value per share |
$ | 16.34 | $ | 14.15 | $ | 15.89 | $ | 14.08 | $ | 13.74 | $ | 12.86 | $ | 13.92 | ||||||||||||||
|
|
|
|
|
|
|
|
|
|
|
|
|
|
|
|||||||||||||||
| Total assets at end of period |
$ | 1,459,236 | $ | 1,170,381 | $ | 1,332,506 | $ | 1,095,491 | $ | 887,607 | $ | 735,531 | $ | 628,578 | ||||||||||||||
| Less: intangible assets |
18,560 | 18,823 | 18,626 | 18,889 | 6,375 | 6,503 | 6,631 | |||||||||||||||||||||
|
|
|
|
|
|
|
|
|
|
|
|
|
|
|
|||||||||||||||
| Adjusted assets at end of period |
$ | 1,440,676 | $ | 1,151,558 | $ | 1,313,880 | $ | 1,076,602 | $ | 881,232 | $ | 729,028 | $ | 621,949 | ||||||||||||||
|
|
|
|
|
|
|
|
|
|
|
|
|
|
|
|||||||||||||||
| Tangible common equity to tangible Assets |
8.75 | % | 9.43 | % | 9.29 | % | 10.01 | % | 10.11 | % | 11.43 | % | 12.12 | % | ||||||||||||||
|
|
|
|
|
|
|
|
|
|
|
|
|
|
|
|||||||||||||||
| Total average stockholders’ equity |
$ | 143,058 | $ | 129,062 | $ | 134,029 | $ | 107,330 | $ | 93,086 | $ | 88,694 | $ | 46,178 | ||||||||||||||
| Less: average intangible assets |
18,601 | 18,864 | 18,764 | 10,386 | 6,442 | 6,569 | 6,642 | |||||||||||||||||||||
| Less: average monitory interest not included in tangible assets |
— | — | — | — | — | — | — | |||||||||||||||||||||
|
|
|
|
|
|
|
|
|
|
|
|
|
|
|
|||||||||||||||
| Average tangible common equity |
$ | 124,457 | $ | 110,198 | $ | 115,265 | 96,944 | 86,644 | 82,125 | 39,536 | ||||||||||||||||||
|
|
|
|
|
|
|
|
|
|
|
|
|
|
|
|||||||||||||||
| Net income to common shareholders |
5,681 | 2,675 | 12,107 | 5,602 | 7,713 | 5,600 | 5,862 | |||||||||||||||||||||
| Return on average tangible common Equity |
18.51 | % | 9.76 | % | 10.50 | % | 5.78 | % | 8.90 | % | 6.82 | % | 14.83 | % | ||||||||||||||
|
|
|
|
|
|
|
|
|
|
|
|
|
|
|
|||||||||||||||
| Average tangible common |
$ | 124,457 | $ | 110,198 | $ | 115,265 | $ | 96,944 | $ | 86,644 | $ | 82,125 | $ | 39,536 | ||||||||||||||
| Core Net Income |
3,750 | 2,411 | 11,722 | 7,272 | 7,757 | 5,572 | 5,615 | |||||||||||||||||||||
| Core return on average tangible common equity |
12.22 | % | 8.80 | % | 10.17 | % | 7.50 | % | 8.95 | % | 6.78 | % | 14.20 | % | ||||||||||||||
|
|
|
|
|
|
|
|
|
|
|
|
|
|
|
|||||||||||||||
| Net interest income |
$ | 12,284 | $ | 9,782 | $ | 41,577 | $ | 34,849 | $ | 29,665 | $ | 25,709 | $ | 23,136 | ||||||||||||||
| Add: noninterest income |
4,496 | 2,402 | 8,541 | 6,710 | 3,464 | 3,072 | 4,176 | |||||||||||||||||||||
23
Table of Contents
| As of and for the Three Months Ended March 31, |
As of and for the Year Ended December 31, | |||||||||||||||||||||||||||
| 2021 | 2020 | 2020 | 2019 | 2018 | 2017 | 2016 | ||||||||||||||||||||||
| (Dollars in thousands, except per share information) |
||||||||||||||||||||||||||||
| Less: gain on sale of USDA loan |
2,807 | — | — | — | — | — | — | |||||||||||||||||||||
| Less: Non-recurring noninterest income |
|
— |
|
— | 615 | 1,992 | — | — | — | |||||||||||||||||||
| Less: gain (loss) on sale of securities |
(232 | ) | 738 | 742 | 14 | (22 | ) | 7 | 299 | |||||||||||||||||||
|
|
|
|
|
|
|
|
|
|
|
|
|
|
|
|||||||||||||||
| Operating revenue |
$ | 14,205 | $ | 11,446 | $ | 48,761 | $ | 39,553 | $ | 33,151 | $ | 28,774 | $ | 27,013 | ||||||||||||||
| Expenses: |
||||||||||||||||||||||||||||
| Total noninterest expenses |
8,532 | 7,886 | 32,185 | 27,771 | 20,924 | 18,081 | 17,234 | |||||||||||||||||||||
| Less: merger expenses |
— | — | — | 3,373 | — | — | — | |||||||||||||||||||||
| Less: net OREO write-down (gains) |
— | 386 | 844 | (64 | ) | 37 | (31 | ) | (64 | ) | ||||||||||||||||||
|
|
|
|
|
|
|
|
|
|
|
|
|
|
|
|||||||||||||||
| Adjusted noninterest expenses |
$ | 8,532 | $ | 7,500 | $ | 31,341 | $ | 24,462 | $ | 20,887 | $ | 18,112 | $ | 17,298 | ||||||||||||||
| Core efficiency ratio |
60.06 | % | 65.53 | % | 64.27 | % | 61.84 | % | 63.01 | % | 62.95 | % | 64.04 | % | ||||||||||||||
|
|
|
|
|
|
|
|
|
|
|
|
|
|
|
|||||||||||||||
24
Table of Contents
Investing in our common stock involves a high degree of risk. Before you decide to invest in our common stock, you should carefully consider the risks described below, together with all other information included in this prospectus, including our consolidated financial statements and related notes appearing elsewhere in this prospectus. We believe the risks described below are the risks that are material to us as of the date of this prospectus. If any of the following risks actually materialize, our business, financial condition or results of operations could be materially and adversely affected. In that case, you could experience a partial or complete loss of your investment. Further, to the extent that any of the information in this prospectus constitutes forward-looking statements, the risk factors below also are cautionary statements identifying important factors that could cause actual results to differ materially from those expressed in any forward-looking statements made by us or on our behalf. See “Cautionary Note Regarding Forward-Looking Statements.”
Risks Related to Our Business
The long-term effects of the current COVID-19 pandemic are unknown, continue to evolve, and could ultimately result in negative effects on our business, financial condition, liquidity and results of operations.
The rapid spread and intensity of the COVID-19 pandemic over the past year has adversely impacted economic activity and conditions locally, nationally and worldwide. In particular, efforts to control the spread of COVID-19 led to shutdowns and stay-at-home orders, stock price declines, employee layoffs and rapid increases in unemployment and decreases in gross domestic product (“GDP”), and governmental programs to support the economy and provide market liquidity. As a result of the COVID-19 pandemic, we made changes to our daily operations. These measures included social distancing, limiting walk-in business and encouraging employees to work from home where practical. We expanded our SBA lending services through the PPP. We also were eligible to borrow from the Federal Reserve’s discount window, but did not utilize any such borrowings.
Although several vaccines for COVID-19 have been developed and are being administered, it is not clear how effective they will be long-term or how long the pandemic or its effects will continue. We believe we have responded effectively to the COVID-19 pandemic, but it could continue to affect us in a number of other ways, including but not limited to:
| • | impacting the general economic stability and health of our geographic markets; |
| • | changing demand for financial products in general, and initially increasing our loans as draws are made against existing loan commitments and lines of credit, and as we made PPP loans; |
| • | increasing our deposits, at least in the short term, as loan proceeds are deposited in the Bank pending their expenditure, and as customers increase deposits to avoid more volatile market investments; |
| • | impacting financial resources that are generally available to individuals and small and medium size business; |
| • | accommodative changes in government fiscal and monetary policies to stabilize the economy and restore confidence and growth; |
| • | stimulative monetary policy, including Federal Reserve bond purchases and reductions in the Federal Reserve’s target federal funds rate to 0.0% - 0.25% beginning March 2020, which have reduced our net interest income and margins, and the potential for future interest rate increases due to inflation resulting from fiscal and monetary stimulus provided by the federal government as a result of the COVID-19 pandemic; |
| • | financial stress on our borrowers leading to loan defaults at a rate that is higher than we anticipate; |
| • | increases in our allowance for loan losses to reflect greater risks of losses; |
| • | reductions in collateral values from their values when the loans were made, which increases the risks of potential losses, if we are forced to foreclose or otherwise realize the value of such collateral; |
25
Table of Contents
| • | potential stresses on our liquidity as we continue to serve increasing loan demand and if deposits decrease because of reduced customer revenues and income; |
| • | our growth plans and strategy, including acquisitions; |
| • | increasing cyber and payment fraud risk, as cybercriminals attempt to profit from the disruption, given increased online and remote banking activity; |
| • | increases in our internal controls and procedures needed to manage increased risks associated with the COVID-19 pandemic and government loan programs; |
| • | as a result of monetary and fiscal stimulus in response to the COVID-19 pandemic in 2020 and 2021, including approximately $5.6 trillion of federal fiscal stimulus appropriated through April 2021, as well as supply shortages and disruptions to supply chains during this pandemic, inflation and interest rates may increase, which may have unanticipated adverse effects on our customers, and our financial condition and results of operations; and |
| • | increases in the likelihood and magnitude of various of our other risks. |
In light of disruptions in economic conditions caused by the outbreak of COVID-19 and the stress in U.S. financial markets, the Federal Reserve, Congress and the Department of the Treasury took a host of fiscal and monetary measures to minimize the economic effect of COVID-19. On March 3, 2020, the Federal Reserve reduced the Federal Funds rate target by 50 basis points to 1.00-1.25%. The Federal Reserve further reduced the Federal Funds Rate target by an additional 100 basis points to 0-0.25% on March 16, 2020. The Federal Reserve established various liquidity facilities pursuant to section 13(3) of the Federal Reserve Act to help stabilize the financial system. The Federal Reserve’s current policy is to seek maximum employment and inflation of 2% over the longer run, with inflation moderately running over 2% for some time. It continues a target federal funds range of 0-0.25%, and monthly purchases of at least $80 billion of Treasury securities and $40 billion of agency mortgage-backed securities until substantial further progress has been made towards its goals. Congress appropriated approximately $3.7 trillion of fiscal stimulus in response to the COVID-19 pandemic pursuant to the CARES Act in March 2020 and the Omnibus Budget Act in December 2020. Approximately $1.9 trillion of additional fiscal stimulus was appropriated in March 2021 pursuant to the 2021 American Rescue Plan. The Federal Reserve and the U.S. government continues to take action to provide liquidity to the markets and stimulate the economy, the terms and effects of which cannot be predicted.
A continuation or resurgence of the COVID-19 pandemic, including through new variants or the lack of vaccine effectiveness, could also result in additional impacts to our business, financial condition, liquidity and results of operations. The ultimate effects of the COVID-19 pandemic is unknown at this time. We continuously seek to monitor and anticipate developments, but cannot predict all of the various adverse effects COVID-19 will have on our business, financial condition, liquidity or results of operations.
Southern States and Southern States Bank may face risks in participating as a lender in the PPP program.
The CARES Act established a loan program administered through the SBA, referred to as the PPP, which has been extended and modified by subsequent legislation. Under the PPP, small businesses and other entities and individuals can apply for loans from existing SBA lenders and other approved lenders that enroll in the program, subject to numerous, evolving limitations and eligibility criteria. The Bank participated as a lender in the PPP. The PPP opened on April 3, 2020. Continuing changes in the laws, rules and guidance regarding the operation of the PPP and ambiguities in the law expose us to risks relating to noncompliance with the PPP. Since the opening of the PPP, various other larger banks have been subject to litigation regarding the process and procedures that such banks used in processing applications for the PPP. Southern States and the Bank could be exposed to the risk of similar litigation, from both customers and non-customers that approached the Bank regarding PPP loans, regarding its process and procedures used in processing applications for the PPP.
26
Table of Contents
Southern States business is concentrated in, and largely dependent upon, the continued growth of, and economic conditions in, the markets where Southern States operates.
Southern States’ operations are in Alabama and the Atlanta and Columbus, Georgia MSAs. Southern States’ success depends to a significant extent upon the business activity, population, income levels, deposits, and real estate activity in these areas. Although customers’ business and financial interests may extend outside of these areas, adverse economic conditions in those areas could reduce Southern States’ growth rate, affect the ability of Southern States’ customers to repay their loans, affect the value of collateral underlying loans and affect Southern States’ ability to attract deposits. Adverse changes in the economic conditions in one or more of our local markets, including the continuing effects from the COVID-19 pandemic and the timing, strength and breadth of the recovery from the pandemic, could negatively affect our results of operations and our profitability, affect consumer confidence levels and may cause adverse changes in payment patterns, causing increases in delinquencies and default rates, which may impact Southern States’ charge-offs and provisions for loan and credit losses, and our financial condition and results of operations. Economic deterioration that affects household and/or corporate incomes could also result in reduced demand for credit or fee-based products and services. Any of these factors could adversely affect Southern States’ financial condition, results of operations and cash flows. Because of Southern States’ geographic concentration, Southern States may be less able than other regional or national financial institutions to diversify its credit risks across multiple markets.
Certain of our markets are also affected by the growth of automobile manufacturing and related suppliers located in our markets and nearby, and the automobile industry and other industries have been adversely affected by supply chain disruptions and shortages. Auto sales are cyclical and are affected adversely by higher interest rates.
Southern States’ profitability is vulnerable to interest rate fluctuations.
Southern States’ profitability depends substantially upon its net interest income. Net interest income is the difference between the interest earned on assets (such as loans and securities held in Southern States’ investment portfolio) and the interest paid for liabilities (such as interest paid on deposits).
Income associated with interest-earning assets and costs associated with interest-bearing liabilities may not be affected uniformly by fluctuations in interest rates. The magnitude and duration of changes in interest rates are events over which Southern States has no control, and such changes may have an adverse effect on Southern States’ net interest income. Prepayment and early withdrawal levels, which are also impacted by changes in interest rates, can significantly affect Southern States’ assets and liabilities. For example, an increase in interest rates could, among other things, reduce the demand for loans and decrease loan repayment rates. Such an increase could also adversely affect the ability of Southern States’ floating-rate borrowers to meet their higher payment obligations, which could in turn lead to an increase in non-performing assets and net charge-offs. Conversely, a decrease in the general level of interest rates could affect Southern States by, among other things, leading to greater competition for deposits and incentivizing borrowers to prepay or refinance, at lower interest rates, their loans more quickly or frequently than they otherwise would, and at current interest rates and with current yield curves, it would reduce our net interest income and margin. Southern States attempts to minimize the adverse effects of changes in interest rates by structuring its asset-liability composition in order to obtain the maximum spread between interest income and interest expense and its primary tool for managing interest rate risk is a simulation model that evaluates the impact of interest rate changes on net interest income and the economic value of equity. However, there can be no assurance that Southern States will be successful in minimizing the adverse effects of changes in interest rates.
We generally price our variable rate loans based on the prime interest rate. As of March 31, 2021, we had approximately $463.3 million of loans. We also had $22.6 million of interest rate swaps and $8.0 million of Company secured borrowings, subject to a LIBOR-based variable rate, with fall back rates based on the SOFR rate.
27
Table of Contents
Generally, the interest rates on Southern States’ interest-earning assets and interest-bearing liabilities do not change at the same rate, to the same extent or on the same basis. Even assets and liabilities with similar maturities or re-pricing periods may react differently to changes in market interest rates. Interest rates on certain types of assets and liabilities may fluctuate in advance of changes in general market interest rates, while interest rates on other types of assets and liabilities may lag behind changes in general market rates. Certain assets, such as fixed and adjustable rate mortgage loans, have features that limit changes in interest rates on a short-term basis and over the life of the asset. Changes in interest rates could materially and adversely affect Southern States’ financial condition and results of operations.
Generally, interest rate spreads (the difference between interest rates earned on assets and interest rates paid on liabilities) have narrowed in recent years as a result of changing market conditions, policies of various government and regulatory authorities, and competitive pricing pressures, and Southern States cannot predict whether these rate spreads will narrow even further. This narrowing of interest rate spreads, and related decreases, could adversely affect Southern States’ results of operations, cash flows and financial condition.
An elimination of LIBOR or other benchmark rates and the lack of availability of alternative indexes could adversely impact our business and results of operations.
As of March 31, 2021, we had approximately 39 loans with balances of approximately $113.2 million that use LIBOR interest rates. As of March 31, 2021, we also had $4.5 million in Subordinated Notes due in July 2026 (which may be repaid commencing on or after July 1, 2021) that use LIBOR interest rate. LIBOR and certain other benchmark rates are the subject of recent national, international, and other regulatory guidance and proposals for reform. The U.S. federal banking agencies have told banking organizations to cease using U.S. dollar LIBOR as a reference rate in new contracts as soon as practicable, and will be evaluating banks’ transition efforts as part of their examinations. We cannot predict what rate or rates may become accepted alternatives to LIBOR, or what the effect of any such changes in views or alternatives may be on the markets for LIBOR-linked financial instruments, including our loans, borrowings and interest rate swaps. We are in the process of assessing the impact that a cessation or market replacement of LIBOR would have on certain of our products and contracts.
Southern States could suffer losses from a decline in the credit quality of the assets that Southern States holds.
Southern States could sustain losses if borrowers, guarantors, and related parties fail to perform in accordance with the terms of their loans. Southern States has adopted underwriting and credit monitoring procedures and policies that Southern States believes are appropriate to manage these risks, including the establishment and review of the allowance for credit losses, periodic assessment of the likelihood of nonperformance, tracking loan performance, and diversifying its credit portfolio. These policies and procedures, however, may not prevent unexpected losses that could materially adversely affect Southern States’ financial condition and results of operations. In particular, Southern States faces credit quality risks presented by past, current, and potential economic and real estate market conditions.
A significant portion of Southern States’ loan portfolio is secured by real estate, and events that negatively impact the real estate market could negatively impact Southern States’ business.
As of March 31, 2021, approximately 78.0% of Southern States’ loan portfolio is secured by either residential or commercial real estate. As of March 31, 2021, Southern States had approximately $151.9 million in residential real estate loans and $575.0 million in commercial real estate loans outstanding, representing approximately 14.0% and 52.9%, respectively, of net loans outstanding on that date. Loans in hospitality properties, including hotels, motels, restaurants and shopping centers, which were $147.5 million, representing 13.6% of our net loans outstanding at March 31, 2021, may be especially sensitive to economic conditions and the risks of the travel and retail industries, including the effects of COVID-19.
28
Table of Contents
There are significant risks associated with real estate-based lending. Real estate collateral may deteriorate in value during the time that credit is extended, in which case Southern States might not be able to sell such collateral for an amount necessary to satisfy a defaulting borrower’s obligation to Southern States. In that event, there could be a material adverse effect on Southern States’ financial condition and results of operations. Additionally, commercial real estate loans are subject to unique risks. These types of loans are often viewed as having more risks than residential real estate or other consumer loans, primarily because relatively large amounts are loans to a relatively small number of borrowers. Thus, the deterioration of even a small number of these loans could cause a significant increase in the loan loss allowance or loan charge-offs, which in turn could have a material adverse effect on Southern States’ financial condition and results of operations. Furthermore, commercial real estate loans depend on cash flows from the property securing the debt. Cash flows may be affected significantly by general economic conditions and a downturn in the local economy in one of Southern States’ markets or in occupancy rates where a property is located could increase the likelihood of default.
We may foreclose upon and take title to or operate property in the ordinary course of business, which may subject us to environmental risk. Although management has policies requiring environmental reviews before loans secured by real property are made and before foreclosure is commenced, if hazardous substances are found on such property, or found in a greater extent than expected, Southern States could be liable for remediation costs, as well as for personal injury and property damage on such collateral.
Our limited geographic markets increases these risks. Most of the real estate securing Southern States’ loans is located in Alabama and Georgia. Because the value of this collateral depends upon local real estate market conditions and activity, and is affected by, among other things, neighborhood characteristics, real estate tax rates, the cost of operating the properties, and local governmental regulation, adverse changes in any of these factors in our markets could cause a decline in the value of the collateral securing a significant portion of Southern States’ loan portfolio. Further, the concentration of real estate collateral in these markets limits Southern States’ ability to diversify the risk of such occurrences.
Southern States’ allowance for estimated loan losses may not be adequate to cover actual loan losses, which may require Southern States to take a charge to earnings and adversely impact its financial condition and results of operations.
Southern States maintains an allowance for estimated loan losses that Southern States believes is adequate to absorb any probable losses in its loan portfolio. Management determines the amount of the allowance based upon an analysis of general market conditions, the credit quality of Southern States’ loan portfolio and the performance of Southern States’ customers relative to their financial obligations with Southern States. Southern States periodically evaluates the loan portfolio and assigns risk grading to its loans, which can result in changes in the allowance for loan losses. The amount of future losses is affected by changes in economic, operating, and other conditions, including changes in interest rates, which may be beyond Southern States’ control, and such losses may exceed the allowance for loan losses. Although Southern States believes that its allowance for estimated loan losses is adequate to absorb probable losses on existing loans that may become uncollectible, there can be no assurance that the allowance will prove sufficient to cover actual loan losses in the future. If actual losses exceed the allowance, the excess losses could adversely affect Southern States’ net income and capital. Such excess could also lead to larger allowances for loan losses in future periods, which could in turn adversely affect net income and capital in those periods. If economic conditions differ substantially from the assumptions used in the estimate, or if the performance of Southern States’ loan portfolio deteriorates, future losses may occur, and increases in the allowance may be necessary, either of which would have a negative effect on Southern States’ financial condition and results of operations.
Additionally, federal banking regulators, as part of their supervisory function, periodically review the adequacy of Southern States’ allowance for estimated loan losses. These agencies may require Southern States to establish additional allowances based on their judgment of the information available at the time of their examinations. If these regulatory agencies require Southern States to increase the allowance for estimated loan losses, it would have a negative effect on Southern States’ financial condition and results of operations.
29
Table of Contents
Any branch expansion into new markets might not be successful.
As part of Southern States’ ongoing strategic plan, Southern States may consider expansion into adjacent markets. Such expansion might take the form of the establishment of de novo branches or the acquisition of existing banks or bank branches. There are considerable costs associated with opening new branches, and new branches generally do not generate sufficient revenues to offset costs until they have been in operation for some time. There are substantial risks associated with opening or acquiring branches, including risks that
| • | revenues from such activities might not be sufficient to offset the development, compliance, and other implementation costs; |
| • | branch acquisitions permit the existing customers to move their deposit and loan relationships and such runoff may adversely affect the expected benefits of such expansion; |
| • | competing products and services and shifting market preferences might affect the profitability of such activities; |
| • | integration costs and time and loss of branch personnel may make branch acquisitions more costly and less profitable than expected; and |
| • | Southern States’ internal controls might be inadequate to manage the risks associated with new activities. |
Furthermore, it is possible that Southern States’ unfamiliarity with new markets or lines of business might adversely affect the success of such actions. If any such expansions into new geographic or product markets are not successful, there could be an adverse effect on Southern States’ financial condition and results of operations.
Acquisitions may disrupt Southern States’ business and dilute stockholder value, and integrating acquired companies may be more difficult, costly, or time-consuming than Southern States expects.
Southern States’ business strategy focuses on organic growth, including new hires and facilities, and growth through acquisitions of financial institutions. As a result of the COVID-19 pandemic, the market for acquisitions may be limited, and we may face increased difficulties pursuing growth through acquisitions. Southern States’ pursuit of acquisitions may disrupt Southern States’ business, and common stock that Southern States issues as merger consideration may dilute the book value or market value of your investment, especially since an acquisition frequently involves the payment of a premium over book and market values. In addition, Southern States may fail to realize some or all of the anticipated benefits of completed acquisitions.
In addition, Southern States’ acquisition activities could be material to Southern States’ business and involve a number of significant risks, including the following:
| • | incurring time and expense associated with identifying and evaluating potential acquisitions and negotiating potential transactions, resulting in Southern States’ attention being diverted from the operation of Southern States’ existing business; |
| • | using inaccurate estimates and judgments to evaluate credit, operations, management, and market risks with respect to the target company or the assets and liabilities that Southern States seeks to acquire; |
| • | exposure to potential asset quality issues of the target company; |
| • | intense competition from other banking organizations and other potential acquirers, many of which have substantially greater resources than Southern States has; |
| • | potential exposure to unknown or contingent liabilities of banks and businesses Southern States acquires, including, without limitation, liabilities for regulatory and compliance issues; |
| • | inability to realize the expected revenue increases, cost savings, increases in geographic or product presence, and other projected benefits of the acquisition; |
30
Table of Contents
| • | incurring time and expense required to integrate the operations and personnel of the combined businesses; |
| • | inconsistencies in standards, procedures, and policies that would adversely affect Southern States’ ability to maintain relationships with customers and employees; |
| • | experiencing higher operating expenses relative to operating income from the new operations, creating an adverse short-term effect on Southern States’ results of operations; |
| • | losing key employees and customers; |
| • | the costs, time and risk of converting financial and customer data; |
| • | integration of acquired customers into financial and customer product systems; |
| • | potential changes in banking or tax laws or regulations that may affect the target company; or |
| • | risks of marking assets and liabilities to current market values, and possible future impairment of goodwill and other intangibles resulting from acquisitions. |
If difficulties arise with respect to the integration process, the economic benefits expected to result from acquisitions might not occur. As with any merger of financial institutions, there also may be business disruptions that cause Southern States to lose customers or cause customers to move their business to other financial institutions. Failure to successfully integrate businesses that Southern States acquires could have an adverse effect on its profitability, return on equity, return on assets, or its ability to implement its strategy, any of which in turn could have a material adverse effect on its business, financial condition, and results of operation.
Southern States’ financial performance will be negatively impacted if Southern States is unable to execute its growth strategy.
Southern States’ current growth strategy is to grow organically, including through new hires and facilities, supplemented with select acquisitions. Southern States’ ability to grow organically depends primarily on generating loans and deposits of acceptable risk and expense, and Southern States may not be successful in continuing this organic growth. Southern States’ ability to identify appropriate markets for expansion, recruit and retain qualified personnel, and fund growth at a reasonable cost depends upon prevailing economic conditions, maintenance of sufficient capital, competitive factors, and changes in banking laws, among other factors. Conversely, if Southern States grows too quickly and is unable to control costs and maintain asset quality, such growth, whether organic or through select acquisitions, could materially and adversely affect its financial condition and results of operations.
While we have experienced positive organic growth in the last 12 months and have made efficient hires of loan officers with quality customers, the COVID-19 pandemic, as well as its adverse effects on the economy, both short-term and long-term, and uncertainty by the public in general of the stability of the economy could hinder our growth plans, including the opening of new branches, the development of further business opportunities where we currently have branches, and acquisition activity.
If we are unable to execute on the acquisition of suitable banks for any reason, including changes in the market that make acquisitions less attractive, more costly, or more risky, our future growth plans, and our financial performance, could be impaired.
Southern States’ liquidity needs might adversely affect Southern States’ financial condition and results of operations.
The primary sources of liquidity for Southern States Bank are customer deposits, loan repayments and the sale or maturity of investment securities. Loan repayments are subject to credit risks. In addition, deposit levels may be affected by a number of factors, including interest rates paid by competitors, general interest rate levels,
31
Table of Contents
returns available to customers on alternative investments, and general economic conditions. If market interest rates rise or our competitors raise the rates they pay on deposits, our funding costs may increase, either because we raise our rates to avoid losing deposits or because we lose deposits and must rely on more expensive sources of funding. Higher funding costs could reduce our net interest margin and net interest income and could have a material adverse effect on our business, financial condition, results of operations and cash flows from operations.
Therefore, Southern States Bank may be required to rely from time to time on secondary sources of liquidity to meet withdrawal demands or otherwise fund operations or support growth. Southern States Bank has lines of credit in place with the Federal Home Loan Bank of Atlanta and correspondent banks that Southern States believes are adequate to meet the Bank’s liquidity needs. However, there can be no assurance that these arrangements will be sufficient to meet future liquidity needs, particularly if loan demand grows faster than anticipated.
The Company is a separate and distinct entity from the Bank, and depends on the issuance of capital stock and borrowings, as well as dividends from the Bank, for liquidity.
Southern States may not be able to adequately measure and limit the credit risks associated with its loan portfolio, which could adversely affect its profitability.
As a part of the products and services that Southern States offers, Southern States makes commercial and commercial real estate loans. The principal economic risk associated with each class of loans is the creditworthiness of the borrower, which is affected by the strength of the relevant business market segment, local market conditions, and general economic conditions. Additional factors related to the credit quality of commercial loans include the quality of the management of the business and the borrower’s ability both to properly evaluate changes in the supply and demand characteristics affecting its market for products and services, and to effectively respond to those changes. Additional factors related to the credit quality of commercial real estate loans include tenant occupancy rates and the quality of management of the property. A failure to effectively measure and limit the credit risks associated with Southern States loan portfolio could have an adverse effect on Southern States’ business, financial condition, and results of operations.
Rising unemployment, decreasing GDP, the closing, even if temporary, of non-essential businesses, and the overall negative effect on the economy from a prolonged COVID-19 pandemic could cause various of our customers to be unable to meet their loan obligations to us. Loan modifications and payment deferrals provide our borrowers with temporary relief, but such relief may be insufficient, depending on the length and severity of the COVID-19 pandemic and its effects on the economy. In addition to loan deferrals and modifications, we are participating in certain government programs designed to bolster the economy during the pandemic, such as the PPP, which is intended to fund borrowers’ payrolls and certain operating expenses, not to support existing borrowers’ loans. Our customers’ participation in other government programs also may stabilize their cash flows during a short to medium term pandemic, but may not prevent significant loan delinquencies and losses. In addition, we have loans that are not covered or supported by any government guarantees or program. Thus, we could experience various impairments of such loans, including a delay in payments of principal and interest, and borrowers may be unable to meet their loan payments timely. In the event we are forced to foreclose upon collateral securing our loans, the COVID-19 pandemic could cause losses in the original value of such collateral, and we may be unable to sell such collateral timely at reasonable prices. All of the foregoing could have adverse consequences on our business, results of operations and financial condition.
As a community banking institution, Southern States has smaller lending limits and different lending risks than certain of its larger, more diversified competitors.
Southern States is a community banking institution that provides banking services to the local communities in the market areas in which it operates. Southern States’ ability to diversify economic risks is limited by Southern States’ local markets and economies. Southern States lends primarily to individuals and small to
32
Table of Contents
medium-sized businesses, which may expose Southern States to greater lending risks than those of banks that lend to larger, better-capitalized businesses with longer operating histories. These small to medium-sized businesses and entrepreneurs may have fewer financial resources in terms of capital or borrowing capacity, and less developed internal controls and financial reporting than larger entities. If economic conditions negatively impact our markets generally, and small to medium-sized businesses are adversely affected, Southern States’ financial condition and results of operations may be negatively affected. In addition, Southern States’ legally mandated lending limits are lower than those of certain of Southern States’ competitors that have more capital than Southern States has. These lower lending limits may discourage borrowers with lending needs that exceed Southern States’ limits from doing business with Southern States.
Our business success and growth depends significantly on key management personnel and our ability to attract and retain key people.
Southern States depends heavily upon its senior management team. Our success and growth depends, in large part, on our ability to attract and retain key people with customer relationships. We compete with other financial services companies for people primarily on the basis of compensation and benefits, support services and financial position. Intense competition exists for key employees with demonstrated ability, and we may be unable to hire or retain such employees. The loss of the services of a member of Southern States’ senior management team, or an inability to attract other experienced banking personnel, could adversely affect Southern States’ business. Some of these adverse effects could include the loss of personal contacts with existing or potential customers, as well as the loss of special technical knowledge, experience, and skills of such individuals who are responsible for Southern States’ operations.
Risks Related to Banking Regulation
Southern States is subject to extensive regulation in the conduct of its business, which imposes additional costs on Southern States and adversely affects its profitability.
As a bank holding company, Southern States is subject to federal regulation under the Bank Holding Company Act of 1956, as amended (the “BHCA”), and the examination and reporting requirements of the Federal Reserve. Federal regulation of the banking industry, along with tax and accounting laws, regulations, rules, and standards, may limit Southern States’ operations significantly and control the methods by which Southern States conducts business, as they limit those of other banking organizations. Banking regulations are primarily intended to protect depositors, deposit insurance funds, and the banking system as a whole, and not stockholders or other creditors. These regulations affect lending practices, capital structure, capital levels, investment practices, dividend policy, and overall growth, among other things. For example, federal and state consumer protection laws and regulations limit the manner in which Southern States may offer and extend credit. In addition, the laws governing bankruptcy generally favor debtors, making it more expensive and more difficult to collect from customers who become subject to bankruptcy proceedings.
Southern States also may be required to invest significant management attention and resources to evaluate and make any changes necessary to comply with new or additional regulations that may be adopted by Congress or the banking regulators. This allocation of resources, as well as any failure to comply with applicable requirements, may negatively impact Southern States’ financial condition and results of operations.
Banking agencies periodically conduct examinations of Southern States’ business, including compliance with laws and regulations, and Southern States’ failure to comply with any supervisory actions to which Southern States becomes subject as a result of such examinations could materially and adversely affect Southern States.
Southern States and the Bank are subject to supervision and regulation by banking agencies that periodically conduct examinations of their businesses, including compliance with laws and regulations. Southern States and any nonbanking subsidiaries are subject to supervision and periodic examination by the Federal Reserve. The
33
Table of Contents
Bank is subject to supervision and periodic examination by the FDIC and the Alabama State Banking Department (“ASBD”). Accommodating such examinations may require management to reallocate resources, which would otherwise be used in the day-to-day operation of other aspects of Southern States’ business. If, as a result of an examination, any such banking agency was to determine that the financial condition, capital resources, allowance for loan losses, asset quality, earnings prospects, management, liquidity, or other aspects of Southern States’ operations had become unsatisfactory, or that Southern States or its management were in violation of any law or regulation, such banking agency may take a number of different remedial actions as it deems appropriate. These actions include the power to enjoin “unsafe or unsound” practices, to require affirmative action to correct any conditions resulting from any violation or practice, to issue an administrative order that can be judicially enforced, to direct an increase in Southern States’ capital, to restrict Southern States’ growth, to timely transition away from LIBOR rates, to assess civil monetary penalties against Southern States, its officers, or directors, to remove officers and directors, and, if it is concluded that such conditions cannot be corrected or there is an imminent risk of loss to depositors, to terminate Southern States’ deposit insurance. If Southern States becomes subject to any such a regulatory action, it could have a material adverse effect on Southern States’ business, financial condition, and results of operations. See “Supervision and Regulation.”
FDIC deposit insurance assessments may materially increase in the future, which would have an adverse effect on earnings.
Southern States Bank is assessed a quarterly deposit insurance premium by the FDIC. The failure of banks nationwide during the financial crisis significantly depleted the Deposit Insurance Fund (“DIF”) and reduced the ratio of reserves to insured deposits. The FDIC adopted a DIF Restoration Plan, which required the DIF to attain a 1.35% reserve ratio by September 30, 2020. This ratio was attained in the third quarter of 2018. FICO assessments by the FDIC ended March 2019 and the Bank received small bank assessment credits from the FDIC aggregating $200,262 during the last six months of 2019 and no amounts in 2020. The Bank also realized an offset to its FDIC 2020 assessments of as a result of its participation in the PPP. This offset for the period ended March 31, 2021 was $9,100 and is expected to decline the rest of the year as PPP loans are forgiven by the SBA or are paid off. Southern States Bank could be required to pay significantly higher premiums or additional special assessments, if, among other things, future bank failures deplete the DIF. This would adversely affect earnings, thereby reducing the availability of funds to pay dividends to Southern States.
Southern States and Southern States Bank are subject to capital requirements by regulators.
Applicable regulations require Southern States and Southern States Bank to maintain specific capital standards in relation to the respective credit risks of their assets and off-balance sheet exposures. Various components of these requirements are subject to qualitative judgments by regulators. Southern States Bank maintains a “well capitalized” status under the current regulatory framework. Southern States Bank’s failure to maintain a “well capitalized” status could affect customers’ confidence in Southern States Bank, which could adversely affect its ability to do business. In addition, failure to maintain such status could also result in restrictions imposed by regulators on Southern States Bank’s growth, brokered deposits and deposit rates, dividends, management compensation and other activities. Any such effect on customers or restrictions by regulators could have a material adverse effect on Southern States’ financial condition and results of operations.
The Federal Reserve may require Southern States to commit capital resources to support the Bank.
Federal law requires a bank holding company to act as a source of financial and managerial strength to its subsidiary banks, and to commit resources to support such subsidiary banks. Under the “source of strength” doctrine, the Federal Reserve may require a bank holding company to make capital injections into a troubled subsidiary bank and may charge the bank holding company with engaging in unsafe and unsound practices for failure to commit resources to a subsidiary bank. A capital injection may be required at times when Southern States may not have the resources to provide it and therefore may be required to borrow the funds or raise capital, even if a further investment was not otherwise warranted.
34
Table of Contents
Southern States may need to raise additional capital in the future, including as a result of potential increased minimum capital thresholds established by regulators, but that capital may not be available when it is needed or may be dilutive to stockholders.
Southern States is required by federal and state regulatory authorities to meet regulatory capital requirements. Institutions that seek acquisitions such as Southern States are expected to maintain capital substantially above regulatory minimums. New regulations implementing minimum capital standards could require financial institutions to maintain higher minimum capital ratios and may place a greater emphasis on common equity and tangible common equity as a component of “Tier 1 capital,” which consists generally of stockholders’ equity and qualifying preferred stock, less certain goodwill items and other intangible assets. In order to support Southern States’ operations and comply with regulatory standards, Southern States may need to raise capital in the future. Southern States’ ability to raise additional capital will depend on conditions in the capital markets at that time (which are outside of Southern States’ control) on Southern States’ financial condition and performance. The capital and credit markets have experienced significant volatility in recent years, and capital may not be available to Southern States or on reasonable terms, when needed. In some cases, the markets have produced downward pressure on stock prices and credit availability for certain issuers without regard to those issuers’ underlying financial strength. If Southern States cannot raise additional capital when needed, its financial condition and results of operations may be adversely affected, and its banking regulators may subject Southern States to regulatory enforcement action as outlined above. Furthermore, Southern States’ issuance of additional shares of common stock could dilute the economic ownership interest of Southern States’ stockholders.
The Company is an entity separate and distinct from the Bank.
The Company is an entity separate and distinct from the Bank. Company transactions with the Bank are limited by Sections 23A and 23B of the Federal Reserve Act and Federal Reserve Regulation W. We depend upon the Bank’s earnings and dividends, which are limited by law and regulatory policies and actions, for cash to pay the Company’s debt and corporate obligations, and to pay dividends to our shareholders. If the Bank’s ability to pay dividends to the Company was limited, the Company’s liquidity and financial condition could be materially and adversely affected.
The Bank is the Company’s principal asset, and all of the Bank’s outstanding stock has been pledged to secure the Line of Credit to the Company from an unrelated lender.
The Bank accounts for substantially all of the Company’s consolidated assets and earnings. The Company has a $25 million Line of Credit from First Horizon Bank, Memphis, Tennessee. This Line of Credit matures August 2022, and is it is secured by the Company’s pledge of all of the Bank’s outstanding common stock. An uncured default by the Company under the Line of Credit or the Company’s inability to repay or refinance the Line of Credit when it is due, could result in the Company’s loss of the Bank.
Southern States’ ability to pay dividends is subject to restriction by various laws and regulations and other factors.
As a bank holding company, Southern States is a separate entity from the Bank and has no material assets other than its equity interest in the Bank. Thus, it has no independent means of generating revenue except for dividends from the Bank and cash and securities it may hold. The Bank or its subsidiaries may be restricted from making distributions to Southern States under applicable law or regulation or under the terms of financing arrangements, or may otherwise be unable to provide such funds.
Declarations of dividends is subject to the approval of our board of directors and subject to limits imposed on us by our regulators. Any future constraints on liquidity at the holding company level could impair Southern States’ ability to declare and pay dividends on Southern States’ common stock. In order to pay any dividends, we
35
Table of Contents
rely on dividends from the Bank. Under Alabama law, state-chartered banks must maintain a capital surplus of at least 20% of its capital, which the Bank currently exceeds. Moreover, our Bank is also required by Alabama law to obtain the prior approval of the Alabama State Banking Department Superintendent for its payment of dividends if the total of all dividends declared by the Bank in any calendar year will exceed the total of (1) the Bank’s net earnings (as defined by statute) for that year, plus (2) its retained net earnings for the preceding two years, less any required transfers to surplus. In addition, the bank must maintain certain capital levels, which may restrict the ability of our Bank to pay dividends to us and our ability to pay dividends to our stockholders. The federal banking agencies’ capital regulations applicable to both Southern States and Southern States Bank require each entity to maintain the following capital ratios (when including the 2.5% capital conservation buffer which is made up solely of common equity tier l capital) to avoid limits on capital distributions, including dividends: (i) minimum ratio of common equity tier 1 capital to total risk-weighted assets of 7%, (ii) minimum ratio of tier 1 capital to total risk-weighted assets of 8.5%, and (iii) minimum ratio of total capital to risk-weighted assets of 10.5%. Unless the Company is permitted to be treated as a “small bank holding company” under the Federal Reserve’s Small Bank Holding Company Policy Statement, the Company and the Bank must each meet consolidated capital requirements. Please see “Supervision and Regulation—Capital Adequacy.” Also, Southern States’ and Southern States Bank’s regulators have the authority to restrict dividends and payments on subordinated notes on each entity, if they determine they are operating in an unsafe or unsound manner, including inadequate capital.
At March 31, 2021, Southern States Bank could pay approximately $9.2 million of dividends to Southern States without prior approval of the Superintendent. However, the payment of dividends is also subject to declaration by our board of directors, which takes into account our financial condition, earnings, general economic conditions and other factors, including statutory and regulatory restrictions. There can be no assurance that dividends will in fact be paid on our common stock in future periods or that, if paid, such dividends will not be reduced or eliminated. However, the amount and frequency of cash dividends, if any, will be determined by our board of directors after consideration of a number of factors, including, but not limited to: (1) our historical and projected financial condition, liquidity and results of operations; (2) our capital levels and needs; (3) any acquisitions or potential acquisitions that we are considering; (4) contractual, statutory and regulatory prohibitions and other limitations; (5) general economic conditions; and (6) other factors deemed relevant by our board of directors. Our ability to pay dividends may also be limited on account of our outstanding indebtedness, as we generally must make payments on our outstanding indebtedness before any dividends can be paid on our common stock. Finally, because our primary asset is our investment in the stock of the Bank, Southern States is dependent upon dividends from the Bank to pay our operating expenses, satisfy our obligations and pay dividends on our common stock, and the Bank’s ability to pay dividends on its common stock will substantially depend upon its earnings and financial condition, liquidity and capital requirements, the general economic and regulatory climate and other factors deemed relevant by its board of directors. Therefore, there can be no assurance that we will pay any dividends to holders of our common stock, or as to the amount of any such dividends. See “Dividend Policy” and “Supervision and Regulation.”
Southern States operates in a highly competitive industry and faces significant competition from other financial institutions and financial services providers, which may decrease its growth or profits.
Consumer and commercial banking are highly competitive industries. Southern States’ market areas contain not only a large number of community and regional banks, but also a significant presence of the country’s largest commercial banks. Southern States competes with other state and national financial institutions, as well as savings and loan associations, savings banks, and credit unions, for deposits and loans. In addition, Southern States competes with financial intermediaries, such as consumer finance companies, commercial finance companies, mortgage banking companies, insurance companies, securities firms, mutual funds, and several government agencies, as well as major retailers, all actively engaged in providing various types of loans and other financial services. Some of these competitors may have a longer history of successful operations in Southern States’ market areas and greater ties to local businesses and more expansive banking relationships, as well as more established depositor bases, fewer regulatory constraints, and lower cost structures than Southern States has. Competitors with
36
Table of Contents
greater resources may possess an advantage through their ability to maintain numerous banking locations in more convenient sites, to conduct more extensive promotional and advertising campaigns, or to operate a more developed technology platform. Due to their size, many competitors may offer a broader range of products and services, as well as better pricing for certain products and services than Southern States can offer. For example, in the current low interest rate environment, competitors with lower costs of capital may solicit Southern States’ customers to refinance their loans with lower interest rates. Further, increased competition among financial services companies due to the recent consolidation of certain competing financial institutions may adversely affect Southern States’ ability to market Southern States’ products and services. Technology has lowered barriers to entry and made it possible for banks to compete in Southern States’ market areas without a retail footprint by offering competitive rates, and for non-banks to offer products and services traditionally provided by banks.
The financial services industry could become even more competitive as a result of legislative, regulatory, and technological changes and continued consolidation. Banks, securities firms, and insurance companies can merge under the umbrella of a financial holding company, which can offer virtually any type of financial service, including banking, securities underwriting, insurance (both agency and underwriting), and merchant banking.
Southern States’ ability to compete successfully depends on a number of factors, including:
| • | Southern States’ ability to develop, maintain, and build upon long-term customer relationships based on quality service and high ethical standards; |
| • | Southern States’ ability to attract and retain qualified employees to operate Southern States’ business effectively; |
| • | Southern States’ ability to expand market position; |
| • | the scope, relevance, and pricing of products and services that Southern States offers to meet customer needs and demands; |
| • | the rate at which Southern States introduces new products and services relative to its competitors; |
| • | customer satisfaction with Southern States’ level of service; and |
| • | industry and general economic trends. |
Failure to perform in any of these areas could significantly weaken Southern States’ competitive position, which could adversely affect Southern States’ growth and profitability, which, in turn, could harm Southern States’ business, financial condition, and results of operations.
Southern States continually encounters technological change and may have fewer resources than its competitors to continue to invest in technological improvements.
The banking and financial services industries are undergoing rapid technological changes, with frequent introductions of new technology-driven products and services. In addition to enhancing the level of service provided to customers, the effective use of technology increases efficiency and enables financial institutions to reduce costs. Southern States’ future success will depend, in part, upon Southern States’ ability to address the needs of customers by using technology to provide products and services that enhance customer convenience and create additional efficiencies in operations. Many of Southern States’ competitors have greater resources to invest in technological improvements, and Southern States may not be able to effectively implement new technology-driven products and services, which could reduce its ability to effectively compete.
Risks Related to this Offering and an Investment in Our Common Stock
No prior public market exists for our common stock, and an active, liquid market for our common stock may not develop or be sustained following this offering.
Before this offering, there has been no established public market for our common stock. Although we have applied to list our common stock on NASDAQ, an active, liquid trading market for our common stock may not
37
Table of Contents
develop or be sustained following this offering. The initial public offering price for our common stock will be determined by negotiations between us, the selling stockholders and the representatives of the underwriters and may not be indicative of prices that will prevail in the open market following this offering. A public trading market having the desired characteristics of depth, liquidity and orderliness depends upon the presence in the marketplace and independent decisions of willing buyers and sellers of our common stock, over which we have no control. Without an active, liquid trading market for our common stock, stockholders may not be able to sell their shares at the volume, prices and times desired or sell their shares at all. Moreover, the lack of an established market could have an adverse effect on the value of our common stock. An inactive market may also impair our ability to raise capital by selling our common stock and may impair our ability to expand our business through acquisitions, by using our common stock as consideration, should we elect to do so.
The market price of our common stock may be subject to substantial fluctuations, which may make it difficult for you to sell your shares at the volume, prices and times desired.
The market price of our common stock may be highly volatile, which may make it difficult for you to resell your shares at the volume, prices and times desired. There are many factors that may impact the market price and trading volume of our common stock, including, without limitation:
| • | actual or anticipated fluctuations in our operating results, financial condition or asset quality; |
| • | changes in economic or business conditions; |
| • | the effects of, and changes in, trade, monetary and fiscal policies, including the interest rate policies of the Federal Reserve, or in laws or regulations affecting us; |
| • | the public reaction to our press releases, our other public announcements and our filings with the SEC; |
| • | changes in accounting standards, policies, guidance, interpretations or principles; |
| • | the number of securities analysts covering us; |
| • | publication of research reports about us, our competitors, or the financial services industry generally, or changes in, or failure to meet, securities analysts’ estimates of our financial and operating performance, or lack of research reports by industry analysts or ceasing of coverage; |
| • | changes in market valuations or earnings of companies that investors deem comparable to us; |
| • | the trading volume of our common stock; |
| • | future issuances of our common stock or other securities; |
| • | future sales of our common stock by us or our directors, executive officers or principal stockholders; |
| • | additions or departures of key personnel; |
| • | perceptions in the marketplace regarding our competitors and us; |
| • | changes or proposed changes in laws or regulations, or differing interpretations thereof affecting our business, or enforcement of these laws or regulations; |
| • | new technology used, or services offered by, competitors; |
| • | additional investments from third parties; |
| • | significant acquisitions or business combinations, strategic partnerships, joint ventures or capital commitments by or involving our competitors or us; |
| • | other economic, competitive, governmental, regulatory and technological factors affecting our operations, pricing, products and services; |
| • | other news, announcements or disclosures (whether by us or others) related to us, our competitors, our core market or the financial services industry; and |
38
Table of Contents
| • | geopolitical conditions such as acts or threats of terrorism, pandemics, military conflicts, tariffs or trade wars. |
In particular, the realization of any of the risks described in this “Risk Factors” section of this prospectus could have a material adverse effect on the market price of our common stock and cause the value of your investment to decline. The stock market and, in particular, the market for financial institution stocks have at times experienced substantial fluctuations in recent years, which in many cases have been unrelated to the operating performance and prospects of particular companies. In addition, significant fluctuations in the trading volume in our common stock may cause significant price variations to occur. Increased market volatility could have an adverse effect on the market price of our common stock, which could make it difficult to sell your shares at the volume, prices and times desired.
As of March 31, 2021, approximately 40.9% of our voting and non-voting common stock is owned by certain institutional holders, and future sales by these institutional holders may adversely affect the prevailing market price of our common stock.
On December 27, 2016, we sold an aggregate of (1) 2,137,143 shares of common stock to Patriot Financial Partners II, L.P.; Patriot Financial Partners Parallel II, L.P.; EJF Sidecar Fund, Series LLC – Series E; Ithan Creek Investors USB, LLC; Davis Partnership, L.P.; Banc Fund IX L.P.; Banc Fund VIII L.P.; Siena Capital Partners I, L.P.; Siena Capital Partners Accredited, L.P. and JCSD Partners, LP (collectively, the “Institutional Investors”), and (2) 161,143 shares of Series B convertible preferred stock, $0.01 par value per share (the “Series B Preferred Stock”) to Patriot Financial Partners II, L.P. and Patriot Financial Partners Parallel II, L.P. (collectively, “Patriot”). The Series B Preferred Stock was non-voting and, under certain conditions, could be converted into shares of non-voting common stock on a one-to-five basis. Patriot converted its 161,143 shares of Series B Preferred Stock into 805,715 shares of non-voting common stock on May 1, 2017 and no preferred stock is outstanding. The non-voting common stock is non-voting in the hands of any holder of 9.9% or more of Southern States’ voting common stock. Upon the sale or transfer of the non-voting stock to any person unaffiliated with the holder who holds or controls less than 9.9% of Southern States’ voting common stock, such transferred shares automatically will become an identical number of shares of voting common stock, as provided in Southern States certificate of incorporation. As of March 31, 2021, the Institutional Investors continue to own 3,158,937 shares of common stock and non-voting common stock, representing approximately 40.9% of our issued and outstanding voting and non-voting common stock as of such date. Please see “Principal and Selling Stockholders.”
In connection with the transactions above, we entered into a Registration Rights Agreement, dated as of December 28, 2016, with the Institutional Investors (the “Registration Rights Agreement”). The Registration Rights Agreement provides for demand and piggyback registration rights. Pursuant to its demand registration rights, after June 28, 2020, Patriot had the right to require Southern States to file a registration statement with the SEC so that Patriot may resell its shares of common stock. Subject to the terms of the Registration Rights Agreement, the other Institutional Investors would be permitted to include their shares of common stock. Patriot may make two such requests, provided that such requests are 180 days or more apart. If Southern States files a registration statement for a primary or secondary offer of its securities (other than a registration statement related to equity compensation plans or mergers and acquisitions), the Registration Rights Agreement requires Southern States to notify the Institutional Investors who may elect to have their securities included in such registration statement for resale.
In accordance with the Registration Rights Agreement, Patriot and other Institutional Investors are acting as selling stockholders in this offering and offering shares of common stock. To the extent that the Institutional Investors continue to hold shares of common stock following this offering, it is possible that Southern States may be required to register for resale shares of common stock of Institutional Investors, and such resale could have adverse effect on volatility and the market value of Southern States common stock then outstanding. Such resales could also make it more difficult for Southern States and its stockholders to sell common stock.
39
Table of Contents
Future sales or the availability for sale of substantial amounts of our common stock in the public market could adversely affect the prevailing market price of our common stock and could impair our ability to raise capital through future sales of equity securities.
Sales of a substantial number of shares of our common stock in the public market following this offering, or the perception that large sales could occur, could cause the market price of our common stock to decline or limit our future ability to raise capital through an offering of equity securities.
Upon completion of this offering, the authorized common stock of Southern States Bancshares, Inc. will consist of 30,000,000 shares of voting common stock, $5.00 par value per share, of which 8,371,440 shares will be issued and outstanding (or 8,671,400 shares if the underwriters exercise their option to purchase additional shares in full), 5,000,000 shares of non-voting common stock, $5.00 par value per share, of which 341,417 shares will be issued and outstanding (not giving effect to any conversion of non-voting common stock into common stock in connection with this offering), and 2,000,000 shares of preferred stock, par value $0.01 per share, none of which will be issued and outstanding. The number of shares of common stock outstanding includes shares that we and the selling stockholders are selling in this offering (or shares if the underwriters exercise their option to purchase additional shares in full), which will be freely transferable without restriction or further registration under the Securities Act. Holders of approximately 46.8% of the shares of our common stock outstanding prior to this offering, including all of our executive officers and directors and certain of the Institutional Investors, have agreed not to sell any shares of our common stock for a period of at least 180 days from the date of the final prospectus, subject to certain exceptions. See “Underwriting.” Following the expiration of the applicable lock-up period, all of these shares will be eligible for resale under Rule 144 of the Securities Act, subject to any remaining holding period requirements and, if applicable, volume limitations. The market price of our common stock may decline significantly when the restrictions on resale by our existing stockholders lapse. The remaining shares of common stock outstanding prior to this offering are not subject to lock-up agreements and substantially all of such shares have been held by our non-affiliates for at least one year and therefore may be freely sold by such persons upon the completion of this offering. See “Shares Eligible for Future Sale” for a discussion of the shares of our common stock that may be sold into the public market in the future.
Following the completion of this offering, we also intend to file a registration statement on Form S-8 under the Securities Act to register the offer and sale of shares of our common stock that are issuable under our 2017 Incentive Stock Compensation Plan (the “Plan”). Accordingly, subject to certain vesting requirements we may impose, shares registered under that registration statement will be eligible for sale in the open market immediately by persons other than our executive officers, directors and Institutional Investors and, following the lock-up agreements’ expiration, by our executive officers and directors.
In addition, we may issue shares of our common stock or other securities from time to time as consideration for future acquisitions and investments and under compensation and incentive plans, including the Plan. If any such acquisition or investment is significant, the number of shares of our common stock, or the number or aggregate principal amount, as the case may be, of other securities that we may issue may in turn be substantial. We may also grant registration rights covering those shares of our common stock or other securities in connection with any such acquisitions and investments. Such issuances of common stock may dilute our existing stockholders.
We cannot predict the size of future issuances of our common stock or the effect, if any, that future issuances and sales of our common stock will have on the market price of our common stock. Sales of substantial amounts of our common stock (including shares of our common stock issued in connection with an acquisition or under a compensation or incentive plan, including the Plan), or the perception that such sales could occur, may adversely affect prevailing market prices for our common stock and could impair our ability to raise capital through future sales of our securities.
Investors in this offering will experience immediate and substantial dilution.
If you purchase common stock in this offering, you will pay more for your shares than the tangible book value per share immediately prior to the completion of the offering. As a result of the offering, you will incur
40
Table of Contents
immediate dilution of $3.61 per share, representing the difference between the assumed initial public offering price of $20.00 per share (the midpoint of the price range on the cover) and our as adjusted tangible book value of $16.39 per share. Accordingly, if we were liquidated at our as-adjusted tangible book value, you would not receive the full amount of your investment. See “Dilution.”
We have broad discretion in the use of the net proceeds from this offering, and our use of those proceeds may not yield a favorable return on your investment.
We intend to use the net proceeds from the sale of the common stock sold by us in the offering for general corporate purposes, which may include capital and liquidity to support our growth and potential acquisitions of other banks or related banking businesses. We will not receive any of the proceeds from the sale of our common stock in this offering by the selling stockholders. We have not specifically allocated the amount of net proceeds that will be used for these purposes, and our management will have broad discretion over how these proceeds are used and could spend the proceeds in ways with which you may not agree. In addition, we may not use the proceeds of this offering effectively or in a manner that increases our market value or enhances our profitability. We have not established a timetable for the effective deployment of the proceeds, and we cannot predict how long it will take to deploy the proceeds. Investing the offering proceeds in securities until we are able to deploy the proceeds will provide lower yields than we generally earn on loans and longer-term investments, which may have an adverse effect on our profitability.
The rights of our common stockholders are subordinate to the rights of the holders of any debt instruments that we may issue and may be subordinate to the holders of any series of preferred stock that we may issue in the future.
As of June 30, 2021, we had approximately $12.5 million indebtedness outstanding under our Line of Credit. Our existing indebtedness is, and future indebtedness that we may incur will be, senior to our common stock. We must make payments on our indebtedness before any dividends can be paid on our common stock, and, in the event of our bankruptcy, dissolution or liquidation, the holders of any indebtedness must be satisfied in full before any distributions can be made to the holders of our common stock. Additionally, the right of a bank holding company to participate in the assets of its subsidiary bank in the event of a bank-level liquidation or reorganization is subject to the claims of the bank’s creditors, including depositors, which generally take priority over bank holding company claims.
Our corporate governance documents, and certain corporate and banking laws applicable to us, could make a takeover more difficult, which could adversely affect the market price of our common stock.
Certain provisions of our amended and restated certificate of incorporation (“certificate of incorporation”) and amended and restated bylaws (“bylaws”) could make it more difficult for a third party to acquire control of our organization or conduct a proxy contest, even if those events were perceived by many of our stockholders as beneficial to their interests. Our certificate of incorporation or bylaws include, among other things, provisions that:
| • | enable our board of directors to issue additional shares of authorized, but unissued capital stock including additional shares of common stock and preferred stock, without further stockholder approval; |
| • | enable our board to establish the terms of preferred stock, including voting rights, dividend rights, redemption features, rights on liquidation or dissolution, and other qualifications, limitations and restrictions; |
| • | establish an advance notice procedure for director nominations and other stockholder proposals; |
| • | do not permit stockholders to call special meetings of stockholders or act by written consent; and |
| • | enable our board of directors to increase the size of the board and fill the vacancies created by the increase. |
41
Table of Contents
In the event that we issue preferred stock in the future that has preference over our common stock with respect to payment of dividends or upon our liquidation, dissolution or winding up, or if we issue preferred stock with voting rights that dilute the voting power of our common stock, the rights of the holders of our common stock or the market price of our common stock could be adversely affected. Any of the foregoing provisions may discourage potential acquisition proposals and could delay or prevent a change in control, including under circumstances in which our stockholders might otherwise receive a premium over the market price of our shares. See “Description of Southern States Capital Stock.”
There are also substantial regulatory limitations on changes of control of bank holding companies that may discourage investors from purchasing shares of our common stock.
With limited exceptions, federal regulations prohibit a person or company or a group of persons deemed to be “acting in concert” from, directly or indirectly, acquiring 10% or more (5% if the acquirer is a bank holding company) of any class of our voting stock or obtaining the ability to control in any manner the election of a majority of the directors or otherwise direct the management or policies of our company without prior notice or application to, and the approval of, the Federal Reserve. Companies investing in banks and bank holding companies receive additional review and may be required to file Change in Bank Control Act notices. Accordingly, prospective investors must be aware of and comply with these requirements, if applicable, in connection with any purchase of shares of our common stock. These provisions could discourage third parties from seeking to acquire significant interests in us or in attempting to acquire control of us, which, in turn, could materially and adversely affect the market price of our common stock.
We are an “emerging growth company” as defined in the JOBS Act and the reduced reporting requirements applicable to emerging growth companies may make our common stock less attractive to investors.
We are an “emerging growth company,” as defined in the JOBS Act. For as long as we continue to be an emerging growth company we are eligible to take advantage of certain exemptions from various reporting requirements that are applicable to other public companies that are not “emerging growth companies.” As an emerging growth company:
| • | we are required to present only two years of audited financial statements and related information; |
| • | we are exempt from the requirement to obtain an attestation report from auditors on management’s assessment of internal control over financial reporting under the Sarbanes-Oxley Act; |
| • | we are not required to comply with any new requirements adopted by the PCAOB, requiring mandatory audit firm rotation or a supplement to the auditor’s report in which the auditor would be required to provide additional information about the audit and the financial statements of the issuer; |
| • | we are permitted to provide less extensive disclosure about our executive compensation arrangements pursuant to the rules applicable to smaller reporting companies, which means we do not have to include a compensation discussion and analysis and certain other disclosures regarding our executive compensation; and |
| • | we are not required to give our stockholders non-binding advisory votes on executive compensation or golden parachute arrangements. |
We may take advantage of these exemptions until we are no longer an emerging growth company. We will cease to be an emerging growth company upon the earliest of: (i) the last day of the fiscal year in which we have at least $1.07 billion in annual gross revenues, (ii) the date on which we become a “large accelerated filer” as defined in Rule 12b-2 under the Exchange Act (the last day of the fiscal year in which we have more than $700 million in market value of our common stock held by non-affiliates as of the prior June 30), (iii) the date on which we issue more than $1.00 billion of non-convertible debt during the prior three-year period, or (iv) the last day of the fiscal year following the fifth anniversary of our initial public offering. We may choose to take
42
Table of Contents
advantage of some but not all of these reduced burdens. We have elected to adopt certain of the reduced disclosure requirements described above for purposes of the registration statement of which this prospectus is a part.
We expect to take advantage of certain of the reduced reporting and other requirements of the JOBS Act with respect to the periodic reports we will file with the SEC and proxy statements that we use to solicit proxies from our stockholders. As a result, the information that we provide to our stockholders may be different than what you might receive from public reporting companies from which you hold equity interests.
In addition, the JOBS Act permits us to take advantage of an extended transition period for complying with new or revised accounting standards affecting public companies. We have elected to use this extended transition period, which means that the financial statements included in this prospectus, as well as any financial statements that we file in the future, may not be subject to all new or revised accounting standards generally applicable to public companies for the transition period as long as we remain an emerging growth company or until we affirmatively and irrevocably opt out of the extended transition period under the JOBS Act. As a result, our financial statements may not be comparable to the financial statements of public companies that comply with such new or revised accounting standards on a non-delayed basis.
We cannot predict whether investors will find our common stock less attractive because we may rely on these exemptions. If some investors find our common stock less attractive as a result, there may a less active trading market for our common stock, and our stock price may be more volatile or decline.
Any deficiencies in our financial reporting or internal controls could materially and adversely affect our business and the market price of our common stock.
For the year ended December 31, 2019, we became subject to the FDIC rules requiring annual management reports on our financial statements, our internal controls and for compliance with laws and regulations related to safety and soundness. For each Annual Report on Form 10-K starting with the year ending December 31, 2022, SEC rules will require that our Chief Executive Officer and Chief Financial Officer periodically certify the existence and effectiveness of our internal control over financial reporting. Beginning with the first Annual Report on Form 10-K we file following the date we cease to be an “emerging growth company” as defined in the JOBS Act, but no later than our Annual Report for the fiscal year ending December 31, 2026, we will be required to include our independent registered public accounting firm’s attestation report on the design and operating effectiveness of our internal control over financial reporting. This process will require significant documentation of policies, procedures and systems, and review of that documentation and testing of our internal control over financial reporting by our internal auditing and accounting staff and our independent registered public accounting firm. This process will require considerable time and attention from management, which could prevent us from successfully implementing our business initiatives and improving our business, financial condition and results of operations, strain our internal resources, and increase our operating costs. We may experience higher than anticipated operating expenses and outside auditor fees during the implementation of these changes and thereafter.
During the course of our testing we may identify deficiencies that would have to be remediated to satisfy the SEC rules for certification of our internal control over financial reporting. A material weakness is defined by the standards issued by the PCAOB as a deficiency, or combination of deficiencies, in internal control over financial reporting that results in a reasonable possibility that a material misstatement of our annual or interim financial statements will not be prevented or detected on a timely basis. As a consequence, we would have to disclose in periodic reports we file with the SEC any material weakness in our internal control over financial reporting. The existence of a material weakness would preclude management from concluding that our internal control over financial reporting is effective and would preclude our independent auditors from expressing an unqualified opinion on the effectiveness of our internal control over financial reporting. In addition, disclosures of deficiencies of this type in our SEC reports could cause investors to lose confidence in our financial reporting,
43
Table of Contents
and may negatively affect the market price of our common stock, and could result in the delisting of our securities from the securities exchanges on which they trade. Moreover, effective internal controls are necessary to produce reliable financial reports and to prevent fraud. If we have deficiencies in our disclosure controls and procedures or internal control over financial reporting, it may materially and adversely affect us.
Securities analysts may not initiate or continue coverage on us.
The trading market for our common stock will depend, in part, on the research and reports that securities analysts publish about us and our business. We do not have any control over these securities analysts, and they may not cover us. If one or more of these analysts cease to cover us or fail to publish regular reports on us, we could lose visibility in the financial markets, which could cause the price or trading volume of our common stock to decline. If we are covered by securities analysts and are the subject of an unfavorable report, the price of our common stock may decline.
An investment in our common stock is not an insured deposit and is subject to risk of loss.
Your investment in our common stock will not be a bank deposit and will not be insured or guaranteed by the FDIC or any other government agency. Your investment will be subject to investment risk, and your investment may lose money.
General Risk Factors
The implementation of the Current Expected Credit Loss (“CECL”) accounting standard could require us to increase our allowance for loan losses and may have a material adverse effect on our financial condition and results of operations.
The Financial Accounting Standards Board (“FASB”) has issued a new accounting standard that will replace the current approach under GAAP, for establishing allowances for loan and lease losses, which generally considers only past events and current conditions, with a forward-looking methodology that reflects the expected credit losses over the lives of financial assets, starting when such assets are first originated or acquired. This standard, referred to as Current Expected Credit Loss, or CECL, will be effective for us beginning January 1, 2023. The CECL standard will require us to record, at the time of origination, credit losses expected throughout the life of the asset portfolio on loans and held-to-maturity securities, as opposed to the current practice of recording losses when it is probable that a loss event has occurred. Southern States is currently evaluating the impact the CECL standard will have on its accounting. The adoption of the CECL standard will materially affect how we determine allowance for loan losses and could require us to significantly increase the allowance. Moreover, the CECL standard may create more volatility in the level of the allowance. If we are required to materially increase the level of the allowance for any reason, such increase could adversely affect our business, financial condition and results of operations.
Use of appraisals in deciding whether to make a loan secured by real property does not ensure the value of the real property collateral.
In considering whether to make a loan secured by real property, Southern States generally requires an appraisal. However, an appraisal is only an estimate of the value of the property at the time the appraisal is made, and appraisals are based upon various assumptions about the real property and local market conditions. If the appraisal does not accurately reflect the amount that may be obtained upon any sale or foreclosure of the property, Southern States may not realize an amount equal to the indebtedness secured by the property.
44
Table of Contents
Southern States uses information technology in its operations, offers online banking services to its customers, and depends on outside third party vendors for data processing services. Unauthorized access to Southern States or its customers’ confidential or proprietary information as a result of a cyber-attack or otherwise could expose Southern States to reputational harm and litigation and adversely affect Southern States’ ability to attract and retain customers.
Southern States relies heavily on communications and information systems to conduct its business. Any failure or interruption of these systems could impair or prevent the effective operation of Southern States’ customer relationship management, general ledger, deposit, lending, or other functions. Information security risks for financial institutions have significantly increased in recent years, in part because of the proliferation of new technologies, the use of the internet and telecommunication technologies to conduct financial transactions, and the increased sophistication and activities of organized crime, foreign governments, hackers, terrorists, activists, and other external parties. Southern States and its service providers are under continuous and expanding threats of loss due to hacking and cyber-attacks, especially as Southern States continues to expand customer applications using the internet, wireless, mobile and other remote channels to transact business. Therefore, the secure processing, transmission, and storage of information in connection with Southern States’ online banking services are critical elements of its operations. However, Southern States’ network could be vulnerable to unauthorized access, computer viruses and other malware, phishing schemes, or other security failures. In addition, customers may use personal smartphones, tablet PCs, or other mobile devices that are beyond Southern States’ control systems in order to access Southern States’ products and services. Southern States’ and its service providers’ technologies, systems and networks, and customers’ devices, may become the target of cyber-attacks, electronic fraud, or information security breaches that could result in the unauthorized release, gathering, monitoring, misuse, loss, or destruction of Southern States or its customers’ confidential, proprietary, and other information, or otherwise disrupt Southern States or its customers’ or other third parties’ business operations. As cyber threats continue to evolve, Southern States may be required to spend significant capital and other resources to protect against these threats or to alleviate or investigate problems caused by such threats. To the extent that Southern States’ activities or the activities of Southern States’ customers involve the processing, storage, or transmission of confidential customer information, any breaches or unauthorized access to such information could present significant regulatory costs and expose Southern States to litigation and other possible liabilities. Any inability to prevent these types of security threats could also cause existing customers to lose confidence in Southern States’ systems and could adversely affect Southern States’ reputation and ability to generate deposits. While Southern States has not experienced any material losses relating to cyber-attacks or other information security breaches to date, Southern States may suffer such losses in the future.
Southern States relies on software and systems developed and/or operated by third-party vendors to process various transactions. These systems include, but are not limited to, general ledger, payroll systems and employee benefits, loan and deposit processing, and securities portfolio accounting. While Southern States reviews the security and controls instituted by the applicable vendors and performs its own testing of user controls, Southern States relies on the continued maintenance of controls and data security by these third-party vendors, including safeguards over the security of customer data.
The increased use of working remotely by our employees during the COVID-19 pandemic as well as our customers increased use of online banking may increase the risks related to our information technology systems, including cyber-attacks and unauthorized access.
The occurrence of any cyber-attack or information security breach could result in potential liability to clients, reputational damage, damage to Southern States’ competitive position, and the disruption of Southern States’ operations, all of which could adversely affect Southern States’ financial condition or results of operations, lead to increased compliance and insurance costs and reduce stockholder value.
The accuracy of our financial statements and related disclosures could be affected if the judgments, assumptions or estimates used in our critical accounting policies are inaccurate.
The preparation of financial statements and related disclosures in conformity with GAAP requires us to make judgments, assumptions and estimates that affect the amounts reported in our consolidated financial
45
Table of Contents
statements and related notes appearing elsewhere in this prospectus. As a result, if future events or regulatory views differ significantly from the judgments, assumptions and estimates in our critical accounting policies, those events or assumptions could have a material impact on our consolidated financial statements and may require us to revise or restate prior period financial statements or realize losses not previously recognized, cause damage to our reputation and the price of our common stock and adversely affect our business, financial condition and results of operations.
Southern States’ financial condition and results of operations are affected by fiscal and monetary policy. Actions by monetary and fiscal authorities, including the Federal Reserve, could lead to inflation, deflation, or other economic impacts that could adversely affect Southern States’ financial performance. The primary impact of inflation on Southern States’ operations most likely will be reflected in increased operating costs. Conversely, deflation generally will tend to erode collateral values and diminish loan quality. Virtually all of Southern States’ assets and liabilities are monetary in nature. As a result, interest rates and the shape of the yield curve have a more significant impact on Southern States’ performance than general levels of inflation or deflation. Interest rates do not necessarily move in the same direction or by the same magnitude as the prices of goods and services.
Southern States depends on the accuracy and completeness of information about customers and counterparties.
In deciding whether to extend credit or enter into other transactions with customers and counterparties, Southern States may rely on information furnished by or on behalf of customers and counterparties, including financial statements and other financial information. Southern States also may rely on representations of customers and counterparties as to the accuracy and completeness of that information and, with respect to financial statements, on reports of independent auditors. In deciding whether to extend credit, Southern States may depend upon its customers’ representations that their financial statements conform to GAAP and present fairly, in all material respects, the financial condition, results of operations, and cash flows of the customer. Southern States also may rely on customer representations and certifications, or other audit or accountants’ reports, with respect to the business and financial condition of its clients. Southern States’ financial condition, results of operations, financial reporting, and reputation could be negatively affected if Southern States relies on materially misleading, false, inaccurate, or fraudulent information.
As a community bank, Southern States’ ability to maintain Southern States’ reputation is critical to the success of Southern States’ business, and the failure to do so may materially adversely affect Southern States’ performance.
Southern States’ reputation is one of the most valuable components of its business. As such, Southern States strives to conduct its business in a manner that enhances its reputation. This is done, in part, by recruiting, hiring, and retaining employees who share Southern States’ core values of being an integral part of the communities Southern States serves, delivering superior service to customers, and caring about customers and associates and maintaining Southern States’ credit culture. If Southern States’ reputation is negatively affected, by the actions of Southern States’ employees or otherwise, Southern States’ business and, therefore, Southern States’ operating results may be materially adversely affected.
Southern States historical growth rate and performance may not be indicative of our future growth or financial results.
We may not be able to sustain our past rate of growth or grow our business at all. Consequently, our past results of operations will not necessarily be indicative of our future operations.
If the communities in which Southern States operates do not grow, or if the prevailing economic conditions locally or nationally are less favorable than Southern States has historically realized, then its ability to implement its business strategies may be adversely affected, and its actual growth and financial performance may materially change.
46
Table of Contents
Moreover, Southern States cannot give any assurance that Southern States will benefit from any market growth or favorable economic conditions in its market areas even if they do occur. If Southern States’ senior management team is unable to provide the effective leadership necessary to implement Southern States’ strategic plan, including the successful integration of any acquisition, Southern States’ actual financial performance may be materially adversely different from Southern States’ expectations and goals. Additionally, to the extent that any component of Southern States’ strategic plan requires regulatory approval, if Southern States is unable to obtain necessary approval without material adverse conditions, Southern States will be unable to completely implement its strategy, which may adversely affect its actual growth and results of operations and financial condition. The inability to successfully implement Southern States’ strategic plan could adversely affect the price of Southern States’ common stock.
The internal controls that Southern States has implemented in order to mitigate risks inherent to the business of banking might fail or be circumvented.
Management regularly reviews and updates Southern States’ internal controls and procedures that are designed to manage the various risks in Southern States’ business, including credit risk, operational risk, and interest rate risk. No system of controls, however well-designed and operated, can provide absolute assurance that the objectives of the system will be met. If there were a failure of such a system, or if a system were circumvented, there could be a material adverse effect on Southern States’ financial condition and results of operations.
Changes in accounting standards could materially impact Southern States’ financial statements.
From time to time, the FASB or the SEC may change the financial accounting and reporting standards that govern the preparation of Southern States’ financial statements. Such changes may result in Southern States being subject to new or changing accounting and reporting standards. In addition, the bodies that interpret the accounting standards (such as banking regulators or outside auditors) may change their interpretations or positions on how these standards should be applied. These changes may be beyond Southern States’ control, can be hard to predict, and can materially impact how Southern States records and reports its financial condition and results of operations. In some cases, Southern States could be required to apply a new or revised standard retrospectively, or apply an existing standard differently, also retrospectively, in each case resulting in its needing to revise or restate prior period financial statements.
Severe weather, natural disasters, pandemics, epidemics, acts of war or terrorism or other external events could have significant effects on our business.
Severe weather and natural disasters, including hurricanes, tornados, droughts and floods, epidemics and pandemics, acts of war or terrorism or other external events could have a significant effect on our ability to conduct business. Such events could affect the stability of our deposit base, impair the ability of borrowers to repay outstanding loans, impair the value of collateral securing loans, cause significant property damage, result in loss of revenue and/or cause us to incur additional expenses. Although management has established disaster recovery and business continuity policies and procedures, the occurrence of any such event could have a material adverse effect on our business, which, in turn, could have a material adverse effect on our financial condition and results of operations. The SEC and federal bank regulators have also recently updated their guidance for pandemics, which may cause us to change our operations and business continuity efforts.
The continuation of the COVID-19 pandemic, or other events that could affect the world economy, could have negative effects on our business.
The COVID-19 pandemic, trade wars, tariffs, supply chain disruptions and materials shortages, and similar events and disputes, domestic and international, have adversely affected, and may continue to adversely affect economic activity globally, nationally and locally, and the recovery from the COVID-19 pandemic. Such events
47
Table of Contents
also may adversely affect business and consumer confidence, generally. Travel, tourism, hospitality and retail may be especially adversely affected by COVID-19, which could adversely affect our approximately $147.5 million of hospitality and retail CRE loans outstanding as of March 31, 2021. We and our customers, and our respective suppliers, vendors and processors may be adversely affected. The recovery from the COVID-19 pandemic has been affected generally by supply chain disruptions and shortages of materials. Any such adverse changes may adversely affect our profitability, growth, asset quality and financial condition.
Southern States is or may become involved from time to time in suits, legal proceedings, information-gathering requests, investigations, and proceedings by governmental agencies and third parties that may lead to adverse consequences.
Many aspects of Southern States’ business involve substantial risk of legal liability. Southern States is subject to being threatened to be named as a defendant in lawsuits arising from its business activities. In addition, from time to time, Southern States is, or may become, the subject of governmental and self-regulatory agency information-gathering requests, reviews, investigations and proceedings, and other forms of regulatory inquiry, including by bank regulatory agencies, the SEC, and law enforcement authorities. The results of such proceedings could lead to significant civil or criminal penalties, including monetary penalties, damages, adverse judgments, settlements, fines, injunctions, restrictions on the way in which Southern States conducts its business, or reputational harm.
Changes in laws and government regulation may have a material effect on Southern States’ results of operations.
Financial institutions have been the subject of significant legislative and regulatory changes and may be the subject of further significant legislation or regulation in the future, none of which is within Southern States’ control. New proposals for legislation could be introduced in the U.S. Congress that could further substantially increase regulation of the bank and non-bank financial services industries, impose restrictions on the operations and general ability of firms within the industry to conduct business consistent with historical practices, including in the areas of compensation, interest rates, financial product offerings, and disclosures, and have an effect on bankruptcy proceedings with respect to consumer residential real estate mortgages, among other things. Federal and state regulatory agencies also frequently adopt changes to their regulations or change the manner in which existing regulations are applied. Changes to statutes, regulations, or regulatory policies, including changes in their interpretation or implementation by regulators, could affect Southern States in substantial and unpredictable ways. Such changes could, among other things, subject Southern States to additional costs and lower revenues, limit the types of financial services and products that Southern States may offer, ease restrictions on non-banks and thereby enhance their ability to offer competing financial services and products, increase compliance costs, and require a significant amount of management’s time and attention. Failure to comply with statutes, regulations, or policies could result in sanctions by regulatory agencies, civil monetary penalties, or reputational damage, each of which could have a material adverse effect on Southern States’ business, financial condition, and results of operations.
The Biden Administration may propose changes to bank regulation and corporate tax changes that could have an adverse effect on our business, results of operations and financial conditions. The 2017 Jobs Act reduced the federal corporate income tax rate from 35% to 21%. Among other possible changes to federal taxation, in April 2021, the Administration proposed increasing the federal corporate income tax rate to 28%, which, if adopted could adversely affect our net income.
Market interest rates declined significantly during 2020, and remain low in 2021, but economic stimulus in response to the COVID-19 pandemic and as well materials shortages may increase inflation and interest rates.
The Federal Reserve shifted to a more accommodating monetary policy in Summer 2019. During 2020, the Federal Reserve reduced its federal funds target to 0-0.25% and is maintaining such target rates and continuing
48
Table of Contents
significant monthly purchases of U.S. Treasury and agency mortgage-backed securities to help combat the economic effect of the COVID-19 pandemic. Since November 2020, interest rates have increased, possibly as a result of increased government borrowings to finance rounds of fiscal stimulus and increased inflation expectations resulting from such stimulus and expected increases in economic growth from fiscal and monetary stimulus and COVID-19 vaccinations. Our costs of funds may increase as a result of general economic conditions, increasing interest rates and competitive pressures, and potential inflation resulting from continued government deficit spending and monetary policies. Traditionally, we have obtained funds principally through local deposits and borrowings from other institutional lenders, which we believe are a cheaper and more stable source of funds than borrowings.
Our profitability and liquidity may be affected by changes in interest rates and interest rate levels, the shape of the yield curve and economic conditions.
Our profitability depends upon net interest income, which is the difference between interest earned on interest-earning assets, such as loans and investments, and interest expense on interest-bearing liabilities, such as deposits and borrowings. Net interest income will be adversely affected if market interest rates on the interest we pay on deposits and borrowings increases faster than the interest earned on loans and investments. Interest rates, and consequently our results of operations, are affected by general economic conditions (national, international and local) and fiscal and monetary policies, as well as expectations of these rates and policies and the shape of the yield curve. Our income is primarily driven by the spread between these rates. As a result, a steeper yield curve, meaning long-term interest rates are significantly higher than short-term interest rates, would provide the Bank with a better opportunity to increase net interest income. Conversely, a flattening yield curve could pressure our net interest margin as our cost of funds increases relative to the spread we can earn on our assets. In addition, net interest income could be affected by asymmetrical changes in the different interest rate indexes, given that not all of our assets or liabilities are priced with the same index. The 2019 and 2020 rate reductions by the Federal Reserve and the effects of the COVID-19 pandemic have reduced market rates, which adversely affected our net interest margins and limited the growth in our net income.
Increases in interest rates may cause consumers to shift their funds to more interest bearing instruments and to increase the competition for and costs of deposits. If customers move money out of bank deposits and into other investment assets or from transaction deposits to higher interest bearing time deposits, we could lose a relatively low cost source of funds, increasing our funding costs and reducing our net interest income. Increases in market interest rates may reduce demand for loans, including residential mortgage loans originations. At the same time, increases in rates will increase the rates we charge on variable rate loans and may increase our net interest margin. Higher interest rates would decrease the values of our existing fixed rate securities investments and could potentially adversely affect the values and liquidity of collateral securing our loans. The effects of increased rates and the related risks to us depend on the rates of changes in our costs of funds and interest earned on our loans and investments, the shape of the yield curve, and our ability to manage such changes.
Liquidity risks could affect operations and jeopardize our financial condition.
Liquidity is essential to our business. An inability to raise funds through deposits, borrowings, proceeds from loan repayments or sales proceeds from maturing loans and securities, and other sources could have a negative effect on our liquidity. Our funding sources include federal funds purchased, securities sold under repurchase agreements, core and non-core deposits, and short- and long-term debt. We maintain a portfolio of securities that can be used as a source of liquidity. We are also members of the FHLB and the Federal Reserve Bank of Atlanta, where we can obtain advances collateralized with eligible assets. There are other sources of liquidity available to the Company or the Bank should they be needed, including our ability to acquire additional non-core deposits. We may be able, depending upon market conditions, to otherwise borrow money or issue and sell debt and preferred or common securities in public or private transactions. Our access to funding sources in amounts adequate to finance or capitalize our activities on terms which are acceptable to us could be impaired by factors that affect us specifically, or the financial services industry or the economy in general. General conditions that are not specific to us, such as disruptions in the financial markets or negative views and expectations about the prospects for the financial services industry could adversely affect us.
49
Table of Contents
Many new activities and expansion plans require regulatory approvals, and failure to obtain them may restrict our growth.
As part of our growth strategy, we may expand our business by pursuing strategic acquisitions of financial institutions and other closely related businesses. Generally, we must receive regulatory approval before we can acquire a bank holding company, an FDIC-insured depository institution or related businesses. In determining whether to approve a proposed acquisition, banking regulators will consider, among other factors, the effect of the acquisition on competition, our financial condition, our future prospects and the impact of the proposal on U.S. financial stability. The regulators also review current and projected capital ratios, the competence, experience and integrity of management and its record of compliance with laws and regulations, the convenience and needs of the communities to be served (including the acquiring institution’s record of compliance under the Community Reinvestment Act (“CRA”)) and the effectiveness of the acquiring institution in combating money laundering activities. Generally, acquirors must be deemed “well managed” and “well capitalized.” The necessary regulatory approvals may not be granted on terms that are acceptable to us, or granted at all. In certain cases, where our resulting market shares raises competitive concerns, we may also be required to sell banking locations as a condition to receiving regulatory approval, which condition may not be acceptable to us or, if acceptable to us, may reduce the benefit of any acquisition.
In addition to the acquisition of existing financial institutions, as opportunities arise, we may continue de novo branching as a part of our expansion strategy. De novo branching carries with it numerous risks, including the inability to obtain all required regulatory approvals, which are dependent upon many of the same factors as acquisitions, including our capital management, anti-money laundering and CRA compliance. The failure to obtain these regulatory approvals for potential future strategic acquisitions and de novo banking locations could negatively affect our business plans and restrict our growth.
Southern States is subject to numerous laws designed to protect consumers, including the CRA and fair lending laws, and failure to comply with these laws could lead to a wide variety of sanctions.
The CRA, the Equal Credit Opportunity Act, the Fair Housing Act, and other fair lending laws and regulations impose nondiscriminatory lending requirements on financial institutions. The U.S. Department of Justice and other federal agencies are responsible for enforcing these laws and regulations. A successful regulatory challenge to an institution’s performance under the CRA or fair lending laws and regulations could result in a wide variety of sanctions, including damages and civil money penalties, injunctive relief, restrictions on mergers and acquisitions activity, restrictions on expansion, and limitations on entering new business lines. Private parties may also have the ability to challenge an institution’s performance under fair lending laws in private class action litigation. Such actions could have a material adverse effect on Southern States’ business, financial condition, results of operations, and future prospects.
Southern States is subject to the Bank Secrecy Act and other anti-money laundering statutes and regulations, and any deemed deficiency by Southern States with respect to these laws could result in significant liability.
The Bank Secrecy Act, the USA PATRIOT Act of 2001, and other laws and regulations require financial institutions, among other duties, to institute and maintain an effective anti-money laundering program and file suspicious activity and currency transaction reports when appropriate. In 2019, the “know your customer” rules were expanded to include inquiries regarding beneficial owners of entities. In addition to other bank regulatory agencies, the federal Financial Crimes Enforcement Network of the Department of the Treasury, or FinCEN, is authorized to impose significant civil money penalties for violations of those requirements and has recently engaged in coordinated enforcement efforts with the state and federal banking regulators, as well as the U.S. Department of Justice, Consumer Financial Protection Bureau, Drug Enforcement Administration, and Internal Revenue Service. Southern States is also subject to increased scrutiny of compliance with the rules enforced by the Office of Foreign Assets Control of the Department of the Treasury, or OFAC, regarding, among other things, the prohibition of transacting business with, and the need to freeze assets of, certain persons and organizations identified as a threat to the national security, foreign policy, or economy of the United States. If
50
Table of Contents
Southern States’ policies, procedures, and systems are deemed deficient, Southern States would be subject to liability, including fines and regulatory actions, which may include restrictions on Southern States’ ability to pay dividends and the necessity to obtain regulatory approvals to proceed with its acquisition and business plans. Failure to maintain and implement adequate programs to combat money laundering and terrorist financing could also have serious reputational consequences for Southern States. Any of these results could have a material adverse effect on Southern States’ business, financial condition, results of operations, and future prospects.
The obligations associated with being a public company will require significant resources and management attention.
As a public company, we will face increased legal, accounting, administrative and other costs and expenses that we have not incurred as a private company, particularly after we are no longer an emerging growth company. After the completion of this offering, we will be subject to the reporting requirements of the Exchange Act, and other rules and regulations implemented by the SEC, legislation passed by Congress, the PCAOB and NASDAQ, each of which imposes additional reporting and other obligations on public companies. As a public company, we will be required to, among other things:
| • | prepare and distribute periodic and current reports, proxy statements and other stockholder communications in compliance with the federal securities laws and rules; |
| • | expand the roles and duties of our board of directors and committees thereof; |
| • | institute more comprehensive financial reporting and disclosure compliance procedures; |
| • | establish new internal policies, including those relating to trading in our securities, and internal and disclosure controls and procedures; |
| • | involve and retain to a greater degree outside counsel and accountants in the activities listed above; |
| • | enhance our investor relations function; |
| • | retain additional personnel; and |
| • | comply with the listing standards of NASDAQ. |
We expect these rules and regulations and future changes in laws, regulations and standards relating to corporate governance and public disclosure, which have created uncertainty for public companies, will increase our legal and financial compliance costs and make some activities more time consuming and costly. These laws, regulations and standards are subject to varying interpretations, in many cases due to their lack of specificity, and, as a result, their application in practice may evolve over time as new guidance is provided by regulatory and governing bodies. This could result in continuing uncertainty regarding compliance matters and higher costs necessitated by ongoing revisions to disclosure and governance practices. Our investment in compliance with existing and evolving regulatory requirements will result in increased administrative expenses and a diversion of management’s time and attention from revenue-generating activities to compliance activities, which could have an adverse effect on our business, financial condition or results of operations. These increased costs could require us to expend time and money that we could otherwise use to expand our business and achieve our strategic objectives.
51
Table of Contents
CAUTIONARY NOTE REGARDING FORWARD-LOOKING STATEMENTS
This prospectus contains forward-looking statements within the meaning of the federal securities laws, which reflect our current expectations and beliefs with respect to, among other things, future events and our financial performance. These forward-looking statements are not historical facts, and are based on current expectations, estimates and projections about our industry, management’s beliefs and certain assumptions made by management, many of which, by their nature, are inherently uncertain and beyond our control. This may be especially true given the current COVID-19 pandemic and uncertainty about its continuation. Although we believe that the expectations reflected in such forward-looking statements are reasonable as of the dates made, we cannot give any assurance that such expectations will prove correct and actual results may prove to be materially different from the results expressed or implied by the forward-looking statements. Accordingly, we caution you that any such forward-looking statements are not guarantees of future performance and are subject to risks, assumptions and uncertainties that are difficult to predict.
These statements are often, but not always, made through the use of words or phrases such as “may,” “can,” “should,” “could,” “to be,” “predict,” “potential,” “believe,” “will likely result,” “expect,” “continue,” “will,” “likely,” “anticipate,” “seek,” “strive,” “estimate,” “intend,” “plan,” “target,” “project,” “would” and “outlook,” or the negative version of those words or other similar words or phrases of a future or forward-looking nature. Forward-looking statements appear in a number of places in this prospectus and may include statements about business strategy and prospects for growth, operations, ability to pay dividends, competition, regulation and general economic conditions.
There are or will be important factors that could cause our actual results to differ materially from those indicated in these forward-looking statements, including, but not limited to, the following:
| • | potential risks and uncertainties relating to the effects of COVID-19, including the duration of the COVID-19 outbreak, actions that have been and will be taken by governmental authorities to contain the COVID-19 outbreak or to treat its impact, and the potential negative impacts of COVID-19 on the global economy and financial markets, including U.S. GDP decreases and increases in unemployment; |
| • | our ability to execute and prudently manage our growth and execute our strategy, including expansion activities; |
| • | our ability to adequately measure and limit our credit risk; |
| • | business, market and economic conditions generally and in the financial services industry, nationally and within our local markets; |
| • | factors that can impact the performance of our loan portfolio, including real estate values and liquidity in our markets and the financial health of our commercial borrowers; |
| • | the failure of assumptions and estimates, as well as differences in, and changes to, economic, market, and credit conditions, including changes in borrowers’ credit risks and payment behaviors; |
| • | compliance with governmental and regulatory requirements, including the Dodd-Frank Act and others relating to banking, consumer protection, securities and tax matters, and our ability to maintain licenses required in connection with mortgage origination, sale and servicing operations; |
| • | compliance with the Bank Secrecy Act, OFAC rules and anti-money laundering laws and regulations; |
| • | governmental monetary and fiscal policies; |
| • | the effectiveness of our risk management framework, including internal controls; |
| • | the composition of and changes in our management team and our ability to attract and retain key personnel; |
52
Table of Contents
| • | geographic concentration of our business in certain Alabama and Georgia markets; |
| • | our ability to attract and retain customers; |
| • | the risks of changes in interest rates on the levels, composition and costs of deposits, loan demand, and the values and liquidity of loan collateral, securities, and interest-sensitive assets and liabilities, and the risks and uncertainty of the amounts realizable; |
| • | changes in the availability and cost of credit and capital in the financial markets, and the types of instruments that may be included as capital for regulatory purposes; |
| • | changes in the prices, values and sales volumes of residential and commercial real estate; |
| • | the effects of competition from a wide variety of local, regional, national and other providers of financial, investment, trust and other wealth management services and insurance services, including the disruption effects of financial technology and other competitors who are not subject to the same regulations as the Company and the Bank; |
| • | the failure of assumptions and estimates underlying the establishment of allowances for possible loan losses and other asset impairments, losses, valuations of assets and liabilities and other estimates; |
| • | the risks of mergers, acquisitions and divestitures, including, without limitation, the related time and costs of implementing such transactions, integrating operations as part of these transactions and possible failures to achieve expected gains, revenue growth and/or expense savings from such transactions; |
| • | changes in technology or products that may be more difficult, costly, or less effective than anticipated; |
| • | systems failures or interruptions involving our risk management framework, our information technology and telecommunications systems or third-party servicers; |
| • | unauthorized data access, cyber-crime and other threats to data security and customer privacy; |
| • | our ability to maintain our historical rate of growth; |
| • | our ability to identify potential candidates for, consummate, and achieve synergies resulting from, potential future acquisitions; |
| • | deterioration of our asset quality or the value of collateral securing loans; |
| • | changes in the laws, rules, regulations, interpretations or policies relating to financial institutions, accounting, tax, trade, monetary and fiscal matters and appropriate compliance with applicable law and regulation; |
| • | operational risks associated with our business; |
| • | volatility and direction of market interest rates and the shape of the yield curve; |
| • | our ability to maintain important deposit customer relationships, maintain our reputation or otherwise avoid liquidity risks; |
| • | the obligations associated with being a public company; |
| • | the commencement and outcome of litigation and other legal proceedings against us or to which we may become subject; |
| • | natural disasters and adverse weather, acts of terrorism, an outbreak of hostilities or other international or domestic calamities as well as national and international economic conditions and health issues, such as COVID-19, and other matters beyond our control; and |
| • | other factors that are discussed in the sections titled “Risk Factors” and “Management’s Discussion and Analysis of Financial Condition and Results of Operations.” |
53
Table of Contents
The foregoing factors should not be construed as exhaustive and should be read together with the other cautionary statements and the “Risk Factors” included in this prospectus. If one or more events related to these or other risks or uncertainties materialize, or if our underlying assumptions prove to be incorrect, actual results may differ materially from what we anticipate. Accordingly, you should not place undue reliance on any such forward-looking statements. Any forward-looking statement speaks only as of the date it is made, and we do not undertake any obligation to publicly update or review any forward-looking statement, whether as a result of new information, future developments or otherwise. New factors emerge from time to time, and it is not possible for us to predict which will arise. In addition, we cannot assess the impact of each factor on our business or the extent to which any factor, or combination of factors, may cause actual results to differ materially from those contained in any forward-looking statements.
54
Table of Contents
Assuming an initial public offering price of $20.00 per share, which is the midpoint of the offering price range set forth on the cover page of this prospectus, we estimate that the net proceeds to us from the sale of our common stock by us in this offering will be approximately $16.7 million (or approximately $22.3 million if the underwriters elect to exercise in full their option to purchase additional shares of common stock), after deducting the estimated underwriting discounts, commissions and offering expenses. We will not receive any of the proceeds from the sale of our common stock in this offering by the selling stockholders.
Each $1.00 increase (decrease) in the assumed initial public offering price would increase (decrease) the net proceeds to us from this offering by $1.0 million (or approximately $1.3 million if the underwriters elect to exercise in full their option to purchase additional shares), assuming the number of shares we sell, as set forth on the cover of this prospectus, remains the same, after deducting the estimated underwriting discounts, commissions and offering expenses.
We intend to use the net proceeds from this offering for general corporate purposes, which may include capital and liquidity to support our growth, and potential acquisition of other banks or closely related businesses. Although we have had preliminary discussions with one or more banks, we do not have any current plans or agreements, with respect to any acquisitions at this time. Our management team will have broad discretion over how these proceeds are used.
55
Table of Contents
Our stockholders are entitled to receive dividends on common stock only if, when and as declared by our board of directors from funds legally available therefor under Alabama corporate law and as limited by our banking regulators. From 2012 until the first quarter of 2020, when we moved to quarterly dividends, we paid regular annual cash dividends on our common stock. We declared and paid dividends of $0.08 per share following the quarters ended March 31, 2020, June 30, 2020 and September 31, 2020 and a dividend of $0.09 per share following the quarters ended December 31, 2020 and March 31, 2021. On July 21, 2021, we declared a dividend of $0.09 per share, payable on August 11, 2021 to holders of record as of July 29, 2021. Purchasers of common stock in this offering will not receive the dividend. However, any future determination relating to dividends will be made at the discretion of our board of directors and will depend on our financial condition, liquidity and results of operations; our capital levels and needs; acquisitions; contractual, statutory and regulatory prohibitions and other limitations; general economic conditions; and other factors deemed relevant by our board of directors. Therefore, there can be no assurance that in the future we will pay any dividends to holders of our common stock, or as to the amount of any future dividends.
Dividend Restrictions
Southern States is a legal entity separate and distinct from Southern States Bank. Southern States’ principal source of cash, including cash to pay dividends to its stockholders, are dividends that Southern States receives from the Bank. Statutory and regulatory limitations apply to Southern States Bank’s payment of dividends to us as well as to our payment of dividends to our stockholders. A bank holding company is required to serve as a source of strength to its subsidiary banks. Generally, under Federal Reserve policy, a bank holding company should not pay cash dividends from current year’s operating earnings and the prospective rate of earnings retention appears to be consistent with the corporation’s risks, capital needs and retention, asset quality and overall financial condition. See “Supervision and Regulation.”
The Alabama State Banking Department also regulates Southern States Bank’s dividend payments. A bank is required by Alabama law to obtain the prior approval of the Alabama Superintendent of Banks for its payment of dividends, if the total of all dividends declared by a bank in any calendar year will exceed the total of (1) the bank’s net earnings (as defined by statute) for that year, plus (2) its retained net earnings for the preceding two years, less any required transfers to surplus. In addition, no dividends, withdrawals or transfers may be made from the bank’s surplus without the prior written approval of the Superintendent.
Southern States and Southern States Bank’s payment of dividends may also be affected or limited by other factors, such as the requirement to maintain adequate capital above regulatory guidelines. Bank regulatory agencies have the authority to prohibit bank holding companies and banks from engaging in unsafe or unsound practices in conducting their business. The payment of dividends, depending on the financial condition of a bank holding company and of its subsidiary bank, could under certain circumstances be deemed an unsafe or unsound practice, and therefore restricted. See “Supervision and Regulation.”
Under the FDIC’s regulations, an FDIC-insured depository institution may not make any capital distributions (including the payment of dividends) or pay any management fees to its holding company if it is undercapitalized or if such payment would cause it to become undercapitalized. See “Supervision and Regulation.”
56
Table of Contents
The following table shows our capitalization, including regulatory capital ratios, on a consolidated basis, as of March 31, 2021:
| • | on an actual basis; and |
| • | on an adjusted basis, after giving effect to the net proceeds from the sale by us of shares of our common stock in this offering (assuming the underwriters do not exercise their option to purchase additional shares) at an assumed initial public offering price of $20.00 per share, which is the midpoint of the price range on the cover of this prospectus, after deducting estimated underwriting discounts, commissions and offering expenses. |
The capitalization information below is for illustrative purposes only, and our capitalization following the completion of this offering will be adjusted based on the actual initial public offering price and other terms of our initial public offering determined at pricing. You should read the following table in conjunction with the sections titled “Summary—Selected Historical Consolidated Financial Data and Other Information,” “Use of Proceeds,” “Management’s Discussion and Analysis of Financial Condition and Results of Operations,” and our consolidated financial statements and related notes appearing elsewhere in this prospectus.
| As of March 31, 2021 | ||||||||
| Actual | As Adjusted | |||||||
| (Dollars in thousands) | ||||||||
| Cash and cash equivalents(1): |
$ | 170,728 | $ | 187,462 | ||||
|
|
|
|
|
|||||
| Debt: |
||||||||
| Line of Credit(2) |
7,983 | 7,983 | ||||||
| Federal Home Loan Bank advances(2) |
31,900 | 31,900 | ||||||
| Subordinated Notes(2) |
4,497 | 4,497 | ||||||
|
|
|
|
|
|||||
| Stockholders’ equity: |
||||||||
| Preferred Stock, 1,000,000 shares authorized; 0 shares issued and outstanding |
— | — | ||||||
| Common Stock ($5.00 par value), 30,000,000 shares authorized; 7,716,428 shares issued and outstanding (actual); and 30,000,000 shares authorized; 8,712,857 shares issued and outstanding (as adjusted) |
38,582 | 43,564 | ||||||
| Capital surplus |
65,885 | 77,636 | ||||||
| Retained earnings |
39,174 | 39,174 | ||||||
| Accumulated other comprehensive income |
1,808 | 1,808 | ||||||
| Unvested restricted stock |
(849 | ) | (849 | ) | ||||
|
|
|
|
|
|||||
| Total stockholders’ equity |
$ | 144,600 | $ | 161,334 | ||||
|
|
|
|
|
|||||
| Total capitalization |
$ | 188,980 | $ | 205,174 | ||||
|
|
|
|
|
|||||
| Capital ratios: |
||||||||
| Common equity tier 1 capital ratio |
10.19 | % | 11.57 | % | ||||
| Tier 1 leverage ratio |
9.21 | % | 10.45 | % | ||||
| Tier 1 risk-based ratio |
10.19 | % | 11.57 | % | ||||
| Total risk-based capital ratio |
11.60 | % | 12.97 | % | ||||
| Per Share Data: |
||||||||
| Book value per share |
$ | 18.74 | $ | 18.52 | ||||
| Tangible book value per share(3) |
$ | 16.34 | $ | 16.39 | ||||
| (1) | A $1.00 increase (decrease) in the assumed initial public offering price of $20.00 per share (the midpoint of the price range on the cover of this prospectus) would increase (decrease) the as adjusted amount of our cash |
57
Table of Contents
| and cash equivalents, additional paid-in-capital, total stockholders’ equity and total capitalization by $926,000, assuming that the number of shares offered by us, as set forth on the cover page of this prospectus, remains the same, and after deducting the estimated underwriting discounts, commissions and offering expenses. If the underwriters’ option to purchase additional shares is exercised in full, the as adjusted amount of cash and cash equivalents, additional paid-in-capital, total stockholders’ equity and total capitalization would increase by approximately $5.6 million, after deducting estimated underwriting discounts, commissions and offering expenses, and we would have shares of our common stock issued and outstanding, as adjusted. |
| (2) | On June 23, 2021, we redeemed all of the Subordinated Notes by borrowing approximately $4.5 million under the Line of Credit. |
| (3) | Tangible book value per share is a non-GAAP financial measure. Please see “Non-GAAP Financial Measures” for a definition of tangible book value per share and a reconciliation to its most directly comparable financial measure presented in accordance with GAAP. |
58
Table of Contents
If you invest in our common stock, your ownership interest will be diluted to the extent that the initial public offering price per share of our common stock exceeds the as adjusted tangible book value per share of our common stock immediately following this offering. Tangible book value per share is equal to our tangible common equity divided by the number of shares of common stock outstanding as of such date. Tangible common equity equals our total stockholders’ equity less goodwill and core deposit intangibles. Tangible common equity and tangible book value per share are non-GAAP financial measures. The most directly comparable GAAP financial measure to tangible common equity is total stockholders’ equity, and the most directly comparable GAAP financial measure to tangible book value per share is book value per share. See our reconciliation of these non-GAAP financial measures to their most directly comparable GAAP financial measures under the caption “Non-GAAP Financial Measures.”
Our tangible common equity at March 31, 2021 was $126.0 million, or a tangible book value per share of $16.34, based on the number of shares outstanding as of such date. After giving effect to the net proceeds from the sale by us of shares of our common stock in this offering (assuming the underwriters do not exercise their option to purchase additional shares) at an assumed initial public offering price of $20.00 per share (the midpoint of the price range on the cover of this prospectus), and after deducting estimated underwriting discounts, commissions and offering expenses, our as adjusted tangible common equity as of March 31, 2021 would have been approximately $142.8 million, or a tangible book value per share of $16.39. Therefore, this offering will result in an immediate increase of $0.05 in the tangible book value per share to existing stockholders and an immediate dilution of $3.61 in the tangible book value per share to investors purchasing shares in this offering, or approximately 18.1% of the assumed initial public offering price of $20.00 per share (the midpoint of the price range on the cover of this prospectus). Sales of shares by the selling stockholders will have no effect on our book value per share or our tangible book value per share.
The following table illustrates the calculation of the amount of dilution per share as of March 31, 2021 that a purchaser of our common stock in this offering will incur given the assumptions above:
| Assumed initial public offering price per share |
$ | 20.00 | ||||||
| Tangible book value per share, as of March 31, 2021 |
$ | 16.34 | ||||||
| Increase in tangible book value per share attributable to this offering |
$ | 0.05 | ||||||
|
|
|
|||||||
| As adjusted tangible book value per share after this offering |
$ | 16.39 | ||||||
|
|
|
|||||||
| Dilution in tangible book value per share to new investors |
$ | 3.61 | ||||||
|
|
|
A $1.00 increase (decrease) in the assumed initial public offering price of $20.00 per share (the midpoint of the price range on the cover of this prospectus) would increase (decrease) our as adjusted tangible book value per share after this offering by $0.10 per share, assuming that the number of shares offered by us, as set forth on the cover page of this prospectus, remains the same, and after deducting estimated underwriting discounts, commissions and offering expenses payable by us. If the underwriters’ option to purchase additional shares is exercised in full, the as adjusted tangible book value per share after giving effect to this offering would be approximately $16.46 per share, and the dilution in as adjusted tangible book value per share to investors in this offering would be approximately $3.54 per share.
The following table summarizes the total consideration paid to us and the average price paid per share by existing stockholders and investors purchasing common stock in this offering. To the extent that any of our officers or directors or any promoters, or any persons affiliated with any of the foregoing, participated in an offering of our common stock, these individuals paid the same price as all other participants in the same offering. This information is presented on an as adjusted basis as of March 31, 2021, after giving effect to our sale
59
Table of Contents
of 996,429 shares of our common stock in this offering (assuming the underwriters do not exercise their option to purchase additional shares) at an assumed initial public offering price of $20.00 per share (the midpoint of the price range on the cover of this prospectus).
| Shares Purchased/Issued | Total Consideration | Average Price Per Share |
||||||||||||||||||
| Number | Percent | Amount | Percent | |||||||||||||||||
| (Dollars in thousands, except per share data) | ||||||||||||||||||||
| Stockholders as of March 31, 2021 |
7,716,428 | 88.6 | % | $ | 103,618 | 83.9 | % | $ | 13.43 | |||||||||||
| New investors in this offering |
996,429 | 11.4 | % | $ | 19,929 | 16.1 | % | $ | 20.00 | |||||||||||
|
|
|
|
|
|
|
|
|
|
|
|||||||||||
| Total |
8,712,857 | 100.0 | % | $ | 123,547 | 100.0 | % | $ | 14.18 | |||||||||||
|
|
|
|
|
|
|
|
|
|
|
|||||||||||
Sales of an estimated 1,003,571 shares of common stock by the selling stockholders in this offering will cause the number of shares held by existing stockholders to be reduced to 6,712,857 shares, or 77.0% of the total number of shares of our common stock outstanding following the completion of this offering, and will increase the number of shares held by new investors by 1,003,571 shares, or 23.0% of the total number of shares outstanding following the completion of this offering.
After giving effect to the sale of shares in this offering by the selling stockholders and us, if the underwriters’ option to purchase additional shares is exercised in full, our existing stockholders would own approximately 74.5% and our new investors would own approximately 25.5% of the total number of shares of our common stock outstanding after this offering.
60
Table of Contents
MANAGEMENT’S DISCUSSION AND ANALYSIS OF FINANCIAL CONDITION AND
RESULTS OF OPERATIONS
The following discussion and analysis of our financial condition and results of operations should be read in conjunction with “Summary—Selected Historical Consolidated Financial Data and Other Information” and our consolidated financial statements and the related notes appearing elsewhere in this prospectus. This discussion and analysis contains forward-looking statements that are subject to certain risks and uncertainties and are based on certain assumptions that we believe are reasonable but may not be realized. Certain risks, uncertainties and other factors, including those set forth under “Risk Factors,” “Cautionary Note Regarding Forward-Looking Statements” and elsewhere in this prospectus, may cause actual results to differ materially from those projected results discussed in the forward-looking statements appearing in this discussion and analysis. We assume no obligation to update any of these forward-looking statements.
Overview
Southern States is a bank holding company headquartered in Anniston, Alabama. We operate primarily through our wholly-owned subsidiary, the Bank, an Alabama banking corporation. We provide banking services from 15 offices in Alabama and Georgia. The Bank is a full service community banking institution, which offers an array of deposit, loan and other banking-related products and services to businesses and individuals in our communities. Our principal business activities include commercial and retail banking.
On September 13, 2019, we acquired East Alabama and its wholly owned subsidiary, Small Town Bank, in Wedowee, Alabama, with total assets of approximately $233.2 million at the closing of the acquisition. The consideration for the acquisition was a mix of cash and stock, with the stock issued pursuant to exemptions from registration under the federal securities rules. The acquisition was fully integrated at the time of closing. The year ended December 31, 2020 includes a full year of operations following such acquisition.
Our management’s discussion and analysis of financial condition and results of operations is intended to provide the reader with information that will assist in the understanding of our business, results of operations, financial condition and financial statements; changes in certain key items in our financial statements from period to period; and the primary factors that we use to evaluate our business.
Update Regarding COVID-19 and Current Developments
We carefully and successfully managed through the COVID-19 pandemic. During the pandemic, we took the appropriate steps to protect both customers and employees while continuing to provide full service banking and growing assets by 15.6% not considering PPP loans. This included closing branches to walk-in business when appropriate and utilizing all drive through facilities and allowing for appointment based banking. We increased cash levels in ATMs and communicated with customers regarding remote options for banking services. New technology was implemented to allow employees to work from home in addition to allowing for external parties such as auditors and examiners to continue to conduct necessary reviews and examinations.
We participated as a lender in the PPP as established by the CARES Act. Loans totaling $71.7 million were made to approximately 400 existing customers. We proactively worked with customers to assist them in navigating through the pandemic. We granted deferrals on 396 loans totaling $280.1 million, or approximately 28.0% of our loan portfolio. As of December 31, 2020, there were eight loans on deferral for a total of $8.0 million, or 0.78% of total loans. We know of no significant customer issues resulting from the pandemic.
We participated in the second round of PPP loans through when the SBA stopped taking applications on May 31, 2021. As of March 31, 2021, the second round of PPP loans totaled $26.2 million.
As of March 31, 2021, there was one loan remaining on deferral totaling $3.1 million, or 0.01% of total loans. We continue to actively monitor and consider COVID implications in our operations, lending, and customer needs.
61
Table of Contents
Three Months ended March 31, 2021 Highlights
Highlights of our financial condition and results of operations as of and for the three months ended March 31, 2021 and other key events that occurred during 2021 are provided below.
Financial Condition
| • | Total assets grew $126.7 million, or 9.5%, to $1.5 billion as of March 31, 2021, from $1.3 billion as of December 31, 2020. |
| • | Gross loans, net of unearned income, increased $53.2 million, or 5.2%, to $1.1 billion at March 31, 2021, from $1.0 billion at December 31, 2020. This was substantially the result of organic growth net of a reduction in PPP loans of $5.7 million and the sale of a $20.6 million USDA loan. |
| • | As of March 31, 2021, we exceeded the minimum requirements to be well-capitalized for bank regulatory purposes, with a total risk-based capital ratio of 11.60%, a tier 1 risk-based capital ratio of 10.19%, a common equity tier 1 capital ratio of 10.19%, and a tier 1 leverage ratio of 9.21%. |
| • | Total deposits grew $120.4 million, or 10.6%, to $1.3 billion at March 31, 2021 from $1.1 billion at December 31, 2020. Included in this growth was a $74.2 million increase in non-interest bearing deposits to $365.1 million at March 31, 2021, from $290.9 million at December 31, 2020. |
| • | Asset quality improved with nonperforming assets to total assets of 0.97% as of March 31, 2021, down from 1.03% as of December 31, 2020. The allowance for loan losses to total loans remained flat at 1.23% (excluding PPP loans) for the periods ending March 31, 2021 and December 31, 2020. |
| • | Book value per share increased $0.42, or 2.3%, to $18.74 at March 31, 2021 from $18.32 at December 31, 2020. Tangible book value per share increased $0.45, or 2.8%, to $16.34 at March 31, 2021 from $15.89 at December 31, 2020. |
Results of Operations
| • | We had net income of $5.7 million for the three months ended March 31, 2021, compared to net income of $2.7 million for the three months ended March 31, 2020, an increase of $3.0 million, or 112.4%. The increased net income was substantially the result of a $2.8 million gain on the sale of a USDA loan and fees generated from a new customer loan swap program. This increase was offset by a loss on the sale of securities of $232,000 for the three months ended March 31, 2021, compared to a $738,000 gain for the three months ended March 31, 2020. Core net income was $3.8 million for the three months ended March 31, 2021, an increase of $1.4 million, or 55.5%, above the $2.4 million core net income for the three months ended March 31, 2020. Core net income is a non-GAAP financial measure. Please see “Non-GAAP Financial Measures” for a definition of core net income and a reconciliation of core net income to its most directly comparable GAAP financial measure. |
| • | Net interest income was $12.3 million for the three months ended March 31, 2021, which increased $2.5 million, or 25.5%, compared to $9.8 million for the three months ended March 31, 2020. The increase was primarily attributable to loan growth plus a slight increase in net interest margin. |
| • | Noninterest income for the three months ended March 31, 2021, was $4.5 million compared to $2.4 million for the three months ended March 31, 2020, an increase of $2.1 million, or 87.5%. The increase was primarily the result of a $2.8 million gain on sale of a USDA loan and fees from a new customer interest rate swap program launched in mid-2020. This increase was offset by a loss on the sale of securities of $232,000 for the three months ended March 31, 2021, compared to a $738,000 gain for the three months ended March 31, 2020. |
| • | Noninterest expense for the three months ended March 31, 2021 was $8.5 million compared to $7.9 million for the three months ended March 31, 2020, an increase of $647,000, or 8.2%. The |
62
Table of Contents
| increase was primarily the result of increased salaries and benefits based on additional employees in both production and support. Professional services increased primarily due to $182,000 for PPP loan assistance and $90,000 for support associated with the customer loan interest rate swap program. Other expenses increased primarily due to increased FDIC insurance and charitable contributions. These increases are offset somewhat by other real estate (income) expenses decreases of $488,000, or 122.6%, to a net income of $90,000 due to rental income on foreclosed properties in first quarter 2021 compared to an expense primarily from write-downs in first quarter 2020. |
2020 Highlights
Highlights of our financial condition and results of operations as of and for the year ended December 31, 2020 and other key events that occurred during 2020 are provided below.
Financial Condition
| • | Total assets grew $237.0 million, or 21.6%, to $1.3 billion as of December 31, 2020, from $1.1 billion as of December 31, 2019. |
| • | Gross loans, net of unearned income, increased $192.7 million, or 23.0%, to $1.0 billion at December 31, 2020, from $837.4 million at December 31, 2019. This was substantially the result of organic growth of 11.5% and to a lesser extent $66.6 million of PPP loans outstanding at December 31, 2020. |
| • | As of December 31, 2020, we exceeded the minimum requirements to be well-capitalized for bank regulatory purposes, with a total risk-based capital ratio of 12.09%, a tier 1 risk-based capital ratio of 10.63%, a common equity tier 1 capital ratio of 10.63%, and a tier 1 leverage ratio of 9.24%. |
| • | Total deposits grew $189.1 million, or 19.9%, to $1.1 billion from $950.5 million at December 31, 2019. Included in this growth was a $102.6 million increase in non-interest bearing deposits to $290.9 million at December 31, 2020, from $188.3 million at December 31, 2019. |
| • | Asset quality improved with nonperforming assets to total assets of 1.03% as of December 31, 2020 from 1.90% as of December 31, 2019. The allowance for loan losses to total loans increased to 1.23% (excluding PPP loans) at December 31, 2020 from 1.11% at December 31, 2019. |
| • | Book value increased $1.77, or 10.7%, to $18.32 at December 31, 2020 from $16.55 at December 31, 2019. Tangible book value increased $1.81, or 12.9%, to $15.89 at December 31, 2020 from $14.08 at December 31, 2019. |
Results of Operations
| • | We had net income of $12.1 million for the year ended December 31, 2020, compared to net income of $5.6 million for the year ended December 31, 2019, an increase of $6.5 million, or 116.1%. The increased net income was substantially the result of loan growth and fees generated from a new customer loan swap program and a full year of Small Town Bank. The earnings in 2019 were at a reduced level related to acquisition expenses of $3.4 million incurred with the acquisition of Small Town Bank. Core net income was $11.7 million for the year ended December 31, 2020, an increase of $4.4 million, or 61.2% above the $7.3 million core net income for the year ended December 31, 2019. Core net income is a non-GAAP financial measure. Please see “Non-GAAP Financial Measures” for a definition of core net income and a reconciliation of core net income to its most directly comparable GAAP financial measure. |
| • | Net interest income was $41.6 million for the year ended December 31, 2020, which increased $6.8 million, or 19.3%, compared to $34.8 million for the year ended December 31, 2019. The increase was primarily attributable to loan growth somewhat offset with slight compression in net interest margin. |
63
Table of Contents
| • | Noninterest income for the year ended December 31, 2020, was $8.5 million compared to $6.7 million for the year ended December 31, 2019, an increase of $1.8 million, or 27.3%. The increase was primarily the result of fees from a new customer interest rate swap program launched in 2020. To a lesser extent it is the result of $742,000 gain on sale of securities, receipt of $615,000 BOLI benefit and other general increases in operations. This increase was partially offset by $2.0 million received in 2019 from the dissolution of the Alabama Loan Guarantee Program that the Bank participated in. |
| • | Noninterest expense for the year ended December 31, 2020 was $32.2 million compared to $24.4 million for the year ended December 31, 2019, an increase of $7.8 million, or 32.0%. The increase was primarily related to a full year of operations with Small Town Bank and the write-down of repossessed equipment totaling $920,000. IT expenses increased for an upgrade in deposit platform and ongoing project to upgrade the lending platform. Professional fees increased $195,000 for PPP loan assistance and $226,000 for support associated with customer loan swap program. Professional fees were also inflated from the initial implementation of FDICA internal controls documentation and testing, as the Bank exceeded $1.0 billion in assets as of December 31, 2020. |
Primary Factors Used to Evaluate Our Business
Results of Operations
The most significant factors we use to evaluate our business and results of operation are net income, return on average assets and return on average equity. We also use net interest income, noninterest income and noninterest expense.
Net Interest Income
Net interest income is our principal source of net income and represents the difference between interest income and interest expense. We generate interest income from interest-earning assets that we own, including loans and investment securities. We incur interest expense from interest-bearing liabilities, including interest-bearing deposits and other borrowings, notably FHLB advances, the Company Line of Credit and our Subordinated Notes that were redeemed in June 2021. To evaluate net interest income, we measure and monitor: (i) yields on our loans and other interest-earning assets; (ii) the costs of our deposits and other funding sources; (iii) our net interest spread; and (iv) our net interest margin. Net interest spread is the difference between rates earned on interest-earning assets and rates paid on interest-bearing liabilities. Net interest margin is a ratio of net interest income to average interest earning assets for the same period.
Changes in the market interest rates and interest rates we earn on interest-earning assets or pay on interest-bearing liabilities, as well as the volume and types of interest-earning assets, interest-bearing and noninterest-bearing liabilities, are usually the largest drivers of periodic changes in net interest spread, net interest margin and net interest income.
Noninterest Income
Noninterest income primarily consists of: (i) service charges on deposit accounts; (ii) swap fees; (iii) SBA fees; (iv) mortgage banking income; (v) bank card services and interchange fees; (vi) benefits from changes in cash surrender value of BOLI; and (vii) other miscellaneous fees and income.
Our income from service charges on deposit accounts, which includes nonsufficient funds fees, is impacted by several factors, including number of accounts, products utilized and account holder cash management behaviors. These are further impacted by deposit products utilized by customers, marketing of new products and other factors. The income recognized on SBA and USDA loans, mortgage banking and interest rate swaps are impacted by prevailing market conditions and volumes of loans originated. Income on BOLI, which is non-taxable, reflects changes in the cash surrender value of our BOLI policies, which is the amount that the Bank may realize under these insurance policies. Our other miscellaneous income can include items such as other service fees, and other nonrecurring items. All of these can vary based on activity and other factors.
64
Table of Contents
Noninterest Expense
Noninterest expense primarily consists of: (i) salaries and employee benefits; (ii) equipment and occupancy expenses; (iii) professional and other service fees; (iv) data processing and telecommunication expenses; (v) FDIC deposit insurance; and regulatory assessments; and (vi) other operating expenses.
Salaries and employee benefits include compensation, employee benefits and employer tax expenses for our personnel. Equipment and occupancy expenses include depreciation, lease expense, and property maintenance related items. Professional and other service fees includes legal, accounting, consulting, SBA third party loan administration expenses management, and third party internal audits and reviews. Data processing and telecommunications includes expenses paid to our primary third-party data processor and other ancillary providers. It also includes telecommunication and data services.
Primary Factors Used to Evaluate Our Financial Condition
The most significant factors we use to evaluate and manage our financial condition include asset quality, capital and liquidity.
Asset Quality
We monitor the quality of our assets based upon factors including level and severity of deterioration in borrower cash flows and asset quality. Problem assets are assessed and reported as delinquent, classified, nonperforming, nonaccrual or troubled debt restructurings. We also monitor credit concentrations. We manage the allowance for loan losses to reflect loan volumes, identified credit and collateral conditions, economic conditions and other qualitative factors.
Capital
We monitor capital using regulatory capital ratios. Factors used other than regulatory rules include overall financial condition, including the trend and volume of problem assets, reserves, risks, level and quality of earnings, and anticipated growth, including acquisitions.
Liquidity
Deposits primarily consist of commercial and personal accounts maintained by businesses and individuals in our primary market areas. We also utilize brokered deposits, Qwickrate certificates of deposits and reciprocal deposits through a third-party network that effectively allows depositors to receive insurance on amounts greater than the FDIC insurance limit, which is currently $250,000. We manage liquidity based on factors that include the amount of core deposits to total deposits, level of non-customer deposits, short-term funding needs and sources, and the availability of unused funding sources. As of March 31, 2021, approximately $63.6 million was available for borrowing on committed lines with the FHLB and $87.2 million was available for purchases of federal funds from correspondents on an overnight uncommitted basis.
65
Table of Contents
Results of Operations for the Three Months Ended March 31, 2021 and 2020
The following table shows the average outstanding balance of each principal category of our assets, liabilities and stockholders’ equity, together with the average yields on our assets and average costs of our liabilities for the periods indicated. Yields and costs are calculated by dividing the annualized income or expense by the average daily balances of the corresponding assets or liabilities for the same period.
| Three Months Ended March 31, 2021 | Three Months Ended March 31, 2020 | |||||||||||||||||||||||
| Average Balance |
Interest | Yield/Rate | Average Balance |
Interest | Yield/Rate | |||||||||||||||||||
| (Dollars in thousands) | ||||||||||||||||||||||||
| Assets: |
||||||||||||||||||||||||
| Interest-earnings assets: |
||||||||||||||||||||||||
| Gross loans, net of unearned income (1) |
$ | 1,066,556 | $ | 13,021 | 4.95 | % | $ | 860,369 | $ | 11,787 | 5.51 | % | ||||||||||||
| Investment securities |
111,609 | 608 | 2.21 | % | 58,525 | 367 | 2.52 | % | ||||||||||||||||
| Other interest-earning assets |
78,154 | 48 | 0.25 | % | 103,451 | 355 | 1.38 | % | ||||||||||||||||
|
|
|
|
|
|
|
|
|
|
|
|
|
|||||||||||||
| Total interest-earning assets |
$ | 1,256,319 | $ | 13,677 | 4.42 | % | $ | 1,022,345 | $ | 12,509 | 4.92 | % | ||||||||||||
| Allowance for loan losses |
(12,138 | ) | — | — | (9,432 | ) | — | — | ||||||||||||||||
| Noninterest-earning assets |
123,938 | — | — | 104,647 | — | — | ||||||||||||||||||
|
|
|
|
|
|
|
|
|
|
|
|
|
|||||||||||||
| Total Assets: |
$ | 1,368,119 | $ | 1,117,560 | ||||||||||||||||||||
|
|
|
|
|
|
|
|
|
|
|
|
|
|||||||||||||
| Liabilities and Stockholders’ Equity: |
||||||||||||||||||||||||
| Interest-bearing liabilities: |
||||||||||||||||||||||||
| NOW, savings and MMDA deposits |
$ | 529,381 | $ | 695 | 0.53 | % | $ | 409,816 | $ | 925 | 0.91 | % | ||||||||||||
| Time deposits |
324,668 | 495 | 0.62 | % | 353,866 | 1,609 | 1.83 | % | ||||||||||||||||
| FHLB Advances |
33,244 | 51 | 0.62 | % | 3,920 | 12 | 1.25 | % | ||||||||||||||||
| Other Borrowings |
12,755 | 152 | 4.82 | % | 12,468 | 181 | 5.85 | % | ||||||||||||||||
|
|
|
|
|
|
|
|
|
|
|
|
|
|||||||||||||
| Total Interest-bearing liabilities |
$ | 900,048 | $ | 1,393 | 0.63 | % | $ | 780,070 | $ | 2,727 | 1.41 | % | ||||||||||||
| Noninterest-bearing liabilities: |
||||||||||||||||||||||||
| Noninterest-bearing deposits |
$ | 316,553 | — | — | $ | 202,655 | — | — | ||||||||||||||||
| Other liabilities |
8,460 | — | — | 5,773 | — | — | ||||||||||||||||||
|
|
|
|
|
|
|
|
|
|
|
|
|
|||||||||||||
| Total noninterest-bearing liabilities |
$ | 325,013 | $ | 208,428 | ||||||||||||||||||||
| Stockholders’ Equity |
$ | 143,058 | $ | 129,062 | ||||||||||||||||||||
|
|
|
|
|
|
|
|
|
|
|
|
|
|||||||||||||
| Total Liabilities and Stockholders’ Equity |
$ | 1,368,119 | $ | 1,117,560 | ||||||||||||||||||||
|
|
|
|
|
|
|
|
|
|
|
|
|
|||||||||||||
| Net Interest Income |
$ | 12,284 | $ | 9,782 | ||||||||||||||||||||
| Net Interest Spread (2) |
3.79 | % | 3.51 | % | ||||||||||||||||||||
| Net Interest Margin (3) |
3.97 | % | 3.85 | % | ||||||||||||||||||||
| (1) | Includes nonaccrual loans. |
| (2) | Net interest spread is the difference between interest rates earned on interest earning assets and interest rates paid on interest-bearing liabilities. |
| (3) | Net interest margin is a ratio of net interest income to average interest earning assets for the same period. |
Increases and decreases in interest income and interest expense result from changes in average balances (volume) of interest-earning assets and interest-bearing liabilities, as well as changes in average interest rates.
66
Table of Contents
The following tables set forth the effects of changing rates and volumes on our net interest income during the periods shown. Information is provided with respect to: (i) effects on interest income attributable to changes in volume (change in volume multiplied by prior rate); and (ii) effects on interest income attributable to changes in rate (changes in rate multiplied by prior volume). For purposes of this table, changes attributable to both rate and volume that cannot be segregated have been proportionately allocated to both volume and rate.
| Three Months Ended March 31, 2021 over 2020 |
||||||||||||
| Changes due to: | ||||||||||||
| Volume | Rate | Total Variance |
||||||||||
| (Dollars in thousands) | ||||||||||||
| Interest-Earning Assets: |
||||||||||||
| Loans |
$ | 2,550 | $ | (1,316 | ) | $ | 1,234 | |||||
| Investment securities |
289 | (48 | ) | 241 | ||||||||
| Other interest earning assets |
12 | (319 | ) | (307 | ) | |||||||
|
|
|
|
|
|
|
|||||||
| Total increase (decrease) in interest income |
2,851 | (1,683 | ) | 1,168 | ||||||||
| Interest-Bearing Liabilities: |
||||||||||||
| NOW, savings, MMDA deposits |
166 | (396 | ) | (230 | ) | |||||||
| Time deposits |
(48 | ) | (1,066 | ) | (1,114 | ) | ||||||
| FHLB advances |
45 | (6 | ) | 39 | ||||||||
| Other borrowings |
4 | (33 | ) | (29 | ) | |||||||
|
|
|
|
|
|
|
|||||||
| Total increase (decrease) interest expense |
167 | (1,501 | ) | (1,334 | ) | |||||||
|
|
|
|
|
|
|
|||||||
| Increase (decrease) in net interest income |
$ | 2,684 | $ | (182 | ) | $ | 2,502 | |||||
|
|
|
|
|
|
|
|||||||
Net interest income for the three months ended March 31, 2021 was $12.3 million compared to $9.8 million for the three months ended March 31, 2020, an increase of $2.5 million, or 25.5%. The increase in net interest income was comprised of a $1.2 million, or 9.6%, increase in interest income, plus a $1.3 million, or 48.1%, decrease in interest expense. The growth in interest income was primarily attributable to a $206.2 million, or 24.0%, increase in average gross loans outstanding as of March 31, 2021, compared to March 31, 2020, and by a 0.60% decrease in the yield on gross total loans. The increase in average gross loans outstanding was primarily due to organic growth and despite a net reduction of $5.7 million in outstanding PPP loans as pay-offs exceeded new PPP loan origination. The $1.3 million decrease in interest expense for the quarter ended March 31, 2021 was primarily related to a 0.62% decrease in the rate paid on interest-bearing liabilities partially offset by an increase of $120.0 million, or 15.4%, in average interest-bearing liabilities as of March 31, 2021 compared to March 31, 2020. The increase in average interest-bearing liabilities from March 31, 2020 to March 31, 2021 was due to organic growth. For the three months ended March 31, 2021, net interest margin and net interest spread were 3.97% and 3.79%, respectively, compared to 3.85% and 3.51%, respectively, for the same period in 2020, which reflects the increases in interest income discussed above relative to the greater decreases in interest expense.
Provision for Loan Losses
Credit risk is inherent in the business of making loans. We establish an allowance for loan losses through charges to earnings, which are shown in the statements of income as the provision for loan losses. Specifically identifiable and quantifiable known losses are promptly charged off against the allowance. The provision for loan losses is determined by conducting a quarterly evaluation of the adequacy of our allowance for loan losses and increasing or reducing our provision expense accordingly, or reducing the amount of our allowance, as appropriate. This has the effect of creating variability in the amount and frequency of charges to our earnings. The provision for loan losses and level of allowance for each period are dependent upon many factors, including loan growth, net charge offs, changes in the composition of the loan portfolio, delinquencies, management’s assessment of the quality of the loan portfolio, the valuation of problem loans and the general economic conditions in our market areas.
The provision for loan losses for the three months ended March 31, 2021 was $750,000 compared to $800,000 for the three months ended March 31, 2020. In March 2021, the provision was recorded based on
67
Table of Contents
growth, and in March 2020, it was based on increased environmental factors related to the pandemic. There were no significant net charge-offs in the three months ended March 31, 2021. In the three months ended March 31, 2020, there were net recoveries of $134,000.
The allowance for loan losses as a percentage of gross loans was 1.16% and 1.15% at March 31, 2021 and 2020, respectively. The allowance for loan losses as a percentage of gross loans, without including PPP loans, was 1.23% at March 31, 2021.
Noninterest Income
While interest income remains the largest single component of total revenues, noninterest income is an important contributing component. Our most significant sources of noninterest income include SBA fees, which primarily includes gains on the sales and servicing of SBA loans; service charges on deposit accounts which includes overdraft program fees; and mortgage origination and sales fees. In May 2020, the Bank launched a program offering loans with interest rate swaps, which generated a new source of revenue. The new interest swap program is hedged with back-to-back interest rate swaps.
Noninterest income for the three months ended March 31, 2021 was $4.5 million compared to $2.4 million for the three months ended March 31, 2020, an increase of $2.1 million, or 87.5%. The following table sets forth the major components of our noninterest income for the three months ended March 31, 2021 and 2020:
| Three Months Ended March 31, | ||||||||||||
| 2021 | 2020 | Increase (Decrease) |
||||||||||
| (Dollars in thousands) | ||||||||||||
| Noninterest income: |
||||||||||||
| Service charges on deposit accounts |
$ | 360 | $ | 451 | $ | ( 91 | ) | |||||
| Interest rate swap fees |
558 | — | 558 | |||||||||
| SBA and USDA fees |
2,865 | 478 | 2,387 | |||||||||
| Bank card services and interchange fees |
362 | 247 | 115 | |||||||||
| Mortgage banking activities |
407 | 288 | 119 | |||||||||
| Net (loss) gain on sale of securities |
(232 | ) | 738 | (970 | ) | |||||||
| Other income and fees(1) |
176 | 200 | (24 | ) | ||||||||
|
|
|
|
|
|
|
|||||||
| Total noninterest income |
$ | 4,496 | $ | 2,402 | $ | 2,094 | ||||||
|
|
|
|
|
|
|
|||||||
| (1) | Other income and fees include income and fees associated with miscellaneous services and the increase in the cash surrender value of BOLI. |
Income from service charges on deposit accounts includes fees for overdraft privilege charges, insufficient funds charges, account analysis service fees on commercial accounts, and monthly account service fees. These
fees decreased $91,000, or 20.2%, to $360,000 for the three months ended March 31, 2021 from $451,000 for the three months ended March 31, 2020. The decrease is primarily attributed to a reduction in insufficient funds fees resulting from customers receiving economic stimulus from the CARES Act.
Interest rate swap fees represent fees received when the Bank’s customer enters into a back-to-back swap agreement. The program was launched in May 2020, so there were no fees for the three months ended March 31, 2020.
SBA and USDA fees primarily include gains on the sale of SBA loans and servicing of SBA loans. These fees increased $2.4 million, or 499.4%, to $2.9 million for the three months ended March 31, 2021, from $478,000 for the three months ended March 31, 2020. The Bank realized a gain of $2.8 million on the sale of a USDA loan during the first quarter of 2021. This loan was larger than historically sold, and this sale significantly improved our efficiency ratio.
Bank card services and interchange fees are derived from debit cards and foreign ATM transactions. These fees increased $115,000, or 46.6%, to $362,000 for the three months ended March 31, 2021, from $247,000 for
68
Table of Contents
the three months ended March 31, 2020. The increase was primarily the result of greater transactional volume that generated additional interchange fees during the first quarter of 2021.
Income from mortgage banking activities primarily includes origination fees and gains on the sale of mortgage loans originated for sale in the secondary market. Income from mortgage banking activities increased $119,000, or 41.3%, to $407,000 for the three months ended March 31, 2021 from $288,000 for the three months ended March 31, 2020. This increase is the result of increased volumes driven by lower market interest rates and includes both refinances and purchases.
Securities (losses) gains, net, decreased $970,000 to a net loss of $232,000 for the three months ended March 31, 2021, from a net gain of $738,000 for the three months ended March 31, 2020. The loss in the first quarter of 2021 is the result of bonds sold, at a net loss, in the first quarter of 2021 to reposition a portion of the bond portfolio from taxable municipal bonds into longer term, high coupon tax-exempt municipal bonds.
Other income and fees decreased $23,000, or 11.6%, to $176,000 for the three months ended March 31, 2021 from $199,000 for the three months ended March 31, 2020. This decrease was primarily due to slight decreases in our BOLI and other income.
Noninterest Expense
Noninterest expense for the three months ended March 31, 2021 was $8.5 million compared to $7.9 million for the three months ended March 31, 2020, an increase of $647,000, or 8.2%, which primarily resulted from increases in salaries, performance-based compensation and employee benefits, professional fees, and other expense. This was offset by a reduction in other real estate expense during the three months ended March 31, 2021. The following table sets forth the major components of our noninterest expense for the three months ended March 31, 2021 and 2020:
| Three Months Ended March 31, | ||||||||||||
| 2021 | 2020 | Increase (Decrease) |
||||||||||
| (Dollars in thousands) | ||||||||||||
| Noninterest expense: |
||||||||||||
| Salaries and employee benefits |
$ | 5,057 | $ | 4,487 | $ | 570 | ||||||
| Equipment and occupancy expenses |
879 | 902 | (23 | ) | ||||||||
| Professional services |
693 | 394 | 299 | |||||||||
| IT and data services |
447 | 415 | 32 | |||||||||
| Other real estate (income) expenses |
(90 | ) | 398 | (488 | ) | |||||||
| Other expenses(1) |
1,546 | 1,290 | 256 | |||||||||
|
|
|
|
|
|
|
|||||||
| Total noninterest expense |
$ | 8,532 | $ | 7,886 | $ | 646 | ||||||
|
|
|
|
|
|
|
|||||||
| (1) | Other expenses include items such as FDIC insurance, telephone expenses, marketing and advertising expense, debit card expenses, courier fees, directors’ fees, and insurance. |
Salaries and employee benefits primarily include: (i) amounts paid to employees for base pay, incentive compensation, and bonuses; (ii) health and other related insurance paid by the Bank on behalf of our employees; and (iii) the annual cost for any increases in the liability for non-qualified plans maintained for certain key employees. Salaries and employee benefits increased $570,000, or 12.7%, from $4.5 million for the quarter ended March 31, 2020 to $5.1 million for the quarter ended March 31, 2021. The increase was primarily due to normal salary increases, increases in benefit and incentive costs, and the addition of production and support personnel in the fourth quarter of 2020. The number of full time equivalent (“FTE”) employees was 191 at March 31, 2021, compared to 175 at March 31, 2020 and 190 at December 31, 2020.
Equipment and occupancy expenses consist of depreciation on property, premises, equipment and software, rent expense for leased facilities, maintenance agreements on equipment, property taxes, and other expenses related to maintaining owned or leased assets. Equipment and occupancy expense for the three months ended March 31, 2021 was $879,000 compared to $902,000 for the three months ended March 31, 2020, a decrease of $23,000, or 2.5%. The decrease was primarily attributable to an overall reduction in maintenance expenses.
69
Table of Contents
Professional services expenses, which include legal fees, audit and accounting fees, and consulting fees, increased $299,000, or 75.9%, to $693,000 for the three months ended March 31, 2021 compared to the three months ended March 31, 2020. This increase was primarily the result of the addition of SWAP administration expense of $90,000 and PPP administration expense of $182,000 that were not incurred in the three months ended March 31, 2020.
IT and data services expenses, which primarily consists of data processing services for core processing from a third-party vendor, increased $32,000, or 7.7%, to $447,000 for the three months ended March 31, 2021 compared to the three months ended March 31, 2020. The increase was primarily the result of general increases, and new services including a new lending platform in process for roll out mid-2021. This will create efficiencies and electronic signature capabilities.
Other real estate (income) expenses decreased $488,000, or 122.6%, to a net income of $90,000 for the three months ended March 31, 2021, from a net expense of $398,000 for the three months ended March 31, 2020. This decrease is substantially the result of write-downs and holding expenses incurred on foreclosed equipment during the three months ended March 31, 2020 and net OREO rental income during the three months ended March 31, 2021.
Other expenses include items such as FDIC insurance, telephone, advertising, debit card expenses, courier and insurance. Other expenses increased $257,000, or 19.8%, to $1.5 million for the three months ended March 31, 2021, compared to $1.3 million for the three months ended March 31, 2020. The increase was substantially due to additional charitable donations, and to a lesser extent, an increase in FDIC insurance expense based on the growth in liabilities funding our asset growth.
Results of Operations for the Years Ended December 31, 2020 and 2019
The following table shows the average outstanding balance of each principal category of our assets, liabilities and stockholders’ equity, together with the average yields on our assets and average costs of our liabilities for the periods indicated. Yields and costs are calculated by dividing the annualized income or expense by the average daily balances of the corresponding assets or liabilities for the same period.
| Year Ended December 31, 2020 | Year Ended December 31, 2019 | |||||||||||||||||||||||
| Average Balance |
Interest | Yield/Rate | Average Balance |
Interest | Yield/Rate | |||||||||||||||||||
| (Dollars in thousands) | ||||||||||||||||||||||||
| Assets: |
||||||||||||||||||||||||
| Interest-earnings assets: |
||||||||||||||||||||||||
| Gross loans, net of unearned income (1) |
$ | 954,598 | $ | 47,786 | 5.01 | % | $ | 747,507 | $ | 43,171 | 5.78 | % | ||||||||||||
| Investment securities |
83,987 | 1,960 | 2.33 | % | 55,447 | 1,337 | 2.41 | % | ||||||||||||||||
| Other interest-earning assets |
102,214 | 539 | 0.53 | % | 112,867 | 2,447 | 2.17 | % | ||||||||||||||||
|
|
|
|
|
|
|
|
|
|
|
|
|
|||||||||||||
| Total interest-earning assets |
$ | 1,140,799 | $ | 50,285 | 4.41 | % | $ | 915,821 | $ | 46,955 | 5.13 | % | ||||||||||||
| Allowance for loan losses |
(10,636 | ) | — | — | (8,795 | ) | — | — | ||||||||||||||||
| Noninterest-earning assets |
111,277 | — | — | 78,247 | — | — | ||||||||||||||||||
|
|
|
|
|
|||||||||||||||||||||
| Total Assets: |
$ | 1,241,440 | $ | 985,273 | ||||||||||||||||||||
|
|
|
|
|
|||||||||||||||||||||
| Liabilities and Stockholders’ Equity: |
||||||||||||||||||||||||
| Interest-bearing liabilities: |
||||||||||||||||||||||||
| NOW, savings and MMA deposits |
$ | 452,240 | $ | 3,085 | 0.68 | % | $ | 329,996 | $ | 3,808 | 1.15 | % | ||||||||||||
| Time deposits |
354,125 | 4,769 | 1.35 | % | 367,932 | 7,812 | 2.12 | % | ||||||||||||||||
| FHLB Advances |
21,448 | 178 | 0.83 | % | 1,364 | 35 | 2.57 | % | ||||||||||||||||
| Other Borrowings |
12,522 | 676 | 5.40 | % | 6,874 | 451 | 6.56 | % | ||||||||||||||||
|
|
|
|
|
|
|
|
|
|
|
|
|
|||||||||||||
| Total Interest-bearing liabilities |
$ | 840,335 | $ | 8,708 | 1.04 | % | $ | 706,166 | $ | 12,106 | 1.71 | % | ||||||||||||
| Noninterest-bearing liabilities: |
||||||||||||||||||||||||
| Noninterest-bearing deposits |
$ | 259,962 | — | — | $ | 164,908 | — | — | ||||||||||||||||
| Other liabilities |
7,114 | — | — | 5,357 | — | — | ||||||||||||||||||
|
|
|
|
|
|
|
|
|
|
|
|
|
|||||||||||||
70
Table of Contents
| Year Ended December 31, 2020 | Year Ended December 31, 2019 | |||||||||||||||||||||||
| Average Balance |
Interest | Yield/Rate | Average Balance |
Interest | Yield/Rate | |||||||||||||||||||
| (Dollars in thousands) | ||||||||||||||||||||||||
| Total noninterest-bearing liabilities |
$ | 267,076 | $ | 170,265 | ||||||||||||||||||||
| Stockholders’ Equity |
$ | 134,029 | $ | 107,330 | ||||||||||||||||||||
|
|
|
|
|
|||||||||||||||||||||
| Total Liabilities and Stockholders’ Equity |
$ | 1,241,440 | $ | 983,761 | ||||||||||||||||||||
|
|
|
|
|
|||||||||||||||||||||
| Net Interest Income |
$ | 41,577 | $ | 34,849 | ||||||||||||||||||||
| Net Interest Spread (2) |
3.37 | % | 3.42 | % | ||||||||||||||||||||
| Net Interest Margin (3) |
3.64 | % | 3.81 | % | ||||||||||||||||||||
| (1) | Includes nonaccrual loans. |
| (2) | Net interest spread is the difference between interest rates earned on interest earning assets and interest rates paid on interest-bearing liabilities. |
| (3) | Net interest margin is a ratio of net interest income to average interest earning assets for the same period. |
Increases and decreases in interest income and interest expense result from changes in average balances (volume) of interest-earning assets and interest-bearing liabilities, as well as changes in average interest rates. The following tables set forth the effects of changing rates and volumes on our net interest income during the periods shown. Information is provided with respect to: (i) effects on interest income attributable to changes in volume (change in volume multiplied by prior rate); and (ii) effects on interest income attributable to changes in rate (changes in rate multiplied by prior volume). For purposes of this table, changes attributable to both rate and volume that cannot be segregated have been proportionately allocated to both volume and rate.
| Year Ended December 31, 2020 over 2019 |
||||||||||||
| Changes due to: | ||||||||||||
| Volume | Rate | Total Variance |
||||||||||
| (Dollars in thousands) | ||||||||||||
| Interest Earning Assets: |
||||||||||||
| Loans |
$ | 10,153 | $ | (5,538 | ) | $ | 4,615 | |||||
| Investment securities |
666 | (43 | ) | 623 | ||||||||
| Other interest earning assets |
(19 | ) | (1,889 | ) | (1,908 | ) | ||||||
|
|
|
|
|
|
|
|||||||
| Total increase in interest income |
10,800 | (7,470 | ) | 3,330 | ||||||||
| Interest-Bearing Liabilities: |
||||||||||||
| NOW, savings, MMA deposits |
734 | (1,456 | ) | (722 | ) | |||||||
| Time deposits |
(194 | ) | (2,850 | ) | (3,044 | ) | ||||||
| FHLB advances |
166 | (24 | ) | 142 | ||||||||
| Other borrowings |
305 | (79 | ) | 226 | ||||||||
|
|
|
|
|
|
|
|||||||
| Total increase interest expense |
1,011 | (4,409 | ) | (3,398 | ) | |||||||
|
|
|
|
|
|
|
|||||||
| Increase in net interest income |
$ | 9,789 | $ | (3,061 | ) | $ | 6,728 | |||||
|
|
|
|
|
|
|
|||||||
Net interest income for the year ended December 31, 2020 was $41.6 million compared to $34.8 million for the year ended December 31, 2019, an increase of $6.8 million, or 19.3%. The increase in net interest income was comprised of a $3.3 million, or 7.0%, increase in interest income, offset by a $3.4 million, or 28.1%, decrease in interest expense. The growth in interest income was primarily attributable to a $207.1 million, or 27.7%, increase in average gross loans outstanding as of December 31, 2020, compared to December 31, 2019, and by a 0.77% decrease in the yield on gross total loans. The increase in average gross loans outstanding was primarily due to organic growth and PPP loan origination. The $3.4 million decrease in interest expense for the year ended December 31, 2020 was primarily related to a 0.68% decrease in the rate paid on interest-bearing liabilities and an increase of $134.2 million, or 19.0%, in average interest-bearing liabilities as of December 31, 2020 compared to December 31, 2019. The increase
71
Table of Contents
in average interest-bearing liabilities from 2019 to 2020 was primarily due to the acquisition of Small Town Bank and organic growth. For the year ended December 31, 2020, net interest margin and net interest spread were 3.64% and 3.37%, respectively, compared to 3.81% and 3.42%, respectively, for the same period in 2019, which reflects the increases in interest income discussed above relative to the greater decreases in interest expense.
Provision for Loan Losses
Credit risk is inherent in the business of making loans. We establish an allowance for loan losses through charges to earnings, which are shown in the statements of income as the provision for loan losses. Specifically identifiable and quantifiable known losses are promptly charged off against the allowance. The provision for loan losses is determined by conducting a quarterly evaluation of the adequacy of our allowance for loan losses and charging the shortfall or excess, if any, to the current quarter’s expense. This has the effect of creating variability in the amount and frequency of charges to our earnings. The provision for loan losses and level of allowance for each period are dependent upon many factors, including loan growth, net charge offs, changes in the composition of the loan portfolio, delinquencies, management’s assessment of the quality of the loan portfolio, the valuation of problem loans and the general economic conditions in our market areas.
The provision for loan losses for the year ended December 31, 2020 was $3.3 million compared to $5.7 million for the year ended December 31, 2019. In 2020, the provisions were recorded based on increased environmental factors related to the pandemic. There were no significant charge-offs in 2020. In 2019, additional provisions were recorded due to the need to fund the allowance for loan losses after $4.3 million in charge-offs on two borrowers and an increase in the overall size of the loan portfolio substantially as a result of the acquisition of Small Town Bank.
In addition, the Company received $2.0 million resulting from the termination of a Loan Guarantee Program operated by the State of Alabama (the “Alabama Loan Guarantee Program”). The Alabama Loan Guarantee Program was designed to incentivize lenders to make term loans or provide lines of credit to new or existing small businesses by supporting such loans or lines of credit with a guarantee from the State of Alabama. The Alabama Loan Guarantee Program required a 1% fee on the commitment balance at origination and in return the Company received a guarantee of up to 50% of losses in the event of the borrower’s default.
The payment of $2.0 million received by the Company from the State of Alabama in October 2019 was recorded as a gain and included in noninterest income on the accompanying consolidated statements of earnings. In connection therewith, the Company also recorded a $2.0 million loan loss provision to increase the allowance for loan losses due to the loss of the guarantee on such loans. We are continuing to monitor these loans. As of December 31, 2020, the Company had 11 loans outstanding totaling $9.3 million that were previously enrolled in the Alabama Loan Guarantee Program prior to its termination by the State of Alabama.
The allowance for loan losses as a percentage of gross loans was 1.15% and 1.11% at December 31, 2020 and 2019, respectively. The allowance for loan losses as a percentage of gross loans, without PPP, was 1.23% at December 31, 2020.
Noninterest Income
While interest income remains the largest single component of total revenues, noninterest income is an important contributing component. Our most significant sources of noninterest income include SBA fees, which primarily includes gains on the sales and servicing of SBA loans, service charges on deposit accounts which includes overdraft program fees, and mortgage origination and sales fees. In 2020, the Bank launched a program offering loans with interest rate swaps, which generated a new source of revenue. In 2019, the Bank received $2.0 million from the dissolution of the Alabama Loan Guarantee Program, which the Bank recorded as noninterest income.
72
Table of Contents
Noninterest income for the year ended December 31, 2020 was $8.5 million compared to $6.7 million for the year ended December 31, 2019, an increase of $1.8 million, or 27.3%. The following table sets forth the major components of our noninterest income for the years ended December 31, 2020 and 2019:
| Year Ended December 31, | ||||||||||||
| 2020 | 2019 | Increase (Decrease) |
||||||||||
| (Dollars in thousands) | ||||||||||||
| Noninterest income: |
||||||||||||
| Service charges on deposit accounts |
$ | 1,458 | $ | 1,535 | ($ | 77 | ) | |||||
| Interest rate swap fees |
1,405 | — | 1,405 | |||||||||
| SBA and USDA fees |
756 | 929 | (173 | ) | ||||||||
| Bank card services and interchange fees |
1,169 | 659 | 510 | |||||||||
| Mortgage banking activities |
1,529 | 909 | 620 | |||||||||
| Funds from dissolution of loan guarantee program |
— | 2,000 | (2,000 | ) | ||||||||
| Net gain on sale of securities |
742 | 14 | 728 | |||||||||
| BOLI payment received |
615 | — | 615 | |||||||||
| Other income and fees(1) |
867 | 664 | 203 | |||||||||
|
|
|
|
|
|
|
|||||||
| Total noninterest income |
$ | 8,541 | $ | 6,710 | $ | 1,831 | ||||||
|
|
|
|
|
|
|
|||||||
| (1) | Other income and fees include income and fees associated with miscellaneous services and the increase in the cash surrender value of life insurance. |
Income from service charges on deposit accounts includes fees for overdraft privilege charges, insufficient funds charges, account analysis service fees on commercial accounts, and monthly account service fees. These fees remained flat at $1.5 million for the years ended December 31, 2020 and 2019. There was a substantial decrease as the result of losing a significant lock box customer with fees of approximately $30,000 per month. This is somewhat offset by having Small Town Bank for a full year in 2020, compared to three months in 2019.
Interest rate swap fees represent fees received when the Bank’s customer enters into a back-to-back swap agreement. The program was launched in 2020.
SBA and USDA fees primarily include gains on the sale of SBA loans and servicing of SBA loans. These fees decreased $173,000, or 18.6%, to $756,000 for the year ended December 31, 2020, from $929,000 for the year ended December 31, 2019. The decrease in fees was due to a reduced volume of SBA loans sold in 2020 compared to 2019.
Bank card services and interchange fees are derived from debit cards and ATM cards and machines. These fees increased $510,000, or 77.4%, to $1.2 million for the year ended December 31, 2020, from $659,000 for the year ended December 31, 2019. The increase was primarily the result of the acquisition of Small Town Bank in September 2019.
Income from mortgage banking activities primarily includes origination fees and gains on the sale of mortgage loans originated for sale in the secondary market. Income from mortgage banking activities increased $620,000, or 68.2%, to $1.5 million for the year ended December 31, 2020 from $909,000 for the year ended December 31, 2019. This increase is the result of the significant reduction in market rate in 2020 and includes both refinances and purchases.
Net securities gains increased from $14,000 to $742,000. The increase is the result of bonds sold in the first quarter of 2020 to reposition a portion of the bond portfolio. In the first quarter of 2020, the Bank sold approximately $20.0 million in tax exempt securities and reinvested in taxable securities to perform better in a downward movement of rates.
73
Table of Contents
The Bank owns numerous Bank Owned Life Insurance (BOLI) policies in the ordinary course of business. During 2020, the Bank received a benefit payment of $615,000 related to the death of a former employee.
Other income and fees increased $203,000, or 30.6%, to $867,000 for the year ended December 31, 2020 from $664,000 for the year ended December 31, 2019. This increase was primarily due to rental income of $235,000 received on a new branch and offices purchased in Birmingham, Alabama which will not continue into 2021.
Noninterest Expense
Noninterest expense for the year ended December 31, 2020 was $32.2 million compared to $27.8 million for the year ended December 31, 2019, an increase of $4.4 million, or 15.9%, which primarily resulted from the increase in salaries, performance-based compensation and employee benefits from the acquisition of Small Town Bank in September 2019. The following table sets forth the major components of our noninterest expense for the years ended December 31, 2020 and 2019:
| Year Ended December 31, | ||||||||||||
| 2020 | 2019 | Increase (Decrease) |
||||||||||
|
|
|
|||||||||||
| (Dollars in thousands) | ||||||||||||
| Noninterest expense: |
||||||||||||
| Salaries and employee benefits |
$ | 18,765 | $ | 14,942 | $ | 3,823 | ||||||
| Equipment and occupancy expenses |
3,682 | 2,537 | 1,145 | |||||||||
| Professional services |
1,838 | 1,294 | 544 | |||||||||
| IT and data services |
1,729 | 1,175 | 554 | |||||||||
| Acquisition related expenses |
— | 3,373 | (3,373 | ) | ||||||||
| Other real estate expenses |
945 | 252 | 693 | |||||||||
| Other expenses(1) |
5,226 | 4,198 | 1,028 | |||||||||
|
|
|
|
|
|
|
|||||||
| Total noninterest expense |
$ | 32,185 | $ | 27,771 | $ | 4,414 | ||||||
|
|
|
|
|
|
|
|||||||
| (1) | Other expenses include items such as FDIC insurance, telephone expenses, marketing and advertising expense, debit card expenses, courier fees, directors’ fees, and insurance. The increase is substantially the result of owning Small Town Bank for a full year in 2020. |
Salaries and employee benefits primarily include: (i) amounts paid to employees for base pay, incentive compensation, and bonuses; (ii) health and other related insurance paid by the Bank on behalf of our employees; and (iii) the annual cost for any increases in the liability for non-qualified plans maintained for certain key employees. Salaries and employee benefits increased $3.8 million, or 25.5%, from $14.9 million for the year ended December 31, 2019 to $18.8 million for the year ended December 31, 2020. The increase was primarily due to the addition of employees for a full year in connection with the acquisition of Small Town Bank in September 2019. It is further related to normal salary increases, increases in benefit costs, and the addition of production and support personnel in the fourth quarter of 2020.
Equipment and occupancy expenses consist of depreciation on property, premises, equipment and software, rent expense for leased facilities, maintenance agreements on equipment, property taxes, and other expenses related to maintaining owned or leased assets. Equipment and occupancy expense for the year ended December 31, 2020 was $3.7 million compared to $2.5 million for the year ended December 31, 2019, an increase of $1.2 million, or 45.1%. The increase was primarily attributable to the addition of five Small Town Bank facilities and overall increases in maintenance expenses.
Professional services expenses, which include legal fees, audit and accounting fees, and consulting fees, increased $544,000, or 42.0%, to $1.8 million for the year ended December 31, 2020 compared to the year ended
74
Table of Contents
December 31, 2019. This increase was primarily the result of the addition of swap servicing expense of $ 226,000 and PPP administration expense of $195,000 that were not incurred in 2019. In addition, professional fees increased as the Bank was subject to FDICIA reporting requirements.
IT and data services expenses, which primarily consists of data processing services for core processing from a third-party vendor, increased $554,000, or 47.1%, to $1.7 million for 2020 compared to 2019. The increase was primarily the result of the addition of Small Town Bank for a full year and to a lesser extent general increases, and new services including a new lending platform in process for roll out mid-2021. This will create efficiencies and electronic signature capabilities.
Acquisition related expenses recorded in 2019 were related to the acquisition of Small Town Bank.
Other real estate expenses increased $693,000, or 275.0%, to 945,000 for the year ended December 31, 2020, from $252,000 for the year ended 2019. This increase is substantially the result of write-downs and holding expenses incurred on foreclosed equipment. This equipment was sold in October 2020.
Other expenses include items such as FDIC insurance, telephone, advertising, debit card expenses, courier and insurance. Other expenses increased $1.0 million, or 24.5%, to $5.2 million for the year ended December 31, 2020, compared to $4.2 million for the year ended December 31, 2019. The increase was substantially due to a full year of expenses related to the purchase of Small Town Bank in September 2019.
Financial Condition
Total assets grew $126.7 million, or 9.5%, to $1.5 billion at March 31, 2021 from $1.3 billion at December 31, 2020. This growth includes organic loan growth of $58.9 million, net of a reduction in net PPP loans of $5.7 million. Cash and cash equivalents increased $85.8 million to $170.7 million. The growth was fueled by deposit growth of $120.4 million, or 10.6%, to $1.3 billion at March 31, 2021 compared to $1.1 billion at December 31, 2020. The majority of the growth was in non-interest bearing deposits and money market accounts.
Total assets increased $237.0 million, or 21.6%, to $1.3 billion at December 31, 2020 as compared to $1.1 billion at December 31, 2019. The increase in total assets was the result of 15.1% in organic loan growth and participation in the PPP loan program. Our gross loans, net of unearned income, increased $192.7 million, or 23.0%, to $1.0 billion at December 31, 2020, compared to $837.4 million at December 31, 2019. The increase in the gross loans was due to organic growth of $128.1 million and $66.6 million from the participation in PPP. Our securities portfolio increased $54.1 million, or 90.3%, to $114.0 million at December 31, 2020, compared to $59.9 million at December 31, 2019. The increase in our securities portfolio is the result of an effort to move liquidity to higher yielding bonds instead of interest-earning cash. Total deposits increased $189.1 million, or 19.9% to $1.1 billion at December 31, 2020, compared to $950.5 million at December 31, 2019. A substantial portion of this growth was in non-interest bearing funds.
Loan Portfolio
Loans represent the largest portion of earning assets, greater than the securities portfolio or any other asset category, and the quality and diversification of the loan portfolio is an important consideration when reviewing the Company’s financial condition.
The Company originates residential real estate loans for the secondary market. The Company sells the residential real estate loans exclusively to two private investors who solely and independently make the credit decision and set the closing conditions. The loans are closed in the Company’s name but are immediately assigned to the designated investor. These loans have an average turn time to purchase of 30 days or less. These mortgage loans are designated on the Company’s balance sheet as held-for-sale. This segment represents less than 0.005% of total loans based on the latest thirteen-month average.
We have three loan portfolio segments: real estate (“RE”) which is divided into three classes, commercial and industrial (C&I), and consumer and other. A class is generally determined based on the initial measurement
75
Table of Contents
attribute, risk characteristic of the loan, and method for monitoring and assessing credit risk. Classes within the RE portfolio segment include construction and development or C&D, residential mortgages, and commercial mortgages.
Our loan clients primarily consist of small to medium sized business, the owners and operators of these businesses, as well as other professionals, entrepreneurs and high net worth individuals. We believe owner-occupied and investment commercial real estate loans, residential construction loans and commercial business loans provide us with higher risk-adjusted returns, shorter maturities and more sensitivity to interest rate fluctuations, and are complemented by our relatively lower risk residential real estate loans to individuals.
The following describes risk characteristics relevant to each of the loan portfolio segments:
Real estate—The Company offers various types of real estate loan products, which are divided into the classes described below. All loans within this portfolio segment are particularly sensitive to the valuation of real estate:
| • | Construction and development, or C&D, loans include extensions of credit to real estate developers or investors where repayment is dependent on the sale of the real estate or income generated from the real estate collateral. |
| • | Residential mortgages include 1-4 family first mortgage loans, which are repaid by various means such as a borrower’s income, sale of the property, or rental income derived from the property. These include second liens or open-end residential real estate loans, such as home equity lines. These loans are typically repaid by the same means as 1-4 family first mortgages. |
| • | Commercial mortgages include both owner-occupied commercial real estate loans and other commercial real estate loans, such as commercial loans secured by income producing properties. Owner-occupied commercial real estate loans made to operating businesses are long-term financing of land and buildings and are repaid by cash flows generated from business operations. Real estate loans for income-producing properties such as apartment buildings, office and industrial buildings, and retail shopping centers are repaid from rent income derived from the properties. |
Commercial and industrial—This loan portfolio segment includes loans to commercial customers for use in normal business operations to finance working capital needs, equipment purchases, leases, or expansion projects. Loans are repaid by business cash flows. Collection risk in this portfolio is driven by the creditworthiness of the underlying borrower, particularly cash flows from the borrowers’ business operations.
Consumer and other—This loan portfolio segment includes direct consumer installment loans, overdrafts and other revolving credit loans. Loans in this portfolio are sensitive to unemployment and other key consumer economic measures.
The following table presents the balance and associated percentage of the composition of loans, excluding loans held for sale on the dates indicated:
| As of March 31, |
Loan Portfolio Segments As of December 31, |
|||||||||||||||||||||||||||||||||||||||||||||||
| 2021 Amount |
% of Total |
2020 Amount |
% of Total |
2019 Amount |
% of Total |
2018 Amount |
% of Total |
2017 Amount |
% of Total |
2016 Amount |
% of Total |
|||||||||||||||||||||||||||||||||||||
| (Dollars in thousands) | ||||||||||||||||||||||||||||||||||||||||||||||||
| Real Estate Loans: |
||||||||||||||||||||||||||||||||||||||||||||||||
| Construction & Development |
$ | 121,199 | 11.1 | % | $ | 102,559 | 9.9 | % | $ | 93,011 | 11.1 | % | $ | 77,197 | 11.0 | % | 82,217 | 14.4 | % | $ | 94,745 | 18.9 | % | |||||||||||||||||||||||||
| Residential Mortgages |
151,883 | 14.0 | % | 152,212 | 14.7 | % | 152,312 | 18.1 | % | 125,026 | 17.7 | % | 118,428 | 20.9 | % | 113,296 | 22.6 | % | ||||||||||||||||||||||||||||||
| Commercial Mortgages |
575,022 | 52.9 | % | 514,923 | 49.8 | % | 441,946 | 52.7 | % | 363,536 | 51.5 | % | 284,912 | 50.2 | % | 246,690 | 49.1 | % | ||||||||||||||||||||||||||||||
| Commercial & Industrial |
169,311 | 15.6 | % | 187,839 | 18.3 | % | 139,765 | 16.7 | % | 132,061 | 18.7 | % | 74,896 | 13.2 | % | 41,252 | 8.2 | % | ||||||||||||||||||||||||||||||
76
Table of Contents
| As of March 31, | Loan Portfolio Segments As of December 31, |
|||||||||||||||||||||||||||||||||||||||||||||||
| 2021 Amount |
% of Total |
2020 Amount |
% of Total |
2019 Amount |
% of Total |
2018 Amount |
% of Total |
2017 Amount |
% of Total |
2016 Amount |
% of Total |
|||||||||||||||||||||||||||||||||||||
| (Dollars in thousands) | ||||||||||||||||||||||||||||||||||||||||||||||||
| PPP Loans |
60,846 | 5.6 | % | 66,556 | 6.4 | % | — | — | — | — | — | — | — | — | ||||||||||||||||||||||||||||||||||
| Consumer and other |
9,200 | 0.8 | % | 9,644 | 0.9 | % | 11,955 | 1.4 | % | 7,479 | 1.1 | % | 7,131 | 1.3 | % | 6,293 | 1.2 | % | ||||||||||||||||||||||||||||||
|
|
|
|
|
|
|
|
|
|
|
|
|
|
|
|
|
|
|
|||||||||||||||||||||||||||||||
| Gross Loans |
1,087,461 | 100.0 | % | 1,033,733 | 100.0 | % | 838,989 | 100.0 | % | 705,299 | 100.0 | % | 567,584 | 100.0 | % | 502,276 | 100.0 | % | ||||||||||||||||||||||||||||||
| Deferred loan fees |
(4,187 | ) | (3,618 | ) | (1,548 | ) | (1,553 | ) | (1,252 | ) | (993 | ) | ||||||||||||||||||||||||||||||||||||
| Allowance for loan losses |
(12,605 | ) | (11,859 | ) | (9,265 | ) | (7,833 | ) | (5,754 | ) | (4,949 | ) | ||||||||||||||||||||||||||||||||||||
|
|
|
|
|
|
|
|
|
|
|
|
|
|||||||||||||||||||||||||||||||||||||
| Loans, net |
$ | 1,070,669 | $ | 1,018,256 | $ | 828,176 | $ | 695,913 | $ | 560,579 | $ | 496,334 | ||||||||||||||||||||||||||||||||||||
|
|
|
|
|
|
|
|
|
|
|
|
|
|||||||||||||||||||||||||||||||||||||
Gross loans increased $53.7 million, or 5.2%, to $1.1 billion as of March 31, 2021 as compared to $1.0 billion as of December 31, 2020. The net increase in the Company’s gross loans was due to organic growth of $59.4 million and offset by a net decrease of $5.7 million in PPP loans. During the first quarter of 2021, the Company’s participation in the PPP program resulted in new loans of $26.1 million and forgiveness of $31.8 million on existing loans. Portfolio segments and classes remained relatively consistent since December 31, 2020.
Gross loans increased $194.7 million, or 23.2%, to $1.0 billion as of December 31, 2020 as compared to $839.0 million as of December 31, 2019. The increase in the Company’s gross loans was due to organic growth of $128.1 million and $66.6 million from the participation in the PPP Loan Program. Portfolio segments and classes remained relative consistent year over year.
The following tables show the contractual maturities of the Company’s gross loan principal balances, which excludes loan discounts, overdrafts and other items in the distribution between fixed and adjustable interest rate loans at March 31, 2021, December 31, 2020 and 2019, respectively:
| As of March 31, 2021 | ||||||||||||||||||||||||||||
| Due in One Year or Less | Due After One Year Through Five Years |
Due After Five Years | ||||||||||||||||||||||||||
| Fixed Rate |
Adjustable Rate |
Fixed Rate |
Adjustable Rate |
Fixed Rate |
Adjustable Rate |
Total | ||||||||||||||||||||||
| (Dollars in thousands) | ||||||||||||||||||||||||||||
| Real Estate Loans: |
||||||||||||||||||||||||||||
| Construction & Development |
$ | 5,825 | $ | 42,841 | $ | 25,764 | $ | 27,231 | $ | 3,244 | $ | 16,572 | $ | 121,477 | ||||||||||||||
| Residential Mortgages |
14,889 | 10,446 | 60,789 | 8,632 | 3,146 | 54,081 | 151,983 | |||||||||||||||||||||
| Commercial Mortgages |
30,321 | 12,098 | 297,974 | 98,485 | 29,378 | 104,512 | 572,768 | |||||||||||||||||||||
| Commercial & Industrial |
6,235 | 38,236 | 75,623 | 24,119 | 4,870 | 22,333 | 171,417 | |||||||||||||||||||||
| PPP Loans |
— | — | 60,846 | — | — | — | 60,846 | |||||||||||||||||||||
| Consumer and other |
1,575 | 1,689 | 3,612 | 721 | 134 | 1,400 | 9,131 | |||||||||||||||||||||
|
|
|
|
|
|
|
|
|
|
|
|
|
|
|
|||||||||||||||
| Gross Loans |
$ | 58,845 | $ | 105,311 | $ | 524,608 | $ | 159,188 | $ | 40,772 | $ | 198,996 | $ | 1,087,622 | ||||||||||||||
|
|
|
|
|
|
|
|
|
|
|
|
|
|
|
|||||||||||||||
77
Table of Contents
| As of December 31, 2020 | ||||||||||||||||||||||||||||
| Due in One Year or Less | Due after One Year Through Five Years |
Due after Five Years | ||||||||||||||||||||||||||
| Fixed Rate |
Adjustable Rate |
Fixed Rate |
Adjustable Rate |
Fixed Rate |
Adjustable Rate |
Total | ||||||||||||||||||||||
| (Dollars in thousands) | ||||||||||||||||||||||||||||
| Real Estates: |
||||||||||||||||||||||||||||
| Construction & Development |
$ | 5,097 | $ | 40,869 | $ | 25,901 | $ | 18,265 | $ | 2,428 | $ | 9,999 | $ | 102,559 | ||||||||||||||
| Residential Mortgages |
15,318 | 15,154 | 48,171 | 17,191 | 4,464 | 52,032 | 152,330 | |||||||||||||||||||||
| Commercial Real Estate Mortgages |
33,587 | 13,754 | 293,197 | 49,917 | 13,200 | 111,363 | 515,018 | |||||||||||||||||||||
| Commercial & Industrial |
6,705 | 40,395 | 70,973 | 25,453 | 23,414 | 21,209 | 188,149 | |||||||||||||||||||||
| PPP Loans |
— | — | 66,556 | — | — | — | 66,556 | |||||||||||||||||||||
| Consumer & Other |
1,960 | 1,358 | 3,928 | 712 | 139 | 1,400 | 9,497 | |||||||||||||||||||||
|
|
|
|
|
|
|
|
|
|
|
|
|
|
|
|||||||||||||||
| Gross Loans |
$ | 62,667 | $ | 111,530 | $ | 508,726 | $ | 111,538 | $ | 43,645 | $ | 196,003 | $ | 1,034,109 | ||||||||||||||
|
|
|
|
|
|
|
|
|
|
|
|
|
|
|
|||||||||||||||
| As of December 31, 2019 | ||||||||||||||||||||||||||||
| Due in One Year or Less | Due after One Year Through Five Years |
Due after Five Years | ||||||||||||||||||||||||||
| Fixed Rate |
Adjustable Rate |
Fixed Rate |
Adjustable Rate |
Fixed Rate |
Adjustable Rate |
Total | ||||||||||||||||||||||
| (Dollars in thousands) | ||||||||||||||||||||||||||||
| Real Estate: |
||||||||||||||||||||||||||||
| Construction & Development |
$ | 13,115 | $ | 37,845 | $ | 18,867 | $ | 15,528 | $ | 1,264 | $ | 6,391 | $ | 93,010 | ||||||||||||||
| Residential Mortgages |
11,245 | 12,304 | 63,449 | 10,905 | 6,229 | 48,484 | 152,616 | |||||||||||||||||||||
| Commercial Real Estate Mortgages |
47,470 | 28,553 | 267,962 | 23,129 | 11,507 | 59,949 | 438,570 | |||||||||||||||||||||
| Commercial & Industrial |
5,871 | 27,664 | 63,910 | 28,202 | 4,849 | 9,997 | 140,493 | |||||||||||||||||||||
| Consumer & Other |
2,915 | 707 | 6,022 | 573 | 89 | 1,500 | 11,806 | |||||||||||||||||||||
|
|
|
|
|
|
|
|
|
|
|
|
|
|
|
|||||||||||||||
| Gross Loans |
$ | 80,616 | $ | 107,073 | $ | 420,210 | $ | 78,337 | $ | 23,938 | $ | 126,321 | $ | 836,495 | ||||||||||||||
|
|
|
|
|
|
|
|
|
|
|
|
|
|
|
|||||||||||||||
The majority of our loans are priced with a fixed rate and a one to five-year maturity. This type of loan has historically been about 50% of total loans over the past three years because the majority of our commercial loans are priced with five-year balloons.
The Company is primarily involved in real estate, commercial, agricultural and consumer lending activities with customers throughout our markets in Alabama and Georgia. About 74.5% of our gross loans were secured by real property as of December 31, 2020, compared to 81.9% as of December 31, 2019. The Company believes that these loans are not concentrated in any one single property type and that they are geographically dispersed throughout our markets. Our debtors’ ability to repay their loans is substantially dependent upon the economic conditions of the markets in which the Company operates, which consist primarily of wholesale/retail and related businesses.
Commercial real estate loans were 52.9% of total gross loans as of March 31, 2021 and represented 49.8% of total gross loans as of December 31, 2020. C&D loans were 11.1% of total gross loans as of March 31, 2021, relatively unchanged compared to year end 2020 at 9.9%. The ratio of the Company’s commercial real estate loans to total Bank capital is 254.50% as of March 31, 2021 and 225.2% as of December 31, 2020. C&D loans represented 81.5% of total Bank capital as of March 31, 2021 as compared to 71.9% as of December 31, 2020. The ratios of commercial real estate loans and construction and development loans to total capital as of December 31, 2020 and 2019 were each below the 300%/100% concentration limits provided in regulatory guidance. Further, these loans are geographically diversified, primarily throughout our markets in Alabama and Georgia.
78
Table of Contents
Commercial real estate loans were 49.8% of total gross loans as of December 31, 2020 and represent 52.7% of total gross loans as of December 31, 2019. C&D loans were 9.9% of total gross loans as of December 31, 2020, relatively unchanged compared to 2019 at 11.1%. The ratio of the Company’s commercial real estate loans to total Bank capital is 225.2% as of December 31, 2020 and 227.5% as of December 31, 2019. C&D loans represented 71.9% of total Bank capital as of December 31, 2020 as compared to 73.4% as of December 31, 2019. The ratios of commercial real estate loans and construction and development loans to total capital as of December 31, 2020 and 2019 were each below the 300%/100% concentration limits provided in regulatory guidance. Further, these loans are geographically diversified, primarily throughout the states of Alabama and Georgia.
The Company has established concentration limits in its loan portfolio for commercial real estate loans by loan types, including collateral and industry, among others. All loan types are within established limits with the exception of the hotels/motels category, which have occasionally exceeded the Company’s limit of 50% of total capital. The Company capped its hospitality loans in January 2020 and multi-family loans in September 2020. This sector’s concentration is actively managed by the Senior Management team, including the Chief Executive Officer, President, Chief Risk/Credit Officer, and Chief Operating Officer.
The Company requires all business purpose loans to be underwritten by a centralized underwriting department located in Birmingham, Alabama. Industry-tested underwriting guidelines are used to assess a borrower’s historical cash flow to determine debt service, and the Company further stress tests the debt service under higher interest rate scenarios. Financial and performance covenants are used in commercial lending to allow us to react to a borrower’s deteriorating financial condition, should that occur.
Construction and Development. Loans for residential construction are for single-family properties to developers or investors. These loans are underwritten based on estimates of costs and the completed value of the project. Funds are advanced based on estimated percentage of completion for the project. Performance of these loans is affected by economic conditions as well as the ability to control the costs of the projects. This category also includes commercial construction projects.
Construction and development loans increased $18.6 million, or 18.1%, to $121.2 million as of March 31, 2021 from $102.6 million as of December 31, 2020. The majority of this increase was due to continued loan growth primarily in the Birmingham, Alabama and Atlanta, Georgia markets. Residential construction loans were relatively flat.
Construction and development loans increased $9.6 million, or 10.02%, to $102.6 million as of December 31, 2020 from $93.0 million as of December 31, 2019. The majority of this increase was due to commercial construction loan opportunities afforded the Company in 2020. Residential construction loans were relatively flat.
Commercial Real Estate. The Company’s commercial real estate loan portfolio includes loans for commercial property that is owned by real estate investors, construction loans to build owner-occupied properties, and loans to developers of commercial real estate investment properties and residential developments. Commercial real estate loans are subject to underwriting standards and processes similar to the Company’s commercial loans. These loans are underwritten primarily based on projected cash flows for income-producing properties and collateral values for non-income-producing properties. The repayment of these loans is generally dependent on the successful operation of the property securing the loans or the sale or refinancing of the property. Real estate loans may be adversely affected by conditions in the real estate markets or in the general economy. The properties securing the Company’s real estate portfolio are diversified by type and geographic location. The Company believes the diversity helps reduce the exposure to adverse economic events that may affect any single market or industry.
Commercial real estate loans increased $60.1 million, or 11.7%, to $575.0 million as of March 31, 2021 from $514.9 million as of December 31, 2020. The increase in commercial real estate loans during this period
79
Table of Contents
was mostly driven by general increases in lending activity, primarily in the Company’s Huntsville, Alabama and Georgia markets. As of March 31, 2021, the Company’s commercial real estate portfolio was comprised of $214.8 million in non-owner occupied commercial real estate loans and $101.4 million in commercial construction loans.
Commercial real estate loans increased $73.0 million, or 16.5%, to $514.9 million as of December 31, 2020 from $441.9 million as of December 31, 2019. The increase in commercial real estate loans during this period was mostly driven by general increases in lending activity, primarily in the Company’s Opelika/Auburn, Alabama and Georgia markets. As of December 31, 2020, the Company’s commercial real estate portfolio was comprised of $173.4 million in non-owner occupied commercial real estate loans and $67.7 million in commercial construction loans.
Residential. We offer one-to-four family mortgage loans on both owner-occupied primary residences and investor-owned residences, which make up approximately 59.6% of our residential loan portfolio. Our residential loans also include home equity lines of credit, which total $18.6 million, or approximately 12.3% of our residential portfolio as of March 31, 2021. By offering a full line of residential loan products, the owners of the small to medium sized businesses that we lend to use us, instead of a competitor, for financing a personal residence. We also offer multi-family loans which comprise the remaining 27.4% of the portfolio.
Commercial and Industrial. Commercial and industrial loans are underwritten after evaluating and understanding the borrower’s ability to operate profitably. Underwriting standards have been designed to determine whether the borrower possesses sound business ethics and practices, to evaluate current and projected cash flows to determine the ability of the borrower to repay their obligations, and to ensure appropriate collateral is obtained to secure the loan. Commercial and industrial loans are primarily made based on the identified cash flows of the borrower and, secondarily, on the underlying collateral provided by the borrower. Most commercial and industrial loans are secured by the assets being financed or other business assets, such as real estate, accounts receivable, or inventory, and typically include personal guarantees. Owner-occupied real estate is included in commercial and industrial loans, as the repayment of these loans is generally dependent on the operations of the commercial borrower’s business rather than on income-producing properties or the sale of the properties.
Commercial and industrial loans decreased $18.5 million, or 9.9% to $169.3 miilion as of March 31, 2021 from $187.8 million as of December 31, 2020. The Company sold a $20.6 million loan to USDA during the first quarter of 2021. Commercial and industrial loans increased $48.1 million, or 34.4%, to $187.8 million as of December 31, 2020 from $139.8 million as of December 31, 2019.
Consumer and Other. The Company utilizes the central underwriting department for all consumer loans over $200,000 in total credit exposure regardless of collateral type. Loans below this threshold are underwritten by the responsible loan officer in accordance with the Company’s consumer loan policy. The loan policy addresses types of consumer loans that may be originated and the requisite collateral, if any, which must be perfected. We believe the relatively smaller individual dollar amounts of consumer loans that are spread over numerous individual borrowers minimize risk.
Consumer and other loans (non-real estate loans) decreased $0.4 million, or 4.6%, to $9.2 million as of March 31, 2021 from $9.6 million as of December 31, 2020. Consumer and other loans (non-real estate loans) decreased $2.4 million, or 20.0%, to $9.6 million as of December 31, 2020, from $12.0 million as of December 31, 2019.
Loan Participations
In the normal course of business, the Company periodically sells participating interests in loans to other banks and investors. All participations are sold on a proportionate (pro-rata) basis with all cash flows divided proportionately among the participants and no party has the right to pledge or exchange the entire financial asset
80
Table of Contents
without the consent of all the participants. Other than standard 90-day prepayment provisions and standard representations and warranties, participating interests are sold without recourse. We also purchase loan participations from time to time.
At March 31, 2021, December 31, 2020 and 2019, loan participations sold to third-parties (which are not included in the accompanying consolidated balance sheets) totaled $52.4 milllion, $32.1 million and $16.2 million, respectively. We sell participations to manage our credit exposures to borrowers. At March 31, 2021, December 31, 2020 and 2019, we purchased loan participations totaling $30.2 million, $25.1 million and $16.9 million, respectively. The variances come from purchases and sales of participations in the ordinary course of business.
Allowance for Loan Losses
The allowance for loan losses is funded as losses are estimated through a provision for loan losses charged to expense. Loan losses are charged against the allowance when management believes the uncollectibility of a loan balance is confirmed. Confirmed losses are charged off immediately. Subsequent recoveries, if any, are credited to the allowance.
The allowance for loan losses is an amount that management believes will be adequate to absorb estimated losses relating to specifically identified loans, as well as probable credit losses inherent in the balance of the loan portfolio. The allowance for loan losses is evaluated on a regular basis by management and is based upon management’s periodic review of the uncollectibility of loans in light of historical experience, the nature and volume of the loan portfolio, the overall portfolio quality, specific problem loans, current economic conditions that may affect the borrower’s ability to pay, the estimated value of any underlying collateral and prevailing economic conditions. This evaluation is inherently subjective as it requires estimates that are susceptible to significant revision as more information becomes available. This evaluation does not include the effects of expected losses on specific loans or groups of loans that are related to future events or expected changes in economic conditions.
The allowance for loan losses consists of specific and general components. The specific component relates to loans that are classified as impaired. For those loans that are classified as impaired, an allowance is established when the discounted cash flows, collateral value, or observable market price of the impaired loan is lower than the carrying value of that loan. The general component covers non-impaired loans and is based on historical loss experience adjusted for qualitative factors. Other adjustments may be made to the allowance for loan losses for pools of loans after an assessment of internal or external influences on credit quality that are not fully reflected in the historical loss or risk rating data.
A loan is considered impaired when it is probable, based on current information and events, that the Company will be unable to collect all principal and interest payments due in accordance with the contractual terms of the loan agreement. Loans, for which the terms have been modified at the borrower’s request, and for which the borrower is experiencing financial difficulties, are considered troubled debt restructurings and are classified as impaired.
Factors considered by management in determining impairment include payment status, collateral value, and the probability of collecting scheduled principal and interest when due. Loans that experience insignificant payment delays and payment shortfalls are not generally classified as impaired. Impaired loans are measured by the present value of expected future cash flows discounted at the loan’s effective interest rate, the loan’s observable market price, or the fair value of the collateral if the loan is collateral dependent, less estimated costs to sell the collateral. Interest on accruing impaired loans is recognized as long as such loans do not meet the criteria for nonaccrual status. Large groups of smaller balance homogeneous loans are collectively evaluated for impairment.
The Company’s homogeneous loan pools include commercial real estate loans, real estate construction and development loans, residential real estate loans, commercial and industrial loans, and consumer loans. The
81
Table of Contents
general allocations to these loan pools are based on the historical loss rates for specific loan types and the internal risk grade, if applicable, adjusted for both internal and external qualitative risk factors. The qualitative factors considered by management include, among other factors, (1) changes in local and national economic conditions; (2) changes in asset quality and foreclosure rates; (3) changes in loan portfolio volume; (4) the composition and concentrations of credit; (5) the impact of competition on loan structuring and pricing; (6) the experience and ability of lending personnel and management; (7) the effectiveness of the Company’s loan policies, procedures and internal controls; (8) current conditions in the real estate and construction markets; (9) the effect of entrance into new markets or the offering of a new product; and (10) the loan review system and oversight of our board of directors. The total allowance established for each homogeneous loan pool represents the product of the historical loss ratio and the total dollar amount of the loans in the pool.
The allowance for loan losses was $12.6 million at March 31, 2021 compared to $11.9 million at December 31, 2020, an increase of $0.7 million, or 5.9%. Additional provisions were recorded based on overall growth in loans.
The allowance for loan losses was $11.9 million at December 31, 2020 compared to $9.3 million at December 31, 2019, an increase of $2.6 million, or 28.0%. Additional provisions were recorded based on the uncertainty of economic conditions related to the COVID pandemic.
The following table provides an analysis of the allowance for loan losses at the dates indicated.
| As of March 31, |
As of December 31, |
|||||||||||||||||||||||
| 2021 | 2020 | 2019 | 2018 | 2017 | 2016 | |||||||||||||||||||
| (Dollars in thousands) | ||||||||||||||||||||||||
| Average loans outstanding |
$ | 1,066,556 | $ | 954,598 | $ | 747,507 | $ | 635,045 | $ | 524,234 | $ |
447,639 |
| |||||||||||
| Gross loans outstanding at end of period |
$ | 1,087,461 | $ | 1,033,733 | $ | 838,989 | $ | 705,299 | $ | 567,585 | $ |
502,276 |
| |||||||||||
| Allowance for loan losses at beginning of the period |
$ | 11,859 | $ | 9,265 | $ | 7,833 | $ | 5,754 | $ | 4,949 | $ |
3,645 |
| |||||||||||
| Charge offs: |
||||||||||||||||||||||||
| Construction & Development |
— | 23 | — | — | — | |
35 |
| ||||||||||||||||
| Residential Mortgage |
16 | 90 | 222 | 68 | 232 | |
42 |
| ||||||||||||||||
| Commercial Real Estate Mortgage |
— | 795 | 219 | 180 | 15 | |
— |
| ||||||||||||||||
| Commercial & Industrial |
— | — | 3,627 | 72 | 485 | |
247 |
| ||||||||||||||||
| Consumer & Other |
2 | 18 | 268 | 5 | — | |
76 |
| ||||||||||||||||
|
|
|
|
|
|
|
|
|
|
|
|
|
|||||||||||||
| Total charge-offs |
18 | 926 | 4,336 | 325 | 732 | |
400 |
| ||||||||||||||||
| Recoveries: |
||||||||||||||||||||||||
| Construction & Development |
— | — | — | — | 83 | |
342 |
| ||||||||||||||||
| Residential Mortgage |
2 | 9 | 18 | 9 | 5 | |
130 |
| ||||||||||||||||
| Commercial Real Estate Mortgage |
— | — | — | 85 | 13 | |
23 |
| ||||||||||||||||
| Commercial & Industrial |
11 | 126 | 40 | 114 | 121 | |
120 |
| ||||||||||||||||
| Consumer & Other |
1 | 85 | 10 | — | — | |
5 |
| ||||||||||||||||
|
|
|
|
|
|
|
|
|
|
|
|
|
|||||||||||||
| Total recoveries |
14 | 220 | 68 | 208 | 222 | |
597 |
| ||||||||||||||||
|
|
|
|
|
|
|
|
|
|
|
|
|
|||||||||||||
| Net charge-offs (recovery) |
$ | 4 | $ | 706 | $ | 4,268 | $ | 117 | $ | 510 | $ |
(197 |
) | |||||||||||
|
|
|
|
|
|
|
|
|
|
|
|
|
|||||||||||||
82
Table of Contents
| As of March 31, |
As of December 31, | |||||||||||||||||||||||
| 2021 | 2020 | 2019 | 2018 | 2017 | 2016 | |||||||||||||||||||
| (Dollars in thousands) | ||||||||||||||||||||||||
| Provision for loan losses |
$ | 750 | $ | 3,300 | $ | 5,700 | $ | 2,196 | $ | 1,315 | $ | 1,016 | ||||||||||||
| Balance at end of period |
$ | 12,605 | $ | 11,859 | $ | 9,265 | $ | 7,833 | $ | 5,754 | $ | 4,949 | ||||||||||||
| Ratio of allowance to end of period loans |
1.16 | % | 1.15 | % | 1.11 | % | 1.11 | % | 1.02 | % | 0.99 | % | ||||||||||||
| Ratio of allowance to end of period loans (without PPP) |
1.23 | % | 1.23 | % | — | — | — | — | ||||||||||||||||
| Ratio of net charge-offs (recovery) to average loans |
0.00 | % | 0.07 | % | 0.57 | % | 0.02 | % | 0.10 | % | (0.04 | %) | ||||||||||||
Net charge-offs for the first quarter of 2021 totaled $4,000. Net charge-offs for 2020 totaled $706,000, a decrease of $3.6 million compared to $4.3 million for the year ended 2019.
Nonperforming Loans
Loans are considered delinquent when principal or interest payments are past due 30 days or more. Delinquent loans may remain on accrual status between 30 days and 90 days past due. Loans on which the accrual of interest has been discontinued are designated as nonaccrual loans. Typically, the accrual of interest on loans is discontinued when principal or interest payments are past due 90 days or when, in the opinion of management, there is a reasonable doubt as to collectability in the normal course of business. When loans are placed on nonaccrual status, all interest previously accrued but not collected is reversed against current period interest income. Income on nonaccrual loans is subsequently recognized only to the extent that cash is received and the loan’s principal balance is deemed collectible. Loans are restored to accrual status when loans become well-secured and management believes full collectability of principal and interest is probable.
A loan is considered impaired when it is probable that the Company will be unable to collect all amounts due according to the contractual terms of the loan agreement. Impaired loans include loans on nonaccrual status and performing restructured loans. Income from loans on nonaccrual status is recognized to the extent cash is received and when the loan’s principal balance is deemed collectible. Depending on a particular loan’s circumstances, the Company measures impairment of a loan based upon the present value of expected future cash flows discounted at the loan’s effective interest rate, the loan’s observable market price, or the fair value of the collateral less estimated costs to sell if the loan is collateral dependent. A loan is considered collateral dependent when repayment of the loan is based solely on the liquidation of the collateral. Fair value, where possible, is determined by independent appraisals, typically on an annual basis. Between appraisal periods, the fair value may be adjusted based on specific events, such as if deterioration of quality of the collateral comes to the Company’s attention as part of its problem loan monitoring process, or if discussions with the borrower lead us to believe the last appraised value no longer reflects the actual market for the collateral. The impairment amount on a collateral-dependent loan is charged-off to the allowance if deemed not collectible and the impairment amount on a loan that is not collateral-dependent is set up as a specific reserve.
Assets acquired through, or in lieu of, loan foreclosure are held for sale and are initially recorded at fair value less estimated selling costs. Any write-down to fair value at the time of transfer to other real estate owned is charged to the allowance for loan losses. Subsequent to foreclosure, valuations are periodically performed by management and the assets are carried at the lower of carrying amount or fair value less estimated costs to sell. Costs of improvements are capitalized, whereas costs related to holding other real estate owned and subsequent write-downs to the value are expensed. Any gains and losses realized at the time of disposal are reflected in income.
Real estate, which the Company acquires as a result of foreclosure or by deed-in-lieu of foreclosure, is classified as other real estate owned (“OREO”) until sold and is initially recorded at fair value less costs to sell when acquired, establishing a new carrying value. OREO totaled $10.2 million at March 31, 2021. Of this amount, $10.0 million, or 98.0%, are two commercial properties. One property for $2.9 million, located in Birmingham, Alabama, is under contract for sale with no loss expected. The second property for $7.1 million is
83
Table of Contents
located in Oxford, Alabama. There is significant interest in the property and a sale in 2021 is expected, pending the expiration of the borrower’s statutory right of redemption.
Nonperforming loans include nonaccrual loans and loans past due 90 days or more. Nonperforming assets consist of nonperforming loans plus OREO and collateral taken in foreclosure or similar proceedings.
Nonperforming loans were $3.9 million at March 31, 2021, which is all in nonaccruals. The Company did not have any loans 90 days past due at March 31, 2021. Of this total, $1.5 million, representing three properties that are under contract for sale, are expected to pay off the loans. The only other significant loan is a $873,000 church loan, which struggled through the pandemic, but is presently current and paying as agreed.
Total nonperforming loans increased approximately $348,000 from December 31, 2020 to March 31, 2021. The net increase was primarily the result of two loans added as non-accruing and offset by one loan that paid off. Total nonperforming loans decreased approximately $10.3 million from December 31, 2019 to December 31, 2020. The decrease was substantially the result of two foreclosures which are currently held in OREO.
The following table presents the contractual aging of the recorded investment and loan discount in current and past due loans by class of loans as of March 31, 2021, December 31, 2020 and 2019:
| Contractual Aging of Recorded Investments | ||||||||||||||||||||
| As of March 31, 2021 |
Current | 30-89 Days Past Due |
90+ Days Past Due |
Nonaccrual | Total | |||||||||||||||
| (Dollars in thousands) | ||||||||||||||||||||
| Real Estate Mortgages: |
||||||||||||||||||||
| Construction & Development |
$ | 120,063 | $ | 74 | $ | — | $ | 1,062 | $ | 121,199 | ||||||||||
| Residential Mortgages |
150,423 | 635 | — | 825 | 151,883 | |||||||||||||||
| Commercial Real Estate Mortgages |
572,647 | 803 | — | 1,572 | 575,022 | |||||||||||||||
| Commercial & Industrial |
229,439 | 335 | — | 383 | 230,157 | |||||||||||||||
| Consumer and other |
9,171 | 14 | — | 15 | 9,200 | |||||||||||||||
|
|
|
|
|
|
|
|
|
|
|
|||||||||||
| Total loans |
$ | 1,081,743 | $ | 1,861 | $ | — | $ | 3,857 | $ | 1,087,461 | ||||||||||
|
|
|
|
|
|
|
|
|
|
|
|||||||||||
| Contractual Aging of Recorded Investments | ||||||||||||||||||||
| As of December 31, 2020 |
Current | 30-89 Days Past Due |
90+ Days Past Due |
Nonaccrual | Total | |||||||||||||||
| (Dollars in thousands) | ||||||||||||||||||||
| Real Estate Mortgages: |
||||||||||||||||||||
| Construction & Development |
$ | 101,375 | $ | 207 | $ | — | $ | 977 | $ | 102,559 | ||||||||||
| Residential Mortgages |
150,837 | 476 | 42 | 857 | 152,212 | |||||||||||||||
| Commercial Real Estate Mortgages |
512,208 | 1,196 | 41 | 1,478 | 514,923 | |||||||||||||||
| Commercial & Industrial |
252,473 | 1,838 | — | 84 | 254,395 | |||||||||||||||
| Consumer and other |
9,581 | 33 | 8 | 22 | 9,644 | |||||||||||||||
|
|
|
|
|
|
|
|
|
|
|
|||||||||||
| Total loans |
$ | 1,026,474 | $ | 3,750 | $ | 91 | $ | 3,418 | $ | 1,033,733 | ||||||||||
|
|
|
|
|
|
|
|
|
|
|
|||||||||||
| Contractual Aging of Recorded Investments | ||||||||||||||||||||
| As of December 31, 2019 |
Current | 30-89 Days Past Due |
90+ Days Past Due |
Nonaccrual | Total | |||||||||||||||
| (Dollars in thousands) | ||||||||||||||||||||
| Real Estate Mortgages: |
||||||||||||||||||||
| Construction & Development |
$ | 91,056 | $ | 548 | $ | — | $ | 1,407 | $ | 93,011 | ||||||||||
| Residential Mortgages |
150,711 | 730 | — | 871 | 152,312 | |||||||||||||||
| Commercial Real Estate Mortgages |
429,367 | 1,486 | 132 | 10,961 | 441,946 | |||||||||||||||
| Commercial & Industrial |
137,810 | 1,523 | 319 | 113 | 139,765 | |||||||||||||||
| Consumer and other |
11,730 | 225 | — | — | 11,955 | |||||||||||||||
|
|
|
|
|
|
|
|
|
|
|
|||||||||||
| Total loans |
$ | 820,674 | $ | 4,512 | $ | 451 | $ | 13,352 | $ | 838,989 | ||||||||||
|
|
|
|
|
|
|
|
|
|
|
|||||||||||
84
Table of Contents
Nonperforming Assets
The following table sets forth the allocation of the Company’s nonperforming assets among different asset categories as of the dates indicated. Nonperforming assets consist of nonperforming loans plus OREO and repossessed property. Nonperforming loans include nonaccrual loans and loans past due 90 days or more.
| As of March 31, |
As of December 31, | |||||||||||||||||||||||
| 2021 | 2020 | 2019 | 2018 | 2017 | 2016 | |||||||||||||||||||
| (Dollars in Thousands) | ||||||||||||||||||||||||
| Nonaccrual loans |
$ | 3,857 | $ | 3,418 | $ | 13,352 | $ | 3,874 | $ | 749 | $ |
1,806 |
| |||||||||||
| Past due loans 90 days or more and still accruing |
— | 91 | 451 | — | 6 | |
217 |
| ||||||||||||||||
| Total nonperforming loans |
3,857 | 3,509 | 13,803 | 3,874 | 755 | |
2,023 |
| ||||||||||||||||
| OREO |
10,229 | 10,224 | 4,238 | 572 | 499 | |
98 |
| ||||||||||||||||
| Repossessed equipment |
— | — | 2,804 | — | — | — | ||||||||||||||||||
|
|
|
|
|
|
|
|
|
|
|
|
|
|||||||||||||
| Total nonperforming assets |
$ | 14,086 | $ | 13,733 | $ | 20,845 | $ | 4,446 | $ | 1,254 | $ | 2,121 | ||||||||||||
|
|
|
|
|
|
|
|
|
|
|
|
|
|||||||||||||
| Troubled debt restructured loans - nonaccrual(1) |
$ | 731 | $ | 479 | $ | 313 | $ | 1,641 | $ | 1,820 | $ | 2,470 | ||||||||||||
| Troubled debt restructured loans - accruing |
$ | 1,005 | $ | 1,275 | $ | 2,712 | $ | 189 | $ | 292 | $ |
421 |
| |||||||||||
| Allowance for loan losses |
$ | 12,605 | $ | 11,859 | $ | 9,265 | $ | 7,833 | $ | 5,754 | $ |
4,949 |
| |||||||||||
| Gross loans outstanding at end of period |
$ | 1,087,461 | $ | 1,033,733 | $ | 838,989 | $ | 705,299 | $ | 567,585 | $ |
502,276 |
| |||||||||||
| Nonperforming loans to gross loans |
0.35 | % | 0.34 | % | 1.65 | % | 0.55 | % | 0.13 | % | |
0.40 |
% | |||||||||||
| Nonperforming assets to gross loans and OREO |
1.28 | % | 1.32 | % | 2.47 | % | 0.63 | % | 0.22 | % | |
0.42 |
% | |||||||||||
| Allowance for loan losses to nonperforming loans |
326.8 | % | 338.0 | % | 67.13 | % | 202.20 | % | 761.78 | % | |
244.70 |
% | |||||||||||
| Allowance for loan losses to gross loans |
1.16 | % | 1.15 | % | 1.11 | % | 1.10 | % | 1.01 | % | |
0.99 |
% | |||||||||||
| Nonaccrual loans by category: |
||||||||||||||||||||||||
| Real Estate: |
||||||||||||||||||||||||
| Construction & Development |
$ | 1,062 | $ | 977 | $ | 1,407 | $ | 47 | $ | 130 | $ |
245 |
| |||||||||||
| Residential Mortgages |
825 | 857 | 871 | 217 | 414 | |
891 |
| ||||||||||||||||
| Commercial Real Estate Mortgages |
$ | 1,572 | 1,478 | 10,961 | 3,427 | 162 | |
422 |
| |||||||||||||||
| Commercial & Industrial: |
383 | 84 | 113 | 183 | 36 | |
241 |
| ||||||||||||||||
| Consumer and other |
15 | 22 | — | — | 7 | |
7 |
| ||||||||||||||||
|
|
|
|
|
|
|
|
|
|
|
|
|
|||||||||||||
| Total |
$ | 3,857 | $ | 3,418 | $ | 13,352 | $ | 3,874 | $ | 749 | $ |
1,806 |
| |||||||||||
|
|
|
|
|
|
|
|
|
|
|
|
|
|||||||||||||
| (1) | Troubled debt restructured loans are excluded from nonperforming loans unless they otherwise meet the definition of nonaccrual loans or are more than 90 days past due. |
Repossessed equipment was sold in October 2020.
Troubled Debt Restructurings
A loan is considered a troubled debt restructuring (“TDR”) based on individual facts and circumstances. The Company designates loan modifications as TDRs when for economic or legal reasons related to the borrower’s financial difficulties, it grants a concession to the borrower that it would not otherwise consider. These concessions may include rate reductions, principal forgiveness, extension of maturity date and other actions intended to minimize potential losses.
85
Table of Contents
In determining whether a borrower is experiencing financial difficulties, the Company considers if the borrower is in payment default or would be in payment default in the foreseeable future without the modification, the borrower declared or is in the process of declaring bankruptcy, the borrower’s projected cash flows will not be sufficient to service any of its debt, or the borrower cannot obtain funds from sources other than the Company at a market rate for debt with similar risk characteristics.
In determining whether the Company will grant a concession, the Company assesses if it expects to collect all amounts due, whether the current value of the collateral will satisfy the amounts owed, if additional collateral or guarantees from the borrower will serve as adequate compensation for other terms of the restructuring, and whether the borrower otherwise has access to funds at a market rate for debt with similar risk characteristics.
The Company had two TDR loans during the first quarter of 2021 for approximately $253,000, two TDR loans in 2020 for approximately $286,000, and two TDR loans in 2019 for approximately $298,000. TDRs are excluded from the Company’s nonperforming loans unless they otherwise meet the definition of nonaccrual loans or are past due 90 days or more after the restructuring. The balance of TDR loans as of March 31, 2021, December 31, 2020 and December 31, 2019, was $1.7 million, $1.8 million and $3.0 million, respectively.
Credit Quality
Credit quality and trends in the loan portfolio segments are measured and monitored regularly. Detailed reports, by product, collateral, accrual status, etc., are reviewed by the Chief Credit Officer, Officers Loan Committee and Directors Loan Committee.
In addition to the past due and nonaccrual criteria, the Company also evaluates loans according to its internal risk grading system. Loans are segregated between pass, special mention, substandard, doubtful and loss categories, which conform to regulatory definitions. A description of the general characteristics of the risk categories and definitions of those segregations follows:
Pass: A pass loan is a strong credit with no existing or known potential weaknesses deserving of management’s close attention.
Special mention: These loans have potential weaknesses that deserve management’s close attention. If left uncorrected, these potential weaknesses may result in deterioration of the repayment prospects for the loan or in the institution’s credit position at some future date. These loans are not adversely classified and do not expose an institution to sufficient risk to warrant adverse classification.
Substandard: Substandard loans are inadequately protected by the current sound worth and paying capacity of the obligor or of the collateral pledged, if any. Loans so classified have a well-defined weakness or weaknesses that jeopardize the liquidation of the debt. They are characterized by the distinct possibility that the institution will sustain some loss if the deficiencies are not corrected.
Doubtful: Loans classified as doubtful have all the weaknesses inherent in those classified as substandard with the added characteristic that the weaknesses make collection or liquidation in full, on the basis of currently known facts, conditions, and values, highly questionable and improbable.
Loss: Loans classified as a loss are considered uncollectible and of such little value that their continuance as bankable assets is not warranted. This classification does not mean that the loan has absolutely no recovery or salvage value but rather it is not practical or desirable to defer writing off this basically worthless asset even though partial recovery may be effected in the future.
86
Table of Contents
The following tables summarize the risk category of the Company’s loan portfolio based upon the most recent analysis performed as of December 31, 2020 and 2019:
| Outstanding Loan Balance by Internal Risk Grades | ||||||||||||||||||||
| As of March 31, 2021 |
Pass | Special Mention | Substandard | Doubtful | Total | |||||||||||||||
| (Dollars in thousands) | ||||||||||||||||||||
| Real Estate: |
||||||||||||||||||||
| Construction & Development |
$ | 113,350 | $ | 2,087 | $ | 5,762 | $ | — | $ | 121,199 | ||||||||||
| Residential Mortgages |
144,505 | 5,847 | 1,425 | 106 | 151,883 | |||||||||||||||
| Commercial Real Estate Mortgages |
544,233 | 24,557 | 6,232 | — | 575,022 | |||||||||||||||
| Commercial & Industrial |
218,689 | 10,885 | 317 | 266 | 230,157 | |||||||||||||||
| Consumer and other |
7,768 | 1,417 | 15 | — | 9,200 | |||||||||||||||
|
|
|
|
|
|
|
|
|
|
|
|||||||||||
| Total loans |
$ | 1,028,545 | $ | 44,793 | $ | 13,751 | $ | 372 | $ | 1,087,461 | ||||||||||
|
|
|
|
|
|
|
|
|
|
|
|||||||||||
| Outstanding Loan Balance by Internal Risk Grades | ||||||||||||||||||||
| As of December 31, 2020 |
Pass | Special Mention | Substandard | Doubtful | Total | |||||||||||||||
| (Dollars in thousands) | ||||||||||||||||||||
| Real Estate: |
||||||||||||||||||||
| Construction & Development |
$ | 95,214 | $ | 6,113 | $ | 1,232 | $ | — | $ | 102,559 | ||||||||||
| Residential Mortgages |
144,256 | 6,245 | 1,627 | 84 | 152,212 | |||||||||||||||
| Commercial Real Estate Mortgages |
471,555 | 36,754 | 6,614 | — | 514,923 | |||||||||||||||
| Commercial & Industrial: |
240,646 | 13,138 | 611 | — | 254,395 | |||||||||||||||
| Consumer and other |
8,186 | 1,435 | 23 | — | 9,644 | |||||||||||||||
|
|
|
|
|
|
|
|
|
|
|
|||||||||||
| Total loans |
$ | 959,857 | $ | 63,685 | $ | 10,107 | $ | 84 | $ | 1,033,733 | ||||||||||
|
|
|
|
|
|
|
|
|
|
|
|||||||||||
| Outstanding Loan Balance by Internal Risk Grades | ||||||||||||||||||||
| As of December 31, 2019 |
Pass | Special Mention | Substandard | Doubtful | Total | |||||||||||||||
| (Dollars in thousands) | ||||||||||||||||||||
| Real Estate: |
||||||||||||||||||||
| Construction & Development |
$ | 82,250 | $ | 8,523 | $ | 2,238 | $ | — | $ | 93,011 | ||||||||||
| Residential Mortgages |
143,864 | 4,717 | 3,631 | 100 | 152,312 | |||||||||||||||
| Commercial Real Estate Mortgages |
406,726 | 17,530 | 17,690 | — | 441,946 | |||||||||||||||
| Commercial & Industrial: |
118,288 | 20,368 | 1,109 | — | 139,765 | |||||||||||||||
| Consumer and other |
10,423 | 1,532 | — | — | 11,955 | |||||||||||||||
|
|
|
|
|
|
|
|
|
|
|
|||||||||||
| Total loans |
$ | 761,551 | $ | 52,670 | $ | 24,668 | $ | 100 | $ | 838,989 | ||||||||||
|
|
|
|
|
|
|
|
|
|
|
|||||||||||
Securities Portfolio
The securities portfolio serves the following purposes: (i) it provides liquidity supplement cash flows from the loan and deposit activities of customers; (ii) it can be used as an interest rate risk management tool since it provides a large base of assets and the Company can change the maturity and interest rate characteristics more readily than the loan portfolio to better match changes in the deposit base and other Company funding sources; (iii) it is an alternative interest-earning asset when loan demand is weak or when deposits grow more rapidly than loans; and (iv) it provides a source of pledged assets for securing certain deposits and borrowed funds, as may be required by law or by specific agreement with a depositor or lender.
The securities portfolio consists of securities classified as available-for-sale. All available-for-sale securities are reported at fair value. Securities available-for-sale consist primarily of state and municipal securities, mortgage-backed securities and U.S. government sponsored agency securities. We determine the appropriate classification at the time of purchase.
87
Table of Contents
The following table summarizes the fair value of the securities portfolio as of the dates presented.
| March 31, 2021 | December 31, 2020 | December 31, 2019 | ||||||||||||||||||||||||||||||||||
| Amortized Cost |
Fair Value |
Unrealized Gain/(Loss) |
Amortized Cost |
Fair Value |
Unrealized Gain/(Loss) |
Amortized Cost |
Fair Value |
Unrealized Gain/(Loss) |
||||||||||||||||||||||||||||
| (Dollars in thousands) | ||||||||||||||||||||||||||||||||||||
|
Available-for-sale |
||||||||||||||||||||||||||||||||||||
| U.S. treasury |
$ | 2,665 | $ | 2,663 | $ | (2 | ) | $ | — | $ | — | $ | — | $ | — | $ | — | $ | — | |||||||||||||||||
| U.S. government and agencies |
9,311 | 9,376 | 65 | 9,154 | 9,366 | 212 | 7,258 | 7,165 | (93 | ) | ||||||||||||||||||||||||||
| State and municipal |
57,168 | 58,984 | 1,816 | 64,468 | 67,941 | 3,473 | 29,239 | 29,659 | 420 | |||||||||||||||||||||||||||
| Mortgage-backed securities |
16,641 | 16,904 | 263 | 18,753 | 19,114 | 361 | 20,545 | 20,490 | (55 | ) | ||||||||||||||||||||||||||
| Asset based securities |
8,956 | 9,106 | 150 | 9,035 | 9,111 | 76 | — | — | — | |||||||||||||||||||||||||||
| Corporate debt securities |
9,033 | 9,184 | 151 | 8,286 | 8,469 | 183 | 2,547 | 2,633 | 86 | |||||||||||||||||||||||||||
|
|
|
|
|
|
|
|
|
|
|
|
|
|
|
|
|
|
|
|||||||||||||||||||
| Total available-for-sale |
$ | 103,774 | $ | 106,217 | $ | 2,443 | $ | 109,696 | $ | 114,001 | $ | 4,305 | $ | 59,589 | $ | 59,947 | $ | 358 | ||||||||||||||||||
|
|
|
|
|
|
|
|
|
|
|
|
|
|
|
|
|
|
|
|||||||||||||||||||
Certain securities have fair values less than amortized cost and, therefore, contain unrealized losses. At March 31, 2021, we evaluated the securities that had an unrealized loss for other-than-temporary impairment and determined all declines in value to be temporary. We anticipate full recovery of amortized cost with respect to these securities by maturity, or sooner in the event of a more favorable market interest rate environment. We do not intend to sell these securities and it is not probable that we will be required to sell them before recovery of the amortized cost basis, which may be at maturity.
The following table sets forth certain information regarding contractual maturities and the weighted average yields of our investment securities as of March 31, 2021 and December 31, 2020. Expected maturities may differ from contractual maturities if borrowers have the right to call or prepay obligations with or without call or prepayment penalties.
| As of March 31, 2021 | ||||||||||||||||||||||||||||||||
| Due in One Year or less |
Due after One Year through Five Years |
Due after Five Years through Ten Years |
Due after Ten Years | |||||||||||||||||||||||||||||
| Amortized Cost |
Weighted Average Yield |
Amortized Cost |
Weighted Average Yield |
Amortized Cost |
Weighted Average Yield |
Amortized Cost |
Weighted Average Yield |
|||||||||||||||||||||||||
| (Dollars in thousands) | ||||||||||||||||||||||||||||||||
|
Available-for-sale |
||||||||||||||||||||||||||||||||
| U.S. treasury securities |
$ | — | — | % | $ | — | — | % | $ | 2,665 | 1.33 | % | $ | — | — | % | ||||||||||||||||
| U.S. government and agencies |
— | — | — | — | 5,824 | 1.70 | % | 3,487 | 1.64 | % | ||||||||||||||||||||||
| State and municipal |
— | — | 662 | 1.17 | % | 2,631 | 2.15 | % | 53,875 | 2.36 | % | |||||||||||||||||||||
| Mortgage-backed securities |
— | — | — | — | 4,863 | 1.03 | % | 11,778 | 0.79 | % | ||||||||||||||||||||||
| Asset based securities |
— | — | — | — | — | — | 8,956 | 0.92 | % | |||||||||||||||||||||||
| Corporate debt securities |
— | — | 533 | 3.20 | % | 8,500 | 4.97 | % | — | — | ||||||||||||||||||||||
|
|
|
|
|
|
|
|
|
|
|
|
|
|
|
|
|
|||||||||||||||||
| Total available-for-sale |
$ | — | — | % | $ | 1,195 | 2.08 | % | $ | 24,483 | 2.71 | % | $ | 78,096 | 1.92 | % | ||||||||||||||||
|
|
|
|
|
|
|
|
|
|
|
|
|
|
|
|
|
|||||||||||||||||
88
Table of Contents
| As of December 31, 2020 | ||||||||||||||||||||||||||||||||
| Due in One Year or less |
Due after One Year through Five Years |
Due after Five Years through Ten Years |
Due after Ten Years | |||||||||||||||||||||||||||||
| Amortized Cost |
Weighted Average Yield |
Amortized Cost |
Weighted Average Yield |
Amortized Cost |
Weighted Average Yield |
Amortized Cost |
Weighted Average Yield |
|||||||||||||||||||||||||
| (Dollars in thousands) | ||||||||||||||||||||||||||||||||
|
Available-for-sale |
||||||||||||||||||||||||||||||||
| U.S. government and agencies |
$ | — | — | $ | — | — | $ | 6,149 | 1.17 | % | $ | 3,005 | 2.26 | % | ||||||||||||||||||
| State and municipal |
— | — | 664 | 1.26 | % | 1,618 | 2.50 | % | 62,186 | 2.82 | % | |||||||||||||||||||||
| Mortgage-backed securities |
— | — | — | — | 4,967 | 1.14 | % | 13,786 | 1.20 | % | ||||||||||||||||||||||
| Asset based securities |
— | — | — | — | — | — | 9,035 | 0.94 | % | |||||||||||||||||||||||
| Corporate debt securities |
— | — | 536 | 3.18 | % | 7,750 | 4.81 | % | — | — | ||||||||||||||||||||||
|
|
|
|
|
|
|
|
|
|
|
|
|
|
|
|
|
|||||||||||||||||
| Total available-for-sale |
$ | — | — | $ | 1,200 | 2.12 | % | $ | 20,484 | 2.67 | % | $ | 88,012 | 2.35 | % | |||||||||||||||||
|
|
|
|
|
|
|
|
|
|
|
|
|
|
|
|
|
|||||||||||||||||
Bank-Owned Life Insurance
We maintain investments in BOLI policies to help control employee benefit costs, as a protection against loss of certain employees and as a tax planning strategy. We are the sole owner and beneficiary of the BOLI policies. At March 31, 2021, BOLI totaled $22.6 million compared to $22.5 million and $22.1 million at December 31, 2020 and 2019, respectively. The increase represents increases in the cash surrender value net of a slight reduction in the policies’ total value due to an insured’s death.
Deposits
Deposits represent the Company’s primary and most vital source of funds. We offer a variety of deposit products including demand deposits accounts, interest-bearing products, savings accounts and certificates of deposit. The Bank also acquires brokered deposits, QwickRate internet certificates of deposit, and reciprocal deposits through the Promontory network. The reciprocal deposits include both the Certificate of Deposit Account Registry Service (“CDARS”) and Insured Cash Sweep program. The Company is a member of the Promontory network which effectively allows depositors to receive FDIC insurance on amounts greater than the FDIC insurance limit, which is currently $250,000. Promontory allows institutions to break large deposits into smaller amounts and place them in a network of other Promontory institutions to ensure full FDIC insurance is gained on the entire deposit. Generally, internet and reciprocal deposits are not brokered deposits for regulatory purposes.
Our strong asset growth requires us to place a greater emphasis on both interest and non-interest-bearing deposits. Deposit accounts are added by loan production cross-selling, customer referrals, marketing advertisements, mobile and online banking and our involvement within our communities.
Total deposits at March 31,2021 were $1.3 billion, representing an increase of $120.4 million, or 10.6%, compared to $1.1 billion at December 31, 2020. Total deposits at December 31, 2020 were $1.1 billion, representing an increase of $189.1 million, or 19.9%, compared to $950.5 million at December 31, 2019. As of March 31, 2021, 29.0% of total deposits were comprised of noninterest-bearing demand accounts, 45.0% of interest-bearing non-maturity accounts and 26.0% of time deposits.
89
Table of Contents
The following table summarizes our deposit balances as of March 31, 2021, December 31, 2020 and 2019:
| As of December 31, |
||||||||||||||||||||||||
| As of March 31, 2021 |
2020 | 2019 | ||||||||||||||||||||||
| Balance | % of Total |
Balance | % of Total |
Balance | % of Total |
|||||||||||||||||||
|
|
|
|
|
|
|
|
|
|
|
|||||||||||||||
| (Dollars in thousands) | ||||||||||||||||||||||||
| Noninterest-bearing deposits |
365,114 | 28.98 | % | $ | 290,867 | 25.52 | % | $ | 188,270 | 19.81 | % | |||||||||||||
| Interest-bearing deposits: |
||||||||||||||||||||||||
| NOW, savings and money market |
566,486 | 44.96 | % | 518,488 | 45.50 | % | 404,113 | 42.51 | % | |||||||||||||||
| Time deposits |
328,444 | 26.07 | % | 330,306 | 28.98 | % | 358,130 | 37.68 | % | |||||||||||||||
|
|
|
|
|
|
|
|
|
|
|
|
|
|||||||||||||
| Total interest-bearing deposits |
894,930 | 71.02 | % | 848,794 | 74.48 | % | 762,243 | 80.19 | % | |||||||||||||||
|
|
|
|
|
|
|
|
|
|
|
|
|
|||||||||||||
| Total deposits |
1,260,044 | 100.0 | % | $ | 1,139,661 | 100.00 | % | $ | 950,513 | 100.00 | % | |||||||||||||
|
|
|
|
|
|
|
|
|
|
|
|
|
|||||||||||||
The following tables set forth the maturity of time deposits as of March 31, 2021, December 31, 2020 and 2019:
| As of March 31, 2021 Maturity Within: |
||||||||||||||||||||
| Three Months |
Three Months Through 12 Months |
Over 12 Months Through 3 Years |
Over 3 Years |
Total | ||||||||||||||||
| (Dollars in thousands) | ||||||||||||||||||||
| Time deposits ($250,000 or less) |
$ | 91,832 | $ | 134,746 | $ | 49,921 | $ | 17,043 | $ | 293,542 | ||||||||||
| Time deposits (more than $250,000) |
16,920 | 15,152 | 921 | 1,909 | 34,902 | |||||||||||||||
|
|
|
|
|
|
|
|
|
|
|
|||||||||||
| Total time deposits |
$ | 108,752 | $ | 149,898 | $ | 50,842 | $ | 18,952 | $ | 328,444 | ||||||||||
|
|
|
|
|
|
|
|
|
|
|
|||||||||||
| As of December 31, 2020 Maturity Within: |
||||||||||||||||||||
| Three Months |
Three Months Through 12 Months |
Over 12 Months Through 3 Years |
Over 3 Years |
Total | ||||||||||||||||
| (Dollars in thousands) | ||||||||||||||||||||
| Time deposits ($250,000 or less) |
$ | 73,834 | $ | 158,059 | $ | 43,675 | $ | 18,139 | $ | 293,707 | ||||||||||
| Time deposits (more than $250,000) |
9,023 | 24,753 | 604 | 2,219 | 36,599 | |||||||||||||||
|
|
|
|
|
|
|
|
|
|
|
|||||||||||
| Total time deposits |
$ | 82,857 | $ | 182,812 | $ | 44,279 | $ | 20,358 | $ | 330,306 | ||||||||||
|
|
|
|
|
|
|
|
|
|
|
|||||||||||
| As of December 31, 2019 Maturity Within: |
||||||||||||||||||||
| Three Months |
Three Months Through 12 Months |
Over 12 Months Through 3 Years |
Over 3 Years |
Total | ||||||||||||||||
| (Dollars in thousands) | ||||||||||||||||||||
| Time deposits ($250,000 or less) |
$ | 73,431 | $ | 203,454 | $ | 25,078 | $ | 9,925 | $ | 311,888 | ||||||||||
| Time deposits (more than $250,000) |
9,505 | 34,343 | 1,631 | 763 | 46,242 | |||||||||||||||
|
|
|
|
|
|
|
|
|
|
|
|||||||||||
| Total time deposits |
$ | 82,936 | $ | 237,797 | $ | 26,709 | $ | 10,689 | $ | 358,130 | ||||||||||
|
|
|
|
|
|
|
|
|
|
|
|||||||||||
Time deposits issued in amounts of more than $250,000 represent the type of deposit most likely to affect the Company’s future earnings because of interest rate sensitivity. The effective cost of these funds is generally higher than other time deposits because the funds are usually obtained at premium rates of interest.
Borrowed Funds
In addition to deposits, we utilize advances from the FHLB and other borrowings as a supplementary funding source to finance our operations.
90
Table of Contents
FHLB Advances. The FHLB allows us to borrow, on both short and long-term, collateralized by a blanket floating lien on first mortgage loans and commercial real estate loans as well as FHLB stock. At March 31, 2021, December 31, 2020 and December 31, 2019, we had borrowing capacity from the FHLB of $63.6 million, $65.7 million and $71.6 million, respectively. The decrease in capacity is the net of adding new collateral less $31.9 million and $30.9 million in FHLB advances as of March 31, 2021 and December 31, 2020, respectively. We had $31.9 million in short-term FHLB borrowings as of March 31, 2021, $30.9 million as of December 31, 2020, of none as of December 31, 2019. We had no long-term FHLB borrowings as of March 31, 2021, December 31, 2020 and 2019. All our outstanding FHLB advances have fixed rates of interest.
The following table sets forth our FHLB borrowings as of December 31, 2020 and 2019:
| As of March 31, | As of December 31, | |||||||||||
| 2021 | 2020 | 2019 | ||||||||||
| (Dollars in thousands) |
||||||||||||
| Amount outstanding at end of period |
$ | 31,900 | $ | 30,900 | $ | — | ||||||
| Weighted average interest rate at end of period |
0.43 | % | 0.73 | % | — | |||||||
| Maximum month-end balance |
$ | 36,900 | $ | 32,750 | $ | 7,500 | ||||||
| Average balance outstanding during the period |
$ | 33,244 | $ | 21,448 | $ | 1,364 | ||||||
| Weighted average interest rate during the period |
0.62 | % | 2.50 | % | 2.78 | % | ||||||
Lines of Credit. The Bank has uncollateralized, uncommitted federal funds lines of credit with multiple banks as a source of funding for liquidity management. The total amount of the lines of credit was $87.2 million as of March 31, 2021 and December 31, 2020, and $35.7 million as of 2019, all of which was available at these dates.
First Horizon Line of Credit. During 2019, the Company obtained a $25.0 million line of credit with First Horizon, which was extended in November 2020 and matures in August 2022 (the “Line of Credit”). The Line of Credit is collateralized by 100% of the capital stock of the Bank. The Line of Credit includes various financial and nonfinancial covenants. The Line of Credit has a variable interest rate of 90-day LIBOR plus 2.50% with a LIBOR floor of 0.50%, and requires quarterly interest payments. The Company utilized $8.0 million of the Line of Credit in connection with the purchase of East Alabama. The balance outstanding as of March 31, 2021 was $8.0 million.
Subordinated Debt Securities. In June 2016, the Company issued $4,500,000 of Fixed-to-Floating Rate Subordinated Notes due July 2026. The Subordinated Notes bore interest at 6.625% per annum, payable semiannually in arrears on January 1 and July 1 of each year until July 2021. Thereafter interest was payable quarterly in arrears at an annual floating rate equal to three-month LIBOR as determined for the applicable quarter plus 5.412%. The Company received approval by the Federal Reserve for repayment of the Notes, and we redeemed the Notes in full on June 23, 2021 through borrowings under our Line of Credit.
Liquidity and Capital Resources
Liquidity
Liquidity refers to the measure of our ability to meet the cash flow requirements of depositors and borrowers, while at the same time meeting our operating, capital and strategic cash flow needs, all at a reasonable cost. We continuously monitor our liquidity position to ensure that assets and liabilities are managed in a manner that will meet all short-term and long-term cash requirements. We manage our liquidity position to meet the daily cash flow needs of customers, while maintaining an appropriate balance between assets and liabilities to meet the return on investment objectives of our shareholders.
Interest rate sensitivity involves the relationships between rate-sensitive assets and liabilities and is an indication of the probable effects of interest rate fluctuations on the Company’s net interest income. Interest rate-
91
Table of Contents
sensitive assets and liabilities are those with yields or rates that are subject to change within a future time period due to maturity or changes in market rates. A model is used to project future net interest income under a set of possible interest rate movements. The Company’s Asset Liability Committee, or ALCO, reviews this information to determine if the projected future net interest income levels would be acceptable. The Company attempts to stay within acceptable net interest income levels.
Our liquidity position is supported by management of liquid assets and access to alternative sources of funds. Our liquid assets include cash, interest-bearing deposits in correspondent banks, federal funds sold, and the fair value of unpledged investment securities. Other available sources of liquidity include wholesale deposits, and additional borrowings from correspondent banks, FHLB advances and the Line of Credit.
Our short-term and long-term liquidity requirements are primarily met through cash flow from operations, redeployment of prepaying and maturing balances in our loan and investment portfolios, and increases in customer deposits. Other alternative sources of funds will supplement these primary sources to the extent necessary to meet additional liquidity requirements on either a short-term or long-term basis.
The Company and the Bank are separate corporate entities. The Company’s liquidity depends primarily upon dividends received from the Bank and capital and debt issued by the Company. The Company relies on its liquidity to pay interest and principal on Company indebtedness, company operating expenses, and dividends to Company shareholders.
Capital Requirements
We are subject to various regulatory capital requirements administered by the federal and state banking regulators. Failure to meet regulatory capital requirements may result in certain mandatory and possible additional discretionary actions by regulators that, if undertaken, could have a direct material effect on our financial statements. Under capital adequacy guidelines and the regulatory framework for “prompt corrective action” (described below), we must meet specific capital guidelines that involve quantitative measures of our assets, liabilities and certain off-balance sheet items as calculated under regulatory accounting policies. The capital amounts and classifications are subject to qualitative judgments by the federal banking regulators about components, risk weightings and other factors. See “Supervision and Regulation”.
As of March 31, 2021, both we and the Bank exceeded all the minimum bank regulatory capital requirements to be well capitalized to which we and the Bank were subject.
The table below summarizes the capital requirements applicable to us and the Bank in order to be considered “well-capitalized” from a regulatory perspective, as well as the Company’s and the Bank’s capital ratios as of March 31, 2021, December 31, 2020 and 2019. The Federal Deposit Insurance Act requires, among other things, that the federal banking regulators take prompt corrective action with respect to FDIC-insured depository institutions that do not meet certain minimum capital requirements. Under the Federal Deposit Insurance Act, insured depository institutions are divided into five capital categories: well capitalized, adequately capitalized, undercapitalized, significantly undercapitalized, and critically undercapitalized. Under applicable regulations, an institution is defined to be well capitalized if it has a common equity tier 1 capital ratio (“CET1 capital”) of 6.5%, a leverage ratio of at least 5%, a tier 1 risk-based capital ratio of at least 8%, and a total risk-based capital ratio of at least 10%, and it is not subject to a directive, order or written agreement to meet and maintain specific capital levels.
92
Table of Contents
We and the Bank exceeded all regulatory capital requirements under Basel III and the Bank met all the minimum capital adequacy requirements to be considered “well-capitalized” as of the dates reflected in the table below.
| Actual | Minimum To be Considered “Well Capitalized” |
|||||||||||||||
| Amount | Ratio | Amount | Ratio | |||||||||||||
| (Dollars in thousandth) | ||||||||||||||||
| As of March 31, 2021 | ||||||||||||||||
| Tier 1 capital (to average assets) |
||||||||||||||||
| Company |
$ | 124,231 | 9.21 | % | — | — | ||||||||||
| Bank |
$ | 136,185 | 10.10 | % | $ | 67,422 | 5.00 | % | ||||||||
| CET 1 capital (to risk-weighted assets) |
||||||||||||||||
| Company |
$ | 124,231 | 10.19 | % | — | — | ||||||||||
| Bank |
$ | 136,185 | 11.17 | % | $ | 79,217 | 6.50 | % | ||||||||
| Tier 1 capital (to risk-weighted assets) |
||||||||||||||||
| Company |
$ | 124,231 | 10.19 | % | — | — | ||||||||||
| Bank |
$ | 136,185 | 11.17 | % | $ | 97,498 | 8.00 | % | ||||||||
| Total capital (to risk-weighted assets) |
||||||||||||||||
| Company |
$ | 141,336 | 11.60 | % | — | — | ||||||||||
| Bank |
$ | 148,790 | 12.21 | % | $ | 121,872 | 10.00 | % | ||||||||
| Minimum To be Considered “Well Capitalized” |
||||||||||||||||
| Actual | ||||||||||||||||
| Amount | Ratio | Amount | Ratio | |||||||||||||
| (Dollars in thousands) | ||||||||||||||||
| As of December 31, 2020: |
||||||||||||||||
| Tier 1 capital (to average assets) |
||||||||||||||||
| Company |
118,837 | 9.24 | % | — | — | |||||||||||
| Bank |
130,852 | 10.18 | % | 77,139 | 5.00 | % | ||||||||||
| CET 1 capital (to risk-weighted assets) |
||||||||||||||||
| Company |
118,837 | 10.63 | % | — | — | |||||||||||
| Bank |
130,852 | 11.70 | % | 72,667 | 6.50 | % | ||||||||||
| Tier 1 capital (to risk-weighted assets) |
||||||||||||||||
| Company |
118,837 | 10.63 | % | — | — | |||||||||||
| Bank |
130,852 | 11.70 | % | 89,436 | 8.00 | % | ||||||||||
| Total capital (to risk-weighted assets) |
||||||||||||||||
| Company |
$ | 135,196 | 12.09 | % | — | — | ||||||||||
| Bank |
142,711 | 12.77 | % | 111,795 | 10.00 | % | ||||||||||
| Actual | Minimum To be Considered “Well Capitalized” |
|||||||||||||||
| Amount | Ratio | Amount | Ratio | |||||||||||||
| (Dollars in thousands) | ||||||||||||||||
| As of December 31, 2019: |
||||||||||||||||
| Tier 1 capital (to average assets) |
||||||||||||||||
| Company |
107,484 | 9.78 | % | — | — | |||||||||||
| Bank |
119,121 | 10.84 | % | 54,923 | 5.00 | % | ||||||||||
| CET 1 capital (to risk-weighted assets) |
||||||||||||||||
| Company |
107,484 | 11.24 | % | — | — | |||||||||||
| Bank |
119,121 | 12.46 | % | 62,138 | 6.50 | % | ||||||||||
| Tier 1 capital (to risk-weighted assets) |
||||||||||||||||
| Company |
107,484 | 11.24 | % | — | — | |||||||||||
| Bank |
119,121 | 12.46 | % | 76,478 | 8.00 | % | ||||||||||
| Total capital (to risk-weighted assets) |
||||||||||||||||
| Company |
$ | 121,249 | 12.68 | % | — | — | ||||||||||
| Bank |
128,386 | 13.43 | % | 95,597 | 10.00 | % | ||||||||||
93
Table of Contents
Contractual Obligations
The following tables contain supplemental information regarding our total contractual obligations at March 31, 2021, and December 31, 2019:
| Payments Due at March 31, 2021 | ||||||||||||||||
| Within One Year |
One to Five Years |
After Five Years |
Total | |||||||||||||
| (Dollars in thousands) | ||||||||||||||||
| Time deposits |
$ | 258,650 | $ | 69,608 | $ | 186 | $ | 328,444 | ||||||||
| Short-term borrowings |
— | 8,000 | — | 8,000 | ||||||||||||
| Subordinated debt securities |
— | — | 4,500 | 4,500 | ||||||||||||
|
|
|
|
|
|
|
|
|
|||||||||
| Total contractual obligations |
$ | 258,650 | $ | 77,608 | $ | 4,686 | $ | 340,944 | ||||||||
|
|
|
|
|
|
|
|
|
|||||||||
| Payments Due at December 31, 2020 | ||||||||||||||||
| Within One Year |
One to Five Years |
After Five Years |
Total | |||||||||||||
| (Dollars in thousands) | ||||||||||||||||
| Time deposits |
$ | 265,668 | $ | 64,395 | $ | 243 | $ | 330,306 | ||||||||
| Short-term borrowings |
— | 8,000 | — | 8,000 | ||||||||||||
| Subordinated debt securities |
— | — | 4,500 | 4,500 | ||||||||||||
|
|
|
|
|
|
|
|
|
|||||||||
| Total contractual obligations |
$ | 265,668 | $ | 72,395 | $ | 4,743 | $ | 342,806 | ||||||||
|
|
|
|
|
|
|
|
|
|||||||||
| Payments Due at December 31, 2019 | ||||||||||||||||
| Within One Year |
One to Five Years |
After Five Years |
Total | |||||||||||||
| (Dollars in thousands) | ||||||||||||||||
| Time deposits |
$ | 320,773 | $ | 37,155 | $ | 243 | $ | 358,171 | ||||||||
| FHLB advances |
8,000 | — | — | 8,000 | ||||||||||||
| Subordinated debt securities |
— | — | 4,500 | 4,500 | ||||||||||||
|
|
|
|
|
|
|
|
|
|||||||||
| Total contractual obligations |
$ | 328,773 | $ | 37,155 | $ | 4,743 | $ | 370,671 | ||||||||
|
|
|
|
|
|
|
|
|
|||||||||
We believe that we will be able to meet our contractual obligations as they come due through the maintenance of adequate cash levels. We expect to maintain adequate cash levels through profitability, loan and securities repayment and maturity activity and continued deposit gathering activities. We have in place various borrowing mechanisms for both short-term and long-term liquidity needs.
Off-Balance Sheet Arrangements
We are a party to financial instruments with off-balance sheet risk in the normal course of business to meet the financing needs of our customers. These financial instruments include commitments to extend credit and standby letters of credit. Those instruments involve, to varying degrees, elements of credit and interest rate risk in excess of the amount recognized in the consolidated balance sheets. The Company’s exposure to credit loss in the event of nonperformance by the other party to the financial instrument for commitments to extend credit and standby letters of credit to our customers is represented by the contractual or notional amount of those instruments. Commitments to extend credit and standby letters of credit are not recorded as an asset or liability by the Company until the instrument is exercised. The contractual or notional amounts of those instruments reflect the extent of involvement we have in particular classes of financial instruments.
Commitments to extend credit are agreements to lend to a customer as long as there is no violation of any condition established in the contract. Commitments generally have fixed expiration dates or other termination clauses and may require payment of a fee. Since many of the commitments are expected to expire without being
94
Table of Contents
drawn upon, the total commitment amounts do not necessarily represent future cash requirements. The Company uses the same credit policies in making commitments and conditional obligations as it does for on-balance sheet instruments. The amount and nature of collateral obtained, if deemed necessary by the Company upon extension of credit, is based on management’s credit evaluation of the potential borrower.
Standby letters of credit are conditional commitments issued by the Company to guarantee the performance of a customer to a third party. Those guarantees are primarily issued to support public and private short-term borrowing arrangements. The credit risk involved in issuing letters of credit is essentially the same as that involved in extending loan facilities to customers. The Company holds collateral supporting those commitments for which collateral is deemed necessary.
The following table summarizes commitments we have made as of the dates presented.
| As of March 31, | As of December 31, | |||||||||||
| 2021 | 2020 | 2019 | ||||||||||
| (Dollars in thousands) | ||||||||||||
| Commitments to grant loans and unfunded commitments under lines of credit |
$ | 229,347 | $ | 181,925 | $ | 170,956 | ||||||
| Standby letters of credit |
3,566 | 2,814 | 2,636 | |||||||||
|
|
|
|
|
|
|
|||||||
| Total |
$ | 232,913 | $ | 184,739 | $ | 173,592 | ||||||
Interest Rate Sensitivity and Market Risk
As a financial institution, our primary component of market risk is interest rate volatility. Our interest rate risk policy provides management with the guidelines for effective funds management, and we have established a measurement system for monitoring our net interest rate sensitivity position. We have historically managed our sensitivity position within our established guidelines.
Fluctuations in interest rates will ultimately impact both the level of income and expense recorded on most of our assets and liabilities, and the market value of all interest-earning assets and interest-bearing liabilities, other than those which have a short term to maturity. Interest rate risk is the potential of economic losses due to future interest rate changes. These economic losses can be reflected as a loss of future net interest income and/or a loss of current fair market values. The objective is to measure the effect on net interest income and to adjust the balance sheet to minimize the inherent risk while at the same time maximizing income.
We manage our exposure to interest rates by adjusting our balance sheet assets and liabilities in the ordinary course of business. Based upon the nature of our operations, we are not subject to foreign exchange or commodity price risk. We do not own any trading assets.
Our exposure to interest rate risk is managed by ALCO in accordance with policies approved by the Bank’s board of directors. ALCO formulates strategies based on appropriate levels of interest rate risk. In determining the appropriate level of interest rate risk, ALCO considers the impact on earnings and capital of the current outlook on interest rates, potential changes in interest rates, regional economies, liquidity, business strategies and other factors. ALCO meets regularly to review, among other things, the sensitivity of assets and liabilities to interest rate changes, the book and market values of assets and liabilities, commitments to originate loans and the maturities of investments and borrowings. Additionally, ALCO reviews liquidity, cash flow flexibility, maturities of deposits and consumer and commercial deposit activity. Management also employs methodologies to manage interest rate risk, which include an analysis of the relationships between interest-earning assets and interest-bearing liabilities and an interest rate risk simulation model and shock analyses.
We use interest rate risk simulation models and shock analyses to test the interest rate sensitivity of net interest income and fair value of equity, and the impact of changes in interest rates on other financial metrics.
95
Table of Contents
Contractual maturities and re-pricing opportunities of loans are incorporated in the models. The average lives of non-maturity deposit accounts are based on decay assumptions and are incorporated into the models. All of the assumptions used in our analyses are inherently uncertain and, as a result, the models cannot precisely measure future net interest income or precisely predict the impact of fluctuations in market interest rates on net interest income. Actual results will differ from the models’ simulated results due to the timing, magnitude and frequency of interest rate changes as well as changes in market conditions and the application and timing of various management strategies.
On a quarterly basis, we run a simulation model for a static balance sheet and other scenarios. These models test the impact on net interest income from changes in market interest rates under various scenarios. Under the static model, rates are shocked instantaneously and ramped rates change over a 12-month and 24-month horizon based upon parallel and non-parallel yield curve shifts. Parallel shock scenarios assume instantaneous parallel movements in the yield curve compared to a flat yield curve scenario. Non-parallel simulation involves analysis of interest income and expense under various changes in the shape of the yield curve. Our internal policy regarding internal rate risk simulations currently specifies that for parallel shifts of the yield curve, estimated net interest income at risk for the subsequent one-year period should not decline by more than 10% for a 100 basis point shift, 15% for a 200 basis point shift, 20% for a 300 basis point shift, and 25% for a 400 basis point shift.
The following tables summarize the simulated change in net interest income over a 12-month horizon as of the dates indicated:
| As of March 31, | As of December 31, | |||||||||||
| 2021 | 2020 | 2019 | ||||||||||
| Change in Interest Rates (Basis Points) | Percent Change in Net Interest Income | |||||||||||
| +400 |
18.27 | 8.33 | 9.59 | |||||||||
| +300 |
13.78 | 6.36 | 7.25 | |||||||||
| +200 |
9.17 | 4.23 | 5.08 | |||||||||
| +100 |
4.56 | 2.08 | 2.71 | |||||||||
| -100 |
0.42 | (0.14 | ) | (5.16 | ) | |||||||
| -200 |
(4.39 | ) | (5.05 | ) | (9.75 | ) | ||||||
| -300 |
(9.68 | ) | (10.43 | ) | (14.72 | ) | ||||||
| -400 |
(14.22 | ) | (15.12 | ) | (19.88 | ) | ||||||
Inflation and increases in interest rates may result from fiscal stimulus and monetary stimulus, and the Federal Reserve has indicated it is willing to permit inflation to run moderately above its 2% target for some time. Increases in interest rates may cause consumers to shift their funds to more interest bearing instruments and to increase the competition for and costs of deposits. If customers move money out of bank deposits and into other investment assets or from transaction deposits to higher interest bearing time deposits, our funding costs may increase. Additionally, any such loss of funds could result in lower loan originations and growth, which could materially and adversely affect our results of operations and financial condition. Increases in market interest rates may reduce demand for loans, including residential mortgage loans originations. At the same time, increases in rates will increase the rates we charge on variable rate loans and may increase our net interest margin. Higher interest rates would decrease the values of our existing fixed rate securities investments and could potentially adversely affect the values and liquidity of collateral securing our loans. The effects of increased rates will depend on the rates of changes in our costs of funds and interest earned on our loans and investments and the shape of the yield curve.
Impact of Inflation
The consolidated financial statements and related consolidated financial data presented herein have been prepared in accordance with GAAP and practices within the banking industry which require the measurement of
96
Table of Contents
financial position and operating results in terms of historical dollars without considering the changes in the relative purchasing power of money over time due to inflation. Unlike most industrial companies, virtually all the assets and liabilities of a financial institution are monetary in nature. As a result, interest rates have a more significant impact on a financial institution’s performance than the effects of general levels of inflation.
Critical Accounting Policies and Estimates
Our accounting and reporting policies conform to GAAP and conform to general practices within our industry. To prepare financial statements in conformity with GAAP, management makes estimates, assumptions and judgments based on available information. These estimates, assumptions and judgments affect the amounts reported in the financial statements and accompanying notes. These estimates, assumptions and judgments are based on information available as of the date of the financial statements and, as this information changes, actual results could differ from the estimates, assumptions and judgments reflected in the financial statements. In particular, management has identified several accounting policies that, due to the estimates, assumptions and judgments inherent in those policies, are critical to understanding our financial statements.
The JOBS Act and our regulators provided us with extended transition period to January 1, 2023 for complying with CECL accounting standards affecting public companies
The following is a discussion of the critical accounting policies and significant estimates that we believe require us to make the most complex or subjective decisions or assessments. Additional information about these policies can be found in Note 1 of the Company’s consolidated financial statements as of December 31, 2020.
Basis of Presentation and Consolidation. The consolidated financial statements include the accounts of the Company and its wholly owned consolidated subsidiaries. All significant intercompany balances and transactions have been eliminated in consolidation.
Cash and Cash Equivalents. The Company includes all cash on hand, balances due from other banks, and federal funds sold, all of which have original maturities within three months, as cash and cash equivalents.
Securities. Investment securities may be classified into trading, held-to-maturity, or available-for-sale portfolios. Securities that are held principally for resale in the near term are classified as trading. Securities that management has the ability and intent to hold to maturity are classified as held-to-maturity and recorded at amortized cost. Securities not classified as trading or held-to-maturity are available-for-sale and are reported at fair value with unrealized gains and losses excluded from earnings, but included in the determination of other comprehensive income. Management uses these assets as part of its asset/liability management strategy. These securities may be sold in response to changes in liquidity needs, interest rates, resultant prepayment risk changes, and other factors. Management determines the appropriate classification of securities at the time of purchase. Purchase premiums and discounts are recognized in interest income using the interest method over the terms of the securities. Realized gains and losses and declines in value determined to be other-than-temporary are included in gain or loss on sale of securities. The cost of securities sold is based on the specific identification method.
Loans. Loans that management has the intent and ability to hold for the foreseeable future or until maturity or payoff are reported at their outstanding principal balances net of any unearned income, charge-offs, unamortized deferred fees and costs on originated loans, and premiums or discounts on purchased loans. Interest income is accrued on the unpaid principal balance. Loan origination fees, net of certain direct origination costs, are deferred and recognized as an adjustment of the related loan yield using the straight-line method, which is not materially different from the effective interest method required by GAAP.
Loans are placed on nonaccrual status when, in management’s opinion, collection of interest is unlikely, which typically occurs when principal or interest payments are more than 90 days past due. When interest accrual is discontinued, all unpaid accrued interest is reversed against interest income. The interest on these loans is accounted for on the cash-basis or cost-recovery method, until qualifying for return to accrual. Loans are returned
97
Table of Contents
to accrual status when all the principal and interest amounts contractually due are brought current and future payments are reasonably assured.
Allowance for Loan Losses. We have elected to take advantage of this extended transition period, which means that the financial statements included in this prospectus, as well as financial statements that we file in the future during the transition period, will not be subject to all new or revised accounting standards generally applicable to public companies for so long as we remain an emerging growth company or until we affirmatively and irrevocably opt out of the extended transition period under the JOBS Act. The allowance for loan losses is established as losses are estimated to have occurred through a provision for loan losses charged to earnings. Loan losses are charged against the allowance when management believes the uncollectibility of a loan balance is confirmed. Confirmed losses are charged-off immediately. Subsequent recoveries, if any, are credited to the allowance. The Company’s allowance for loan losses consists of specific valuation allowances established for probable losses on specific loans and general valuation allowances calculated based on historical loan loss experience for similar loans with similar characteristics and trends, discretionarily adjusted for general economic conditions and other qualitative internal and external risk factors.
The allowance for loan losses is evaluated on a quarterly basis by management and is based upon management’s review of the collectability of the loans in light of historical experience, the nature and volume of the loan portfolio, adverse situations that may affect the borrower’s ability to repay, estimated value of any underlying collateral, and prevailing economic conditions. This evaluation is inherently subjective, as it requires estimates that are susceptible to significant revision as more information becomes available. The determination of the adequacy of the allowance for loan losses is based on estimates that are particularly susceptible to significant changes in economic and market conditions. In connection with the determination of the estimated losses on loans, management obtains independent appraisals for significant collateral. The Bank’s loans are generally secured by specific items of collateral including real property, consumer assets, and other business assets.
While management uses available information to recognize losses on loans, further reductions in the carrying amounts of loans may be necessary based on various factors. In addition, regulatory agencies, as an integral part of their examination process, periodically review the estimated losses on loans. Such agencies may require the Bank to recognize additional losses based on their judgments about information available to them at the time of their examination. Because of these factors, it is reasonably possible that the estimated losses on loans may change materially in the near term. However, the amount of the change that is reasonably possible cannot be estimated.
A loan is considered impaired when, based on current information and events, it is probable that the Company will be unable to collect the scheduled payments of principal or interest when due according to the contractual terms of the loan agreement. All loans rated substandard or worse and greater than $250,000 are specifically reviewed to determine if they are impaired. Factors considered by management in determining whether a loan is impaired include payment status and the sources, amounts, and probabilities of estimated cash flow available to service debt in relation to amounts due according to contractual terms. Loans that experience insignificant payment delays and payment shortfalls generally are not classified as impaired. Management determines the significance of payment delays and payment shortfalls on a case-by-case basis, taking into consideration all of the circumstances surrounding the loan and the borrower, including the length of the delay, the reasons for the delay, the borrower’s prior payment record, and the amount of the shortfall in relation to the principal and interest owed.
Loans that are determined to be impaired are then evaluated to determine estimated impairment, if any. GAAP allows impairment to be measured on a loan-by-loan basis by the present value of expected future cash flows discounted at the loan’s effective interest rate, the loan’s observable market price, or the fair value of the collateral if the loan is secured by collateral. Loans that are not individually determined to be impaired or are not subject to the specific review of impaired status are subject to the general valuation allowance portion of the allowance for loan loss.
98
Table of Contents
Loans Held for Sale. Loans held for sale are comprised of residential mortgage loans. Loans that are originated for best efforts delivery are carried at the lower of aggregate cost or fair value as determined by aggregate outstanding commitments from investors or current investor yield requirements. All other loans held for sale are carried at fair value. Loans sold are typically subject to certain indemnification provisions with the purchaser. Management does not believe these provisions will have any significant consequences.
Recently Issued Accounting Pronouncements
The following provides a brief description of accounting standards that have been issued but are not yet adopted that could have a material effect on our consolidated financial statements. Please also refer to the Notes to our consolidated financial statements included in this prospectus for a full description of recent accounting pronouncements, including the respective expected dates of adoption and anticipated effects on our results of operations and financial condition.
In February 2016 the Financial Accounting Standards Board (FASB) issued Accounting Standards Update (“ASU”) 2016-02, “Leases (Topic 842)” to increase transparency and comparability among organizations by recognizing lease assets and lease liabilities on the balance sheet and by disclosing key information about leasing arrangements. ASU 2016-02 requires organizations that lease assets (lessees) to recognize on the balance sheet the assets and liabilities for the rights and obligations created by the lease for all operating leases under current U.S. GAAP with a term of more than 12 months. The ASU is effective for non-public business entities for fiscal years beginning after December 15, 2021. Early adoption is permitted. The ASU should be applied on a modified retrospective basis, with a cumulative-effect adjustment directly to retained earnings as of the beginning of the period of adoption. The adoption of ASU 2016-02 is not expected to have a material impact on the Company’s consolidated financial statements.
In July 2018 the FASB issued ASU 2018-11, “Leases –Targeted Improvements” to provide entities with relief from the costs of implementing certain aspects of the new leasing standard, ASU 2016-02. Specifically, under the amendments in ASU 2018-11: (1) entities may elect not to recast the comparative periods presented when transitioning to the new leasing standard, and (2) lessors may elect not to separate lease and non-lease components when certain conditions are met. The amendments have the same effective date as ASU 2016-02 (January 1, 2022 for the Company). The adoption of ASU 2018-11 is not expected to have a material impact on the Company’s consolidated financial statements.
In June 2016 the FASB issued ASU 2016-13, “Financial Instruments – Credit Losses (Topic 326): Measurement of Credit Losses on Financial Instruments.” The new guidance will apply to most financial assets measured at amortized cost and certain other instruments including loans, debt securities held to maturity, net investments in leases and off-balance sheet credit exposures. The guidance will replace the current incurred loss accounting model that delays recognition of a loss until it is probable a loss has been incurred with an expected loss model that reflects expected credit losses based upon a broader range of estimates including consideration of past events, current conditions and supportable forecasts. The guidance also eliminates the current accounting model for purchased credit impaired loans and debt securities, which will require re-measurement of the related allowance at each reporting period. The guidance includes enhanced disclosure requirements intended to help financial statement users better understand estimates and judgement used in estimating credit losses. As originally issued, ASU 2016-13 was effective for financial statements issued for fiscal years and for interim periods within those fiscal years beginning after December 15, 2020, with institutions required to apply the changes through a cumulative-effect adjustment to their retained earnings balance as of the beginning of the first reporting period in which the guidance is effective. On October 16, 2019, the FASB approved a delay in the implementation of ASU 2016-13 by two years for non-pubic business entities, including the Company. Management has been in the process of developing a revised model to calculate the allowance for loan and leases losses upon implementation of ASU 2016-13 in order to determine the impact on the Company’s consolidated financial statements and, at this time, expects to recognize a one-time cumulative effect adjustment to the allowance for loan and lease losses as of the beginning of the first reporting period in which the new standard is effective. The magnitude of any such one-time adjustments is not yet known.
99
Table of Contents
Company Overview
We are a bank holding company headquartered in Anniston, Alabama. We operate primarily through our wholly-owned subsidiary, Southern States Bank, an Alabama banking corporation formed in 2007. The Bank is a full service community banking institution, which offers an array of deposit, loan and other banking-related products and services to businesses and individuals in our communities. Our franchise is focused on personalized, relationship-driven service combined with local market management and expertise to serve small and medium size businesses and individuals. We believe that these services will build stronger, growing communities that will drive our success. As of March 31, 2021, we had total assets of $1.5 billion, gross loans of $1.1 billion, total deposits of $1.3 billion and total stockholders’ equity of $144.6 million.
We provide banking services from 15 offices in Alabama and Georgia. Our primary service areas in Alabama are Anniston, Auburn, Birmingham and Huntsville with a presence extending into Calhoun, Lee, Jefferson, Talladega, Madison, Cleburne and Randolph Counties of Alabama and their surrounding areas. In Georgia, we serve the Columbus metropolitan statistical area (“MSA”), as well as Carroll, Coweta, and Dallas Counties in the greater Atlanta MSA. The Bank also operates a loan production office (“LPO”) in Atlanta, Georgia.
Our History and Growth
The Bank was organized on August 23, 2007 by a group of financial executives and prominent business leaders with a shared vision to invest in highly experienced people and technology to offer high levels of personal service to our clients. Chartered with approximately $31 million of common equity, the Bank opened its Anniston, Alabama headquarters along with an office in Opelika, Alabama. We opened our Birmingham office six months later in February 2008.
In the following years, our growth has been driven by expansion in existing markets and into new markets. Over the last five years, we have an asset CAGR of over 20% while maintaining profitability, credit quality and prudent capital management. The following information summarizes our history and the tables illustrate our balance sheet and income statement growth as well as trends in other performance metrics as of or for the years ended December 31, 2016 through 2020, and the three months ended March 31, 2021:
| • | On May 18, 2012, we acquired Alabama Trust Bank’s Sylacauga, Alabama branch and approximately $40 million in core deposits through an FDIC-assisted transaction. |
| • | We opened full-service de novo branches in Huntsville, Alabama and Carrollton, Georgia in January and June of 2015, respectively, along with an LPO in Atlanta, Georgia in August 2015. |
| • | In October 2015, we completed our acquisition of Columbus Community Bank in Columbus, Georgia and subsequently opened a second Columbus location in December 2015. We have successfully grown our deposits in this market from approximately $100 million at the time of acquisition to $233 million as of March 31, 2021. |
| • | In 2016, we completed two rounds of private growth capital, issuing $4.5 million in subordinated debt in June and another $41.2 million in equity in December to several institutional investors. All Subordinated Notes were repaid in June 2021. In January 2017, we raised $3.4 million of common equity from local investors. We used the proceeds from these transactions to improve our capital ratios and to support our growth. Using the newly issued capital, our loans grew by 40.4% during 2017 and 2018 and deposits grew by 49.2% during the same period. We also opened a full service branch in Newnan, Georgia and hired four experienced lenders in Georgia. |
| • | On May 8, 2019, we announced the acquisition of East Alabama and its subsidiary bank, Small Town Bank, and closed the transaction in September of 2019. The aggregate consideration paid was approximately $24.0 million in cash and the issuance of 1,142,846 shares of common stock. As of June 30, 2019, Small Town Bank had $240.6 million in assets, $120.8 million in gross loans and $199.9 million in deposits, of which $192.1 million were core deposits. Small Town Bank operated six |
100
Table of Contents
| branches along the Alabama-Georgia border, and the acquisition allowed us to enter three new counties: Cleburne and Randolph County, Alabama and Paulding County, Georgia. Small Town Bank also operated a branch in Carroll County, Georgia, which we combined with an existing branch, and an LPO in Oxford, Alabama, which we consolidated with our branch there to expand our existing Anniston footprint. |
| • | In 2020, we achieved record net income of approximately $12.1 million, which represents a 116% increase from 2019. We also had significant balance sheet and customer growth in 2020; our total assets increased 22%, deposits increased 20%, noninterest bearing deposits increased 52% and loans increased 15%, excluding PPP loans. Since March 2020, we have been an active participant in the PPP, providing 420 existing customers $71.7 million in loans through the first program and $26.2 million through the second program. In aggregate, we anticipate the realization $3.7 million in fees from this program. Over the course of the pandemic, we granted deferrals on 396 loans totaling $280.1 million, or approximately 28.0% of our loan portfolio. As of March 31, 2021, only two loans totaling $1.1 million remain. |
| Total Assets ($mm)
|
Total Loans ($mm)
| |
| Total Deposits ($mm)
|
Net Income ($mm)
| |
| * | Core net income is a non-GAAP financial measure. Please see “Non-GAAP Financial Measures” for a definition of core net income and a reconciliation of core net income to its most directly comparable GAAP financial measure. |
101
Table of Contents
Return on Average Assets (%)
| * | Core return on average assets is a non-GAAP financial measure. Please see “Non-GAAP Financial Measures” for a definition of core return on average assets and a reconciliation of core return on average assets to its most directly comparable GAAP financial measure. |
Business Strategy
Our business strategy is to deliver best-in-class customer service and to be the most trusted bank serving our markets, while maintaining our asset quality and profitability. We intend to execute our strategic plan through the following:
| • | Continuing Our Organic Growth Strategy. Organic loan and deposit growth have been our primary tenet since establishing the Bank, and we believe it is paramount in driving long-term stockholder value. We seek to continue to focus on organic growth throughout our footprint by deepening ties within our communities, building upon current client relationships and further leveraging the extensive experience of our senior management team, board of directors and commercial bankers. We have successfully grown our balance sheet with loan growth of 103.2% (excluding PPP loans) and deposit growth of 142.3% since 2016. We believe that our teams of engaged, experienced employees will continue to be an important factor in cultivating relationships with current and potential clients and driving growth. In addition to our employee focus, we have made significant investments in technology and risk management systems, and we believe that we have developed an infrastructure that can support significant additional growth with minimal capital investment. |
| • | Emphasizing Commercial Banking in Local Communities. We intend to continue operating as a community banking organization focused on meeting the specific needs of small and medium-sized businesses and individuals in our market areas. We will continue to provide a high degree of responsiveness and a wide variety of banking products and services to our customers. We are focused on being a dominant bank in the smaller markets we serve and a competitive player in our larger metropolitan markets. Our consistent corporate message is that the success of our communities and their businesses and individuals will drive the success of the Bank. |
| • | Pursuing Strategic Growth Opportunities through Acquisitions and New Market Development. We anticipate continuing to selectively pursue future acquisitions and new market expansions to supplement organic growth in our legacy markets. Our organic growth has been complemented by synergistic acquisitions and de novo expansion. We seek to expand our operations in attractive and adjacent markets with experienced banking teams that are a cultural fit and knowledgeable of our target client base. We may also make acquisitions or open additional offices in our existing markets. We seek acquisitions that provide meaningful financial benefits, long-term organic growth opportunities and economies of scale without compromising asset quality to the overall organization. Generally, we seek acquisitions of banks with $250.0 million to $750.0 million of assets headquartered in Alabama, Georgia, and select southeastern Tennessee markets, with an emphasis along the I-20, I-85 and I-75 corridors. Currently, we believe that there are approximately 103 potential banks that meet our size and location targets. |
102
Table of Contents
| • | Funding Asset Growth through Core Deposits and Relationship Banking. We fund our loan growth primarily through low-cost core customer deposits. Our ratio of core deposits (total deposits less time deposits greater than $250,000) were 97.4% of total deposits as of March 31, 2021. Our loan to deposit ratio, excluding PPP, as of March 31, 2021 was 81.1%. The strength of our deposit franchise results from our development and maintenance of long-standing customer relationships. Our relationship managers and branch managers actively seek lending relationships with our existing depositors. Today, we believe approximately 65% of our lending relationships have deposits with our bank and our top 25 loans all have deposit relationships as of March 31, 2021. Additionally, we attract deposits from our commercial customers by providing them with personal service, a broad suite of commercial banking and treasury management products and convenient services such as remote deposit capture and commercial internet banking. |
| • | Leveraging Technology to Enhance the Client Experience and Improve Productivity. We provide client convenience through the use of technology and our mobile banking applications, along with our strategically placed banking locations. Since our founding, we have made significant investments in technology to offer online and mobile banking products that we believe are comparable to those offered by many similar-sized competitors and those of the nation’s largest banks. We utilize Jack Henry as a core processing service provider that we believe can support our growth plan. We also leverage technology solutions to manage cyber security risks and data privacy. In addition to client-facing technology, significant investments have been made in the technology and software utilized by our employees. This technology and software enables our employees to be more productive by enhancing workflow and internal and external management reporting, removing unnecessary steps and reducing manual errors. For example, in 2020, we initiated a new customer platform through Jack Henry, which allows for electronic signatures on new and existing deposit accounts. In 2021, we are implementing a new lending platform to provide more digital capabilities to our borrowers and create internal efficiencies throughout our loan underwriting and processing. |
Competitive Strengths
We believe that the following strengths will help us execute our business strategy:
| • | Experienced and Invested Leadership. Our board of directors has decades of combined business experience from a variety of backgrounds. Our directors actively participate in and support community activities, which we believe significantly benefit our business development efforts. Our executive leadership team is comprised of established industry veterans with a track record of profitable growth, operating efficiencies and strong risk management. Collectively, our directors and senior executives own approximately 15.0% of the total common stock outstanding as of March 31, 2021, excluding stock held by a private equity fund with a representative on our board of directors. |
| • | Stephen W. Whatley, founder of the Bank, serves as Chief Executive Officer of Southern States, a position he has held since 2007, and Chairman of the Board of Southern States, a position he has held since 2014. Prior to founding Southern States, Mr. Whatley served as Market President at Colonial Bank covering several counties in East Alabama and West Georgia. Mr. Whatley has over 40 years of experience in the banking industry in multiple states across the country. |
| • | Mark Chambers serves as President of Southern States. Mr. Chambers has worked at Southern States since 2007, including as Senior Executive Vice President and President of the Southeast Region. He has served as President since 2019. Mr. Chambers held the position of Market President (Auburn and Opelika, Alabama) at Wachovia Bank before his time at Southern States. He has over 30 years of banking experience. |
| • | Lynn Joyce serves as Senior Executive Vice President and Chief Financial Officer of Southern States. She has held this position since joining Southern States in 2013. Prior to joining Southern States, Ms. Joyce served in various positions with First Financial Bank, Bessemer, Alabama, which was publicly traded on NASDAQ, and prior to that worked in public accounting at a national firm. |
| • | Greg Smith is Senior Executive Vice President and Chief Risk Officer, positions he has held since 2019. From 2006 until 2019, he served as Senior Vice President and Chief Credit Officer of Southern States. Prior to joining Southern States, he worked as Commercial Loan Officer and Market President (Anniston, Alabama) at Regions Bank, a regional bank. Mr. Smith has over 30 years of experience in the banking industry. |
103
Table of Contents
| • | Jack Swift is Senior Executive Vice President and Chief Operating Officer of Southern States. He has held this position since 2019. Previously, he served as Senior Executive Vice President and President of the Central Region of Southern States from 2006 until 2019. Prior to joining Southern States, Mr. Swift worked as Senior Vice President at Colonial Bank. Mr. Swift has over 30 years of experience in the banking industry. |
In addition to our executive leadership team, we believe that we are supported by a deep and talented bench of market leaders, many of whom have been with us for much of our existence.
| • | Diversified Loan Portfolio. We have an attractive, commercially focused loan portfolio, with 15.6% commercial and industrial, or C&I, loans, 31.7% owner-occupied commercial real estate, or CRE loans, 19.8% non-owner-occupied CRE loans, and 10.0% one- to-four-family residential loans at March 31, 2021. Approximately 47.3% of our loan portfolio is comprised of owner-operated business loans, which includes C&I and owner-occupied CRE loans on a combined basis, and 34.8% of our portfolio consists of loans for investor-owned properties and projects, which includes non-owner-occupied CRE loans, multi-family loans and construction and land development loans, or C&D loans, on a combined basis. We have had loan growth of 18.2% CAGR, excluding PPP, since 2016. Our loans are in market, except where we follow a local loan customer out of market. We believe that our knowledgeable and prudent approach to commercial lending results in relatively lower losses caused by defaults. |
| Loan Portfolio
|
Commercial and CRE Loan Portfolio
| |
|
|
| |
| Loans by Geography* | CRE by Type | |
|
|
| |
104
Table of Contents
| * | Other markets include Sylacauga, Wedowee, Ranburne, Roanoke and Heflin; Atlanta includes the Carrolton, Newnan and Dallas markets |
| • | Core-Deposit Base. We have built a strong core deposit base by providing quality products and services to customers in our market areas. We offer retail deposit services through our existing branch network, as well as mobile and online banking services. Core deposits totaled $1.2 billion, or 97.4% of total deposits, and noninterest-bearing deposits totaled $365.1 million, or 28.9% of total deposits, as of March 31, 2021. Our commercial lending has led to strong core deposit growth with a 24.1% CAGR since 2016. Our cost of total deposits was 0.39% for the three months ended March 31, 2021. |
| Deposit Portfolio
|
Core Deposits ($mm)
|
| • | History of Successful Acquisitions. We have pursued a strategy of disciplined organic and acquisitive growth. Since 2012, we have successfully completed three acquisitions, including one bank purchased from the FDIC and two whole-bank acquisitions. Our management team has demonstrated success in identifying and integrating strategic transactions that either added density to our footprint or expanded our presence into attractive markets to ultimately build long-term stockholder value. Following each transaction, we retained the majority of the acquired deposit and desired lending relationships, which we believe reflects the strength of our relationship-based community banking focus and the quality of our established integration processes. When negotiating a transaction, we are disciplined on price and structure in order to manage the initial tangible book value dilution and earnback period. We modeled our two whole-bank acquisitions of Columbus Community Bank and Small Town Bank on a projected 3-year or less tangible book value earnback period with double digit accretion to projected earnings per share. We believe our approach to acquisitions and the availability of a publicly traded stock after this offering will position us well to be the acquirer of choice for other institutions in our target markets. |
| • | Prudent Credit Risk Management. We have a culture of well-developed risk management procedures at all levels of our organization. Our loan portfolio is primarily originated from borrowers within our footprint and is subject to a rigorous credit evaluation process that seeks to balance responsiveness with prudent underwriting and pricing practices. A centralized credit underwriting group underwrites all credit exposures, ensuring consistent application of credit standards. We have established processes to monitor our loan portfolio on a regular basis. Our management team and board of directors have established concentration limits by loan type, industry, and related borrowers, which are regularly reviewed in light of current conditions in our targeted market areas to mitigate developing risk areas within our loan portfolio and to ensure that the asset quality of our loan portfolio remains strong. Our CRE, C&D, and hospitality loans as a percentage of total capital at March 31, 2021 was 338.4%, 147.7%, and 54.0%, respectively. When credit issues arise, our management team takes an active approach in handling the problem. For example, we capped our hospitality loans at existing levels in January 2020 given market conditions, and our similarly capped multifamily loans in September 2020; both measures are still in effect today. We monitor our loan loss reserve and seek to maintain an adequate reserve for future losses. |
105
Table of Contents
| • | Stockholder Focus. We started the Bank with a strategic plan to provide consistent, long-term growth and returns to our stockholders. Our tangible book value per share has increased 16.1% from December 31, 2019 to March 31, 2021, while increasing dividends and generating strong returns on capital. We changed from an annual to a quarterly dividend in April 2020 when we declared a $0.08 dividend per share. In January 2021, we increased our quarterly dividend to $0.09 per share. We believe that our experienced leadership team, commitment to organic and acquisitive growth, and prudent risk management will allow us to consistently build value for our stockholders. |
Our Markets
We provide banking services from 15 offices in Alabama and in the Atlanta and Columbus, Georgia MSAs. Our markets are a mix of higher-growth areas and stable markets with strong core deposits. We have a top five deposit market share in four counties of operation and have outperformed the deposit growth in the majority of our markets. We find strength in the stability of our rural markets coupled with higher growth potential in metropolitan areas such as Atlanta, Birmingham, Huntsville and Auburn. Below is a description of our operations in the MSAs and selected counties:
| Market Area* |
Total Population 2021 (Estimated) |
Projected Population Change 2021-2026 (%) |
Projected Median Household Income 2026 ($) |
Projected Household Income Change 2021-2026 (%) |
Unemployment Rate** (%) |
|||||||||||||||
| Anniston-Oxford MSA |
112,767 | (1.2 | ) | 52,934 | 7.9 | 3.4 | ||||||||||||||
| Atlanta-Sandy Springs-Alpharetta MSA |
6,137,994 | 5.9 | 75,740 | 12.2 | 3.9 | |||||||||||||||
| Auburn-Opelika MSA |
167,412 | 4.6 | 56,718 | 8.7 | 2.4 | |||||||||||||||
| Birmingham-Hoover MSA |
1,094,169 | 0.4 | 69,086 | 13.1 | 2.6 | |||||||||||||||
| Columbus MSA |
321,811 | 2.1 | 54,764 | 9.7 | 4.2 | |||||||||||||||
| Huntsville MSA |
481,729 | 4.3 | 72,962 | 7.2 | 2.2 | |||||||||||||||
| Cleburne County, AL |
14,883 | 0.2 | 48,082 | 6.8 | 2.2 | |||||||||||||||
| Randolph County, AL |
22,747 | 0.5 | 49,772 | 6.6 | 2.2 | |||||||||||||||
| Talladega County, AL |
79,589 | (0.7 | ) | 47,451 | 7.3 | 3.6 | ||||||||||||||
| Market Area*** |
Market Rank |
Deposit Market Share (%) |
Number of Branches |
Market Deposits ($mm) |
Deposits Per Branch ($mm) |
YoY Deposit Growth (%) |
||||||||||||||||||
| Anniston-Oxford MSA |
5 | 10.7 | 1 | 234.4 | 234.4 | (11.7 | ) | |||||||||||||||||
| Atlanta-Sandy Springs-Alpharetta MSA |
49 | 0.1 | 3 | 140.9 | 50.0 | 28.4 | ||||||||||||||||||
| Auburn-Opelika MSA |
7 | 6.7 | 2 | 239.5 | 119.8 | 40.3 | ||||||||||||||||||
| Birmingham-Hoover MSA |
31 | 0.1 | 1 | 48.3 | 48.2 | (9.6 | ) | |||||||||||||||||
| Columbus MSA |
6 | 1.4 | 2 | 171.4 | 85.7 | (3.7 | ) | |||||||||||||||||
| Huntsville MSA |
22 | 0.5 | 1 | 49.7 | 49.7 | 29.3 | ||||||||||||||||||
| Cleburne County, AL |
2 | 31.3 | 2 | 51.6 | 25.8 | (9.4 | ) | |||||||||||||||||
| Randolph County, AL |
1 | 35.7 | 2 | 125.4 | 62.7 | 5.3 | ||||||||||||||||||
| Talladega County, AL |
5 | 5.3 | 1 | 52.2 | 52.2 | 29.3 | ||||||||||||||||||
| * | Demographic data provided by Claritas based on U.S. Census data |
| ** | Source: U.S. Bureau of Labor Statistics for MSAs; Alabama Department of Labor for counties; data as of May 2021 |
| *** | Source: FDIC; Deposit data as of 6/30/20 |
Atlanta, Georgia. The Atlanta MSA is the ninth largest metro area in the United States with a 2020 population of 6.1 million. Atlanta has strong demographics and is projected by the U.S. Census Bureau to exceed the national average in population growth, median 2021 household income and change in household income from 2021 to 2026. Atlanta was voted the second best city for people between the ages of 21 and 36 by Money.com,
106
Table of Contents
and it was also ranked the thirteenth Best Places for Business and Careers by Forbes. In 2020, Atlanta was the number one growth leader for becoming a metro area tech hub and was voted the number three metro area for corporate headquarters by Business Facilities. In fact, it serves as the headquarters of 16 Fortune 500 companies including Coca-Cola, Home Depot, UPS, WestRock and Delta Air Lines. The Atlanta MSA is home to multiple universities and professional sports teams. Businesses are attracted to Atlanta by its strong economic opportunities, talent-rich labor pool, and position as the central hub of the Southeast.
Auburn-Opelika, Alabama. The Auburn-Opelika MSA was the fourth-highest ranked MSA in the country in terms of migration growth, according to U-Haul’s ‘2020 Migration Trends’ study. In addition to being home to Auburn University, the largest employer in the MSA, accounting for approximately a quarter of the city’s workforce, The East Alabama Medical Center, a Wal-Mart Distribution Center, Mando America Corporation, and Briggs & Stratton, have helped make Auburn-Opelika the second fastest growing MSA in Alabama.
Birmingham, Alabama. Birmingham is the largest market in Alabama by population and has a history of strong economic performance. In 2020, Birmingham was one of the cities with the lowest cost of living in America. Its healthcare, financial services and materials industries have continued to drive economic development and to attract new corporations across all sectors. Birmingham ranks in the top ten as a moving destination for new college graduates based on an April 2020 report by Smartasset Financial Technology. Also, Birmingham was the number eight best city for jobs in 2020 per Glassdoor. The most prominent companies headquartered in the city are Altec Industries, Encompass Health, Vulcan Materials and Alabama Power. Additionally, University of Alabama Birmingham serves as an international leader in health care and as one of the top transplant centers in the world.
Huntsville, Alabama. Huntsville is home to the Redstone Arsenal, which includes the U.S. Space and Rocket Center, NASA’s Marshall Space Flight Center, and the United States Army Aviation and Missile Command. Huntsville’s focus on space and technology attracts well-regarded professionals and businesses alike. Over 40% of the city has obtained a Bachelor’s Degree or higher education, ranking it among the top-educated cities in the nation. Huntsville is one of the top 10 best cities for jobs in STEM by Forbes, and employers in Huntsville hire the third most high-tech employees in the county. The city was voted Top Ten Best Places for Business and Careers by Forbes with strong projected economic growth. The largest employer in Huntsville is the U.S. Army, but NASA and Boeing combine for nearly 9,000 employees as well. Huntsville’s median household income is second to Atlanta in our markets. The City of Huntsville is the second largest city and the fastest growing major city in Alabama.
Columbus, Georgia. Columbus is the third most populous MSA in Georgia. The most notable employer is Fort Benning Military Base, located just south of the city, which employs over 40,000 people. The Columbus Chamber of Commerce estimates that Ft. Benning has an economic impact of more than $4 billion on the surrounding area. Other companies headquartered in Columbus include Aflac and the Total Systems group of Global Payments.
Corporate Information
Our principal executive office is located at 615 Quintard Avenue, Anniston, Alabama 36201, and our telephone number is (256) 241-1092. We maintain an Internet website at www.southernstatesbank.net. The information contained on or accessible from our website is not part of this prospectus and is not incorporated by reference herein.
Properties
We provide banking services from 15 offices in Alabama and the Atlanta and Columbus, Georgia MSAs. We also operate a LPO in Atlanta, Georgia. Our executive offices and those of the Bank are located at 615 Quintard Avenue, Anniston, Alabama. The Bank also owns an operations center located at 1131 Wilmer Avenue, Anniston, Alabama 36202. We believe that our banking and other offices are in good condition and are suitable and adequate to our needs.
107
Table of Contents
The Bank owns its main office building and ten of its banking centers. The remaining facilities are occupied under lease agreements, with terms ranging from one to two years, with extension options. The following table shows our banking offices as of December 31, 2020, and whether owned or leased:
| Office Address |
Owned/Leased | |
| Executive Offices 615 Quintard Avenue Anniston, Alabama |
Owned | |
| 2601 Frederick Road Opelika, Alabama |
Owned | |
| 7 Office Park Circle(1) Birmingham, Alabama |
Leased | |
| 101 West Fort Williams Street Sylacauga, Alabama |
Owned | |
| 415 Church Street N.W. Building H Suite 100 Huntsville, Alabama |
Leased | |
| 905 Maple Street Carrollton, Alabama |
Owned | |
| 5604 Whittelsey Boulevard Columbus, Georgia |
Owned | |
| 4045 Orchard Rd. SE Suite 510 (LPO) Smyrna, Georgia |
Leased | |
| 1326 13th Street Columbus, Georgia |
Leased | |
| 815 Opelika Road Auburn, Alabama |
Owned | |
| 1483 East Highway 34(2) Newnan, Georgia |
Leased | |
| 548 Main Street Roanoke, Alabama |
Owned | |
| 21044 Main Street Ranburne, Alabama |
Owned | |
| 117 Main Street Wedowee, Alabama |
Owned | |
| 645 Ross Street Heflin, Alabama |
Owned | |
| 45 East Ross Street Dallas, Georgia |
Owned | |
| (1) | The Bank has purchased a location to be utilized by the end of 2021 as a new Birmingham location in the same area on Highway 280 as the current location. This premier location in Birmingham will house the Birmingham Branch, Corporate Accounting/Administration and Credit Administration. The location will have excess space that may be leased. |
| (2) | The Bank has purchased land and received regulatory approval to construct a new modern branch office in Newnan, Georgia. |
108
Table of Contents
Competition
Southern States Bank faces substantial competition in attracting and retaining deposits and making loans to its customers in all of its principal markets. The banking and financial services industry is highly competitive, and we compete with a wide range of financial institutions within our markets, including local, regional and national commercial banks and credit unions. We also compete with mortgage companies, trust companies, brokerage firms, consumer finance companies, mutual funds, securities firms, insurance companies, third-party payment processors, financial technology companies and other financial intermediaries for certain of our products and services. Some of our competitors are not subject to the regulatory restrictions and level of regulatory supervision applicable to us.
Interest rates on loans and deposits, as well as prices on fee-based services are typically significant competitive factors within the banking and financial services industry. Other important competitive factors in our industry and markets include office locations and hours, quality of client service, community reputation, continuity of personnel and services, capacity and willingness to extend credit, and ability to offer excellent banking products and services.
Competition involves efforts to retain current customers, obtain new loans and deposits, increase types of services offered, and offer competitive interest rates on deposits and loans. Many of our competitors are much larger financial institutions that have greater financial resources than we do and compete aggressively for market share. These competitors attempt to gain market share through their financial product mix, pricing strategies and banking center locations.
While we seek to remain competitive with respect to fees charged, interest rates and pricing, we believe that our broad suite of financial solutions, our high-quality client service culture, our positive reputation and our longstanding community relationships will enable us to compete successfully within our markets and enhance our ability to attract and retain clients.
Human Capital Management
As of December 31, 2020, the Company had 190 FTE employees. Our employees are not represented by a collective bargaining unit. We consider our relations with our employees to be excellent.
We are committed to fostering, cultivating, and preserving a culture of diversity and inclusion. We are working to cultivate our leaders and shape future talent to help us meet the needs of our customers now and in the future. Our human capital is the most valuable asset we have. The collective sum of the individual differences, life experiences, knowledge, inventiveness, innovation, self-expression, unique capabilities, and talent that our employees invest in their work represents a significant part of not only our culture but our reputation and our achievement as well. We embrace our employee’s differences in age, color, disability, ethnicity, family or marital status, gender identity or expression, language, national origin, race, religion, sexual orientation, socio-economic status, veteran status, and other characteristics that make our employees unique.
The Company incorporates annual training on “Valuing Diversity” along with other technical and professional development programs. Our emphasis on training allows employees to enhance and expand their abilities.
The Company offers competitive compensation to attract and retain talent. Our generous total rewards package includes market-competitive salary, bonuses, short-term and long-term equity incentives, healthcare and retirement benefits, and paid time off. Approximately 25% of our employees own stock in the Company. Employees have regular performance reviews and salary raises commensurate with performance.
With the outbreak of COVID in 2020, we sought to protect the health and well-being of our employees by adopting the ability of employees to work at home, practicing social distancing within our offices, and
109
Table of Contents
developing other procedures such as wearing of masks and frequent sanitizing of our workspaces. We worked with employees who had particular needs or concerns about the virus and safety of working within our offices. We continue to evolve to meet our employees’ health, wellness, and work-life balance needs.
Legal Proceedings
Southern States and Southern States Bank are parties to various legal proceedings in the ordinary course of their respective businesses, including proceedings to collect loans or enforce security interests. In the opinion of management, none of these legal proceedings currently pending will, when resolved, have a material adverse effect on the financial condition or the results of operations of Southern States or Southern States Bank. However, given the nature, scope and complexity of the extensive legal and regulatory landscape applicable to our business, including laws and regulations governing consumer protection, fair lending, fair labor, privacy, information security and anti-money laundering and anti-terrorism laws, we, like all banking organizations, are subject to heightened legal and regulatory compliance and litigation risk.
110
Table of Contents
Executive Officers
The following table sets forth certain information regarding our executive officers and the executive officers of the Bank, including their names, ages and positions:
| Name |
Age | Position with Southern States and the Bank | ||||
| Stephen W. Whatley |
69 | Chairman of the Board and Chief Executive Officer | ||||
| Mark Chambers |
57 | President | ||||
| Lynn Joyce |
57 | Senior Executive Vice President and Chief Financial Officer | ||||
| Greg Smith |
58 | Senior Executive Vice President and Chief Risk Officer | ||||
| Jack Swift |
60 | Senior Executive Vice President and Chief Operating Officer | ||||
The business experience of each of our executive officers is set forth below. There are no arrangements or understandings between any of the officers and any other person pursuant to which he or she was selected as an officer. The compensation for Mr. Whatley, Mr. Chambers and Ms. Joyce is set forth below under “Executive and Director Compensation” and such persons are sometimes referred to as “named executive officers.”
Stephen W. Whatley. Mr. Whatley has served as our Chief Executive Officer since 2007 and Chairman of our board of directors since 2014. Mr. Whatley has worked in the banking industry since 1973, in states across the country. Prior to joining Southern States, he served as Market President of Colonial Bank from 1982 through 2006. From 1980 until 1982, he served as Vice President Commercial Lender of AmSouth Bank and, from 1978 until 1982, as Vice President of Trust Company Bank. Whatley served as board member for the East Central Region of Colonial Bank from 1989 until 2000. He currently serves on the Wetlands America Trust Board. Mr. Whatley has served previously on the board of a number of non-profit entities, including Ducks Unlimited, Inc. and Community Action Agency. Mr. Whatley holds a Bachelor of Science in Economics from Auburn University and a Master of Arts in Economics from California State University at Los Angeles. Mr. Whatley’s extensive experience working in leadership roles in the banking industry, together with his skills and knowledge of the industry, are among his qualifications to serve as our Chairman of the Board and Chief Executive Officer.
Mark Chambers. Mr. Chambers has served as our President since 2019. From 2007 until 2019, he served as Senior Executive Vice President and President, Southeast Region of Southern States. Prior to joining Southern States, Mr. Chambers worked as Market President at Wachovia Bank from 2004 until 2007, and as a Commercial Lender at Aliant Bank from 1998 until 2004. Mr. Chambers holds a Bachelor of Science in Finance and a Master of Business Administration from Auburn University.
Lynn Joyce. Ms. Joyce has served as Senior Executive Vice President and Chief Financial Officer of Southern States since 2013. Prior to joining Southern States, she served as Executive Vice President and Chief Financial Officer of First Financial Bank, a NASDAQ listed institution for a portion of time during her tenure, from 1992 until 2013. From 1986 until 1992, Ms. Joyce worked in the audit division of a major accounting firm. Ms. Joyce is a member of the Alabama Society of Certified Public Accountants. Ms. Joyce holds a Bachelor of Science in Business Administration – Accounting from the University of Alabama, in Huntsville.
Greg Smith. Mr. Smith has served as Senior Executive Vice President and Chief Risk Officer of Southern States since 2019. From 2006 until 2019, he served as our Senior Vice President and Chief Credit Officer. Prior to joining Southern States, he worked as Credit Admin, Commercial Loan Officer and Market President at Regions Bank. Mr. Smith holds a Bachelor of Science in Finance from the University of Alabama.
Jack Swift. Mr. Swift has served as our Senior Executive Vice President and Chief Operating Officer since 2019. From 2006 until 2019, he served as Senior Executive Vice President and President, Central Region of Southern States. Prior to joining Southern States, he served as Senior Vice President of Colonial Bank from 1996 until 2006, and as Vice President of SouthTrust Bank from 1992 until 1996. Mr. Swift holds a Bachelor of Arts in Business Administration from Birmingham Southern University.
111
Table of Contents
Our executive officers are appointed by our board of directors and hold office until their successors are duly appointed and qualified or until their earlier death, resignation or removal. The executive officers of Southern States Bank are appointed by the board of directors of Southern States and Bank hold office until their successors are duly appointed and qualified or until their earlier death, resignation or removal.
In addition to the executive officers listed above, the Bank is managed by a team of experienced bankers who oversee various aspects of our organization including lending, credit administration, treasury services, wealth management, marketing, finance, operations, information technology, regulatory compliance, risk management and human resources. Our team has a demonstrated track record of achieving profitable growth, maintaining a strong credit culture, implementing a relationship-driven approach to banking and successfully executing acquisitions. The depth of our team’s experience, market knowledge and long-term relationships in Alabama and West Georgia provide us with a steady source of referral business.
Board of Directors
Our board of directors (or “board”) oversees our business and monitors the performance of management. In accordance with corporate governance principles, the independent members of our board do not involve themselves in day-to-day operations of Southern States or the Bank. The directors keep themselves informed through, among other things, discussions with our Chief Executive Officer, other key executives and our principal outside advisors (legal counsel, outside auditors, and other consultants), by reading reports and other materials that we send them and by participating in board and committee meetings.
The following table sets forth certain information about our directors, including their names, ages and year in which they began serving as a director of the Company.
| Directors |
Age | Director Since |
||||||
| Lewis Beavers |
72 | 2019 | ||||||
| Robert F. Davie |
81 | 2007 | ||||||
| Alfred J. Hayes, Jr. |
76 | 2015 | ||||||
| Brent David Hitson |
54 | 2007 | ||||||
| Brian Stacy Holmes |
57 | 2007 | ||||||
| Jimmy Alan LaFoy |
80 | 2007 | ||||||
| James Lynch |
71 | 2017 | ||||||
| Cynthia S. McCarty |
61 | 2020 | ||||||
| Jay Florey Pumroy |
64 | 2007 | ||||||
| J. Henry Smith, IV |
52 | 2009 | ||||||
| Henry Turner |
74 | 2008 | ||||||
| Stephen W. Whatley |
69 | 2007 | ||||||
In accordance with our bylaws, the total number of directors constituting the entire board may not be less than five nor more than 15. Our board of directors is currently composed of 12 members, each elected for a one year term, or until his or her successor is elected or qualified, or until his or her earlier death, resignation or removal. Our directors discharge their responsibilities throughout the year at board and committee meetings and also through telephone contact and other communications with our executive officers or directors.
Stephen W. Whatley’s employment agreement provides that he will be nominated as a director so that he may remain a director during the term of his employment. Mr. Beavers was added to the board of directors as a result of the acquisition by Southern States of Small Town Bank in 2019. The acquisition agreement for that transaction provided that Mr. Beavers will be nominated for a full three-year term and, as a result of moving to annual elections of directors, we expect to nominate Mr. Beavers for re-election at each of our next two annual meetings. In addition, Mr. Lynch is a member as a result of Patriot’s investment in Southern States and will
112
Table of Contents
continue to be a member as long as Patriot owns at least 4.9% of Southern States’ common stock. See “Description of Southern States Capital Stock.”
A brief description of the background of each of our directors, together with the experience, qualifications, attributes or skills that qualify each to serve as a director, is set forth below (other than Stephen W. Whatley, whose background is provided above).
Lewis Beavers. Mr. Beavers has worked as the managing partner of Lawrence, See & Beavers, a privately owned accounting firm, since 1976, and has served as Secretary and Treasurer of L&A Enterprises, Inc., a residential construction company, since 2002. He has served as a member of the Finance Committee of the Douglas County Chamber of Commerce since 2005 and has previously served on several advisory boards of community banks in Georgia. From 2006 until 2019, he served on the board of directors of Small Town Bank. Mr. Beavers holds a Bachelor of Business Administration in Accounting and Finance from West Georgia College. He received his CPA certificate in 1975 and currently holds a Residential Construction Contractor’s license from Georgia. Mr. Beavers’ extensive accounting and financial expertise, including in our industry and related industries, are among his qualifications to serve as a member of our board.
Robert F. Davie. Mr. Davie has owned and operated Davie’s School Supplies, a supplier of educational products with locations in Anniston, Alabama and Montgomery, Alabama, since 1975. He has served on the board of directors of the Southern Disability Foundation, a non-profit organization, since 2015. He holds a Bachelor of Arts and Science from Auburn University. Mr. Davie’s many years of experience owning and operating a business are among his qualifications to serve as a member of our board.
Alfred J. Hayes, Jr. Mr. Hayes has over 40 years of banking experience. Mr. Hayes retired from First Union Bank in 1997 after 30 years, and from Colonial Bank in 2009. Mr. Hayes is active in civic, social, and professional organizations in Columbus, Georgia. Mr. Hayes holds a Bachelor of Business Administration in Real Estate from the University of Georgia and a Masters of Business Administration from Columbus State University. Mr. Hayes’ extensive experience working in our industry and his understanding of the regulatory structure in which we operate are among his qualifications to serve as a member of our board.
Brent David Hitson. Mr. Hitson is a partner at Burr & Forman LLP, a law firm in Birmingham, Alabama, a position he has held since 2005. Mr. Hitson holds a Bachelor of Science in Business Administration from Auburn University and a Juris Doctorate from Cumberland School of Law at Samford University. Upon graduation from law school in 1996, Mr. Hitson spent a year working as a judicial law clerk at the United States Court of Federal Claims in Washington, D.C. Mr. Hitson is licensed to practice law in Alabama, Georgia and Mississippi, and has handled matters in multiple state and federal courts across the United States. Mr. Hitson’s legal expertise combined with his past experience owning and managing his own company are among his qualifications to serve as a member of our board.
Brian Stacy Holmes. Mr. Holmes has owned and served as President of Holmes II Excavation, Inc., a privately owned construction company, since 1992. Mr. Holmes has also owned and served as managing member of Holmes Properties, LLC, a real estate investment company, since 1999, and as owner and managing member of Salt Creek Land Company, LLC, a real estate investment company, since 2001. Mr. Holmes is currently part owner and member of TLC, LLC, a real estate investment company, which he has owned since 2010. Mr. Holmes’ experience and expertise in management and business operations are among his qualifications to serve as a member of our board.
Jimmy Alan LaFoy. Mr. LaFoy has worked as General Manager at LaFoy and Associates, CPA, LLC, an accounting firm he has privately owned since 2003. From 1977 until 2003, he worked as an accountant. Mr. LaFoy has served as a member of the board of directors of the Baldwin Electric Membership Charitable Foundation, a non-profit organization, since 2009, and as a member of the board of directors of the National Rural Utilities Corporation Finance Cooperative, a non-profit organization, since 2015. Mr. LaFoy served as a member of the board of directors of Farmers National Bank, and of its successor, First American Bank, until
113
Table of Contents
2006. Mr. LaFoy holds a Bachelor of Science in Commerce and Business, with a major in Accounting, from the University of Alabama. Mr. LaFoy’s extensive career in the accounting and financial industries, as well as his knowledge of business operations, are among his qualifications to serve as a member of our board.
James Lynch. Mr. Lynch has served as the managing partner of Patriot Financial Partners, a private equity fund focusing on investments in the community bank sector (“Patriot”), since 2007. Mr. Lynch has more than 40 years of banking experience, including prior service as a Chief Executive Officer. Mr. Lynch has also served as a member of the board of directors of a number of bank holding corporations, including Cape Bancorp, from 2008 until 2015 and Heritage Oaks Bancorp, from 2009 until 2017. Mr. Lynch holds a Bachelor of Science in Marketing from LaSalle University. Mr. Lynch’s experience in finance, strategic planning and investing, along with his experience serving on boards of directors in our industry, are among his qualifications to serve as a member of our board.
Cynthia S. McCarty. Ms. McCarty is a professor of economics at Jacksonville State University, a position she has held since 1990. Ms. McCarty holds a Bachelor of Arts degree in Foreign Language International Trade with a minor in Finance and Economics from Auburn University. She also holds a Masters in Business Administration from the University of North Carolina Chapel Hill. Ms. McCarty’s business and economic knowledge and expertise are among her qualifications to serve as a member of our board.
Jay Florey Pumroy. Mr. Pumroy has worked as a senior partner of Wilson, Dillon, Pumroy and James, LLC, a law firm, since 1982. He has investments in retail and commercial real estate through Business Park, LLC and Covington Properties South, LLC. Mr. Pumroy has served as a member of the board of directors of Mt. Cheaha Corporation, a private Harley Davidson dealership, since 2004, and on the board of directors of Soup Bowl of Anniston, Inc., a non-profit organization, since 2013. Mr. Pumroy served as a member of the board of directors of the East Central Region of Colonial Bank from 1987 until 2006. He holds a Bachelor of Science in Accounting from the University of Alabama and a Juris Doctorate from the Law School of the University of Alabama. Mr. Pumroy is an active member of the Alabama Bar Association and is a long term member of the Calhoun County Chamber of Commerce. Mr. Pumroy’s legal and business management expertise and experience are among his qualifications to serve as a member of our board.
J. Henry Smith, IV. For more than 20 years, Mr. Smith has served as President of Interstate Sheet Metal Co., Inc., a sheet metal contractor specializing in public works projects and other large contracts throughout Alabama. He holds a Bachelor of Arts in History from Vanderbilt University. Mr. Smith’s extensive managerial experience, as well as his business development and project execution experience and knowledge of business operations, are among his qualifications to serve as a member of our board.
Henry Turner. Mr. Turner has worked at Honda Motor Company, a publicly traded automobile manufacturer, in its Alabama Operations for more than 20 years, including as a purchasing manager for Honda of America, from 1988 until 2000, and Department Manager, Purchasing Department for Honda of Alabama, from 2000 until 2010. Prior to joining the Honda Motor Company, Mr. Turner worked as a registered representative with Murch and Co., a private brokerage firm. Mr. Turner has served on a number of civic organizations, including as a member and Chairperson of the South Regions Minority Supplier Development Council and currently as a member of the board of directors of the Minority Business Opportunity Committee since 2011. Mr. Turner holds a Bachelor of Science in General Business from John Carroll University. Mr. Turner’s many years of leadership experience at a large public company, his background and finance, and his experience serving civic organizations and the community are among his qualifications to serve as a member of our board.
Corporate Governance Principles and Board Matters
Director Qualifications
We believe that our directors should have the highest professional and personal ethics and values, consistent with our longstanding values and standards. They should have broad experience at the policy-making level in
114
Table of Contents
business, government or civic organizations. They should be committed to enhancing stockholder value and should have sufficient time to carry out their duties and to provide insight and practical wisdom based on their own unique experience. Each director must represent the interests of all stockholders. When considering potential director candidates, our board of directors also considers the candidate’s independence, character, judgment, diversity, age, skills, including financial literacy, and experience in the context of our needs and those of our board of directors. While we have no formal policy regarding the diversity of our board of directors, our board of directors may consider a broad range of factors relating to the qualifications and background of director nominees, which may include personal characteristics. Our board of director’s priority in selecting board members is the identification of persons who will further the interests of our stockholders through his or her record of professional and personal experiences and expertise relevant to our growth strategy.
Director Independence
Under the rules of NASDAQ, independent directors must comprise a majority of our board of directors within a specified period of time of this offering. The rules of NASDAQ, as well as those of the SEC, also impose several other requirements with respect to the independence of our directors. Our board of directors has undertaken a review of the independence of each non-employee director based upon these rules and the charter of our Nominating and Corporate Governance Committee. Applying these standards, our board of directors has affirmatively determined that, with the exception of Mr. Pumroy and Mr. Holmes, each of our current non-employee directors qualifies as an independent director under the applicable rules. The 9 independent directors constitute a majority of the 12 members of our board of directors.
In making independence determinations, our board of directors has considered the current and prior relationships that each director has with us and all other facts and circumstances our board of directors deemed relevant in determining their independence, including the beneficial ownership of our capital stock by each director, and the transactions involving them described in the section titled “Certain Relationships and Related Party Transactions.”
Board Leadership Structure
Our board of directors meets at least quarterly. Our board of directors solicits input and nominations from its members and elects one of its members as Chairman. The roles of Chief Executive Officer and Chairman of our board of directors, and the corresponding roles at the Bank, are held by Stephen W. Whatley, and, we do not have a policy regarding the separation of these roles, as our and the Bank’s board of directors believes that it is in the best interests of our organization to make that determination from time to time based on the position and direction of our organization and the membership of our board of directors. Our and the Bank’s board of directors has determined that combining the roles of Chief Executive Officer and Chairman is in the best interests of our stockholders at this time. Mr. Pumroy currently serves as lead director.
Board Risk Management and Oversight
Our board of directors is ultimately responsible for the oversight of our overall risk management processes while the Bank’s board of directors is responsible for risk management oversight at the Bank. Our board of directors approves policies that set operational standards and risk limits at the Bank, and any changes to the Bank’s risk management program require approval by the Bank’s board of directors. Management is responsible for the implementation, integrity and maintenance of our risk management systems ensuring the directives are implemented and administered in compliance with the approved policy. Our board of directors has established standing committees to oversee our corporate risk governance processes, as described more fully below. In addition, we have appointed a Chief Risk Officer, who is a member of our executive management team, to support the risk oversight responsibilities of the board of directors and its committees and to involve management in risk management as appropriate by establishing committees comprised of management personnel who are assigned responsibility for oversight of certain operational risks. The Chief Risk Officer reports to the board of directors each quarter on our enterprise-wide risk management system. Greg Smith serves as our Chief Risk Officer.
115
Table of Contents
Compensation Committee Interlocks and Insider Participation
No members of our compensation committee have been an officer or employee of the Company or the Bank. None of our executive officers is expected to serve or have served as a member of the board of directors, compensation committee or other board committee performing equivalent functions of any entity that has one or more executive officers serving as one of our directors or on our compensation committee. To the extent that any members of our compensation committee have participated in transactions with us, a description of those transactions is provided in “Executive and Director Compensation—Director Compensation,” and “Certain Relationships and Related Party Transactions.”
Code of Business Conduct and Ethics
Our board of directors has adopted a Code of Business Conduct and Ethics that is designed to ensure that our directors, executive officers and employees meet the highest standards of ethical conduct. The Code of Business Conduct and Ethics requires that our directors, executive officers and associates avoid conflicts of interest, comply with all laws and other legal requirements, conduct business in an honest and ethical manner and otherwise act with integrity and in our best interest. Amendments to the Code of Business Conduct and Ethics, or any waivers of their requirements with respect to our directors or executive officers, will be disclosed on our corporate website or by such other means as may be required by applicable NASDAQ rules. A copy of our Code of Business Conduct and Ethics will be available free of charge on the Investor Relations section of our website at www.southernstatesbank.net.
Board Committees
Our board of directors has established standing committees in connection with the discharge of its responsibilities. These committees include the Audit Committee, the Compensation Committee, and the Nominating and Corporate Governance Committee. Our board of directors also may establish such other committees as it deems appropriate, in accordance with applicable law and regulations and our corporate governance documents.
Audit Committee
Our Audit Committee consists of Messrs. LaFoy (Chairman), Smith, Beavers and Hayes. Our Audit Committee has the responsibility for, among other things:
| • | overseeing the design and implementation of our internal audit function; |
| • | selecting, engaging and overseeing the independent auditors; |
| • | overseeing the integrity of our financial statements, including the annual audit, the annual audited financial statements, financial information included in our periodic reports that will be filed with the SEC and any earnings releases or presentations; |
| • | overseeing our financial reporting process and internal controls; |
| • | overseeing our compliance with applicable laws and regulations; |
| • | overseeing our compliance and risk management functions; |
| • | overseeing our process for receipt of complaints and confidential, anonymous submissions regarding accounting, internal accounting controls or auditing matters; and |
| • | reviewing and investigating any possible violation of the Code of Business Conduct and Ethics or other standards of business conduct by any director or executive officer of the Company. |
Rule 10A-3 promulgated by the SEC under the Exchange Act and applicable NASDAQ rules require our audit committee to be comprised entirely of independent directors. Our board of directors has affirmatively
116
Table of Contents
determined that each of the members of our Audit Committee is independent under the rules of NASDAQ and for purposes of serving on an audit committee under applicable SEC rules. Our board of directors also has determined that Mr. LaFoy qualifies as an “audit committee financial expert” as defined by the SEC. Our board of directors has adopted a written charter for our Audit Committee, which will be available free of charge on the Investor Relations section of our website at www.southernstatesbank.net.
Compensation Committee
Our Compensation Committee consists of Messrs. LaFoy (Chairman), Hayes, Smith and Turner. Our Compensation Committee is responsible for, among other things:
| • | reviewing and approving goals and objectives relevant to the compensation of our executive officers; |
| • | evaluating the performance of our executive officers and determining and approving the compensation levels of executive officers based on that evaluation; |
| • | reviewing and administering our equity incentive plans, including the 2017 Incentive Stock Compensation Plan, and executive compensation programs; |
| • | reviewing, approving and submitting to the board for approval other compensation of our executive officers, and any significant amendments or changes to such arrangements; and |
| • | preparing the report of the Compensation Committee as required by item 407(e)(5) of Regulation S-K, when applicable. |
Applicable NASDAQ rules require the Compensation Committee to be comprised entirely of independent directors. Our board of directors has affirmatively determined that each of the members of our Compensation Committee is independent under the rules of NASDAQ and for purposes of serving on a Compensation Committee under applicable SEC rules, and that each are “non-employee directors” as defined in Rule 16b-3 of the Exchange Act. To the extent that the Compensation Committee has one or more members who are not “non-employee directors” as defined in Rule 16b-3 of the Exchange Act, grants of stock or equity awards will be made by a subcommittee of the Compensation Committee consisting solely of “non-employee directors” or by our full board or directors. Our board of directors has adopted a written charter for the Compensation Committee, which will be available free of charge on the Investor Relations section of our website at www.southernstatesbank.net.
Nominating and Corporate Governance Committee
Our Nominating and Corporate Governance Committee consists of Messrs. Hitson (Chairman), Hayes, LaFoy and Turner. Our Nominating and Corporate Governance Committee is responsible for, among other things:
| • | identifying individuals qualified to become board members consistent with criteria approved by the board of directors; |
| • | selecting, or recommending that the board of directors select, director nominees for the next annual meeting of stockholders or to fill vacancies; |
| • | assisting the board of directors in fulfilling its oversight responsibilities relating to developing and implementing sound governance policies and practices; |
| • | recommending director committee assignments; and |
| • | developing and overseeing a process for the annual evaluation of the board of directors and management. |
Applicable NASDAQ rules require director nominees to be selected, or recommended for the board’s section, either by independent directors constituting a majority of the board’s independent directors, or by a
117
Table of Contents
committee consisting solely of independent directors. We have established a Nominating and Corporate Governance committee comprised entirely of independent directors. Our board of directors has affirmatively determined that each of the members of our Nominating and Corporate Governance Committee is independent under the rules of NASDAQ. Our board of directors has adopted a written charter for our Nominating and Corporate Governance Committee, which will be available free of charge on the Investor Relations section of our website at www.southernstatesbank.net.
118
Table of Contents
EXECUTIVE AND DIRECTOR COMPENSATION
We have opted to comply with the executive compensation disclosure rules applicable to “emerging growth companies.” In accordance with such rules, we are permitted to provide a Summary Compensation Table and an Outstanding Equity Awards at Fiscal Year End Table, as well as limited narrative disclosures. Further, our reporting obligations extend only to the individuals serving as our principal executive officer and our two other most highly compensated executive officers, which are referred to as our “named executive officers.” This section provides an overview of our executive compensation program, including a narrative description of the material factors necessary to understand the information disclosed in the summary compensation table below.
The compensation reported in the Summary Compensation Table below is not necessarily indicative of how we will compensate our named executive officers in the future. We will continue to review, evaluate and modify our compensation framework to maintain a competitive total compensation package. As such, and as a result of our becoming a publicly traded company, the compensation program following this offering could vary from our historical practices.
Our named executive officers for the year ended December 31, 2020 were:
| • | Stephen W. Whatley, Chairman and Chief Executive Officer of Southern States and the Bank; |
| • | Mark Chambers, President of Southern States and the Bank; and |
| • | Lynn Joyce, Senior Executive Vice President and Chief Financial Officer of Southern States and the Bank. |
Summary Compensation Table
The following table summarizes the total compensation paid to or earned by each of the named executive officers for the year ended December 31, 2020. Unless otherwise noted, all cash compensation for each of our named executive officers was paid by the Bank.
| Name and Principal |
Year | Salary ($) |
Bonus ($) |
Stock Awards ($)(1) |
Option Awards ($)(1) |
Non-Equity Incentive Plan Compensation ($)(2) |
All Other Compensation ($)(3) |
Total ($) |
||||||||||||||||||||||||
| Stephen W. Whatley |
2020 | 473,820 | 77,500 | 71,073 | 71,073 | 211,703 | 33,314 | 938,483 | ||||||||||||||||||||||||
| Chairman and Chief Executive Officer |
||||||||||||||||||||||||||||||||
| Mark Chambers |
2020 | 327,100 | — | 40,888 | 40,088 | 109,611 | 29,088 | 547,575 | ||||||||||||||||||||||||
| President |
||||||||||||||||||||||||||||||||
| Lynn Joyce |
2020 | 302,100 | — | 37,763 | 37,763 | 101,234 | 34,856 | 513,716 | ||||||||||||||||||||||||
| Senior Executive Vice President and Chief Financial Officer |
||||||||||||||||||||||||||||||||
| (1) | The amounts set forth reflect the aggregate grant date fair value in accordance with FASB ASC Topic 718. See “Note 9” to our consolidated financial statements for additional detail regarding the assumptions underlying the value of these equity awards. These awards were made pursuant to the 2017 Incentive Stock Compensation Plan. |
| (2) | Represents amounts earned and paid under the Southern States Bank Performance Incentive Plan with respect to performance in the year ended December 31, 2020. |
| (3) | The following table shows the amounts included in “All Other Compensation.” |
119
Table of Contents
| Car Allowance ($) |
Country Clubs Dues ($) |
401(k) Employer Contributions ($)(1) |
Life Insurance Premiums ($)(2) |
Director Fees ($)(3) |
Dividends Paid ($) |
Total ($) |
||||||||||||||||||||||
| Stephen W. Whatley |
15,000 | 1,207 | 11,400 | 1,500 | 1,400 | 2,807 | 33,314 | |||||||||||||||||||||
| Mark Chambers |
15,000 | — | 13,193 | 1,500 | 500 | 688 | 29,088 | |||||||||||||||||||||
| Lynn Joyce |
15,000 | 5,940 | 14,662 | 1,500 | — | 1,016 | 34,856 | |||||||||||||||||||||
| (1) | Represents Southern States’ matching contributions under the Southern States 401(k) Plan. |
| (2) | Represents the employer-paid insurance premiums. |
| (3) | For Mr. Whatley, represents fees earned or paid in cash for board and committee attendance. These fees are no longer paid after February 2020. For Mr. Chambers, represents advisory board fees for Southern States Bank. These fees are no longer paid after February 2020. |
Narrative Disclosure to the Summary Compensation Table
General
We compensate our named executive officers through a combination of base salary, annual incentive bonus (under the Southern States Bank Performance Incentive Plan), discretionary bonuses, equity awards (under the 2017 Incentive Stock Compensation Plan), and other benefits including perquisites. Our Compensation Committee believes our executive compensation practices should attract, motivate, and retain key talent, while also tying pay to performance to promote stockholder value and core values. Each element of compensation is designed to achieve a specific purpose and to contribute to a total package that is competitive with similar packages provided by other institutions that compete for the services of individuals like our named executive officers. During 2020, decisions regarding compensation were made by the Compensation Committee.
Base Salary
We provide each of our named executive officers with a competitive fixed annual base salary. When setting the base salary of each named executive officer for 2020, the Compensation Committee considered a variety of considerations, including: salaries offered by members of our peer group as set forth in information provided by our external compensation consultant, Compensation Advisors, which is a member of Newcleus; internal pay equity considerations; the results achieved by each executive; future potential; experience; and scope of responsibilities. On an annual basis, the Compensation Committee reviewed base salaries of our named executive officers. The Compensation Committee, without the involvement of any of our named executive officers, determined the base salary for Mr. Whatley. With respect to our other named executive officers, the Compensation Committee, while overseeing the process and having the authority to override any compensation decisions, has historically allowed Mr. Whatley latitude in establishing base salaries.
In January 2021, base salaries were increased to $500,000, $345,000 and $318,000 for Mr. Whatley, Mr. Chambers and Ms. Joyce, respectively.
Annual Incentive Bonus
Our named executive officers participate in the Southern States Bank Performance Incentive Plan (“PIP”), a performance-based annual cash incentive plan intended to incentivize Company performance. Under the PIP, participants, including our named executive officers, are eligible to earn bonuses as a percentage of annual base salary based on achievement of goals established by senior management, which goals are reviewed and approved by the Compensation Committee, typically at the beginning of each year. At the end of the year, to the extent the applicable goals are met, the participant will be eligible for a bonus. The overall percentage of goals achieved must be 80% or higher in order for any incentive awards to be paid. An unacceptable level of problem loans issued by Southern States Bank can reduce incentive payments for affected participants and their management. The ultimate amount of the award can be adjusted up or down in the discretion of senior management and the Compensation Committee.
120
Table of Contents
For the year ended December 31, 2020, the performance factors for the PIP for our named executive officers were net income after taxes (weighted 35%), qualified loan origination (weighted 20%), loan portfolio balance growth (weighted 15%), checking deposit balance growth (weighted 20%), and money market account and savings balance growth (weighted 10%).
Based on actual performance for the year ended December 31, 2020, Mr. Whatley was eligible to earn 32% to 48% of his base salary, and Mr. Chambers and Ms. Joyce were eligible to earn 24% to 36% of their base salary. For the year ended December 31, 2020, Mr. Whatley earned a bonus of $211,703, or 44.7% of his base salary, and Mr. Chambers and Ms. Joyce earned bonuses of $109,611 and $101,234, respectively, or 33.5% of their base salaries. The bonuses were paid in February 2021.
Discretionary Bonus
Discretionary bonuses are determined on a discretionary basis and are generally based on individual and company performance. For the year ended December 31, 2020, Mr. Whatley was paid a discretionary bonus of $77,500, which is the first of three annual bonuses in that amount the Company expects to pay to Mr. Whatley for successfully completing the acquisition of Small Town Bank.
Equity Awards
Our named executive officers are eligible for long-term equity incentive awards under the 2017 Incentive Stock Compensation Plan (the “Plan”). The Compensation Committee believes that granting equity awards to our named executive officers enhances performance consistent with our corporate strategic values, focuses our executives on long-term performance results consistent with the Company’s long-term strategic plan, and strengthens the link between executive pay and our stockholders by creating a shared interest in the Company’s growth. The Compensation Committee establishes a target award for each participant which, for our named executive officers, is stated as a percentage of annual base salary. For 2020, these percentages were 30% for Mr. Whatley, and 25% for Mr. Chambers and Ms. Joyce. The Compensation Committee has discretion to award Mr. Whatley up to an additional 5% of his base salary, and our Chief Executive Officer has discretion to award other officers up to an additional 5% of their base salary. Awards may be in the form of shares of restricted stock (“Restricted Stock”), incentive stock options (“ISOs”) or non-qualified stock options (“NQSOs”), and vest over time under the conditions set forth in the applicable award agreement.
The amounts shown in the Stock Awards column of the Summary Compensation Table above reflect grants of 3,548, 2,041 and 1,885 shares of Restricted Stock to Mr. Whatley, Mr. Chambers and Ms. Joyce, respectively, on January 30, 2021 attributable to the year ended December 31, 2020, which are valued at $71,073, $40,888 and $37,763, respectively, and vest in one-third increments over three years, beginning on the date of the grant.
The amounts shown in the Option Awards column of the Summary Compensation Table above reflect grants of 7,275, 4,185 and 3,865 ISOs to Mr. Whatley, Mr. Chambers and Ms. Joyce, respectively, on January 30, 2021 attributable to the year ended December 31, 2020. The ISOs vest in one-third increments over three years, beginning on the date of the grant. The exercise price of the ISOs is $20.03 per share.
Benefits and Other Perquisites
Our named executive officers are eligible to participate in the same benefit plans available to all of our full-time employees, including medical, dental, vision, life, disability and accidental death insurance.
We also provide our employees, including our named executive officers, with several retirement benefits. Our retirement plans are designed to assist our employees with planning for and securing appropriate levels of income during retirement. We believe these plans help us attract and retain quality employees, including executives, by offering benefits similar to those offered by our competitors.
121
Table of Contents
Southern States Bank has a non-qualified supplemental executive retirement plan (“SERP”) for each of its executive officers, including our named executive officers. The SERP is an employer paid deferred compensation agreement that provides a life-time supplemental retirement income to the employee, based on certain vesting and other requirements. Southern States Bank has purchased bank owned life insurance policies (“BOLI”) and annuities on each of the SERP participants as a means of funding the benefits provided in the SERP. The benefits are paid upon retirement provided the executive is in good standing with the Company. Southern States is the owner of the BOLI and the annuities are held in a rabbi trust. Under each of the SERPs for our named executive officers, the normal retirement benefit will generally be paid upon the named executive officer’s separation from service for any reason other than death, disability, or a change in control after reaching the retirement age specified in the SERP, provided the executive agrees that for a period of 12 months after separation from service, the executive will not engage in certain competitive activities within a 50 mile radius of any offices of the Bank. The benefit will be paid monthly, commencing on the first day of the second month following the date of the named executive officer’s separation from service and continuing for the named executive officer’s lifetime. In addition, a vested percentage of the monthly SERP benefit will be paid upon the named executive officer’s separation from service (i) for any reason other than death, disability, or a change in control after reaching early retirement age but prior to normal retirement age or (ii) as a result of becoming disabled, commencing on the first day of the second month following the named executive officer’s normal retirement age and continuing for the named executive officer’s lifetime. The vested percentage is 50% at age 55 and increases by 5 percent for each year until age 65. Upon the named executive officer’s death, Southern States Bank will pay the beneficiary the account balance no later than sixty days from the date of death, unless such death occurs after the named executive officer received 180 or more payments, in which case no additional payments will be made under the SERP. Upon a change in control of Southern States Bank, the named executive officers will fully vest in the normal retirement benefit, which will be paid monthly, starting on either (A) the later of (1) the named executive officer reaching the normal retirement age and (2) a separation from service or (B) a separation from service, depending on the SERP. The payment is tax-deductible to Southern States and taxable to the participant. Under the SERP, if, after reaching normal retirement age, a separation of service occurred, Mr. Whatley, Mr. Chambers and Ms. Joyce would receive approximately $200,000, $150,000 and $150,000 in annual lifetime benefits, respectively.
2017 Incentive Stock Compensation Plan
The purpose of the Plan is to promote the long-term success of the Company by providing financial incentives to eligible persons who are in positions to make significant contributions toward our success. The Plan is designed to enable the Company to attract individuals of outstanding ability for employment, to provide a method for such individuals to acquire ownership in the Company, and to render superior performance for the Company. The Plan was adopted by the Company and approved by stockholders in 2018.
The Plan is administered by the Compensation Committee, which has authority to grant awards under the Plan, to determine the terms of each award (which are evidenced by a written agreement describing the material terms of the award), to interpret the provisions of the Plan and to make all other determinations that it may deem necessary or advisable to administer the Plan.
The Plan provides for awards of up to 1,400,000 shares of common stock, which may be issued in the following forms:
| • | Options: Awards of options may be granted as either ISOs qualified under Section 422(b) of the Internal Revenue Code or NQSOs. The exercise price of an option (excluding an ISO granted to a 10% owner) may not be less than 100% of the fair market value of our common stock on the date of the grant. The exercise price may be paid in cash, or as otherwise provided in the award agreement. |
| • | Restricted Stock: Awards of Restricted Stock may be issued subject to the terms and conditions as the Compensation Committee may determine. The recipient of an award of Restricted Stock has the right to receive dividends and vote shares awarded during the vesting period of such shares. A grant of Restricted Stock provides the recipient a right for 30 days from the date of grant to purchase additional shares of common stock from the Company in an amount equal to the number of shares of common stock subject to the grant. |
122
Table of Contents
The Compensation Committee has the authority to determine the vesting schedule applicable to each award, and to accelerate the vesting or exercisability of any award.
In the event of any transaction resulting in a change in control, outstanding stock options and other awards under the Plan that are payable in or convertible into our common stock will terminate upon the effective time of such change in control unless provision is made in connection with the transaction for the continuation or assumption of such awards by, or for the substitution of the equivalent awards of, the surviving or successor entity or a parent thereof. In the event of such termination, the holders of such awards will be permitted, immediately before the change in control, to exercise or convert all portions of such awards that are then exercisable or convertible or that will become exercisable or convertible upon or prior to the effective time of the change in control. The Compensation Committee may take such actions as it deems appropriate to provide for the acceleration of the exercisability of any or all outstanding stock options or other awards.
In the event of certain corporate transactions (including a stock dividend or split, spin-off, split-up, dividend, recapitalization, merger, consolidation or share exchange, or similar corporate change that is not part of a transaction resulting in a change in control of us), the Compensation Committee will appropriately adjust, if needed, (a) the maximum number and kind of shares reserved for issuance or with respect to which awards may be granted under the Plan and (b) the terms of outstanding awards, including, but not limited to, the number, kind, and price of securities subject to such awards.
Our board of directors may terminate, amend, or modify the Plan or any portion thereof at any time; provided, however, that (i) any such amendment that would require stockholder approval in order to ensure compliance with any applicable rules or regulations; and (ii) any amendment that would change the maximum aggregate number of shares for which awards may be granted under the Plan is generally subject to approval of the stockholders of the Company.
Employment and Change in Control Agreements
Each of Stephen W. Whatley, Mark Chambers and Lynn Joyce, the named executive officers, have employment agreements.
Mr. Whatley
The employment agreement, dated March 24, 2010, between Southern States Bank and Mr. Whatley, as amended by the amendment to the employment agreement, dated September 21, 2016 (the “Whatley Agreement”) provides for a two year term which automatically renews each day so that the term is always two years. Compensation set forth in the Whatley Agreement includes a base salary that is reviewed annually, annual incentive payments that are determined by the board of directors and equity incentives. In addition, Southern States Bank shall make available to Mr. Whatley, through its group term life insurance policy, life insurance coverage in an amount equal to at least one times his base salary, but not to exceed $250,000, and Mr. Whatley will also be entitled to receive up to $1,500 to purchase additional life insurance. The agreement may be terminated by Southern States Bank for cause (as defined in the Whatley Agreement) and any benefits cease except for earned but unpaid salary and benefits. The Whatley Agreement may also be terminated:
| • | upon disability or death, in which case Southern States Bank’s obligations cease except that the full salary and perquisites shall be paid upon disability until Mr. Whatley has satisfied the “elimination period” under any disability or insurance plan; |
| • | without cause, by Southern States Bank, in which case Mr. Whatley will be (i) entitled to receive a severance payment (described below) and (ii) deemed to have retired from Southern States Bank and be entitled to receive the total combined qualified and non-qualified retirement benefit to which he is entitled under the Whatley Agreement; |
123
Table of Contents
| • | by Mr. Whatley voluntarily, in which case Southern States Bank’s obligations cease except for earned but unpaid salary and benefits; and |
| • | by Mr. Whatley for good reason, in which case Mr. Whatley shall be paid a severance payment (described below). |
Mr. Whatley shall receive as a severance payment for termination without cause or for good reason a sum equal to one times the aggregate cash compensation due for the most recently completed calendar year and certain annualized benefits under employee benefit plans within 30 days of the time of termination. For purposes of determining compensation which is not fixed, such as a bonus, the annual amount of such unfixed compensation will be deemed to be equal to the average of such compensation over the three-year period immediately prior to the termination. In addition, all stock grants or options not vested shall be deemed to have vested and Mr. Whatley shall be credited with service for the remaining term of the Whatley Agreement under existing benefit plans.
For purposes of the Whatley Agreement, “good reason” means, without Mr. Whatley’s consent, any reduction in base salary, a material diminution in Mr. Whatley’s authority, duties or responsibilities, the failure of any successor to Southern States Bank to perform the Southern States Bank’s obligations, a material breach of the Whatley Agreement by Southern States Bank, or Southern States Bank requiring Mr. Whatley to be permanently assigned to a location other than the current or future headquarters of Southern States Bank. Notwithstanding the foregoing, good reason shall be deemed to occur only when Mr. Whatley provides notice to Southern States Bank that a good reason event has occurred within 90 days of such occurrence, and Southern States Bank does not remedy the condition within 30 days of such notice.
The Whatley Agreement also provides that Mr. Whatley will be nominated as a director during the term of his employment.
Upon a change in control of Southern States Bank, and the termination of the employment of Mr. Whatley during the period beginning one year prior to and ending two years following such change in control for any reason other than cause, death or disability, Southern States Bank shall pay Mr. Whatley an amount equal to one times his highest annual compensation during the preceding three year period in 12 equal monthly payments. “Annual compensation” shall mean Mr. Whatley’s annual base salary and cash bonus payments, excluding reimbursements and amounts attributable to stock options and other non-cash compensation. “Change in control” shall mean a change in the ownership or effective control of Southern States Bank or in the ownership of a substantial portion of the assets of Southern States Bank as set forth in applicable U. S. Treasury regulations.
The Whatley Agreement contains customary restrictive covenants with respect to the disclosure of confidential information and return of property. Each of these covenants may be enforced through specific performance, injunctive relief and other equitable remedies.
Mr. Whatley is also subject to a Confidentiality, Non-Competition Agreement and Non-Solicitation Agreement, dated September 21, 2016 (the “Whatley Non-compete Agreement”), pursuant to which, among other things, he will not as an agent, employee, stockholder or otherwise compete with Southern States Bank or directly or indirectly solicit customers of Southern States Bank for a period of 12 months immediately following his termination of employment. Upon a termination of his employment (other than for cause (as defined in the Whatley Non-compete Agreement)), in consideration of Mr. Whatley’s covenant not to compete, Southern States Bank shall pay Mr. Whatley a sum equal to two times his highest annual compensation (as defined in the Whatley Non-compete Agreement) during the preceding three year period, including the year of such termination, in 12 equal monthly payments beginning the first day of the month following the termination of Mr. Whatley’s employment.
124
Table of Contents
The Whatley Non-Compete Agreement contains customary restrictive covenants with respect to the disclosure of confidential information and return of property. Each of these covenants may be enforced through injunctive relief and other equitable remedies.
Mr. Chambers
The employment agreement, dated February 5, 2007, by and between NAB, LLC, an Alabama limited liability company (which is the organizational predecessor to Southern States Bank), and Mr. Chambers, as amended on April 14, 2021 (as amended, the “Chambers Agreement”), provides for a three year term with the term extended on each anniversary so that the term continues to be three years from the extension unless terminated by either party upon six months’ notice before the automatic renewal date. Compensation set forth in the Chambers Agreement includes a base salary that is reviewed annually, annual incentive payments that are determined by the board of directors and equity incentives. The Chambers Agreement also provides for a term life policy of a minimum amount of $1,000,000. The Chambers Agreement may be terminated by Southern States Bank for cause (as defined in the Chambers Agreement) and any benefits cease except for earned but unpaid salary and benefits. The Chambers Agreement may also be terminated:
| • | upon death, in which case Southern States’ obligations are limited to paying any salary earned and any other amounts that may be due to the executor or administrator of Mr. Chambers’ estate; |
| • | upon total disability (as defined in the Chambers Agreement), in which case Mr. Chambers’ compensation pursuant to the Chambers Agreement will terminate and Mr. Chambers will be paid in accordance with the long-term disability plans of Southern States Bank as may be in effect at that time; and |
| • | without cause, by Southern States Bank, in which case Mr. Chambers shall receive severance compensation in an amount equal to his base salary for the balance of the three year term, any other amounts owed to Mr. Chambers at the time his employment terminates and continued insurance benefits in effect at the time of such termination for a period of 12 months after the termination date or until Mr. Chambers is employed by another employer (excluding self-employment), whichever period of time is shorter. |
Upon a change in control (as defined in the Chambers Agreement), if Mr. Chambers’ employment is terminated (except for cause) within the one year period after such change in control and before he reaches age 75, or has a change of duties or salary during such period, he will be entitled to a severance payment equal to two times his cash compensation for the most recently completed calendar year plus the annualized amounts being paid for his benefits participation total for each year. A change of duties or salary means a change in duties and responsibilities which results in duties and responsibilities that are inferior to his duties and responsibilities at the time of the change in control, a reduction in his annual salary from such rate in effect at the time of the change in control or a change of place of assignment from Lee County, Alabama to a location that is located further than 25 miles from Lee County, Alabama.
The Chambers Agreement also provides that Mr. Chambers will not engage in certain competitive activities within a 50 mile radius of any office of the Bank for a period of 12 months after termination, provided that Mr. Chambers is paid a severance payment equal to one times his base salary. The agreement contains customary restrictive covenants with respect to the disclosure of confidential information and return of property. Each of these covenants may be enforced through injunctive relief and other equitable remedies.
Ms. Joyce
The employment agreement, dated February 19, 2013, by and between Southern States Bank and Ms. Joyce, as amended on April 14, 2021 (as amended, the “Joyce Agreement”) provides for a one-year term which automatically renews each day so that the term is always one year. Compensation set forth in the Joyce Agreement includes a base
125
Table of Contents
salary that is reviewed annually, annual incentive payments that are determined by the board of directors and/or the Chief Executive Officer and eligibility to participate in equity incentive programs of Southern States Bank. In addition, Southern States Bank shall make available to Ms. Joyce, through its group term life insurance policy, life insurance coverage in an amount equal to at least one times her base salary, but not to exceed $250,000, and Ms. Joyce will also be entitled to receive up to $1,500 to purchase additional life insurance. The agreement may be terminated by Southern States Bank for cause (as defined in the Joyce Agreement) and any benefits cease except for earned but unpaid salary and benefits. The Joyce Agreement may also be terminated:
| • | upon disability or death, in which case Southern States Bank’s obligations cease except that the full salary and perquisites shall be paid upon disability until the executive has satisfied the “elimination period” under any disability or insurance plan; |
| • | without cause, by Southern States Bank, in which case all obligations of Southern States Bank cease but for earned but unpaid salary and benefits; |
| • | by Ms. Joyce voluntarily, in which case Southern States Bank’s obligations cease except for earned but unpaid salary and benefits; and |
| • | by Ms. Joyce for good reason, in which case Ms. Joyce shall be paid a severance payment within 30 days of termination. |
The severance payment is a sum equal to the aggregate cash compensation received by Ms. Joyce (salary and bonus) for the most recently completed calendar year and certain annualized benefits under employee benefit plans.
For purposes of the Joyce Agreement, “good reason” means, without Ms. Joyce’s consent, any reduction in base salary, a material diminution in authority, duties or responsibilities, the failure of any successor to Southern States Bank to perform Southern States Bank’s obligations, a material breach of the Joyce Agreement by Southern States Bank, or the requirement of a permanent relocation by Ms. Joyce to a location 30 miles or more beyond the current location or future headquarters of Southern States Bank. Notwithstanding the foregoing, good reason shall be deemed to occur only when Ms. Joyce provides notice to Southern States Bank that a good reason event has occurred within 90 days of such occurrence, and Southern States Bank does not remedy the condition within 30 days of such notice.
Upon a change in control of Southern States Bank, and the termination of the employment of Ms. Joyce during the period beginning six months prior to and ending 12 months following such change in control for any reason other than cause, death or disability, the Company shall pay Ms. Joyce an amount equal to two times her cash compensation for the most recently completed calendar year and the annualized amounts paid for benefits for the most recently completed calendar year in a lump sum within 30 days of termination or, if later, the change in control. However, such amount shall be reduced so that the payment, together with all other payments upon a change in control, is one dollar less than the amount that would constitute an “excess parachute payment” as defined in Section 280G of the Code. “Change in control” shall mean a change in the ownership or effective control of the Company or in the ownership of a substantial portion of the assets of the Company as set forth in applicable U. S. Treasury regulations.
The Joyce Agreement also provides that Ms. Joyce will not engage in certain competitive activities within a 50 mile radius of any office of the Bank for a period of 12 months after termination, provided Ms. Joyce is paid a severance payment equal to one times her base salary.
126
Table of Contents
Outstanding Equity Awards at Fiscal Year-End
The following table provides information regarding outstanding equity awards held by each of our named executive officers as of December 31, 2020.
| Option Awards | Stock Awards | |||||||||||||||||||||||
| Name |
Number of Securities Underlying Unexercised Options (#) Exercisable |
Number of Securities Underlying Unexercised Options (#) Unexercisable |
Option Exercise Price ($) |
Option Expiration Date |
Number of Shares or Units of Stock That Have Not Vested (#) |
Market Value of Shares or Units of Stock That Have Not Vested ($)(1) |
||||||||||||||||||
| Stephen W. Whatley |
40,000 | 10,000 | (2) | 10.00 | 1/20/2026 | 6,813 | 154,996 | |||||||||||||||||
| 6,666 | 3,334 | (3) | 14.50 | 1/22/2028 | 1,896 | 30,336 | ||||||||||||||||||
| 5,495 | 11,350 | (4) | 16.00 | 1/22/2029 | 2,985 | 59,999 | ||||||||||||||||||
| — | 18,237 | 20.10 | 1/22/2030 | |||||||||||||||||||||
| Mark Chambers |
20,000 | 5,000 | (2) | 10.00 | 1/20/2026 | 1,096 | 17,536 | |||||||||||||||||
| 5,000 | 2,500 | (3) | 14.50 | 1/22/2028 | 1,772 | 34,612 | ||||||||||||||||||
| 3,176 | 6,352 | (4) | 16.00 | 1/22/2029 | ||||||||||||||||||||
| — | 10,828 | 20.10 | 2/22/2030 | |||||||||||||||||||||
| Lynn Joyce |
5,000 | 2,500 | (3) | 14.50 | 1/22/2028 | 1,370 | 13,700 | |||||||||||||||||
| 3,162 | 6,324 | (4) | 16.00 | 1/22/2029 | 1,091 | 17,456 | ||||||||||||||||||
| — | 10,828 | 20.10 | 2/22/2030 | 1,772 | 34,612 | |||||||||||||||||||
| (1) | The amounts reflect the aggregate grant date fair value of equity awards in accordance with FASB ASC Topic 718. See “Note 10” to our consolidated financial statements for additional detail regarding assumptions underlying the value of these equity awards. |
| (2) | Of the amounts shown, 10,000 and 5,000 options vested on January 12, 2021 for Mr. Whatley and Mr. Chambers, respectively. The remaining options will vest on January 12, 2022. |
| (3) | Of the amounts shown, 3,333, 2,500 and 2,500 options vested on January 22, 2021 for Mr. Whatley, Mr. Chambers and Ms. Joyce, respectively. The remaining options will vest on January 22, 2022. |
| (4) | Of the amounts shown, 5,615, 3,176 and 3,162 options vested on January 22, 2021 for Mr. Whatley, Mr. Chambers and Ms. Joyce, respectively. The remaining options will vest in equal amounts on January 22, 2022. |
| (5) | These options will vest in equal installments on September 13, 2021 and September 13, 2022. |
Director Compensation
Our directors received fees in 2020 of $1,200 per Bank board meeting attended, $500 per Company board meeting attended and $500 per committee meeting attended, except that the lead director received $1,750 for each Bank board meeting chaired and committee chairs received $700 for each meeting chaired.
The fee arrangement for board meetings for 2020 was a grant of stock with a value of $7,200, to vest based on attendance. The fee arrangement for board meetings for 2021 is a grant of stock with a value of $10,000 to vest immediately.
127
Table of Contents
The following table shows the compensation paid during the year ended December 31, 2020 to each of our directors other than Mr. Whatley, whose compensation is shown above in the “Summary Compensation Table.”
| Name |
Fees Earned or Paid in Cash ($)(1) |
Stock Awards(2) |
All Other Compensation(3)($) |
Total ($) |
||||||||||||
| Lewis Beavers(4) |
23,100 | 7,200 | 86 | 30,386 | ||||||||||||
| Robert F. Davie |
22,900 | 7,200 | 86 | 30,186 | ||||||||||||
| Floyd C. Davis(4)(6) |
20,900 | 7,200 | 86 | 28,186 | ||||||||||||
| Alfred J. Hayes, Jr. |
32,350 | 7,200 | 86 | 39,636 | ||||||||||||
| Brent David Hitson |
24,100 | 7,200 | 86 | 31,386 | ||||||||||||
| Brian Stacy Holmes |
30,100 | 7,200 | 86 | 37,386 | ||||||||||||
| Jimmy Alan LaFoy |
34,600 | 7,200 | 86 | 41,886 | ||||||||||||
| James Lynch |
29,300 | 7,200 | 86 | 36,586 | ||||||||||||
| Cynthia McCarty(5) |
10,500 | — | — | 10,500 | ||||||||||||
| Jay Florey Pumroy |
40,300 | 7,200 | 86 | 47,586 | ||||||||||||
| J. Henry Smith, IV |
33,100 | 7,200 | 86 | 40,386 | ||||||||||||
| Henry Turner |
34,600 | 7,200 | 86 | 41,826 | ||||||||||||
| (1) | Represents fees earned or paid in cash for board and committee attendance, including for service as chair or lead director of the board and committees. |
| (2) | Represents equity grants in the form of restricted stock awarded to directors. |
| (3) | This column reflects dividends paid on stock awards. |
| (4) | Messrs. Beavers and Davis joined the board of directors in October 2019. Pursuant to a director retirement agreement that we assumed in connection with the acquisition of Small Town Bank, Mr. Beavers will be eligible to receive retirement benefits beginning on July 1, 2020. The annual retirement benefit for Mr. Beavers is $9,606 per year. |
| (5) | Ms. McCarty joined the board of directors in June 2020. |
| (6) | Mr. Davis retired from the Board of Directors in April 2021. |
128
Table of Contents
CERTAIN RELATIONSHIPS AND RELATED PARTY TRANSACTIONS
Policies and Procedures Regarding Related Party Transactions
Transactions by the Company, the Bank or its subsidiaries with related parties are subject to certain regulatory requirements and restrictions, including Sections 23A and 23B of the Federal Reserve Act and Federal Reserve Regulation W.
Under applicable SEC and NASDAQ rules, related party transactions are transactions in which we are a participant, the amount involved exceeds $120,000 and a related party has or will have a direct or indirect material interest. Our related parties include directors (including nominees for election as directors), executive officers, 5% stockholders and the immediate family members of these persons.
We have a written policy governing the review and approval of transactions with related parties that are expected to exceed $120,000 in any fiscal year. The policy calls for the related party transactions to be reviewed and, if deemed appropriate, approved or ratified by our Audit Committee. Upon determination by our Audit Committee that a transaction requires review under the policy, the material facts are required to be presented to the Audit Committee. In determining whether or not to approve a related party transaction, our Audit Committee will take into account, among other relevant factors, whether the related party transaction is in our best interest, whether it involves a conflict of interest and the commercial reasonableness of the transaction. In the event that we become aware of a related party transaction that was not approved under the policy (such as before the policy was adopted), our Audit Committee will review such transactions as promptly as reasonably practical and will take such course of action as may be deemed appropriate under the circumstances. In the event a member of our Audit Committee is not disinterested with respect to the related party transaction under review, that member may not participate in the review, approval or ratification of that related party transaction.
Certain transactions are not subject to the related party transaction approval policy, including: (1) decisions on compensation or benefits relating to directors or executive officers and (2) credit extensions by us in the ordinary course of business, on substantially the same terms, including interest rate and collateral, as those prevailing at the time for comparable loans with persons not related to us and not presenting more than the normal risk of collectability or other unfavorable features. Loans to directors, executive officers and persons or groups having the power to vote more than 10% of the Company’s voting common stock are also subject to the requirements of Federal Reserve Regulation O and FDIC regulations Part 337.
All related party transactions, including those described below, have been made consistent with applicable law, including Federal Reserve Regulation W.
Related Party Transactions
The following is a description of each transaction since January 1, 2018, and each proposed transaction in which:
| • | we have been or are to be a participant; |
| • | the amount involved exceeds or will exceed $120,000; and |
| • | any of our directors, nominees for director, executive officers or beneficial holders of more than 5% of our capital stock, or any immediate family member of or person sharing the household with any of these individuals (other than tenants or employees), had or will have a direct or indirect material interest. |
Brent David Hitson, a director of Southern States and a partner at the law firm of Burr & Foreman in Birmingham, Alabama, performs legal services for Southern States. Legal fees paid by Southern States to Burr & Foreman totaled $140,196, $145,149 and $181,470 for the years ended December 31, 2020, 2019 and 2018, respectively, and $124,528 for the three months ended March 31, 2021.
129
Table of Contents
Jay Florey Pumroy, a director of Southern States and a partner at the law firm of Wilson, Dillon, Pumroy and James, Anniston, Alabama, performs legal services for Southern States. Legal fees paid by Southern States to Wilson, Dillon Pumroy and James totaled $30,604, $18,180 and $23,038 for the years ended December 31, 2020, 2019, and 2018, respectively, and $7,059 for the three months ended March 31, 2021. Additional fees were paid to Mr. Pumroy’s firm directly by the Bank’s loan customers in connection with loan closings.
In the three months ended March 31, 2021, Southern States became a corporate sponsor of an ARCA Menards Series race car and a NASCAR Camping World Truck Series race truck fielded by Bret Holmes. Bret Holmes is the son of director Brian Stacy Holmes. The Company made a one-time payment of $200,000 for an annual sponsorship during the three months ended March 31, 2021. Under the sponsorship, Southern States’ brand is displayed on the ARCA car, NASCAR truck, car hauler, crew uniforms, driver uniform, and social media pages, and hospitality services are made available for Southern States’ customers at race events, including credentials and pit passes for garage and race experiences.
Southern States has an arrangement with Holmes Aviation, LLC, a company owned by director Brian Stacy Holmes to rent, when needed, a Beechcraft King Air turboprop airplane for use by Southern States for company purposes. Southern States pays for use of the aircraft on an hourly rate plus the costs of the pilot and airport fees. Southern States paid $29,350 during the year ended December 31, 2020 and $9,400 during the three months ended March 31, 2021.
We believe that the terms and conditions of the foregoing transactions are comparable to terms that would have been available from a third party unaffiliated with us.
Ordinary Banking Relationships
Certain of our officers, directors and principal stockholders, as well as their immediate family members and affiliates, are customers of, or have or have had transactions with, the Bank, us or our affiliates in the ordinary course of business. These transactions include deposits, loans and other financial services related transactions. Related party transactions are made in the ordinary course of business, on substantially the same terms, including interest rates and collateral (where applicable), as those prevailing at the time for comparable transactions with persons not related to us, do not involve more than normal risk of collectability or present other features unfavorable to us and are a type that the Bank generally makes available to the public. As of the date of this prospectus, no related party loans were classified or were nonaccrual, past due, restructured or potential problem loans. We expect to continue to enter into transactions in the ordinary course of business on similar terms with our officers, directors and principal stockholders, as well as their immediate family members and affiliates.
The Bank has policies governing affiliate and insider lending transactions to comply with Federal Reserve Regulations O and W. These policies prohibit extensions of credit to “insiders,” as defined in the policies, including our executive officers and directors, unless the extension of credit:
| • | is made in the ordinary course of business on substantially the same terms (including interest rates and collateral) as, and following credit underwriting procedures that are not less stringent than, those prevailing at the time for comparable transactions with members of the general public; |
| • | does not involve more than the normal risk of repayment or present other unfavorable features; and |
| • | is of a type that is generally made available by the Bank to the public. |
As of March 31, 2021, we had loans and extension of credit to directors and officers totaling $8.5 million.
Other Transactions
Certain of our stockholders have preemption rights, registration rights, and board representation rights. Certain shareholders have also entered into passivity agreements with the Company incident to their investments in our common stock. See “Description of Southern States Capital Stock—Transactions with Institutional Investors.”
130
Table of Contents
Directed Share Program
At our request, the underwriters have reserved for sale at the initial public offering price approximately 5.2% of the shares offered hereby for our directors and executive officers. We will offer these reserved shares through a directed share program. Reserved shares purchased by our directors and executive officers will be subject to the 180-day lock-up provisions. The number of shares available for sale to the general public will be reduced to the extent such persons purchase the reserved shares. Any reserved shares not so purchased will be offered by the underwriters to the general public on the same basis as the other shares offered hereby. Directors and executive officers have expressed an intent to buy approximately $2.1 million of the shares in the offering through the directed share program. See “Underwriting—Directed Share Program.”
131
Table of Contents
PRINCIPAL AND SELLING STOCKHOLDERS
The following table provides information regarding the beneficial ownership of our common stock as of April 30, 2021, and as adjusted to reflect the completion of this offering, for:
| • | each of our directors and named executive officers; |
| • | all of our directors and executive officers, as a group; |
| • | each other person known to us to be the beneficial owner of more than 5% of our common stock; and |
| • | the selling stockholders. |
We have determined beneficial ownership in accordance with the rules of the SEC. These rules generally provide that a person is the beneficial owner of securities if such person has or shares the power to vote or direct the voting of securities, or to dispose or direct the disposition of securities, or has the right to acquire such powers within 60 days. Except as indicated by the footnotes below, we believe, based on the information furnished to us by each person named in the table below, that such persons have sole voting and investment power with respect to all shares of common stock that they beneficially own.
The percentage of beneficial ownership is based on 7,375,011 shares of our voting common stock outstanding as of July 30, 2021 and 8,371,440 shares to be outstanding after the completion of this offering, assuming the underwriters do not exercise their option to purchase additional shares, and 9,012,857 shares to be outstanding after the completion of this offering, assuming full exercise of the underwriters’ option to purchase additional shares of our common stock. The table does not reflect any shares of common stock that may be purchased in this offering by the individuals listed below. See “Underwriting—Directed Share Program.”
Unless otherwise noted, the address for each stockholder listed on the table below is: c/o Southern States Bancshares, 615 Quintard Ave., Anniston, Alabama 36201.
| Shares Beneficially Owned After Offering | ||||||||||||||||||||||||
| Shares Beneficially Owned Before Offering |
If Underwriters’ Option Not Exercised |
If Underwriters’ Option Exercised in Full |
||||||||||||||||||||||
| Name of Beneficial Owner |
Number of Shares |
Percent of Class |
Shares Offered |
Number of Shares |
Percent of Class |
Percent of Class |
||||||||||||||||||
| Directors and Named Executive Officers:(1) |
||||||||||||||||||||||||
| Lewis Beavers |
860 | * | — | 860 | * | * | ||||||||||||||||||
| Robert F. Davie(2) |
29,102 | * | — | 29,102 | * | * | ||||||||||||||||||
| Alfred Hayes, Jr. |
4,122 | * | — | 4,122 | * | * | ||||||||||||||||||
| Brent David Hitson |
26,358 | * | — | 26,358 | * | * | ||||||||||||||||||
| Brian Stacy Holmes |
162,287 | 2.2 | — | 162,287 | 1.9 | 1.9 | ||||||||||||||||||
| Jimmy Alan LaFoy |
25,858 | * | — | 25,858 | * | * | ||||||||||||||||||
| James J. Lynch(3) |
2 | * | — | 2 | * | * | ||||||||||||||||||
| Cynthia McCarty(4) |
2,852 | * | — | 2,852 | * | * | ||||||||||||||||||
| Jay Florey Pumroy |
101,000 | 1.4 | — | 101,000 | 1.2 | 1.2 | ||||||||||||||||||
| J. Henry Smith, IV |
45,051 | * | — | 45,051 | * | * | ||||||||||||||||||
| Henry A. Turner |
3,814 | * | — | 3,814 | * | * | ||||||||||||||||||
| Stephen W. Whatley(5) |
525,962 | 7.1 | — | 525,962 | 6.3 | 6.1 | ||||||||||||||||||
| Mark Chambers |
56,043 | * | — | 56,043 | * | * | ||||||||||||||||||
| Lynn Joyce |
42,628 | * | — | 42,628 | * | * | ||||||||||||||||||
| All Directors and Executive Officers as a
Group |
1,108,691 | 15.0 | — | 1,108,691 | 13.2 | 12.8 | ||||||||||||||||||
132
Table of Contents
| Shares Beneficially Owned After Offering |
||||||||||||||||||||||||
| Shares Beneficially Owned Before Offering |
If Underwriters’ Option Not Exercised |
If Underwriters’ Option Exercised in Full |
||||||||||||||||||||||
| Name of Beneficial Owner |
Number of Shares |
Percent of Class |
Shares Offered |
Number of Shares |
Percent of Class |
Percent of Class |
||||||||||||||||||
| Principal and Selling Stockholders: |
||||||||||||||||||||||||
| Patriot Financial Partners(6) |
730,870 | 9.9 | 250,000 | 480,870 | 5.7 | 5.5 | ||||||||||||||||||
| Floyd C. Davis(7) |
672,346 | 6.8 | — | 672,346 | 8.0 | 7.8 | ||||||||||||||||||
| EJF Sidecar Fund, Series LLC - Series E(8) |
503,571 | 6.8 | 208,580 | 294,991 | 3.5 | 3.4 | ||||||||||||||||||
| EJF Small Financial Equities Fund III LP(8) |
100,000 | 1.4 | 41,420 | 58,580 | * | * | ||||||||||||||||||
| Ithan Creek Investors USB, LLC(9) |
503,571 | 6.8 | 503,571 | — | * | * | ||||||||||||||||||
| * | Represents beneficial ownership of less than 1% of the class of shares. |
| (1) | Excludes voting common stock subject to options with vesting and forfeiture conditions. Includes unvested shares of restricted stock held by the director or officer as of April 30, 2021 in the amount shown in the table below: |
| Unvested Restricted Stock |
||||
| Stephen W. Whatley |
13,299 | |||
| Mark Chambers |
3,771 | |||
| Lynn Joyce |
3,613 | |||
| Greg Smith |
3,615 | |||
| Jack Swift |
3,615 | |||
| (2) | Includes 20,000 shares owned by MLPF&S for the Benefit of Davie Investments Limited. |
| (3) | Mr. Lynch is a partner with Patriot Financial Partners. See footnote (6). |
| (4) | Includes 2,000 shares owned by Patrick McCarty (spouse). |
| (5) | 420,103 shares are pledged as collateral on a loan from a commercial bank. |
| (6) | Includes voting stock collectively held by Patriot Financial Partners II, L.P., Patriot Financial Partners Parallel II, L.P. and Financial Manager L.P. In addition to the above mentioned voting shares, 341,417 of non-voting shares, which are not included above, are collectively owned by Patriot Financial Partners II, L.P. and Patriot Financial Partners Parallel II, L.P. Following this offering, the various Patriot investing entities are expected to convert non-voting shares into voting shares and hold up to 9.9% of the Southern States then outstanding voting common stock. The address of each of Patriot Financial Partners II, L.P. Patriot Financial Partners Parallel II, L.P. is Radnor Corporate Center, Suite 210, 100 Matsonford Rd., Radnor, PA 19087. The nonvoting common stock is non-voting in the hands of any holder of 9.9% or more of Southern States’ voting common stock. The shares of nonvoting common stock are immediately convertible by the current holders if and to the extent such persons hold less than 10.0% of Southern States’ voting common stock upon conversion. Upon the sale or transfer of the non-voting stock to any person unaffiliated with the holder who holds or controls less than 9.9% of Southern States’ voting common stock, such transferred shares automatically will become an identical number of shares of voting common stock, as provided in Southern States’ certificate of incorporation. The following are members of the “Patriot Financial Group”: each of Patriot Financial Partners II, L.P. and Patriot Financial Partners Parallel II, L.P. (together, the “Patriot Funds”), Patriot Financial Partners, GP II, L.P., the general partner of the Patriot Funds (“Patriot GP”), Patriot Financial Manager II, L.P., which provides advisory services to certain members of the Patriot Financial Group, Patriot Financial Partners, GP II, LLC, general partner of Patriot GP (“Patriot LLC”) and each of W. Kirk Wycoff, Ira M. Lubert and James J. Lynch, general partners of the Patriot Funds and Patriot GP and members of Patriot LLC, and James F. Deutsch who is a member of the investment committees (along with Messrs. Wycoff, Lubert and Lynch) which make investment decisions on behalf of the Patriot Funds. Accordingly, securities owned by the Patriot Funds may be regarded as being |
133
Table of Contents
| beneficially owned by Patriot GP, Patriot LLC and each of W. Kirk Wycoff, Ira M. Lubert and James J. Lynch. Mr. Deutsch disclaims beneficial ownership. |
| (7) | Includes 115,477 shares owned by Angela G. Davis, the spouse of Mr. Davis, over which he has shared voting and investment power, and 406,197 shares held by the Floyd C. Davis Sr. Family Partnership LP, for which Mr. Davis serves as trustee, and over which he has shared voting and investment power. The address of Mr. Davis and the Floyd C. Davis Sr. Family Partnership, LP is 6366 Commerce Blvd., Suite 214, Rohnert Park, CA 94928. |
| (8) | 2107 Wilson Blvd. #410, Arlington, VA 22201. Emanuel J. Friedman is the controlling member of EJF Capital LLC, which directly manages EJF Sidecar Fund, Series LLC – Series E, and manages through an affiliate EJF Small Financial Equities Fund III LP. |
| (9) | Wellington Management Company LLP, 280 Congress Street, Boston, MA 02210. Wellington Management Company LLP (“WMC”), as an investment adviser, has the power to vote and dispose the securities pursuant to WMC’s investment management agreement with the stockholder. WMC is a subsidiary of Wellington Management Group LLP (“WMG”). WMG is a Massachusetts limited liability partnership, privately held by 172 partners (as of July 1, 2020). There are no external entities with any ownership interest in the firm. Individual percentages of ownership are confidential. However, no single partner owns or has the right to vote more than 5% of the Partnership’s capital. Additional information about WMC is available in Form ADV filed with the SEC. |
133.1
Table of Contents
DESCRIPTION OF SOUTHERN STATES CAPITAL STOCK
The authorized common stock of Southern States Bancshares, Inc. consists of 30,000,000 shares of voting common stock, $5.00 par value per share, of which 8,371,440 shares will be issued and outstanding upon completion of this offering (excluding any shares issuable upon exercise of the underwriters’ options under the underwriting agreement), 5,000,000 shares of non-voting common stock, $5.00 par value per share, of which 341,417 shares will be issued and outstanding upon completion of this offering (not giving effect to any conversion of non-voting common stock to voting common stock in connection with this offering), and 2,000,000 shares of preferred stock, par value $0.01 per share, none of which will be issued and outstanding upon completion of this offering.
The following summary of the capital stock, amended and restated certificate of incorporation and bylaws of Southern States does not purport to be complete and is qualified in its entirety by reference to the applicable provisions of the Alabama Business Corporation Law of 2019 (“ABCL”) and to our amended and restated certificate of incorporation and bylaws, which are filed as exhibits to the registration statement of which this prospectus is a part. Unless otherwise noted herein, references to our common stock include both our voting and non-voting common stock.
Common Stock
Voting Rights. Except for holders of our non-voting common stock, each holder of voting common stock is entitled to one vote per share on any issue requiring a vote of stockholders at any meeting. At the annual meeting, the holders of our common stock will elect nominees to the board of directors by a plurality vote. There is no cumulative voting in the election of directors. If a quorum is present, the transaction of any business at a stockholders’ meeting, other than the election of directors, is approved if the votes cast favoring the action exceed the votes cast opposing the action.
Dividend Rights. Our stockholders are entitled to receive dividends on common stock only if, when and as declared by our board of directors from funds legally available therefor under Alabama corporate law and as limited by our banking regulators. Our voting common stock ranks pari passu with our non-voting common stock with respect to the payment of dividends and distribution. The principal source of the payment of dividends by Southern States is the payment of dividends to it by Southern States Bank. Please see “Dividend Policy— Dividend Restrictions” and “Supervision and Regulation” for a description of certain limitations and restrictions on the payment of dividends applicable to Southern States Bank.
Liquidation and Dissolution Rights. In the event of any liquidation or dissolution of Southern States, the holders of the common stock are entitled to receive, in cash or in kind, the assets of Southern States available for distribution that are remaining after payment or provision for payment of Southern States’ debts and liabilities and the preference of any outstanding preferred stock. Our voting common stock ranks pari passu with our non-voting common stock with respect to rights upon liquidation and dissolution.
Non-voting Common Stock. The non-voting common stock has no voting rights except as otherwise required by law. The non-voting common stock is non-voting in the hands of any holder or its affiliates that own or control 9.9% or more of Southern States’ voting securities of any class or series. A holder of non-voting common stock may convert shares of non-voting common stock into shares of voting common stock at any time or from time to time, provided the holder and its affiliates do not own or control more than 9.9% of the Company’s voting securities of any class or series. Upon the sale or transfer of the non-voting stock to any person unaffiliated with the holder who holds or controls less than 9.9% of Southern States’ voting securities of any class or series, such transferred shares automatically will become an identical number of shares of voting common stock, as provided in Southern States certificate of incorporation.
Other Matters. There is no redemption right, sinking fund provision, or right of conversion, except for our non-voting common stock, with respect to Southern States’ common stock. Holders of the shares of common
134
Table of Contents
stock do not have preemptive rights to subscribe for additional shares when additional shares are offered for sale by Southern States.
Preferred Stock
We may issue up to 2,000,000 shares of preferred stock, $0.01 par value per share, in one or more classes or series as determined by our board of directors from time to time as necessary without further action by the holders of our common stock. No preferred shares are currently outstanding. The board of directors has the power to issue preferred stock and establish for each series of preferred stock the number of shares, voting rights, dividend rights, preferences as to dividends and liquidation, and other relative, participating or other rights, if any, and qualifications, limitations or restrictions, including redemption features and rights on liquidation or dissolution of Southern States. See “Anti-takeover Effect of Governing Documents and Applicable Law.”
Transactions with Institutional Investors
Voting and Non-voting Common Stock. On December 27, 2016, we sold an aggregate of (1) 2,137,143 shares of voting common stock to Institutional Investors, and (2) 161,143 shares of Series B Preferred Stock to Patriot. The Series B Preferred Stock was non-voting and, under certain conditions, could be converted into shares of non-voting common stock on a one-to-five basis. Patriot converted its 161,143 shares of Series B Preferred Stock into 805,715 shares of non-voting common stock on May 1, 2017. Patriot converted 464,298 shares of non-voting common stock to voting common stock on April 8, 2021. Any shares sold by Patriot as a selling stockholder in this offering will be or will become voting common stock in the hands of the underwriters and purchasers from the underwriters.
Registration Rights. In connection with the transactions above, we entered into the Registration Rights Agreement providing for demand and piggyback registration rights. Pursuant to its demand registration rights, after June 28, 2020, Patriot had the right to require Southern States to file a registration statement with the SEC so that Patriot may resell its shares of common stock. Subject to the terms of the Registration Rights Agreement, the other Institutional Investors would be permitted to include their shares of common stock for resale in such registration statement. Patriot may make two such requests, provided that such requests are 180 days or more apart. Southern States must use commercially reasonable efforts to file such registration statement with the SEC within 75 days of its receipt of such request and use commercially reasonable efforts to cause such registration statement to become effective. Institutional Investors seeking to include their shares in the registration statement must notify Southern States within 10 business days following receipt of Southern States’ notice. If Southern States is unable to file a registration statement or cause the registration statement to become effective within specified timeframes, Southern States must pay, subject to certain limitations, participating Institutional Investors an amount in cash equal to 1.0% of their aggregate original purchase price of the voting and non-voting common stock held by the Institutional Investors seeking to participate in such registration statement. Such payment will bear interest of 1.0% per month on an annualized basis, if such payment is not made within 10 business days of the due date.
If Southern States files a registration statement for a primary or secondary offer of its securities (other than a registration statement related to equity compensation plans or mergers and acquisitions), Southern States will give notice at least 15 days prior to the anticipated registration statement filing date to the Institutional Investors who may elect to have their securities included in a piggyback registration statement for resale. Southern States must effect registration of all securities that the Institutional Investors request to be included in the piggyback registration within 10 days following the notice given by Southern State. However, if the offering is underwritten, the number of shares to be sold by the selling Institutional Investors may be reduced upon recommendation of the managing underwriters.
In any of the foregoing registration statements, Southern States will pay the fees and expenses of such registration statements, including all registration and filing fees, printing expenses, trading market fees, fees and disbursements of counsel for Southern States and fees and expenses of the Institutional Investors reasonably incurred, including reasonable fees of the Institutional Investors’ counsel.
135
Table of Contents
Preemptive Rights. The Institutional Investors Stock Purchase Agreement provides that as long as they own at least 50% of the Southern States’ shares they purchased in 2016 or 4.9% or more of the voting common stock
of Southern States, they may purchase additional shares of Southern States common stock (either voting or non-voting, as applicable) to maintain their ownership percentage in Southern States. Such rights do not apply to certain transactions such as a merger, but apply to a public or private offer of common stock. As of December 31, 2020, the Institutional Investors hold approximately 40.5% of Southern States’ outstanding voting and non-voting common stock.
Board Representation and Information Rights. The Stock Purchase Agreement also provides Patriot with the right to select one representative to the Southern States and Southern States Bank boards of directors and one observer to attend the meetings of the Southern States and Southern States Bank boards of directors as long as Patriot (and its affiliates) owns at least 50% of the shares of stock of Southern States that it purchased in 2016, or 4.9% or more of the voting common stock of Southern States. Southern States must use reasonable best efforts to have Patriot’s board representative elected as a director and recommend that its shareholders elect such board representative at any shareholders’ meeting. Davis Partnership, LP (“Davis”) also has the right to select one representative to be elected to the board of directors of Southern States effective June 27, 2020 and December 27, 2022, if Southern States remains a private company and Davis continues to own the shares of stock of Southern States which it purchased in 2016. Southern States will recommend the election of such representative to its board of directors. If this offering is not completed and Southern States does not otherwise become a public company, the other Institutional Investors have visitation rights at board meetings and the right to certain information, including books and records and financial statements.
Passivity Commitments. Patriot, various EJF funds and Wellington Management Company LLP, entered into passivity commitments with the Federal Reserve in connection with their 2016 investments in Southern States. These commitments limit the ability of such firms from exercising “control” or a “controlling influence” over Southern States in a manner that is inconsistent with the BHCA. Generally, such limitations prohibit any such firm from owning or controlling more than 9.9% of Southern States’ outstanding voting securities, or acting in concert to exercise a “controlling influence” over Southern States, unless the Federal Reserve approves such ownership or control. In addition, the passivity commitments prohibit the investors from:
| • | seeking to have a representative on Southern State’s board of directors (other than one Patriot representative) or having a representative serve as Southern States officer, agent or employee; |
| • | taking any action that would cause Southern States to become a subsidiary of such investor; |
| • | owning, controlling or holding the power to vote securities that represent 25% or more of any class of Southern States’ voting securities; |
| • | proposing a director or directors in opposition to a nominee or slate of nominees proposed by Southern States’ management or board of directors; |
| • | soliciting proxies with respect to any Southern States shareholder matter; |
| • | entering into an agreement with Southern States that would substantially limit the discretion of Southern States’ management; |
| • | disposing or threatening to dispose of Southern States stock as a condition to induce specific action or non-action by Southern States; and |
| • | entering into a banking or nonbanking transaction with Southern States, except for deposit accounts held by Southern States, provided the aggregate value of such deposits do not exceed $500,000. |
Anti-takeover Effect of Governing Documents and Applicable Law
Certain provisions of our amended and restated certificate of incorporation and amended and restated bylaws could have the effect of delaying or deferring the removal of incumbent directors or delaying, deferring
136
Table of Contents
or discouraging another party from acquiring control of us, even if such removal or acquisition would be viewed by our stockholders to be in their best interests. These provisions, summarized below, are intended to encourage persons seeking to acquire control of us to first negotiate with our board of directors. These provisions may also serve to discourage hostile takeover practices and inadequate takeover bids. We believe that these provisions are beneficial because the negotiation they encourage could result in improved terms of any unsolicited proposal.
Authorized but Unissued Capital Stock. Upon completion of this offering, the authorized common stock of Southern States will consist of 30,000,000 shares, of which 8,712,857 shares will be issued and outstanding (assuming no exercise of the underwriters’ option to purchase additional shares), and 2,000,000 shares of preferred stock, of which no shares will be issued and outstanding. Our board of directors may authorize the issuance of one or more series of preferred stock without stockholder approval. These shares could be used by our board of directors to make it more difficult or to discourage an attempt to obtain control of us through a merger, tender offer, proxy contest or otherwise. In addition, the authorized but unissued shares of common stock may be issued for any proper purpose approved by the board of directors, except where such issuances are limited by the ABCL and rules of the NASDAQ. Although Southern States’ board of directors may issue additional shares of common stock or non-voting common stock, the Company intends to issue only voting common stock in the future.
Stockholder Proposals. Our bylaws include specific procedures for stockholder proposals, including proposed nominations for directors, to be brought at stockholder meetings including that the stockholder must be a stockholder of record at the time of giving of notice of such meeting by the board of directors and a stockholder of record for the record date of the annual meeting, and comply with the procedures set forth in our bylaws as to such nomination or other business. Notice of a stockholder proposal notice must generally be delivered to the secretary of the Company no less than 60 days nor more than 90 days prior to the stockholder meeting. The notice of the stockholder proposal must include certain information listed in our bylaws, including, but not limited to, the name and address of each stockholder making the proposal, the name and address of any nominee for director, the class and number of shares of our capital stock, any proxy used in connection with the proposal, a description of the business desired to be brought before the meeting, and a description of all agreements, arrangements and understandings between the stockholder proposing the business to be brought before the meeting and any other affiliates and associates with whom the requesting stockholder is acting in concert in connection with the proposal.
Special Meeting and Action by Written Consent in Lieu of Meeting. Our certificate of incorporation allows for any action required by the ABCL to be taken at any annual or special meeting of the stockholders. However, stockholders may not act by written consent nor may stockholders call special meetings of stockholders. Southern States’ bylaws provide that only the board of directors may call a special meeting of stockholders at any time.
Amendments. Upon a proposal by Southern States’ board of directors, Southern States’ certificate of incorporation may be amended with the approval of the stockholders at a meeting at which a quorum consisting of a majority of the votes entitled to be cast on the amendment exists. Southern States’ bylaws provide that only the board of directors may call a special meeting of stockholders at any time. The bylaws may not be amended or repealed by stockholders without the affirmative vote of at least 75% of the stockholders at any annual meeting.
Board Composition and Director Changes. The bylaws of Southern States provides that the board of directors may be comprised of not less than five nor more than 15 persons. The bylaws provide that the board of directors may increase or decrease the number of directors within such limits. The bylaws provide that any vacancy in the board of directors may be filled by the board of directors. Despite the expiration of a director’s term, the director shall continue to serve until his or her successor is elected and qualifies or until there is a decrease in the number of directors and his or her position is eliminated, provided any such decrease does not shorten a director’s term. Stockholders of Southern States may remove one or more directors only for cause.
Exclusive Forum
The Southern States bylaws provide that unless Southern States otherwise consents in writing to the selection of an alternative forum, the Calhoun County Circuit Court of the State of Alabama, or the circuit court
137
Table of Contents
of the county in which Southern States is otherwise headquartered will be the sole and exclusive forum for any derivative action or proceeding brought on behalf of Southern States, any action asserting a claim of breach of a fiduciary duty owed to Southern States, or its stockholders, by any of its directors, officers or other employees, any action asserting a claim arising pursuant to any provision of the ABCL, or any action asserting a claim governed by the internal affairs doctrine. The enforceability of similar choice of forum provisions in other companies’ certificates of incorporation has been challenged in legal proceedings, and it is possible that a court could find these types of provisions to be inapplicable or unenforceable.
This exclusive forum provision would not apply to suits brought to enforce any liability or duty created by the Securities Act or the Exchange Act or any other claim for which the federal courts have exclusive jurisdiction. To the extent that any such claims may be based upon federal law claims, Section 27 of the Exchange Act creates exclusive federal jurisdiction over all suits brought to enforce any duty or liability created by the Exchange Act or the rules and regulations thereunder. Furthermore, Section 22 of the Securities Act creates concurrent jurisdiction for federal and state courts over all suits brought to enforce any duty or liability created by the Securities Act or the rules and regulations thereunder.
Indemnification of Directors and Officers
Subject to applicable law, a director shall not be held personally liable to Southern States or its stockholders for monetary damages for any action taken, or any failure to take any action as a director, except that a director’s liability shall not be eliminated for (i) the amount of a financial benefit received by a director to which he or she is not entitled; (ii) an intentional infliction of harm on Southern States or the stockholders; (iii) a violation of section 10A-2A-8.32 of the ABCL; or (iv) an intentional violation of criminal law. It is the intention that the directors of Southern States be protected from personal liability to the fullest extent permitted by the ABCL as it now or hereafter exists. If at any time in the future the ABCL is modified to permit further or additional limitations on the extent to which directors may be held personally liable to Southern States, the protection afforded by Southern States’ certificate of incorporation shall be expanded to afford the maximum protection permitted under such law.
Subject to the above limitations and in accordance with the ABCL, Southern States will indemnify a director or officer who was successful, on the merits or otherwise, in the defense of any proceeding, or of any claim, issue or matter in the proceeding to which he or she was a party because he or she is or was a director or officer of Southern States against reasonable expenses incurred in connection with the proceeding, notwithstanding that he or she was not successful on any other claim, issue or matter in any such proceeding.
Furthermore, the ABCL provides that Southern States may indemnify an individual made a party to a proceeding because he or she is or was a director or officer of Southern States against liability incurred in a proceeding if: (1) he or she conducted himself or herself in good faith; and (2) he or she reasonably believed (a) in the case of conduct in his or her official capacity with Southern States, that his or her conduct was in its best interest; and (b) in all other cases, that his or her conduct was at least not opposed to its best interest; and (3) in the case of any criminal proceeding he or she had no reasonable cause to believe his or her conduct was unlawful. Southern States may not indemnify a director or officer in connection with a proceeding by or in the right of Southern States in which the director or officer has not met the relevant standard of conduct; or in connection with any other proceeding charging improper personal benefit to him or her, whether or not involving action in his or her official capacity, in which he or she was adjudged liable on the basis that financial benefit was improperly received by him or her.
Under the ABCL, Southern States may, before final disposition of a proceeding, advance funds to pay for or reimburse expenses incurred in connection with a proceeding by an individual who is a party to the proceeding because that individual is a director, if the director delivers to Southern States a signed written undertaking to repay any funds advanced if (i) the director is not entitled to mandatory indemnification, and (ii) it is ultimately determined that the director is not entitled to indemnification.
138
Table of Contents
Southern States and Southern States Bank have procured a directors and officers liability insurance policy providing for insurance against certain liabilities incurred by directors and officers of Southern States and Southern States Bank while serving in their capacities as such, to the extent such liabilities could be indemnified under the above provisions.
Listing and Trading Market for Common Stock
Prior to this offering, our common stock has not been actively traded and has not been listed or traded on an established public trading market, and no quotations for our common stock were reported on any market. As a result, there has been no established public trading market for our common stock. Although our shares may have been sporadically traded in private transactions, the prices at which such transactions occurred may not necessarily reflect the price that would be paid for our common stock in an active market. As of March 31, 2021, there were approximately 621 holders of record of our common stock.
We anticipate that this offering and the listing of our common stock on NASDAQ will result in a more active trading market for our common stock. However, we cannot assure you that a liquid trading market for our common stock will develop or be sustained after this offering. You may not be able to trade in our shares when you seek to purchase or sell shares, and the market price for our common stock may be more or less than the initial public offering price in this offering. See “Underwriting” for more information regarding our arrangements with the underwriters and the factors considered in setting the initial public offering price.
Transfer Agent and Registrar
Computershare is the transfer agent and registrar for our common stock.
139
Table of Contents
General
Bank holding companies and banks are regulated extensively under both federal and state law. The bank regulatory framework is intended primarily for the protection of depositors, the deposit insurance system, and the banking system, and not for the protection of stockholders or any other group.
This supervisory and regulatory framework subjects banks and bank holding companies to regular examination by their respective regulatory agencies, which results in examination reports and ratings that, while not publicly available, can affect the conduct and growth of their businesses. These examinations consider not only compliance with applicable laws and regulations, but also capital levels, asset quality and risk, management’s ability and performance, earnings, liquidity, sensitivity to market risks and various other factors.
Composite ratings are based on evaluations of an institution’s managerial, operational, financial and compliance performance. The composite CAMELS rating is not an arithmetical formula or rigid weighting of numerical component ratings. Elements of subjectivity and examiner judgment, especially as these relate to qualitative assessments, are important elements in assigning ratings. The federal bank regulatory agencies are reviewing the CAMELS rating system and the consistency of such ratings.
These regulatory agencies have broad discretion to impose restrictions and limitations on the operations of a regulated entity where the agencies determine, among other things, that such operations are unsafe or unsound, a failure to comply with applicable law or are otherwise inconsistent with laws and regulations or with the supervisory policies of these agencies.
The following is a summary of the material elements of the supervisory and regulatory framework applicable to Southern States and Southern States Bank. It does not describe all of the statutes, regulations and regulatory policies that apply, nor does it restate all of the requirements of those that are described. To the extent that the following information describes statutory and regulatory provisions, it is qualified in its entirety by express reference to each of the particular statutory and regulatory provisions. A change in applicable statutes, regulations or regulatory policy may have a material effect on the business of Southern States and Southern States Bank.
Southern States
Southern States is registered as a bank holding company with the Federal Reserve. Southern States is subject to examination, regulation and supervision by the Federal Reserve under the Bank Holding Company Act of 1956, as amended. Southern States is required to file annual reports and such additional information as the Federal Reserve may require.
The BHC Act generally prohibits a bank holding company from acquiring direct or indirect ownership or control of voting shares of any company that is not a bank or bank holding company and from engaging directly or indirectly in any activity other than banking or managing or controlling banks or performing services for its authorized subsidiary. A bank holding company may, however, engage in or acquire an interest in a company that engages in activities that the Federal Reserve has determined by regulation or order to be so closely related to banking or managing or controlling banks as to be a proper incident thereto.
The BHC Act permits acquisitions of banks by bank holding companies, subject to various restrictions, including that the acquirer is “well capitalized” and “well managed”. Such acquisitions are subject to the approval of the Federal Reserve. Under the Alabama Banking Code, with the prior approval of the Alabama Superintendent, an Alabama bank may acquire and operate one or more banks in Alabama or in other states pursuant to a transaction in which the Alabama bank is the surviving bank. In addition, one or more Alabama banks may enter into a merger transaction with one or more out-of-state banks, and an out-of-state bank resulting
140
Table of Contents
from such transaction may continue to operate the acquired branches in Alabama. The Dodd-Frank Act permits banks, including Alabama banks, to branch anywhere in the United States. The establishment of a new branch requires both ASBD and FDIC approval.
The Company is a legal entity separate and distinct from the Bank. Various legal limitations restrict the Bank from lending or otherwise supplying funds to the Company. See “—Transactions with Affiliates.”
Federal and state laws regulate Southern States’ corporate governance, its investment authority, its manner of doing business, its employment practices, its consumer privacy policies and procedures, its relationship with Southern States Bank and its other affiliates, its ability to merge with, acquire, or be acquired by other entities, its requisite minimum capital and the forms of capital, its payment of dividends or other distributions, the types of businesses in which it can engage, and many other aspects of its business.
Southern States Bank
Southern States Bank is chartered by the ASBD. Southern States Bank is also a member of the FDIC and its deposits are insured, as provided by law, by the DIF. Southern States Bank is subject to supervision, regulation, and examination by the FDIC and ASBD. Southern States Bank is also subject to various requirements and restrictions under federal and state law, including capital adequacy requirements, requirements to maintain reserves against deposits, requirements under the CRA, restrictions on the types and amounts of loans that may be made and the interest that may be charged thereon and limitations on the types of investments that may be made, activities that may be engaged in, and types of services that may be offered. The operations of Southern States Bank are also affected by various consumer laws and regulations, including regulations of the Consumer Financial Protection Bureau (“CFPB”), and other state and federal agencies relating to equal credit opportunity, truth in lending disclosures, truth in savings disclosures, debt collection laws, privacy regulations, and regulation of consumer lending practices. In addition to the impact of direct regulation, commercial banks are affected significantly by the actions of the Federal Reserve as it attempts to control the money supply and credit availability in order to influence the economy.
Strict compliance at all times with state and federal banking laws, as well as other laws, is and will continue to be required. Southern States Bank believes that the experience of its executive management will assist it in its continuing efforts to achieve the requisite level of compliance. Certain provisions of state law may be preempted by existing and future federal laws, rules and regulations, and no prediction can be made as to the impact of preemption on state law or the regulation of Southern States Bank thereunder.
Enforcement Powers of Federal and State Banking Agencies
The federal and state bank regulatory agencies have broad enforcement powers, including the power to terminate deposit insurance, impose substantial fines and other civil and criminal penalties, and appoint a conservator or receiver for financial institutions. Failure to comply with applicable laws and regulations could subject us and our officers and directors to administrative sanctions and potentially substantial civil money penalties. In addition to the grounds discussed below under “—Prompt Corrective Action and Other Consequences of Capital Adequacy,” the appropriate bank regulatory agency may appoint the FDIC as conservator or receiver for a depository institution (or the FDIC may appoint itself, under certain circumstances) if any one or more of a number of circumstances exist, including, without limitation, the fact that the depository institution is undercapitalized and has no reasonable prospect of becoming adequately capitalized, fails to become adequately capitalized when required to do so, fails to submit a timely and acceptable capital restoration plan or materially fails to implement an accepted capital restoration plan.
Payment of Dividends and Repurchases of Capital Instruments
Southern States is a legal entity separate and distinct from Southern States Bank. Southern States’ principal source of cash flow, including cash flow to pay dividends to its stockholders, is dividends Southern States Bank
141
Table of Contents
pays to Southern States as Southern States Bank’s sole stockholder. Statutory and regulatory limitations apply to Southern States Bank’s payment of dividends to Southern States as well as to Southern States’ payment of dividends to its stockholders. The Federal Reserve’s policy that a bank holding company should serve as a source of strength to its subsidiary banks includes the position that a bank holding company should generally only pay dividends or other capital distributions from current year earnings. The Federal Reserve also has stated that, as a matter of prudent banking, a bank holding company generally should not maintain a rate of cash dividends unless its net income available to common stockholders over the past year has been sufficient to fully fund the dividends and the prospective rate of earnings retention appears to be consistent with the corporation’s capital needs, asset quality and overall financial condition. Southern States’ ability to pay dividends is also subject to the provisions of Alabama corporate law.
Federal Reserve Supervisory Letter SR-09-4 (February 24, 2009), as revised December 21, 2015 and July 24, 2020, applies to dividend payments, stock redemptions and stock repurchases. Prior consultation with the Federal Reserve supervisory staff is required before:
| • | declaring and paying a dividend that could raise safety and soundness concerns (for example, declaring and paying a dividend that exceeds earnings for the period for which the dividend is being paid); |
| • | redemptions or repurchases of capital instruments when the bank holding company is experiencing financial weakness; and |
| • | redemptions and purchases of common or perpetual preferred stock which would reduce such Tier 1 capital at end of the period compared to the beginning of the period. |
Bank holding company directors must consider different factors to ensure that the company dividend level is prudent relative to maintaining a strong financial position, and is not based on overly optimistic earnings scenarios, such as potential events that could affect its ability to pay, while still maintaining a strong financial position. As a general matter, the Federal Reserve has indicated that the board of directors of a bank holding company should consult with the Federal Reserve and eliminate, defer or significantly reduce the bank holding company’s dividends if:
| • | its net income available to stockholders for the past four quarters, net of dividends previously paid during that period, is not sufficient to fully fund the dividends; |
| • | its prospective rate of earnings retention is not consistent with its capital needs and overall current and prospective financial condition; or |
| • | it will not meet, or is in danger of not meeting, its minimum regulatory capital adequacy ratios. |
The capital rules further limit Bank permissible dividends, stock repurchases and discretionary bonuses by the Company and the Bank, respectively, unless the Company and the Bank meet the capital conservation buffer requirement discussed under “Capital Adequacy” below.
The ASBD also regulates Southern States Bank’s dividend payments. Under Alabama law, a state-chartered bank has to maintain a capital surplus equal to at least 20% of its capital. The Bank has a capital surplus at least equal to 20% of its capital. Thereafter, the prior approval of the Alabama Superintendent of Banks is required for its payment of dividends if the total of all dividends declared by a bank in any calendar year will exceed the total of (1) the bank’s net earnings (as defined by statute) for that year, plus (2) its retained net earnings for the preceding two years, less any required transfers to surplus. In addition, no dividends, withdrawals or transfers may be made from the bank’s surplus without the prior written approval of the Superintendent.
Southern States and Southern States Bank’s payment of dividends may also be affected or limited by other factors, such as the requirement to maintain adequate capital above regulatory guidelines. Bank regulatory agencies have the authority to prohibit bank holding companies and banks from engaging in unsafe or unsound practices in conducting their business. The payment of dividends, depending on the financial condition of a bank holding company and of its subsidiary bank, could under certain circumstances be deemed an unsafe or unsound practice, and therefore restricted.
142
Table of Contents
Under the Federal Deposit Insurance Act, an FDIC-insured depository institution may not make any capital distributions (including the payment of dividends) or pay any management fees to its holding company if it is undercapitalized or if such payment would cause it to become undercapitalized.
Restrictions on Acquisitions and Certain Activities
As a bank holding company, Southern States must obtain prior approval of the Federal Reserve before (1) acquiring, directly or indirectly (except in certain limited circumstances), ownership or control of more than 5% of the voting stock of a bank, (2) acquiring all or substantially all of the assets of a bank, or (3) merging or consolidating with another bank holding company. The Bank Holding Company Act also generally limits the business in which a bank holding company may engage to banking, managing or controlling banks, and furnishing or performing services for Southern States Bank. A bank holding company may engage in or acquire an interest in a company that engages in activities that the Federal Reserve has determined by regulation or order to be so closely related to banking or managing or controlling banks as to be a proper incident thereto. Banks are also subject to restrictions on the types of activities that they are permitted to engage in under regulations of the ASBD and the FDIC, which are generally limited to the business of banking and activities that are incidental to the business of banking.
Bank holding companies that meet certain eligibility requirements prescribed by the Bank Holding Company Act and elect to operate as financial holding companies may engage in, or own shares in companies engaged in, a wider range of non-banking activities, including securities and insurance underwriting and sales, merchant banking and any other activity that the Federal Reserve, in consultation with the Secretary of the Treasury, determines by regulation or order is financial in nature or incidental to any such financial activity or that the Federal Reserve determines by order to be complementary to any such financial activity and does not pose a substantial risk to the safety or soundness of depository institutions or the financial system generally. Southern States has not elected to be a financial holding company, and we have not engaged in any activities determined by the Federal Reserve to be financial in nature or incidental or complementary to activities that are financial in nature.
Federal law also prohibits any person or company from acquiring “control” of an FDIC-insured depository institution or its holding company without prior notice to the appropriate federal bank regulator. “Control” is conclusively presumed to exist upon the acquisition of 25% or more of the outstanding voting securities of a bank or bank holding company, but may be presumed to exist under certain circumstances between 5.00% and 24.99% ownership.
The Federal Reserve may require that a bank holding company terminate an activity or terminate control of or liquidate or divest certain subsidiaries or affiliates when the Federal Reserve believes the activity or the control of the subsidiary or affiliate constitutes a significant risk to the financial safety, soundness or stability of any of its banking subsidiaries. The Federal Reserve also has the authority to regulate provisions of certain bank holding company debt. Under certain circumstances, a bank holding company must file written notice and obtain approval from the Federal Reserve prior to purchasing or redeeming its equity securities.
Moreover, poor examination ratings, lower capital ratios than peer group institutions, regulatory concerns regarding management, controls, assets, operations, or other factors can all potentially result in practical limitations on the ability of a bank or bank holding company to engage in new activities, grow, acquire new businesses, repurchase its stock or pay dividends, or to continue to conduct existing activities.
Company Expected to be Source of Financial Strength for Bank Subsidiary
Under Federal Reserve policy and the Federal Deposit Insurance Act, Southern States is expected to act as a source of financial strength to, and to commit resources to support, Southern States Bank. This support may be required at times when, absent such Federal Reserve policy, Southern States may not be inclined to provide it.
143
Table of Contents
In the event an FDIC-insured subsidiary becomes subject to a capital restoration plan with its regulators, the parent bank holding company is required to guarantee performance of such plan up to 5% of the bank’s assets, and such guarantee is given priority in bankruptcy of the bank holding company. In addition, where a bank holding company has more than one bank or thrift subsidiary, each of the bank holding company’s subsidiary depository institutions may be responsible for any losses to the FDIC’s DIF, if an affiliated depository institution fails. As a result, a bank holding company may be required to loan money to a bank subsidiary in the form of subordinate capital notes or other instruments which qualify as capital under bank regulatory rules. However, any loans from the holding company to such subsidiary banks likely will be unsecured and subordinated to such bank’s depositors and to other creditors of the bank. See “Capital.”
Capital Adequacy
The various federal banking agencies, including the Federal Reserve and FDIC, have adopted risk-based capital requirements for assessing bank and bank holding company capital adequacy. These standards establish minimum capital standards in relation to the relative credit risk of assets and off-balance sheet exposures. Capital is classified into two tiers. Tier 1 capital consists generally of common equity tier 1 capital (generally comprised of common stockholders’ equity and retained earnings) and additional tier 1 capital (includes, among other things, certain types of noncumulative perpetual preferred stock) is reduced by goodwill and certain other intangible assets. Tier 2 capital generally includes the allowance for possible loan losses (subject to certain limitations) and certain types of subordinated debt and cumulative perpetual preferred stock. The risk-based capital guidelines require financial institutions to maintain specific defined credit risk factors and apply them to their assets which results in risk-adjusted assets.
The capital standards impose the following minimum capital requirements:
| • | a ratio of common equity tier 1 capital to total risk-weighted assets of 4.5%, |
| • | a ratio of tier 1 capital to total risk-weighted assets of 6%, |
| • | a ratio of total capital to total risk-weighted assets of 8%, and |
| • | a ratio of tier 1 capital to adjusted average total assets of 4%. |
In addition to these minimum regulatory capital ratios, the regulations establish a capital conservation buffer with respect to the first three ratios listed above. Specifically, banking organizations must hold common equity tier 1 capital in excess of their minimum risk-based capital ratios by at least 2.5% of risk-weighted assets in order to avoid limits on capital distributions (including dividend payments, discretionary payments on tier 1 instruments, and stock buybacks) and certain discretionary bonus payments to executive officers. Thus, when including the 2.5% capital conservation buffer, a bank holding company and a bank’s minimum ratio of common equity tier 1 capital to risk-weighted assets becomes 7%, its minimum ratio of tier 1 capital to total risk-weighted assets becomes 8.5%, and its minimum ratio of total capital to risk-weighted assets becomes 10.5%.
These guidelines are only minimum standards and regulators expect bank holding companies and banks to maintain capital well above these minimum requirements. Failure to meet capital guidelines could subject a bank or bank holding company to a variety of enforcement remedies, including issuance of a capital directive, the termination of deposit insurance by the FDIC, a prohibition on accepting brokered deposits, and certain other restrictions on its business, including in certain circumstances, the appointment of a receiver.
The federal banking agencies finalized a rule in November 2019 that allows bank holding companies and banks with less than $10.0 billion in total consolidated assets and limited amounts of certain assets and off balance sheet exposures and a leverage ratio of greater than 9% (subsequently temporarily reduced to 8% as a COVID-19 relief measure) to elect to use the Community Bank Leverage Ratio (“CBLR”) framework. A community banking organization electing to use the CBLR framework would have a simplified capital regime
144
Table of Contents
and would not be subject to other capital and leverage requirements and would be considered well capitalized as long as it continued to meet the requirements of the CBLR framework. We have not elected to use the CBLR framework and it is uncertain if Southern States will elect to utilize the CBLR framework in the future, as it believes it will continue to calculate the other capital measures, which provide comparable information to other publicly traded banking institutions. As a bank holding company with less than $3 billion in total consolidated assets, Southern States, with the Federal Reserve’s permission, may be eligible to be treated as a “small bank holding company” under the Federal Reserve’s Small Bank Holding Company and Savings and Loan Holding Company Policy Statement. If the Federal Reserve permitted this, Southern States’ capital adequacy would be evaluated at the bank level and on a parent-only basis, and it would not be subject to consolidated capital standards for regulatory purposes. See “—Capital.”
Prompt Corrective Action and Other Consequences of Capital Adequacy
The Federal Deposit Insurance Act requires, among other things, that the federal banking regulators take prompt corrective action with respect to FDIC-insured depository institutions that do not meet minimum capital requirements. Under the Federal Deposit Insurance Act, insured depository institutions are divided into five capital categories: well capitalized, adequately capitalized, undercapitalized, significantly undercapitalized, and critically undercapitalized as set forth below. An institution may be deemed to be in a capitalization category that is lower than is indicated by its actual capital position if it receives an unsatisfactory examination rating:
| • | well capitalized if it has a total risk-based capital ratio of 10% or greater, a Tier 1 risk-based capital ratio of 8% or greater, a Common Equity Tier 1 capital ratio of 6.5% or greater, a leverage capital ratio of 5% or greater and is not subject to any written agreement, order, capital directive or prompt corrective action directive by a federal bank regulatory agency to maintain a specific capital level for any capital measure; |
| • | “adequately capitalized” if it has a total risk-based capital ratio of 8% or greater, a Tier 1 risk-based capital ratio of 6% or greater, a Common Equity Tier 1 capital ratio of 4.5% or greater, and generally has a leverage capital ratio of 4% or greater; |
| • | “undercapitalized” if it has a total risk-based capital ratio of less than 8%, a Tier 1 risk-based capital ratio of less than 6%, a Common Equity Tier 1 capital ratio of less than 4.5% or generally has a leverage capital ratio of less than 4%; |
| • | “significantly undercapitalized” if it has a total risk-based capital ratio of less than 6%, a Tier 1 risk-based capital ratio of less than 4%, a Common Equity Tier 1 capital ratio of less than 3%, or a leverage capital ratio of less than 3%; or |
| • | “critically undercapitalized” if its tangible equity is equal to or less than 2% to total assets. |
The federal bank regulatory agencies have authority to require additional capital and have indicated that higher capital levels may be required in light of market conditions and risk.
The Federal Deposit Insurance Act generally prohibits an FDIC-insured depository institution from making any capital distribution (including payment of dividends) or paying any management fee to its holding company if the depository institution would thereafter be undercapitalized. Undercapitalized depository institutions are subject to restrictions on borrowing from the Federal Reserve. In addition, undercapitalized depository institutions are subject to, among other things, growth limitations and are required to submit capital restoration plans. An insured depository institution’s holding company must guarantee the capital plan, up to an amount equal to the lesser of 5% of the depository institution’s assets at the time it becomes undercapitalized or the amount of the capital deficiency when the institution fails to comply with the plan, for the plan to be accepted by the applicable federal regulatory authority. The federal banking agencies may not accept a capital plan without determining, among other things, that the plan is based on realistic assumptions and is likely to succeed in restoring the depository institution’s capital. If a depository institution fails to submit an acceptable plan or fails to implement its plan, it is treated as if it is significantly undercapitalized.
145
Table of Contents
Significantly undercapitalized depository institutions may be subject to a number of requirements and restrictions, including orders to sell sufficient voting stock to become adequately capitalized, to sell to another bank or bank holding company, to reduce total assets, to restrict interest rates paid on deposits, to replace the board of directors or management and to cease receipt of deposits from correspondent banks. Critically undercapitalized depository institutions are subject to appointment of a receiver or conservator, generally within ninety (90) days of the date on which they become critically undercapitalized, and are subject to other restrictions.
Business activities may be influenced by an institution’s capital classification. For example, only a “well capitalized” depository institution may accept brokered deposits without prior regulatory approval and an “adequately capitalized” institution may accept such deposits only with prior regulatory approval. Such approval has historically been difficult to obtain.
General Regulatory Considerations
Under the Federal Deposit Insurance Corporation Improvement Act (“FDICIA”), all insured institutions must undergo regular on-site examination by their appropriate banking agency. The cost of examinations of insured depository institutions and any affiliates may be assessed by the appropriate agency against each institution or affiliate as it deems necessary or appropriate. Insured institutions are required to submit annual reports to the FDIC and the appropriate agency (and state supervisor when applicable). FDICIA also requires the federal banking regulatory agencies to prescribe, by regulation, standards for all insured depository institutions and depository institution holding companies relating, among other things, to: (i) internal controls, information systems and audit systems; (ii) loan documentation; (iii) credit underwriting; (iv) interest rate risk exposure; and (v) asset quality.
In response to perceived needs in financial institution regulation, Congress enacted the Financial Institutions Reform, Recovery and Enforcement Act of 1989 (“FIRREA”). FIRREA provides that a depository institution insured by the FDIC can be held liable for any loss incurred by, or reasonably expected to be incurred by, the FDIC in connection with (i) the default of a commonly controlled FDIC-insured depository institution or (ii) any assistance provided by the FDIC to a commonly controlled FDIC-insured depository institution in danger of default.
FIRREA provides that financial institutions and their affiliated parties (such as officers and directors) may be subject to civil money penalties for certain types of violations and misconduct. In addition, the FDIC has been granted enhanced authority to withdraw or to suspend deposit insurance in certain cases. The banking regulators have not been reluctant to use the enforcement authorities provided under FIRREA. Further, regulators have broad power to issue cease and desist orders that may, among other things, require affirmative action to correct any harm resulting from a violation or practice, including restitution, reimbursement, indemnifications or guarantees against loss. A financial institution may also be ordered to restrict its growth, dispose of certain assets, rescind agreements or contracts or take other actions as determined by the ordering agency to be appropriate.
Federal and state banking laws subject banks to certain restrictions on extensions of credit to executive officers, directors, certain principal stockholders and their related interests. For example, such extensions of credit (i) must be made on substantially the same terms, including interest rates and collateral, as those prevailing at the time for comparable transactions with unrelated third parties and (ii) must not involve more than the normal risk of repayment or present other unfavorable features. These laws also impose certain lending limits on such loans.
Community Reinvestment Act
The CRA requires that each insured depository institution shall be evaluated by its primary federal regulator with respect to its record in meeting the credit needs of its local community, including low- and moderate-income neighborhoods, consistent with the safe and sound operation of those institutions. These factors are also considered in evaluating mergers, acquisitions and applications to open a branch or facility.
146
Table of Contents
A bank’s compliance with its CRA obligations is based on a performance-based evaluation system that bases CRA ratings on an institution’s lending, service and investment performance. When a bank holding company applies for approval to acquire a bank or other bank holding company, the Federal Reserve will review the CRA assessment of each subsidiary bank of the applicant bank holding company, and such records may be the basis for denying the application. In connection with its assessment of CRA performance, the appropriate bank regulatory agency assigns a rating of “outstanding,” “satisfactory,” “needs to improve” or “substantial noncompliance.” As of its most recent CRA examination, dated December 2018, Southern States Bank was rated “Satisfactory.”
The federal CRA regulations require that evidence of discriminatory, illegal or abusive lending practices be considered in the CRA evaluation. A less than satisfactory CRA rating will slow, if not preclude, acquisitions, and new branches and other expansion activities and may prevent a company from becoming a financial holding company.
CRA agreements with private parties must be disclosed and annual CRA reports must be made to a bank’s primary federal regulator. A financial holding company election, and such election and financial holding company activities are permitted to be continued, only if any affiliated bank has not received less than a “satisfactory” CRA rating.
USA Patriot Act
After the terrorist attacks of September 11, 2001, Congress enacted broad anti-terrorism legislation called the “United and Strengthening America by Providing Appropriate Tools Required to Intercept and Obstruct Terrorism Act of 2001,” which is generally known as the “USA Patriot Act.” Title III of the USA Patriot Act requires financial institutions, including Southern States and Southern States Bank, to help prevent, detect and prosecute international money laundering and the financing of terrorism. The Department of the Treasury has adopted additional requirements to further implement Title III.
The law is intended to enhance the powers of the federal government and law enforcement organizations to combat terrorism, organized crime and money laundering. The USA Patriot Act materially amended and expanded the application of the existing Bank Secrecy Act. It provided enhanced measures, including know your customer, new suspicious activity reporting rules and enhanced anti-money laundering programs. Under the USA Patriot Act, each financial institution is required to establish and maintain anti-money laundering compliance and due diligence programs, which include, at a minimum:
| • | the development of internal policies, procedures, and controls; |
| • | the designation of a compliance officer; |
| • | an ongoing employee training program; and |
| • | an independent audit function to test programs. |
In addition, the USA Patriot Act requires regulatory agencies to consider the record of a bank or bank holding company in combating money laundering activities in their evaluation of bank and bank holding company merger, acquisition and branch expansion transactions.
The U.S. Treasury Department has issued regulations under the USA Patriot Act. The regulations state that a depository institution will be deemed in compliance with the USA Patriot Act provided it continues to comply with the Bank Secrecy Act regulations. Under these regulations, a mechanism has been established for law enforcement to communicate names of suspected terrorists and money launderers to financial institutions, in return for securing the ability to promptly locate accounts and transactions involving those suspects. Financial institutions receiving names of suspects must search their account and transaction records for potential matches and report positive results to FinCEN. Each financial institution must designate a point of contact to receive information requests. These regulations outline how financial institutions can share information concerning suspected terrorist and money laundering activity with other financial institutions under protection from the statutory safe harbor from liability, provided each financial institution notifies FinCEN of its intent to share information.
147
Table of Contents
Recent FinCEN rules require banks to know the beneficial owners of customers that are not natural persons, update customer information in order to develop a customer risk profile, and generally monitor such matters.
FinCEN has also adopted regulations intended to prevent money laundering and terrorist financing through correspondent accounts maintained by U.S. financial institutions on behalf of foreign banks. Financial institutions are required to take reasonable steps to ensure that they are not providing banking services directly or indirectly to foreign shell banks.
Lending Limits
Under Alabama law, the amount of loans which may be made by a bank in the aggregate to one person is limited. Alabama law provides that unsecured loans by a bank to one person may not exceed an amount equal to 10% of the capital and unimpaired surplus of the bank. If the amount exceeds such 10% level, the excess must be secured up to a limit of 20%. For purposes of calculating these limits, loans to various business interests of the borrower, including companies in which a substantial portion of the stock is owned or partnerships in which a person is a partner, must be aggregated with those made to the borrower individually. Loans secured by certain readily marketable collateral are exempt from these limitations, as are loans secured by deposits and certain government securities.
Guidance on Commercial Real Estate Concentrations
Lending operations that involve concentrations of CRE loans are subject to enhanced scrutiny by federal banking regulators. Regulators have issued guidance with respect to the risks posed by commercial real estate lending concentrations. CRE loans generally include C&D loans and loans secured by multifamily property and nonfarm, nonresidential real property where the primary source of repayment is derived from rental income associated with the property, but it excludes owner-occupied real estate. The guidance prescribes the following guidelines for examiners to help identify institutions that are potentially exposed to concentration risk and may warrant greater supervisory scrutiny:
| • | Total loans for construction, land development and other land represent 100 percent or more of an institution’s total capital; or |
| • | Total commercial real estate loans represent 300 percent or more of an institution’s total capital. |
At December 31, 2020, Southern States Bank’s ratio of construction, land development and other land loans to total capital was 71.9%, and its ratio of total commercial real estate loans excluding owner-occupied commercial real estate loans (as defined in the guidance) to total capital was 225.2%.
FDIC Insurance Assessments
The FDIC has adopted a risk-based assessment system for insured depositary institutions that takes into account the risks attributable to different categories and concentrations of assets and liabilities. The assessment rate is based on a combination of factors, including certain financial data and its level of supervisory risk.
The FDIC may terminate the deposit insurance of a bank if it finds that the institution has engaged in unsafe and unsound practices, is in an unsafe or unsound condition to continue operations or has violated any applicable law, regulation, rule, order, or condition imposed by the FDIC.
Transactions with Affiliates
Southern States Bank is subject to sections 23A and 23B of the Federal Reserve Act, or the Affiliates Act, and the Federal Reserve’s implementing Regulation W. An affiliate of a bank is any company or entity that controls, is
148
Table of Contents
controlled by or is under common control with the bank. Accordingly, transactions between Southern States and Southern States Bank will be subject to a number of restrictions. The Affiliates Act imposes restrictions and limitations on the Bank from making extensions of credit to, or the issuance of a guarantee or letter of credit on behalf of, Southern States or other affiliates, the purchase of, or investment in, stock or other securities thereof, the taking of such securities as collateral for loans and the purchase of assets of Southern States or other affiliates. Such restrictions and limitations prevent Southern States or other affiliates from borrowing from the Bank unless the loans are secured by marketable obligations of designated amounts. All such transactions, as well as contracts entered into between the Bank and affiliates, must be on terms that are no less favorable to the Bank than those that would be available from non-affiliated third parties. Federal Reserve policies also forbid the payment by bank subsidiaries of management fees which are unreasonable in amount or exceed the fair market value of the services rendered or, if no market exists, actual costs plus a reasonable profit.
Consumer Financial Services
Southern States Bank is subject to a number of federal and state consumer protection laws that extensively govern its relationship with its customers. These laws include the Equal Credit Opportunity Act, the Fair Credit Reporting Act, the Truth in Lending Act, the Truth in Savings Act, the Electronic Fund Transfer Act, the Expedited Funds Availability Act, the Home Mortgage Disclosure Act, Fair Housing Act, the Real Estate Settlement Procedures Act, the Fair Debt Collection Practices Act, the Service Members Civil Relief Act, the Military Lending Act, and these laws’ respective state law counterparts, as well as state usury laws and laws regarding unfair and deceptive acts and practices. These and other federal laws, among other things, require disclosures of the cost of credit and terms of deposit accounts, provide substantive consumer rights, prohibit discrimination in credit transactions, regulate the use of credit report information, provide financial privacy protections, prohibit unfair, deceptive and abusive practices and subject us to substantial regulatory oversight. Violations of the applicable consumer protection laws can result in significant potential liability from litigation brought by customers, including actual damages, restitution and attorneys’ fees. Federal bank regulators, state attorneys general and state and local consumer protection agencies may also seek to enforce consumer protection requirements and obtain these and other remedies, including regulatory sanctions, customer rescission rights, action by the state and local attorneys general in each jurisdiction in which we operate and civil money penalties. Failure to comply with consumer protection requirements may also result in failure to obtain any required bank regulatory approval for mergers or acquisitions or prohibition from engaging in such transactions even if approval is not required.
Dodd-Frank Act
On July 21, 2010, the Dodd-Frank Wall Street Reform and Consumer Protection Act of 2010, or the Dodd-Frank Act, was signed into law. This law significantly changed the bank regulatory structure and affected the lending, deposit, investment, trading and operating activities of banks and their holding companies. The Dodd-Frank Act required various federal agencies to adopt a broad range of new implementing rules and regulations and to prepare numerous studies and reports for Congress. The following summarizes just a few of the provisions of the Dodd-Frank Act.
The Dodd-Frank Act changed the types of instruments that are eligible for tier 1 capital treatment at the holding company-level. It also called for the Federal Reserve to apply to bank holding companies the same minimum leverage and risk-based capital standards that apply to banks under the Federal Deposit Insurance Act’s prompt corrective action standards.
The Dodd-Frank Act eliminated the federal prohibitions on paying interest on demand deposits, thus allowing businesses to have interest-bearing checking accounts.
The Dodd-Frank Act required fees charged by banks for debit card transactions, commonly referred to as interchange fees, to be both “reasonable and proportional” to the cost incurred by the card issuer and authorized the Federal Reserve to implement regulations with respect to this requirement.
149
Table of Contents
The Dodd-Frank Act also broadened the base for FDIC insurance assessments. Assessments are based on the average consolidated total assets less tangible equity capital of a financial institution. The Dodd-Frank Act permanently increased the maximum amount of deposit insurance for banks, savings institutions and credit unions to $250,000 per depositor.
The Dodd-Frank Act created a new Consumer Financial Protection (the “CFPB”) with broad powers to supervise and enforce consumer protection laws. The CFPB has broad rule-making authority for a wide range of consumer protection laws that apply to all banks, including the authority to prohibit “unfair, deceptive or abusive” acts and practices. The CFPB has examination and enforcement authority over all banks with more than $10 billion in assets. Banks with less than $10 billion in assets will be examined for compliance with consumer laws by their primary bank regulator.
The Dodd-Frank Act increased the regulation of consumer protections regarding mortgage originations, including originator compensation, minimum repayment standards and servicing requirements.
Mortgage Lending Rules
The Dodd-Frank Act authorized the CFPB to establish certain minimum standards for the origination of residential mortgages, including a proper determination of a borrower’s ability to repay. Under the Dodd-Frank Act, financial institutions may not make a residential mortgage loan unless they make a “reasonable and good faith determination” that the consumer has a “reasonable ability” to repay the loan. The Dodd-Frank Act allows borrowers to raise certain defenses to foreclosure but provides a full or partial safe harbor from such defenses for loans that are “qualified mortgages.” The CFPB published final rules to, among other things, specify the types of income and assets that may be considered in the ability-to-repay determination, the permissible sources for verification, and the required methods of calculating the loan’s monthly payments. Since then, the CFPB has made certain modifications to these rules. The rules extend the requirement that creditors verify and document a borrower’s income and assets to include all information that creditors rely on in determining repayment ability.
Financial Privacy and Cybersecurity Requirements
Federal law and regulations limit a financial institution’s ability to share consumer financial information with unaffiliated third parties. Specifically, these provisions require all financial institutions offering financial products or services to consumer customers to provide such customers with the financial institution’s privacy policy and provide such customers the opportunity to “opt out” of the sharing of personal financial information with unaffiliated third parties. The sharing of information for marketing purposes is also subject to limitations.
Federal law and regulations also establish certain information security guidelines that require each financial institution, under the supervision and ongoing oversight of its board of directors or an appropriate committee thereof, to develop, implement, and maintain a comprehensive written information security program designed to ensure the security and confidentiality of customer information, to protect against anticipated threats or hazards to the security or integrity of such information, and to protect against unauthorized access to or use of such information that could result in substantial harm or inconvenience to any customer. Federal and state laws require notice to be provided to customers of a data breach incident under certain circumstances.
Federal banking regulators regularly issue guidance regarding cybersecurity intended to enhance cyber risk management. A financial institution is expected to implement multiple lines of defense against cyber-attacks. Financial institutions are also expected to implement procedures designed to address the risks posed by potential cyber threats, and to allow the institution to respond and recover effectively after a cyber-attack.
Other Legislation and Regulation
Other legislative and regulatory proposals regarding changes in banking and the regulation of banks, thrifts and other financial institutions are considered from time to time by the executive branch of the federal government,
150
Table of Contents
Congress and various state governments. It cannot be predicted whether any of such legislative or regulatory proposals will be adopted and, if adopted, how these will affect Southern States and Southern States Bank.
Monetary and Fiscal Policy
Banking is a business which depends on interest rate differentials. In general, the difference between the interest paid by a bank on its deposits and its other borrowings and the interest received by a bank on its loans to customers and its securities holdings generally constitutes the major portion of a bank’s earnings. Thus, the earnings and growth of Southern States Bank will be subject to the influence of economic conditions generally, both domestic and foreign, and also to the monetary and fiscal policies of the United States and its agencies, particularly the Federal Reserve. The Federal Reserve regulates the supply of money through various means, including open-market dealings in United States government securities, the discount rate at which members may borrow, and reserve requirements on deposits and funds availability regulations. These instruments are used in varying combinations to influence the overall growth of bank loans, investments and deposits and also affect interest rates charged on loans or paid on deposits. The policies of the Federal Reserve have had a significant effect on the operating results of commercial banks in the past and will continue to do so in the future. The nature and timing of any future changes in Federal Reserve policies and their impact on Southern States Bank cannot be predicted.
151
Table of Contents
SHARES ELIGIBLE FOR FUTURE SALE
Actual or anticipated issuances or sales of substantial amounts of our common stock in the public market following this offering could cause the market price of our common stock to decline significantly and make it more difficult for us to sell equity or equity-related securities in the future at a time and on terms that we deem appropriate. The issuance of any shares of our common stock in the future also would, and equity-related securities could, dilute the percentage ownership interest held by our stockholders.
Upon completion of this offering, we will have 8,712,857 shares of our common stock issued and outstanding (or 9,012,857 shares if the underwriters exercise in full their option to purchase additional shares). In addition, 501,492 shares of our common stock are issuable upon the exercise of outstanding stock options.
The shares of common stock sold by the selling stockholders and us in this offering will be freely tradable without further restriction or registration under the Securities Act, except that any shares purchased by our “affiliates” may generally only be resold in compliance with Rule 144 under the Securities Act, which is described below. The remaining outstanding shares will be deemed to be “restricted securities” as that term is defined in Rule 144. Restricted securities may be resold in the U.S. only if they are registered for resale under the Securities Act or an exemption from registration is available.
Lock-Up Agreements
We, our executive officers, directors and the holders of 5% or more of our currently outstanding shares of common stock, including the selling stockholders and certain Institutional Holders, are entering into lock-up agreements under which we and they will generally agree not to offer, sell or otherwise transfer our or their shares for a period of 180 days after the completion of this offering. These lock-up agreements are subject to certain limited exceptions. For additional information, see “Underwriting—Lock-Up Agreements.” As a result of these contractual restrictions, shares of our common stock subject to lock-up agreements will not be eligible for sale until these agreements expire or the restrictions are waived by the underwriters.
Following the lock-up period, all of the shares of our common stock that are restricted securities or are held by our affiliates will be eligible for sale in the public market only if (i) they are registered under the Securities Act or (ii) an exemption from registration, such as Rule 144, is available.
Rule 144
All shares of our common stock held by our “affiliates,” as that term is defined in Rule 144 under the Securities Act, may be sold in the public market, subject to the lock-up agreements and our insider trading policies, in compliance with Rule 144. Rule 144 defines an affiliate as any person who directly or indirectly controls, or is controlled by, or is under common control with, the issuer, which generally includes our directors, executive officers, and certain other related persons. As of July 30, 2021, affiliates held 1,108,691 shares, or 15.0% of our total shares of common stock outstanding as of such date (counting for such purposes our directors and executive officers and 10% or greater beneficial owners).
In general, under Rule 144 under the Securities Act, a person (or persons whose shares are aggregated) who is deemed to be, or to have been during the three months preceding the sale, an “affiliate” of ours would be entitled to sell within any three-month period a number of shares that does not exceed the greater of 1% of the then outstanding shares of our common stock, or the average weekly trading volume of our common stock on NASDAQ during the four calendar weeks preceding the filing of a notice on Form 144 with respect to such sale. Sales by our affiliates under Rule 144 are also subject to a six-month holding period and requirements relating to manner of sale, the availability of current public information about us and the filing of a form in certain circumstances.
In general, Rule 144 also provides that a person who is not deemed to have been an affiliate of ours at any time during the three months preceding a sale, and who has for at least six months beneficially owned shares of
152
Table of Contents
our common stock that are restricted securities, will be entitled to freely sell such shares of our common stock without regard to the limitations described above, provided that such sales comply with the current public information requirements of Rule 144 and we were subject to the Exchange Act periodic reporting requirements for at least 90 days immediately before the sale. A person who is not deemed to have been an affiliate of ours at any time during the three months preceding a sale, and who has beneficially owned for at least one year shares of our common stock that are restricted securities, will be entitled to freely sell such shares of our common stock under Rule 144 without regard to the current public information requirements of Rule 144, provided that we were subject to the Exchange Act periodic reporting requirements for at least 90 days immediately before the sale.
Rule 701
In general, under Rule 701 under the Securities Act, any of our employees, directors or officers, who purchases shares from us in connection with a compensatory stock or option plan or other written agreement before the effective date of this offering, and who is not deemed to have been our “affiliate” during the immediately preceding 90 days, is entitled to resell such shares 90 days after the effective date of this offering in reliance on Rule 144, without having to comply with the holding period requirements or other restrictions contained in Rule 144. The shares that may be sold in compliance with Rule 701 that are subject to lock-up agreements as described above will not become eligible for sale until expiration or waiver of the restrictions set forth in those agreements.
Form S-8 Registration Statement
We intend to file one or more registration statements on Form S-8 under the Securities Act to register the offer and sale of shares of our common stock that are issuable under our Plan. Any such registration statement would be expected to be filed and become effective as soon as practicable after the completion of this offering. Upon effectiveness, the shares of common stock covered by that registration statement will be eligible for sale in the public market, subject to any vesting restrictions with us, Rule 144 restrictions applicable to our affiliates and the lock-up restrictions described above.
153
Table of Contents
Keefe, Bruyette & Woods, Inc. and Truist Securities, Inc. are acting as representatives of the underwriters and joint book-running managers of this offering. Under the terms of an underwriting agreement, which will be filed as an exhibit to the registration statement, each of the underwriters named below has severally agreed to purchase from us and the selling stockholders the respective number of common stock shown opposite its name below:
| Underwriters |
Number of Shares |
|||
| Keefe, Bruyette & Woods, Inc. |
||||
| Truist Securities, Inc. |
||||
| Hovde Group, LLC |
||||
| Performance Trust Capital Partners, LLC |
||||
| Total |
2,000,000 | |||
|
|
|
|||
The underwriters are offering the shares of our common stock subject to a number of conditions, including receipt and acceptance of our common stock by the underwriters. The obligations of the underwriters to pay for and accept delivery of the shares offered by this prospectus are subject to these conditions.
The underwriting agreement between us and the underwriters provides that if any underwriter defaults, the purchase commitments of the non-defaulting underwriters may be increased or this offering may be terminated.
In connection with this offering, the underwriters or securities dealers may distribute offering documents to investors electronically. See “Electronic Distribution.”
Underwriting Discount
Shares of our common stock sold by the underwriters to the public will be offered at the initial public offering price set forth on the cover of this prospectus. Any shares of our common stock sold by the underwriters to securities dealers, including the directed share program administrator, may be sold at that price less a concession, or discount, not in excess of $ per share from the initial public offering price. Any of these securities dealers may resell any shares of our common stock purchased from the underwriters to other brokers or dealers at a discount of up to $ per share from the initial public offering price. If all of the shares of our common stock are not sold at the initial public offering price, the representatives may change the offering price and the other selling terms. No sales of shares of our common stock will be made outside of the U.S. The underwriters reserve the right to reject an order for the purchase of shares, in whole or in part.
The following table shows the initial public offering price, underwriting discount, and proceeds before expenses to us and to the selling stockholders. The information assumes either no exercise or full exercise by the underwriters of their option to purchase an additional shares of our common stock, discussed below:
| Per Share | No Exercise | Full Exercise | ||||||||||
| Initial public offering price |
$ | $ | $ | |||||||||
| Underwriting discount |
||||||||||||
| Proceeds to us before expenses |
||||||||||||
| Proceeds to the selling stockholders before expenses |
||||||||||||
We estimate the expenses of this offering, not including the underwriting discount, to be $1.8 million, and such expenses are payable by us. We also have agreed to reimburse the underwriters for certain of their offering expenses, including counsel fees, expenses related to FINRA matters and the directed share program and certain costs related to the road show. In accordance with FINRA Rule 5110, these reimbursed fees are deemed underwriting compensation for this offering.
154
Table of Contents
Option to Purchase Additional Shares
We have granted the underwriters an option exercisable for 30 days after the date of this prospectus to purchase, from time to time, in whole or in part, up to an aggregate of 300,000 shares from us at the initial public offering price less the underwriting discount. If the underwriters exercise this option, each underwriter will be obligated, subject to the conditions in the underwriting agreement, to purchase a number of additional shares of our common stock proportionate to the number of shares reflected next to such underwriter’s name in the table above relative to the total number of shares reflected in such table.
Lock-Up Agreements
We, our executive officers and directors, and certain of our Institutional Holders beneficially owning 5% or more of our common stock have entered into lock-up agreements with the underwriters. Under these agreements, we and each of these persons have agreed not to, directly or indirectly, without the prior written approval of the representatives and subject to certain limited customary exceptions:
| • | offer, pledge, sell, contract to sell, sell any option or contract to purchase, purchase any option or contract to sell, grant any option, right or warrant for the sale of, hypothecate, establish an open “put equivalent position” within the meaning of Rule 16a-1(h) under the Exchange Act, or otherwise dispose of or transfer any shares of our common stock or any securities convertible into or exchangeable or exercisable for our common stock, whether now owned or hereafter acquired, or with respect to which we or such person has or hereafter acquires the power of disposition, or exercise any right with respect to the registration of any of the foregoing, or file or cause to be filed any registration statement in connection therewith under the Securities Act, with respect to any of the foregoing; |
| • | enter into any swap, hedge or any other agreement or any transaction that transfers, in whole or in part, the economic consequence of ownership of the shares of our common stock or any securities convertible into or exchangeable or exercisable for our common stock, whether any such swap, hedge or transaction is to be settled by delivery of shares of our common stock or other securities, in cash or otherwise; or |
| • | publicly disclose the intention to make any such offer, pledge, sale or disposition, or to enter into any such swap, hedge, transaction or other arrangement. |
These restrictions will be in effect for a period of 180 days after the date of this prospectus. At any time and without public notice, the representatives may, in their sole discretion, waive or release all or some of the shares (or the other securities restricted thereby) from these lock-up agreements. However, as to any of our executive officers or directors, the representatives have agreed to notify us at least three business days before the effective date of any release or waiver, and we have agreed to announce the impending release or waiver by press release through a major news service at least two business days before the effective date of the release or waiver.
These restrictions also apply to securities convertible into or exchangeable or exercisable for or repayable with our common stock to the same extent as they apply to our common stock. They also apply to common stock owned now or later acquired by the person executing the agreement or for which the person executing the agreement later acquires the power of disposition.
Offering Price Determination
Prior to this offering, there has been no public market for our common stock. The initial public offering price was negotiated between the representatives and us. In determining the initial public offering price of our common stock, the representatives considered:
| • | our history; |
| • | our financial information; |
155
Table of Contents
| • | our management and our business potential and earning prospects; |
| • | prospects for the industry in which we compete; |
| • | the prevailing securities markets at the time of this offering; and |
| • | the recent market prices of, and the demand for, publicly traded shares of generally comparable companies. |
The initial public offering price range set forth on the cover page of this prospectus is subject to change as a result of market conditions and other factors. An active trading market for the shares of our common stock may not develop. It is also possible that the shares of our common stock will not trade in the public market at or above the initial public offering price following the completion of this offering.
Indemnification and Contribution
We and the selling stockholders have agreed to indemnify the underwriters and their affiliates, selling agents and controlling persons against certain liabilities, including liabilities under the Securities Act. If we are unable to provide this indemnification, we will contribute to the payments that the underwriters and their affiliates, selling agents and controlling persons may be required to make in respect of those liabilities.
Directed Share Program
At our request, the underwriters have reserved for sale at the initial public offering price approximately 5.2% of the shares offered hereby for Company and Bank directors and executive officers. We will offer these reserved shares through a directed share program. Shares purchased pursuant to the directed share program will be subject to the lock-up provisions described above. The number of shares available for sale to the general public will be reduced to the extent such persons purchase such reserved shares. Any reserved shares not so purchased will be offered by the underwriters to the general public on the same basis as the other shares offered hereby. Fidelity Capital Markets, a division of National Financial Services LLC, an entity affiliated with Fidelity Management & Research Company, or FMR, will administer our directed share program and will be compensated in the same amount as a selected dealer. Directors and officers of the Company have expressed an intent to buy approximately $2.1 million of the shares through the directed share program.
Price Stabilization, Short Positions and Penalty Bids
To facilitate this offering and in accordance with Regulation M under the Exchange Act, or Regulation M, the underwriters may engage in transactions that stabilize, maintain or otherwise affect the price of our common stock, including:
| • | stabilizing transactions; |
| • | short sales; and |
| • | purchases to cover positions created by short sales. |
Stabilizing transactions consist of bids or purchases made for the purpose of preventing or mitigating a decline in the market price of our common stock while this offering is in progress. These transactions may also include making short sales of our common stock, which involve the sale by the underwriters of a greater number of shares of our common stock than they are required to purchase in this offering. Short sales may be “covered short sales,” which are short positions in an amount not greater than the underwriters’ option to purchase additional shares referred to above, or may be “naked short sales,” which are short positions in excess of that amount.
The underwriters may close out any covered short position either by exercising their option to purchase additional shares from us, in whole or in part, or by purchasing shares in the open market. In making this
156
Table of Contents
determination, the underwriters will consider, among other things, the price of shares available for purchase in the open market compared to the price at which they may purchase shares through the option to purchase additional shares described above. The underwriters must close out any naked short position by purchasing shares in the open market. A naked short position is more likely to be created if the underwriters are concerned that there may be downward pressure on the price of our common stock in the open market that could adversely affect investors who purchased in this offering.
As an additional means of facilitating this offering, the underwriters may bid for, and purchase, shares of our common stock in the open market. The underwriting syndicate may also reclaim selling concessions allowed to an underwriter or a dealer for distributing shares of our common stock in this offering, if the syndicate repurchases previously distributed shares of our common stock to cover syndicate short positions or to stabilize the price of our common stock.
As a result of these activities, the price of our common stock may be higher than the price that otherwise might exist in the open market. Neither we nor the underwriters make any representation or prediction as to the effect that the transactions described above may have on the price of our common stock. If these activities are commenced, they may be discontinued by the underwriters at any time without notice. The underwriters may carry out these transactions on NASDAQ, in the over-the-counter market or otherwise.
Passive Market Making
In connection with this offering, the underwriters may engage in passive market making transactions in common stock on NASDAQ in accordance with Rule 103 of Regulation M during a period before the commencement of offers or sales of our common stock and extending through the completion of the distribution of this offering. A passive market maker must generally display its bid at a price not in excess of the highest independent bid of that security. However, if all independent bids are lowered below the passive market maker’s bid, the passive market maker may continue to bid and effect purchases at a price exceeding the then highest independent bid until specified purchase limits are exceeded, at which time such bid must be lowered to an amount no higher than the then highest independent bid. Passive market making may cause the price of our common stock to be higher than the price that otherwise would exist in the open market in the absence of those transactions. The underwriters are not required to engage in passive market making and may end passive market making activities at any time.
Electronic Distribution
A prospectus in electronic format may be made available by email or on the Internet sites or through other online services maintained by one or more of the underwriters or by their affiliates. In those cases, prospective investors may view offering terms online and, depending upon the particular underwriter, prospective investors may be allowed to place orders online. The underwriters may agree with us to allocate a specific number of shares for sale to online brokerage account holders. Any such allocation for online distributions will be made by the representatives on the same basis as other allocations.
Other than the prospectus in electronic format, the information on any underwriter’s web site and any information contained in any other web site maintained by an underwriter is not part of the prospectus or the registration statement of which this prospectus forms a part, has not been approved and/or endorsed by us or any underwriter in its capacity as underwriter and should not be relied upon by investors.
Affiliations
The underwriters and certain of their affiliates are full service financial institutions engaged in various activities, which may include securities trading, commercial and investment banking, financial advisory, investment management, investment research, principal investment, hedging, financing, loan referrals, valuation
157
Table of Contents
and brokerage activities. From time to time, the underwriters or their respective affiliates have directly and indirectly engaged, and may in the future engage, in various financial advisory, investment banking loan referrals and commercial banking services with us and our affiliates, for which they received or paid, or may receive or pay, customary compensation, fees and expense reimbursement.
In the ordinary course of their various business activities, the underwriters and certain of their affiliates may make or hold a broad array of investments and actively trade debt and equity securities (or related derivative securities) and financial instruments (including bank loans) for their own account and for the accounts of their customers, and such investment and securities activities may involve securities and/or instruments of ours or our affiliates. If the underwriters or their affiliates have a lending relationship with us, the underwriters or their affiliates may hedge their credit exposure to us consistent with their customary risk management policies. Typically, the underwriters and their affiliates would hedge such exposure by entering into transactions which consist of either the purchase of credit default swaps or the creation of short positions in our securities or the securities of our affiliates, including potentially the shares of common stock offered hereby. Any such credit default swaps or short positions could adversely affect future trading prices of the shares of common stock offered hereby. The underwriters and certain of their affiliates may also communicate independent investment recommendations, market color or trading ideas and/or publish or express independent research views in respect of such securities or instruments and may at any time hold, or recommend to clients that they acquire, long and/or short positions in such securities and instruments.
Since 2013, Truist Securities, Inc. (previously known as “SunTrust Robinson Humphrey”) has served as an investment banking firm for Southern States. The services performed by Truist Securities, Inc. (previously known as “SunTrust Robinson Humphrey”) have included advice regarding acquisitions, including the acquisition of Small Town Bank in 2019 and Columbus Community Bank in 2015, advice regarding the sale of equity in 2016 to the Institutional Investors, and other advice regarding Southern States growth plans, business plans and the economic environment.
Selling Restrictions
General
Other than in the U.S., no action has been taken by us or the underwriters that would permit a public offering of the shares of common stock offered by this prospectus in any jurisdiction where action for that purpose is required. The shares offered by this prospectus may not be offered or sold, directly or indirectly, nor may this prospectus or any other offering material or advertisements in connection with the offer and sale of any such shares be distributed or published in any jurisdiction, except under circumstances that will result in compliance with the applicable rules and regulations of that jurisdiction. Persons obtaining possession of this prospectus are advised to inform themselves about and to observe any restrictions relating to the Offering and the distribution of this prospectus. This prospectus does not constitute an offer to sell or a solicitation of an offer to buy any shares offered by this prospectus in any jurisdiction in which such an offer or a solicitation is unlawful.
158
Table of Contents
The validity of the shares of our common stock offered by this prospectus will be passed upon for us by Jones Walker LLP, Birmingham, Alabama. Certain legal matters in connection with this offering will be passed upon for the underwriters by Jones Day, Atlanta, Georgia.
Our consolidated financial statements as of December 31, 2020 and 2019 and for the two years ended December 31, 2020 included in this prospectus have been audited by Mauldin Jenkins, LLC, independent registered public accounting firm, as set forth in its report thereon appearing elsewhere herein, and are included in reliance upon such report given on the authority of that firm as experts in accounting and auditing.
On September 13, 2019, Southern States acquired East Alabama. See “Business – Our History and Growth.” At that time, the managing partner of Mauldin & Jenkins, LLC (the “Audit Firm”), along with his brother, had a loan (the “Loan”) from East Alabama’s subsidiary bank, Small Town Bank. The Loan was fully secured by the brothers’ family farm as well as by a certificate of deposit. East Alabama and Small Town Bank were never clients of the Audit Firm prior to September 13, 2019, at which time East Alabama was merged with Southern States and Small Town Bank was merged with the Bank. The Loan automatically became a loan of Southern States Bank upon the acquisition. At that point, the existence of the Loan rendered the Audit Firm not independent under SEC rules.
The facts underlying the existence of the Loan were reviewed by the Audit Firm and the Audit Committee of Southern States on several occasions. The Audit Firm advised the Audit Committee that, the Audit Firm concluded that it was objective and impartial regarding the audit of Southern States’ financial statements for the fiscal year ended December 31, 2019. The Audit Firm concluded, and the Audit Committee concurred, that the following factors supported the conclusion that the Audit Firm’s objectivity and impartiality were not impaired by the Loan:
| • | The Loan was paid off in full prior to the completion of Southern States’ 2019 audit and the release of Southern States’ audited financial statements and the audit report; |
| • | The Loan’s amount was immaterial to the Southern States Bank’s total loan portfolio (0.095% at December 31, 2019) and that the Loan was only outstanding at Southern States Bank from September 13, 2019 through February 13, 2020; |
| • | The Loan was made (i) in the ordinary course of Small Town Bank’s business, (ii) on substantially the same terms, including interest rates and collateral, as those prevailing at the time for comparable persons unrelated to Small Town Bank, and (iii) did not involve more than the normal risk of collectability or present other unfavorable features; |
| • | The Loan was fully secured including a component of cash collateral and was current under its terms at all times; and |
| • | The managing partner of the Audit Firm did not provide audit or other services to Southern States at any point during the year ended 2019, nor any interim period during 2019 or 2020, and there has been no communication between the managing partner and the audit team related to Southern States’ accounting or the Audit Firm’s audit of Southern States during such period. |
WHERE YOU CAN FIND MORE INFORMATION
We have filed with the SEC a registration statement on Form S-1 under the Securities Act with respect to the common stock offered by this prospectus. This prospectus, which constitutes a part of that registration statement, does not contain all of the information set forth in the registration statement and the related exhibits
159
Table of Contents
and schedules. Some items are omitted in accordance with the rules and regulations of the SEC. Accordingly, we refer you to the complete registration statement, including its exhibits and schedules, for further information about us and the shares of common stock to be sold in this offering. Statements or summaries in this prospectus as to the contents of any contract or other document referred to in this prospectus are not necessarily complete and, where that contract or document is filed as an exhibit to the registration statement, each statement or summary is qualified in all respects by reference to the exhibit to which the reference relates.
The registration statement, of which this prospectus forms a part, and its exhibits and schedules are available to you for free on the SEC’s Internet website at www.sec.gov.
Upon completion of this offering, we will become subject to the informational and reporting requirements of the Exchange Act and, in accordance with those requirements, will file reports and proxy statements with the SEC. These reports and proxy statements and other information will be available to you for free on the SEC’s Internet website at www.sec.gov. You can also obtain reports and proxy statements and other information about us, free of charge, at our website at www.southernstatesbank.net. Information on, or accessible through, our website is not part of this prospectus. We intend to furnish to our stockholders our annual reports containing our audited consolidated financial statements certified by an independent registered public accounting firm.
Information that we file with the SEC after the date of this prospectus may supersede the information in this prospectus. You may read these reports and proxy statements and other information and obtain copies of such documents and information as described above. No person is authorized to give any information or to make any representations other than those contained in this prospectus, and, if given or made, such information or representations must not be relied upon as having been authorized. Neither the delivery of this prospectus nor any distribution of securities made hereunder shall imply that there has been no change in the information set forth or in our affairs since the date hereof.
160
Table of Contents
INDEX TO THE FINANCIAL STATEMENTS
| Consolidated Financial Statements |
||||
| Consolidated balance sheets as of March 31, 2021 (unaudited) and December 31, 2020 |
F-2 | |||
| F-3 | ||||
| F-4 | ||||
| F-5 | ||||
| F-6 | ||||
| F-7 | ||||
| Consolidated Financial Statements |
||||
| F-39 | ||||
| Consolidated balance sheets as of December 31, 2020 and 2019 |
F-41 | |||
| Consolidated statements of income for the years ended December 31, 2020 and 2019 |
F-42 | |||
| Consolidated statements of comprehensive income for the years ended December 31, 2020 and 2019 |
F-43 | |||
| Consolidated statements of stockholders’ equity for the years ended December 31, 2020 and 2019 |
F-44 | |||
| Consolidated statements of cash flows for the years ended December 31, 2020 and 2019 |
F-45 | |||
| F-46 | ||||
F-1
Table of Contents
SOUTHERN STATES BANCSHARES, INC.
AND SUBSIDIARY
(In thousands, except per share amounts)
CONSOLIDATED BALANCE SHEETS
| March 31, 2021 (Unaudited) |
December 31, 2020 (Audited) |
|||||||
| Assets |
||||||||
| Cash and due from banks |
$ | 17,536 | $ | 23,229 | ||||
| Interest-bearing deposits in banks |
129,071 | 51,503 | ||||||
| Federal funds sold |
24,121 | 10,175 | ||||||
|
|
|
|
|
|||||
| Total cash and cash equivalents |
170,728 | 84,907 | ||||||
| Securities available for sale |
106,217 | 114,001 | ||||||
| Other equity securities, at fair value |
4,995 | 5,017 | ||||||
| Restricted equity securities, at cost |
2,788 | 3,224 | ||||||
| Loans held for sale |
2,268 | 5,696 | ||||||
| Loans, net of unearned income |
1,083,274 | 1,030,115 | ||||||
| Less allowance for loan losses |
12,605 | 11,859 | ||||||
|
|
|
|
|
|||||
| Loans, net |
1,070,669 | 1,018,256 | ||||||
| Premises and equipment, net |
24,900 | 24,426 | ||||||
| Accrued interest receivable |
4,088 | 4,243 | ||||||
| Bank owned life insurance |
22,583 | 22,458 | ||||||
| Annuities |
12,920 | 12,903 | ||||||
| Foreclosed assets |
10,229 | 10,224 | ||||||
| Goodwill |
16,862 | 16,862 | ||||||
| Core deposit intangible |
1,698 | 1,764 | ||||||
| Other assets |
8,291 | 8,525 | ||||||
|
|
|
|
|
|||||
| Total assets |
$ | 1,459,236 | $ | 1,332,506 | ||||
|
|
|
|
|
|||||
| Liabilities and Stockholders’ Equity |
||||||||
| Liabilities: |
||||||||
| Deposits: |
||||||||
| Noninterest-bearing |
$ | 365,114 | $ | 290,867 | ||||
| Interest-bearing |
894,930 | 848,794 | ||||||
|
|
|
|
|
|||||
| Total deposits |
1,260,044 | 1,139,661 | ||||||
| Other borrowings |
7,983 | 7,975 | ||||||
| FHLB Advances |
31,900 | 30,900 | ||||||
| Subordinated notes |
4,497 | 4,493 | ||||||
| Accrued interest payable |
274 | 278 | ||||||
| Other liabilities |
9,938 | 8,543 | ||||||
|
|
|
|
|
|||||
| Total liabilities |
1,314,636 | 1,191,850 | ||||||
|
|
|
|
|
|||||
| Commitments and contingencies: |
||||||||
| Stockholders’ equity: |
||||||||
| Preferred stock, $0.01 par value; 1,000,000 shares authorized 0 shares issued and outstanding at March 31, 2021 and 2020, respectively |
— | — | ||||||
| Common stock, $5 par value, 15,000,000 shares authorized; 7,716,428 and 7,678,195 shares issued and outstanding at March 31, 2021 and December 31, 2020, respectively |
38,582 | 38,391 | ||||||
| Capital surplus |
65,885 | 65,327 | ||||||
| Retained earnings |
39,174 | 34,183 | ||||||
| Accumulated other comprehensive income |
1,808 | 3,194 | ||||||
| Unvested restricted stock |
(849 | ) | (439 | ) | ||||
|
|
|
|
|
|||||
| Total stockholders’ equity |
144,600 | 140,656 | ||||||
|
|
|
|
|
|||||
| Total liabilities and stockholders’ equity |
$ | 1,459,236 | $ | 1,332,506 | ||||
|
|
|
|
|
|||||
See Notes to Consolidated Financial Statements.
F-2
Table of Contents
SOUTHERN STATES BANCSHARES, INC.
AND SUBSIDIARY
(In thousands, except per share amounts)
UNAUDITED CONSOLIDATED STATEMENTS OF INCOME
FOR THE THREE MONTHS ENDED MARCH 31,
| 2021 | 2020 | |||||||
| Interest income: |
||||||||
| Loans, including fees |
$ | 13,021 | $ | 11,787 | ||||
| Taxable securities |
401 | 269 | ||||||
| Nontaxable securities |
207 | 98 | ||||||
| Other interest and dividends |
48 | 355 | ||||||
|
|
|
|
|
|||||
| Total interest income |
13,677 | 12,509 | ||||||
|
|
|
|
|
|||||
| Interest expense: |
||||||||
| Deposits |
1,190 | 2,534 | ||||||
| Other borrowings |
203 | 193 | ||||||
|
|
|
|
|
|||||
| Total interest expense |
1,393 | 2,727 | ||||||
|
|
|
|
|
|||||
| Net interest income |
12,284 | 9,782 | ||||||
| Provision for loan losses |
750 | 800 | ||||||
|
|
|
|
|
|||||
| Net interest income after provision for loan losses |
11,534 | 8,982 | ||||||
|
|
|
|
|
|||||
| Noninterest income: |
||||||||
| Service charges on deposit accounts |
360 | 451 | ||||||
| SWAP fees |
558 | — | ||||||
| SBA/USDA fees |
2,865 | 478 | ||||||
| Mortgage origination fees |
407 | 288 | ||||||
| Net gain on sale of securities |
(232 | ) | 738 | |||||
| Other operating income |
538 | 447 | ||||||
|
|
|
|
|
|||||
| Total noninterest income |
4,496 | 2,402 | ||||||
|
|
|
|
|
|||||
| Noninterest expenses: |
||||||||
| Salaries and employee benefits |
5,057 | 4,487 | ||||||
| Equipment and occupancy expenses |
879 | 903 | ||||||
| Data processing fees |
447 | 415 | ||||||
| Regulatory assessments |
221 | 150 | ||||||
| Other operating expenses |
1,928 | 1,931 | ||||||
|
|
|
|
|
|||||
| Total noninterest expenses |
8,532 | 7,886 | ||||||
|
|
|
|
|
|||||
| Income before income taxes |
7,498 | 3,498 | ||||||
| Income tax expense |
1,817 | 823 | ||||||
|
|
|
|
|
|||||
| Net income |
$ | 5,681 | $ | 2,675 | ||||
|
|
|
|
|
|||||
| Basic earnings per share |
$ | 0.74 | $ | 0.35 | ||||
|
|
|
|
|
|||||
| Diluted earnings per share |
$ | 0.73 | $ | 0.34 | ||||
|
|
|
|
|
|||||
See Notes to Consolidated Financial Statements.
F-3
Table of Contents
SOUTHERN STATES BANCSHARES, INC.
AND SUBSIDIARY
(In thousands, except per share amounts)
UNAUDITED CONSOLIDATED STATEMENTS OF COMPREHENSIVE INCOME
FOR THE THREE MONTHS ENDED MARCH 31,
| 2021 | 2020 | |||||||
| Net income |
$ | 5,681 | $ | 2,675 | ||||
|
|
|
|
|
|||||
| Other comprehensive income (loss): |
||||||||
| Unrealized holding losses on securities available for sale arising during the period, net of benefit of $547 and $573, respectively |
(1,558 | ) | (1,631 | ) | ||||
| Reclassification adjustment for losses (gains) on securities available for sale realized in net income, net of benefit (tax) of $60 and ($192), respectively |
172 | (546 | ) | |||||
|
|
|
|
|
|||||
| Other comprehensive loss |
(1,386 | ) | (2,177 | ) | ||||
|
|
|
|
|
|||||
| Comprehensive income |
$ | 4,295 | $ | 498 | ||||
|
|
|
|
|
|||||
See Notes to Consolidated Financial Statements.
F-4
Table of Contents
SOUTHERN STATES BANCSHARES, INC.
AND SUBSIDIARY
(In thousands, except per share amounts)
UNAUDITED CONSOLIDATED STATEMENTS OF STOCKHOLDERS’ EQUITY
| Preferred Stock | Common Stock | Capital Surplus |
Retained Earnings |
Accumulated Other Comprehensive Income (Loss) |
Unvested Restricted Stock |
Total Stockholders’ Equity |
||||||||||||||||||||||||||||||
| Shares | Par Value | Shares | Par Value | |||||||||||||||||||||||||||||||||
| Balance, December 31, 2020 |
— | $ | — | 7,678,195 | $ | 38,391 | $ | 65,327 | $ | 34,183 | $ | 3,194 | $ | (439 | ) | $ | 140,656 | |||||||||||||||||||
| Net income |
— | — | 5,681 | — | 5,681 | |||||||||||||||||||||||||||||||
| Issuance of common stock |
8,240 | 41 | 99 | — | — | 140 | ||||||||||||||||||||||||||||||
| Exercise of common stock options |
5,008 | 25 | — | — | — | 25 | ||||||||||||||||||||||||||||||
| Issuance of restricted stock |
24,985 | 125 | 376 | — | — | (500 | ) | 1 | ||||||||||||||||||||||||||||
| Stock-based compensation |
— | 83 | — | — | 90 | 173 | ||||||||||||||||||||||||||||||
| Common stock dividends paid |
— | — | (690 | ) | — | — | (690 | ) | ||||||||||||||||||||||||||||
| Other comprehensive income |
— | — | — | (1,386 | ) | — | (1,386 | ) | ||||||||||||||||||||||||||||
|
|
|
|
|
|
|
|
|
|
|
|
|
|
|
|
|
|
|
|||||||||||||||||||
| Balance, March 31, 2021 |
— | $ | — | 7,716,428 | $ | 38,582 | $ | 65,885 | $ | 39,174 | $ | 1,808 | $ | (849 | ) | $ | 144,600 | |||||||||||||||||||
|
|
|
|
|
|
|
|
|
|
|
|
|
|
|
|
|
|
|
|||||||||||||||||||
See Notes to Consolidated Financial Statements.
F-5
Table of Contents
SOUTHERN STATES BANCSHARES, INC.
AND SUBSIDIARY
(In thousands, except per share amounts)
UNAUDITED CONSOLIDATED STATEMENTS OF CASH FLOWS
FOR THE THREE MONTHS ENDED MARCH 31,
| 2021 | 2020 | |||||||
| OPERATING ACTIVITIES |
||||||||
| Net income |
$ | 5,681 | $ | 2,675 | ||||
| Adjustments to reconcile net income to net cash provided by operating activities: |
||||||||
| Depreciation and software amortization |
477 | 485 | ||||||
| Net loss (gain) on sale of securities available for sale |
232 | (738 | ) | |||||
| Net amortization of securities |
134 | 31 | ||||||
| Amortization of core deposit intangible |
66 | 66 | ||||||
| Provision for loan losses |
750 | 800 | ||||||
| Deferred income taxes |
— | — | ||||||
| Gain on sale of foreclosed assets |
— | (104 | ) | |||||
| Write-down of foreclosed assets |
— | 500 | ||||||
| Loss on sale of premises, equipment and software |
— | — | ||||||
| Stock-based compensation |
173 | 178 | ||||||
| Net decrease (increase) in loans held for sale |
3,427 | (9,362 | ) | |||||
| Income from bank owned life insurance |
(125 | ) | (135 | ) | ||||
| Decrease (increase) in interest receivable |
155 | (239 | ) | |||||
| (Decrease) increase in interest payable |
(4 | ) | 96 | |||||
| Net other operating activities |
2,100 | (191 | ) | |||||
|
|
|
|
|
|||||
| Net cash provided by operating activities |
13,066 | (5,938 | ) | |||||
|
|
|
|
|
|||||
| INVESTING ACTIVITIES |
||||||||
| Purchase of securities available for sale |
(12,949 | ) | (42,224 | ) | ||||
| Proceeds from sale of securities available for sale |
15,759 | 22,470 | ||||||
| Proceeds from maturities, calls, and paydowns of securities available for sale |
2,758 | 1,445 | ||||||
| Net redemption of restricted equity securities |
436 | (775 | ) | |||||
| Purchase of other equity securities |
— | — | ||||||
| Purchase of annuity contracts |
— | — | ||||||
| Purchase of bank owned life insurance contracts |
— | — | ||||||
| Net increase in loans |
(53,263 | ) | (49,241 | ) | ||||
| Proceeds from sale of foreclosed assets |
95 | 398 | ||||||
| Proceeds from bank owned life insurance |
— | — | ||||||
| Cash paid in acquisition |
— | — | ||||||
| Proceeds from sale of premises, equipment and software |
— | — | ||||||
| Purchase of premises, equipment and software |
(951 | ) | (6,538 | ) | ||||
|
|
|
|
|
|||||
| Net cash provided by (used in) investing activities |
(48,115 | ) | (74,465 | ) | ||||
|
|
|
|
|
|||||
| FINANCING ACTIVITIES |
||||||||
| Net increase (decrease) in deposits |
120,383 | 53,739 | ||||||
| Proceeds from issuance of common stock |
165 | 85 | ||||||
| Net proceeds of other borrowings |
— | 20,861 | ||||||
| Repayment of other borrowings |
1,012 | — | ||||||
| Common stock dividends paid |
(690 | ) | — | |||||
|
|
|
|
|
|||||
| Net cash provided by (used in) financing activities |
120,870 | 74,685 | ||||||
|
|
|
|
|
|||||
| Net increase (decrease) in cash and cash equivalents |
86,821 | (5,718 | ) | |||||
| Cash and cash equivalents at beginning of year |
84,907 | 115,235 | ||||||
|
|
|
|
|
|||||
| Cash and cash equivalents at end of year |
$ | 170,728 | $ | 109,517 | ||||
|
|
|
|
|
|||||
| SUPPLEMENTAL DISCLOSURE |
||||||||
| Cash paid during the year for: |
||||||||
| Interest |
$ | 1,397 | $ | 2,631 | ||||
| Income Taxes |
$ | — | $ | — | ||||
| NONCASH TRANSACTIONS |
||||||||
| Transfers of loans to foreclosed assets |
$ | 100 | $ | 8 | ||||
| Internally financed sale of foreclosed assets |
$ | — | $ | 923 | ||||
See Notes to Consolidated Financial Statements.
F-6
Table of Contents
SOUTHERN STATES BANCSHARES, INC.
AND SUBSIDIARY
NOTES TO UNAUDITED CONSOLIDATED FINANCIAL STATEMENTS
(In thousands, except per share amounts)
| NOTE 1. | SUMMARY OF SIGNIFICANT ACCOUNTING POLICIES |
Nature of Business
Southern States Bancshares, Inc. (the “Company”) is a bank holding company whose principal activity is the ownership and management of its wholly-owned subsidiary, Southern States Bank (the “Bank”). The Bank is a commercial bank headquartered in Anniston, Calhoun County, Alabama. The Bank also operates branch offices in Birmingham, Opelika, Auburn, Huntsville, Sylacauga, Wedowee, Ranburne, Roanoke, Heflin, Alabama as well as Columbus, Carrollton, Dallas, and Newnan, Georgia. The Bank also has an LPO office located in Atlanta, Georgia. The Bank provides a full range of banking services in its primary market areas and the surrounding areas.
Basis of Presentation and Accounting Estimates
The unaudited consolidated financial statements include the accounts of the Company and its subsidiary. Significant intercompany transactions and balances have been eliminated in consolidation.
In preparing the unaudited consolidated financial statements in conformity with accounting principles generally accepted in the United States of America, management is required to make estimates and assumptions that affect the reported amounts of assets and liabilities and the disclosure of contingent assets and liabilities as of the balance sheet date and the reported amounts of revenues and expenses during the reporting period. Actual results could differ from those estimates.
Material estimates that are particularly susceptible to significant change in the near term relate to the determination of the allowance for loan losses, the valuation of other real estate owned, financial instruments, deferred taxes, and other-than-temporary impairment of securities. In connection with the determination of the estimated losses on loans and the valuation of other real estate owned, management obtains independent appraisals for significant collateral.
The determination of the adequacy of the allowance for loan losses is based on estimates that are particularly susceptible to significant changes in the economic environment and market conditions.
The Company’s loans are generally secured by specific items of collateral including real property, consumer assets, and business assets. Although the Company has a diversified loan portfolio, a substantial portion of its borrowers’ ability to honor their contracts is dependent on local economic conditions.
While management uses available information to recognize losses on loans, further reductions in the carrying amounts of loans may be necessary based on changes in local economic conditions.
In addition, regulatory agencies, as an integral part of their examination process, periodically review the estimated losses on loans. Such agencies may require the Company to recognize additional losses based on their judgments about information available to them at the time of their examination. Because of these factors, it is reasonably possible that the estimated losses on loans may change materially in the near term. However, the amount of the change that is reasonably possible cannot be estimated.
The Company has evaluated all transactions, events, and circumstances for consideration or disclosure through June 9, 2021, the date these financial statements were available, and has reflected or disclosed those items within the unaudited consolidated financial statements and related footnotes as deemed appropriate.
F-7
Table of Contents
NOTES TO UNAUDITED CONSOLIDATED FINANCIAL STATEMENTS
(In thousands, except per share amounts)
| NOTE 1. | SUMMARY OF SIGNIFICANT ACCOUNTING POLICIES (Continued) |
Cash, Cash Equivalents and Cash Flows
For purposes of reporting cash flows, cash and cash equivalents includes cash on hand, cash items in process of collection, amounts due from banks, interest-bearing deposits in banks and federal funds sold. Cash flows from loans held for sale, loans, restricted equity securities, and deposits are reported net.
The Company maintains amounts due from banks which, at times, may exceed federally insured limits. The Company has not experienced any losses in such accounts.
The Bank is required to maintain reserve balances in cash or on deposit with a correspondent bank for the Federal Reserve Bank, based on a percentage of deposits. The total of those reserve balances was $0 at March 31, 2021 and December 31, 2020.
Securities
All securities are classified as “available for sale” and recorded at fair value, with unrealized gains and losses excluded from earnings and reported in other comprehensive income (loss). Purchase premiums and discounts are recognized in interest income using the interest method over the terms of the securities. Gains and losses on the sale of securities are recorded on the trade date and are determined using the specific identification method.
The Company evaluates investment securities for other-than-temporary impairment (OTTI) using relevant accounting guidance on a regular basis. Consideration is given to (1) the length of time and the extent to which the fair value has been less than cost, (2) the financial condition and near term prospects of the issuer including an evaluation of credit ratings, (3) the impact of changes in market interest rates, (4) the intent of the Company to sell a security, and (5) whether it is more likely than not the Company will have to sell the security before recovery of its cost basis. If the Company intends to sell an impaired security, or if it is more likely than not the Company will have to sell the security before recovery of its cost basis, the Company records an other-than-temporary loss in an amount equal to the entire difference between fair value and amortized cost. Otherwise, only the credit portion of the estimated loss is recognized in earnings, with the other portion of the loss is recognized in other comprehensive income (loss).
Other Equity Securities
The mutual fund owned by the Bank is classified as an equity security, and it is carried at fair value with any periodic changes in value recorded through the income statement.
Restricted Equity Securities
Restricted equity securities are investments that are restricted in marketability. The Company, as a member of the Federal Home Loan Bank (FHLB) system, is required to maintain an investment in capital stock of the FHLB based upon its assets or outstanding advances. The Company has also purchased stock in First National Banker’s Bankshares, Inc. (FNBB), and Pacific Coast Banker’s Bank (PCBB), both correspondent banks.
F-8
Table of Contents
NOTES TO UNAUDITED CONSOLIDATED FINANCIAL STATEMENTS
(In thousands, except per share amounts)
| NOTE 1. | SUMMARY OF SIGNIFICANT ACCOUNTING POLICIES (Continued) |
Loans Held For Sale
Loans originated and intended for sale in the secondary market are carried at the lower of cost or fair value (LOCOM). For loans carried at LOCOM, gains and losses on loan sales (sales proceeds minus carrying value) are recorded in noninterest income, and direct loan origination costs and fees are deferred at origination of the loan and are recognized in noninterest income upon sale of the loan. The estimated fair value of loans held for sale is based on independent third party quoted prices.
Loans
Loans that management has the intent and ability to hold for the foreseeable future or until maturity or pay-off are reported at their outstanding principal balances less deferred fees and costs on originated loans and the allowance for loan losses. Interest income is accrued on the outstanding principal balance. Loan origination fees, net of certain direct origination costs, are deferred and recognized as an adjustment of the related loan yield over the life of the loan, using the straight line method without anticipating prepayments.
The accrual of interest on loans is discontinued when, in management’s opinion, the borrower may be unable to meet payments as they become due, or at the time the loan is 90 days past due, unless the loan is well-secured and in the process of collection. In all cases, loans are placed on nonaccrual or charged off at an earlier date if collection of principal and interest is considered doubtful. All interest accrued but not collected for loans that are placed on nonaccrual or charged off is reversed against interest income or charged to the allowance; unless management believes that the accrual of interest is recoverable through the liquidation of collateral. Interest income on nonaccrual loans is recognized on the cash basis, until the loans are returned to accrual status. Loans are returned to accrual status when all the principal and interest amounts contractually due are brought current and the loan has been performing according to the contractual terms generally for a period of not less than six months.
Certain Purchased Loans
Purchased loans are recorded at their fair value at the acquisition date. Credit discounts are included in the determination of fair value; therefore, an allowance for loan losses is not recorded at the acquisition date. Acquired loans are evaluated upon acquisition and classified as either purchased impaired or purchased non-impaired. Purchased impaired loans reflect credit deterioration since origination such that it is probable at acquisition that the Company will be unable to collect all contractually required payments. The purchased impaired loans acquired are subject to the Company’s internal and external credit review and monitoring. If credit deterioration is experienced subsequent to the initial acquisition fair value amount, such deterioration will be measured, and a provision for credit losses will be charged to earnings.
Such purchased loans are accounted for individually. The Company estimates the amount and timing of expected cash flows for each purchased loan, and the expected cash flows in excess of the amount paid is recorded as interest income over the remaining life of the loan or pool (accretable yield). The excess of the loan’s contractual principal and interest over expected cash flows is not recorded (nonaccretable difference). Over the life of the loan, expected cash flows will continue to be estimated. If the present value of expected cash flows is less than the carrying amount, a loss is recorded. If the present value of expected cash flows is greater than the carrying amount, it is recognized as part of future interest income. Purchased impaired loans at the time of acquisition are accounted for under ASC 310-30.
F-9
Table of Contents
NOTES TO UNAUDITED CONSOLIDATED FINANCIAL STATEMENTS
(In thousands, except per share amounts)
| NOTE 1. | SUMMARY OF SIGNIFICANT ACCOUNTING POLICIES (Continued) |
Certain Purchased Loans (Continued)
Purchased non-impaired loans are accounted for under ASC 310-20, with the difference between the fair value and unpaid principal balance of the loan at the acquisition date amortized or accreted to interest income over the estimated life of the loans.
Allowance for Loan Losses
The allowance for loan losses is established as losses are estimated to have occurred through a provision for loan losses charged to expense. Loan losses are charged against the allowance when management believes the uncollectibility of a loan balance is confirmed. Confirmed losses are charged off immediately. Subsequent recoveries, if any, are credited to the allowance.
The allowance is an amount that management believes will be adequate to absorb estimated losses relating to specifically identified loans, as well as probable credit losses inherent in the balance of the loan portfolio. The allowance for loan losses is evaluated on a regular basis by management and is based upon management’s periodic review of the collectibility of loans in light of historical experience, the nature and volume of the loan portfolio, overall portfolio quality, review of specific problem loans, current economic conditions that may affect the borrower’s ability to pay, estimated value of any underlying collateral and prevailing economic conditions. This evaluation is inherently subjective as it requires estimates that are susceptible to significant revision as more information becomes available. This evaluation does not include the effects of expected losses on specific loans or groups of loans that are related to future events or expected changes in economic conditions.
The allowance consists of specific and general components. The specific component relates to loans that are classified as impaired. For those loans that are classified as impaired, an allowance is established when the discounted cash flows, collateral value, or observable market price of the impaired loan is lower than the carrying value of that loan. The general component covers non-impaired loans and is based on historical loss experience adjusted for qualitative factors. Other adjustments may be made to the allowance for pools of loans after an assessment of internal or external influences on credit quality that are not fully reflected in the historical loss or risk rating data.
A loan is considered impaired when it is probable, based on current information and events, the Company will be unable to collect all principal and interest payments due in accordance with the contractual terms of the loan agreement. Loans, for which the terms have been modified at the borrower’s request, and for which the borrower is experiencing financial difficulties, are considered troubled debt restructurings and classified as impaired.
Factors considered by management in determining impairment include payment status, collateral value, and the probability of collecting scheduled principal and interest when due. Loans that experience insignificant payment delays and payment shortfalls are not generally classified as impaired. Impaired loans are measured by either the present value of expected future cash flows discounted at the loan’s effective interest rate, the loan’s obtainable market price, or the fair value of the collateral if the loan is collateral dependent. Interest on accruing impaired loans is recognized as long as such loans do not meet the criteria for nonaccrual status. Large groups of smaller balance homogeneous loans are collectively evaluated for impairment.
F-10
Table of Contents
NOTES TO UNAUDITED CONSOLIDATED FINANCIAL STATEMENTS
(In thousands, except per share amounts)
| NOTE 1. | SUMMARY OF SIGNIFICANT ACCOUNTING POLICIES (Continued) |
Allowance for Loan Losses (Continued)
The Company’s allowance is allocated among commercial real estate loans, real estate construction and development loans, residential real estate loans, commercial and industrial loans, and consumer loans. The general allocations to these loan pools are based on the historical loss rates for specific loan types and the internal risk grade, if applicable, adjusted for both internal and external qualitative risk factors. The qualitative factors considered by management include, among other factors, (1) changes in local and national economic conditions; (2) changes in asset quality and foreclosure rates; (3) changes in loan portfolio volume; (4) the composition and concentrations of credit; (5) the impact of competition on loan structuring and pricing; (6) the experience and ability of lending personnel and management; (7) effectiveness of the Company’s loan policies, procedures and internal controls; (8) current conditions in the real estate and construction markets; (9) the effect of entrance into new markets or the offering of a new product; (10) the loan review system and oversight of the Board of Directors. The total allowance established for each homogeneous loan pool represents the product of the historical loss ratio adjusted for internal and external factors and the total dollar amount of the loans in the pool.
Troubled Debt Restructurings
A loan is considered a troubled debt restructuring (TDR) based on individual facts and circumstances. The Company designates loan modifications as TDRs when for economic or legal reasons related to the borrower’s financial difficulties, it grants a concession to the borrower that it would not otherwise consider. These concessions may include rate reductions, principal forgiveness, extension of maturity date and other actions intended to minimize potential losses.
In determining whether a borrower is experiencing financial difficulties, the Company considers if the borrower is in payment default or would be in payment default in the foreseeable future without the modification, the borrower declared or is in the process of declaring bankruptcy, the borrower’s projected cash flows will not be sufficient to service any of its debt, or the borrower cannot obtain funds from sources other than the Company at a market rate for debt with similar risk characteristics.
In determining whether the Company has granted a concession, the Company assesses, if it does not expect to collect all amounts due, whether the current value of the collateral will satisfy the amounts owed, whether additional collateral or guarantees from the borrower will serve as adequate compensation for other terms of the restructuring, and whether the borrower otherwise has access to funds at a market rate for debt with similar risk characteristics.
Premises and Equipment
Land is carried at cost. Premises and equipment are carried at cost less accumulated depreciation computed on the straight-line method over the estimated useful lives of the assets or the expected terms of the leases, if shorter. Expected terms include lease option periods to the extent that the exercise of such options is reasonably assured. Maintenance and repairs are expensed as incurred while major additions and improvements are capitalized. Gains and losses on dispositions are reflected in income.
| Years | ||||
| Buildings |
10-39 | |||
| Furniture and equipment |
3-7 | |||
F-11
Table of Contents
NOTES TO UNAUDITED CONSOLIDATED FINANCIAL STATEMENTS
(In thousands, except per share amounts)
| NOTE 1. | SUMMARY OF SIGNIFICANT ACCOUNTING POLICIES (Continued) |
Transfers of Financial Assets
Transfers of financial assets are accounted for as sales, when control over the assets has been surrendered. Control over transferred assets is deemed to be surrendered when (1) the assets have been isolated from the Company—put presumptively beyond the reach of the transferor and its creditors, even in bankruptcy or other receivership, (2) the transferee obtains the right (free of conditions that constrain it from taking advantage of that right) to pledge or exchange the transferred assets, and (3) the Company does not maintain effective control over the transferred assets through an agreement to repurchase them before their maturity or the ability to unilaterally cause the holder to return specific assets.
Foreclosed Assets
Assets acquired through, or in lieu of, loan foreclosure are held for sale and are initially recorded at fair value less estimated selling costs. Any write-down to fair value at the time of transfer to foreclosed assets is charged to the allowance for loan losses. Subsequent to foreclosure, valuations are periodically performed by management and the assets are carried at the lower of carrying amount or fair value less estimated costs to sell. Costs of improvements are capitalized, whereas costs related to holding foreclosed assets and subsequent write-downs to the value are expensed. Any gains and losses realized at the time of disposal are reflected in income.
Goodwill
Goodwill represents the excess of the amount paid over the fair value of the net assets at the date of acquisition. Goodwill is subject to an annual evaluation of impairment. If desired, the Company can assess qualitative factors to determine if comparing the carrying value of the reporting unit to its fair value is necessary. Should the fair value be less than the carrying value, an impairment write-down would be taken. Based on its assessment of qualitative factors, the Company determined that no impairment exists at March 31, 2021.
Goodwill is not amortized but is evaluated for impairment on an annual basis or whenever an event occurs or circumstances change to indicate that it is more likely than not that an impairment loss has been incurred (i.e., a triggering event). During 2021, the Company performed a goodwill impairment test in March 2021. The qualitative factors considered in determining if fair value of the unit was less than the carrying amount were economic conditions related to the COVID-19 virus and the change in the interest rate environment. A quantitative assessment of goodwill impairment included determining the estimated fair value of Company using a market-based approach. The market approach was based on a comparison of certain financial metrics of the Company to public company peers. It was determined there was no impairment.
Core Deposit Intangible
A core deposit intangible is initially recognized based on a valuation, of acquired deposits, performed as of the acquisition date. The core deposit intangible is amortized over the average remaining life of the acquired customer deposits, or approximately 7 years. The intangible asset is reviewed annually for events or circumstances that could negatively impact the recoverability of the intangible. These events could include loss of core deposits, increased competition, or adverse changes in the economy. To the extent this intangible asset is deemed unrecoverable, an impairment
F-12
Table of Contents
NOTES TO UNAUDITED CONSOLIDATED FINANCIAL STATEMENTS
(In thousands, except per share amounts)
| NOTE 1. | SUMMARY OF SIGNIFICANT ACCOUNTING POLICIES (Continued) |
Core Deposit Intangible (Continued)
charge would be recorded. The Company maintains steady deposit growth across our markets and continues to attract new customer deposits. The intangible asset was evaluated for impairment as of March 31, 2021 and based on that evaluation there was no impairment.
Accounting Policy for Derivative Instruments and Hedging Activities
FASB ASC 815, Derivatives and Hedging (“ASC 815”), provides the disclosure requirements for derivatives and hedging activities with the intent to provide users of financial statements with an enhanced understanding of: (a) how and why an entity uses derivative instruments, (b) how the entity accounts for derivative instruments and related hedged items, and (c) how derivative instruments and related hedged items affect an entity’s financial position, financial performance, and cash flows. Further, qualitative disclosures are required that explain the Company’s objectives and strategies for using derivatives, as well as quantitative disclosures about the fair value of and gains and losses on derivative instruments, and disclosures about credit-risk-related contingent features in derivative instruments.
As required by ASC 815, the Company records all derivatives on the balance sheet at fair value. The accounting for changes in the fair value of derivatives depends on the intended use of the derivative, whether the Company has elected to designate a derivative in a hedging relationship and apply hedge accounting and whether the hedging relationship has satisfied the criteria necessary to apply hedge accounting. Derivatives designated and qualifying as a hedge of the exposure to changes in the fair value of an asset, liability, or firm commitment attributable to a particular risk, such as interest rate risk, are considered fair value hedges. Derivatives designated and qualifying as a hedge of the exposure to variability in expected future cash flows, or other types of forecasted transactions, are considered cash flow hedges. Derivatives may also be designated as hedges of the foreign currency exposure of a net investment in a foreign operation. Hedge accounting generally provides for the matching of the timing of the hedged asset or liability that are attributable to the hedged risk in a fair value hedge or the earnings effect of the hedged forecasted transactions in a cash flow hedge. The Company may enter into derivative contracts that are intended to economically hedge certain of its risks, even though hedge accounting does not apply or the Company elects not to apply hedge accounting.
In accordance with the FASB’s fair value measurement guidance in ASU 2011-04, the Company made an accounting policy election to measure the credit risk of its derivative financial instruments that are subject to master netting agreements on a net basis by counterparty portfolio.
Income Taxes
Income tax accounting guidance results in two components of income tax expense: current and deferred. Current income tax expense reflects taxes to be paid or refunded for the current period by applying the provisions of the enacted tax law to the taxable income or excess of deductions over revenues. The Company determines deferred income taxes using the liability (or balance sheet) method. Under this method, the net deferred tax asset or liability is based on the tax effects of the differences between the book and tax bases of assets and liabilities, and enacted changes in tax rates and laws are recognized in the period in which they occur.
F-13
Table of Contents
NOTES TO UNAUDITED CONSOLIDATED FINANCIAL STATEMENTS
(In thousands, except per share amounts)
| NOTE 1. | SUMMARY OF SIGNIFICANT ACCOUNTING POLICIES (Continued) |
Income Taxes (Continued)
Deferred income tax expense results from changes in deferred tax assets and liabilities between periods. Deferred tax assets are recognized if it is more likely than not, based on the technical merits, that the tax position will be realized or sustained upon examination. The term more likely than not means a likelihood of more than 50 percent; the terms examined and upon examination also include resolution of the related appeals or litigation processes, if any. A tax position that meets the more-likely-than-not recognition threshold is initially and subsequently measured as the largest amount of tax benefit that has a greater than 50 percent likelihood of being realized upon settlement with a taxing authority that has full knowledge of all relevant information. The determination of whether or not a tax position has met the more-likely-than-not recognition threshold considers the facts, circumstances, and information available at the reporting date and is subject to management’s judgment. Deferred tax assets may be reduced by deferred tax liabilities and a valuation allowance if, based on the weight of evidence available, it is more likely than not that some portion or all of a deferred tax asset will not be realized. Management believes that the Company will generate sufficient operating earnings to realize the deferred tax benefits.
Earnings Per Share
Basic earnings per share is calculated by dividing net income available to common shareholders by the weighted average number of common shares outstanding. Diluted earnings per share reflect additional potential common shares that would have been outstanding if dilutive potential common shares had been issued, as well as any adjustment to income that would result from the assumed issuance. Potential common shares that may be issued by the Company relate to outstanding stock options.
| For the Three Months Ended March 31, |
||||||||
| 2021 | 2020 | |||||||
| Basic Earnings Per Share: |
||||||||
| Net income |
$ | 5,681 | $ | 2,675 | ||||
|
|
|
|
|
|||||
| Weighted average common shares outstanding |
7,681,578 | 7,654,192 | ||||||
|
|
|
|
|
|||||
| Basic earnings per share |
$ | 0.74 | $ | 0.35 | ||||
|
|
|
|
|
|||||
| Diluted Earnings Per Share: |
||||||||
| Net income allocated to common shareholders |
$ | 5,674 | $ | 2,675 | ||||
|
|
|
|
|
|||||
| Weighted average common shares outstanding |
7,681,578 | 7,654,192 | ||||||
| Net dilutive effect of: |
||||||||
| Assumed exercises of stock options |
113,281 | 137,037 | ||||||
|
|
|
|
|
|||||
| Average shares and dilutive potential common shares |
7,794,859 | 7,791,229 | ||||||
|
|
|
|
|
|||||
| Diluted earnings per share |
$ | 0.73 | $ | 0.34 | ||||
|
|
|
|
|
|||||
F-14
Table of Contents
NOTES TO UNAUDITED CONSOLIDATED FINANCIAL STATEMENTS
(In thousands, except per share amounts)
| NOTE 1. | SUMMARY OF SIGNIFICANT ACCOUNTING POLICIES (Continued) |
Stock Compensation Plans
Stock compensation accounting guidance requires that the compensation cost relating to share-based payment transactions be recognized in financial statements. That cost will be measured based on the grant date fair value of the equity or liability instruments issued. The stock compensation accounting guidance covers a wide range of share-based compensation arrangements including stock options and warrants, restricted stock plans, performance-based awards, share appreciation rights, and employee share purchase plans.
The stock compensation accounting guidance requires that compensation cost for all stock awards be calculated and recognized over the employees’ service period, generally defined as the vesting period. For awards with graded-vesting, compensation cost is recognized on a straight-line basis over the requisite service period for the entire award. A Black-Scholes model is used to estimate the fair value of stock options, while the estimated market price of the Company’s common stock at the date of grant is used for restricted stock awards and stock grants.
Comprehensive Income
Accounting principles generally require that recognized revenue, expenses, gains and losses be included in net income. Although certain changes in assets and liabilities, such as unrealized gains and losses on available for sale securities, are reported as a separate component of the equity section of the balance sheet, such items, along with net income, are components of comprehensive income.
Fair Value of Financial Instruments
Fair values of financial instruments are estimates using relevant market information and other assumptions, as more fully disclosed in Note 12. Fair value estimates involve uncertainties and matters of significant judgment. Changes in assumptions or in market conditions could significantly affect the estimates.
Revenue Recognition
On January 1, 2018, the Company adopted ASC 606 and all subsequent amendments (collectively “ASC 606”) which (1) creates a single framework for recognizing revenue from contracts with customers that fall within its scope and (2) revises when it is appropriate to recognize a gain (loss) from the transfer of nonfinancial assets, such as other real estate owned (OREO). The majority of the Company’s revenues come from interest income and other sources, including loans and securities that are outside the scope of ASC 606. With the exception of gains/losses on sale of OREO, the Company’s services that fall within the scope of ASC 606 are presented within noninterest income and are recognized as revenue as the Company satisfies its obligations to the customer. Services within the scope of ASC 606 reported in noninterest income include service charges on deposit accounts, bank card services and interchange fees, and ATM fees.
Recent Accounting Pronouncements
In February 2016 the Financial Accounting Standards Board (FASB) issued ASU 2016-02, “Leases (Topic 842)” to increase transparency and comparability among organizations by recognizing lease assets and lease liabilities on the balance sheet and by disclosing key information about leasing
F-15
Table of Contents
NOTES TO UNAUDITED CONSOLIDATED FINANCIAL STATEMENTS
(In thousands, except per share amounts)
| NOTE 1. | SUMMARY OF SIGNIFICANT ACCOUNTING POLICIES (Continued) |
Recent Accounting Pronouncements (Continued)
arrangements. ASU 2016-02 requires organizations that lease assets (lessees) to recognize on the balance sheet the assets and liabilities for the rights and obligations created by the lease for all operating leases under current U.S. GAAP with a term of more than 12 months. The ASU is effective for non public business entities for fiscal years beginning after December 15, 2021. Early adoption is permitted. The ASU should be applied on a modified retrospective basis, with a cumulative-effect adjustment directly to retained earnings as of the beginning of the period of adoption. The adoption of ASU 2016-02 is not expected to have a material impact on the Company’s consolidated financial statements.
In July 2018 the FASB issued ASU 2018-11, “Leases –Targeted Improvements” to provide entities with relief from the costs of implementing certain aspects of the new leasing standard, ASU 2016-02. Specifically, under the amendments in ASU 2018-11: (1) entities may elect not to recast the comparative periods presented when transitioning to the new leasing standard, and (2) lessors may elect not to separate lease and non-lease components when certain conditions are met. The amendments have the same effective date as ASU 2016-02 (January 1, 2022 for the Company). The adoption of ASU 2018-11 is not expected to have a material impact on the Company’s consolidated financial statements.
In June 2016 the FASB issued ASU 2016-13, “Financial Instruments – Credit Losses (Topic 326): Measurement of Credit Losses on Financial Instruments.” The new guidance will apply to most financial assets measured at amortized cost and certain other instruments including loans, debt securities held to maturity, net investments in leases and off-balance sheet credit exposures. The guidance will replace the current incurred loss accounting model that delays recognition of a loss until it is probable a loss has been incurred with an expected loss model that reflects expected credit losses based upon a broader range of estimates including consideration of past events, current conditions and supportable forecasts. The guidance also eliminates the current accounting model for purchased credit impaired loans and debt securities, which will require re-measurement of the related allowance at each reporting period. The guidance includes enhanced disclosure requirements intended to help financial statement users better understand estimates and judgement used in estimating credit losses. As originally issued, ASU 2016-13 was effective for financial statements issued for fiscal years and for interim periods within those fiscal years beginning after December 15, 2020, with institutions required to apply the changes through a cumulative-effect adjustment to their retained earnings balance as of the beginning of the first reporting period in which the guidance is effective. On October 16, 2019, the FASB approved a delay in the implementation of ASU 2016-13 by two years for non pubic business entities, including the Company. Management has been in the process of developing a revised model to calculate the allowance for loan and leases losses upon implementation of ASU 2016-13 in order to determine the impact on the Company’s consolidated financial statements and, at this time, expects to recognize a one-time cumulative effect adjustment to the allowance for loan and lease losses as of the beginning of the first reporting period in which the new standard is effective. The magnitude of any such one-time adjustments is not yet known.
F-16
Table of Contents
NOTES TO UNAUDITED CONSOLIDATED FINANCIAL STATEMENTS
(In thousands, except per share amounts)
| NOTE 2. | SECURITIES |
The amortized cost and fair value of securities are summarized as follows:
| Amortized Cost |
Gross Unrealized Gains |
Gross Unrealized Losses |
Fair Value |
|||||||||||||
| Securities Available for Sale |
||||||||||||||||
| March 31, 2021: |
||||||||||||||||
| U.S. Treasury securities |
$ | 2,665 | $ | — | $ | (2) | $ | 2,663 | ||||||||
| U.S. Government sponsored enterprises (GSEs) |
9,311 | 131 | (66 | ) | 9,376 | |||||||||||
| State and municipal securities |
57,168 | 2,165 | (349 | ) | 58,984 | |||||||||||
| Corporate debt securities |
9,033 | 188 | (37 | ) | 9,184 | |||||||||||
| Asset based securities |
8,955 | 151 | (1 | ) | 9,105 | |||||||||||
| Mortgage-backed |
||||||||||||||||
| GSE residential/multifamily |
16,642 | 299 | (36 | ) | 16,905 | |||||||||||
|
|
|
|
|
|
|
|
|
|||||||||
| Total securities available for sale |
$ | 103,774 | $ | 2,934 | $ | (491 | ) | $ | 106,217 | |||||||
|
|
|
|
|
|
|
|
|
|||||||||
| December 31, 2020: |
||||||||||||||||
| U.S. Government sponsored enterprises (GSEs) |
$ | 9,154 | $ | 246 | $ | (34 | ) | $ | 9,366 | |||||||
| State and municipal securities |
64,468 | 3,531 | (58 | ) | 67,941 | |||||||||||
| Corporate debt securities |
8,286 | 188 | (5 | ) | 8,469 | |||||||||||
| Asset based securities |
9,035 | 76 | — | 9,111 | ||||||||||||
| Mortgage-backed |
||||||||||||||||
| GSE residential/multifamily |
18,753 | 394 | (33 | ) | 19,114 | |||||||||||
|
|
|
|
|
|
|
|
|
|||||||||
| Total securities available for sale |
$ | 109,696 | $ | 4,435 | $ | (130 | ) | $ | 114,001 | |||||||
|
|
|
|
|
|
|
|
|
|||||||||
Securities with a carrying value of approximately $43,857 at March 31, 2021 and $40,983 at December 31, 2020, were pledged to secure public deposits and for other purposes as required or permitted by law.
The amortized cost and fair value of securities available for sale as of March 31, 2021 by contractual maturity are shown below. Actual maturities may differ from contractual maturities in mortgage-backed securities because the mortgages underlying the securities may be called or repaid with or without penalty. Therefore, these securities are not included by maturity in the following summary:
| Securities Available for Sale | ||||||||
| Amortized Cost |
Fair Value |
|||||||
| Due from one year to five years |
$ | 1,195 | $ | 1,233 | ||||
| Due after five to ten years |
19,620 | 19,866 | ||||||
| Due after ten years |
66,318 | 68,213 | ||||||
| Mortgage-backed securities |
16,641 | 16,905 | ||||||
|
|
|
|
|
|||||
| $ | 103,774 | $ | 106,217 | |||||
|
|
|
|
|
|||||
F-17
Table of Contents
NOTES TO UNAUDITED CONSOLIDATED FINANCIAL STATEMENTS
(In thousands, except per share amounts)
| NOTE 2. | SECURITIES (Continued) |
Temporarily Impaired Securities
The following table shows the gross unrealized losses and fair value of securities, aggregated by category and length of time that securities have been in a continuous unrealized loss position at March 31, 2021 and December 31, 2020.
| Less Than Twelve Months |
Over Twelve Months |
|
||||||||||||||||||
| Gross Unrealized Losses |
Fair Value |
Gross Unrealized Losses |
Fair Value |
Total Unrealized Losses |
||||||||||||||||
| March 31, 2021 |
||||||||||||||||||||
| U.S. Treasury securities |
$ | (2 | ) | $ | 553 | $ | — | $ | — | $ | (2 | ) | ||||||||
| U.S. Government sponsored enterprises (GSEs) |
(66 | ) | 2,733 | — | — | (66 | ) | |||||||||||||
| State and municipal securities |
(340 | ) | 15,046 | (9 | ) | 157 | (349 | ) | ||||||||||||
| Corporate debt securities |
(37 | ) | 2,963 | — | — | (37 | ) | |||||||||||||
| Asset based securities |
(1 | ) | 960 | — | — | (1 | ) | |||||||||||||
| Mortgage-backed GSE residential/multifamily |
(36 | ) | 5,132 | — | — | (36 | ) | |||||||||||||
|
|
|
|
|
|
|
|
|
|
|
|||||||||||
| Total securities |
$ | (482 | ) | $ | 27,387 | $ | (9) | $ | 157 | $ | (491 | ) | ||||||||
|
|
|
|
|
|
|
|
|
|
|
|||||||||||
| Less Than Twelve Months |
Over Twelve Months |
|
||||||||||||||||||
| Gross Unrealized Losses |
Fair Value |
Gross Unrealized Losses |
Fair Value |
Total Unrealized Losses |
||||||||||||||||
| December 31, 2020 |
||||||||||||||||||||
| U.S. Government sponsored enterprises (GSEs) |
$ | (34 | ) | $ | 2,051 | $ | — | $ | — | $ | (34 | ) | ||||||||
| State and municipal securities |
(58 | ) | 4,979 | — | — | (58 | ) | |||||||||||||
| Corporate debt securities |
(5 | ) | 1,495 | — | — | (5 | ) | |||||||||||||
| Asset based securities |
— | 960 | — | — | — | |||||||||||||||
| Mortgage-backed GSE residential/multifamily |
(33 | ) | 6,643 | — | — | (33 | ) | |||||||||||||
|
|
|
|
|
|
|
|
|
|
|
|||||||||||
| Total securities |
$ | (130 | ) | $ | 16,128 | $ | — | $ | — | $ | (130 | ) | ||||||||
|
|
|
|
|
|
|
|
|
|
|
|||||||||||
The unrealized losses on forty-one securities were caused by interest rate changes. Because the Company does not intend to sell the securities and it is not more likely than not that the Company will be required to sell the securities before recovery of the amortized cost bases, at maturity, the Company does not consider these securities to be other-than-temporarily impaired at March 31, 2021.
Other-Than-Temporary Impairment
The Company routinely conducts periodic reviews to identify and evaluate each investment security to determine whether an other-than-temporary impairment has occurred. Factors included in the evaluation process may include geographic concentrations, credit ratings, and other performance indicators of the underlying asset. As of March 31, 2021 and December 31, 2020, no securities within the Company’s investment securities portfolio was considered other-than-temporarily impaired.
F-18
Table of Contents
NOTES TO UNAUDITED CONSOLIDATED FINANCIAL STATEMENTS
(In thousands, except per share amounts)
| NOTE 3. | LOANS |
Portfolio Segments and Classes
The composition of loans, excluding loans held for sale, is summarized as follows:
| December 31, | ||||||||
| March 31, 2021 |
December 31, 2020 |
|||||||
| Real estate mortgages: |
||||||||
| Construction and development |
$ | 121,199 | $ | 102,559 | ||||
| Residential |
151,883 | 152,212 | ||||||
| Commercial |
575,022 | 514,923 | ||||||
| Commercial and industrial |
230,157 | 254,395 | ||||||
| Consumer and other |
9,200 | 9,644 | ||||||
|
|
|
|
|
|||||
| 1,087,461 | 1,033,733 | |||||||
| Deferred loan fees |
(4,187 | ) | (3,618 | ) | ||||
| Allowance for loan losses |
(12,605 | ) | (11,859 | ) | ||||
|
|
|
|
|
|||||
| Loans, net |
$ | 1,070,669 | $ | 1,018,256 | ||||
|
|
|
|
|
|||||
For purposes of the disclosures required pursuant to ASC 310, the loan portfolio was disaggregated into segments and then further disaggregated into classes for certain disclosures. A portfolio segment is defined as the level at which an entity develops and documents a systematic method for determining its allowance for credit losses. There are three loan portfolio segments that include real estate, commercial and industrial, and consumer and other. A class is generally determined based on the initial measurement attribute, risk characteristic of the loan, and an entity’s method for monitoring and assessing credit risk. Commercial and industrial is a separate commercial loan class. Classes within the real estate portfolio segment include construction and development, residential mortgages, and commercial mortgages. Consumer loans and other are a class in itself.
In light of the U.S. and global economic crisis brought about by the COVID-19 pandemic, the Company has prioritized assisting its clients through this troubled time. The CARES Act provides for Paycheck Protection Plan (PPP) loans to be made by banks to employers with less than 500 employees if they continue to employ their existing workers. As of March 31, 2021, the Company has outstanding 332 loans for a total amount of $60,846 under the PPP. At March 31, 2021, unaccreted deferred loan origination fees related to PPP loans totaled $1,536. PPP loan origination fees recorded as an adjustment to loan yield for the year were $976. These PPP loans are included within the commercial and industrial loan category in the table above.
The following describe risk characteristics relevant to each of the portfolio segments and classes:
Real estate - As discussed below, the Company offers various types of real estate loan products. All loans within this portfolio segment are particularly sensitive to the valuation of real estate:
| • | Loans for real estate construction and development are repaid through cash flow related to the operations, sale or refinance of the underlying property. This portfolio class includes extensions of credit to real estate developers or investors where repayment is dependent on the sale of the real estate or income generated from the real estate collateral. |
| • | Residential mortgages include 1-4 family first mortgage loans which are repaid by various means such as a borrower’s income, sale of the property, or rental income derived from the property. Also included in residential mortgages are real estate loans secured by farmland, |
F-19
Table of Contents
NOTES TO UNAUDITED CONSOLIDATED FINANCIAL STATEMENTS
(In thousands, except per share amounts)
| NOTE 3. | LOANS (Continued) |
Portfolio Segments and Classes (Continued)
| second liens, or open end real estate loans, such as home equity lines. These loans are typically repaid in the same means as 1-4 family first mortgages. |
| • | Commercial real estate mortgage loans include both owner-occupied commercial real estate loans and other commercial real estate loans such as commercial loans secured by income producing properties. Owner-occupied commercial real estate loans made to operating businesses are long-term financing of land and buildings and are repaid by cash flows generated from business operations. Real estate loans for income-producing properties such as apartment buildings, hotels, office and industrial buildings, and retail shopping centers are repaid by cash flows from rent income derived from the properties. |
Commercial and industrial - The commercial loan portfolio segment includes commercial and industrial loans. These loans include those loans to commercial customers for use in normal business operations to finance working capital needs, equipment purchases, leases, or expansion projects. Loans are repaid by business cash flows. Collection risk in this portfolio is driven by the creditworthiness of the underlying borrower, particularly cash flows from the borrowers’ business operations.
Consumer and other - The consumer loan portfolio segment includes direct consumer installment loans, overdrafts and other revolving credit loans. Loans in this portfolio are sensitive to unemployment and other key consumer economic measures which affects borrowers’ incomes and cash for repayment.
Credit Risk Management
The Chief Credit Officer, Officers Loan Committee and Directors Loan Committee are each involved in the credit risk management process and assess the accuracy of risk ratings, the quality of the portfolio and the estimation of inherent credit losses in the loan portfolio. This comprehensive process also assists in the prompt identification of problem credits. The Company has taken a number of measures to manage the portfolios and reduce risk, particularly in the more problematic portfolios.
The Company employs a credit risk management process with defined policies, accountability and routine reporting to manage credit risk in the loan portfolio segments. Credit risk management is guided by a comprehensive Loan Policy that provides for a consistent and prudent approach to underwriting and approvals of credits. Within the Board approved Loan Policy, procedures exist that elevate the approval requirements as credits become larger and more complex. All loans are individually underwritten, risk-rated, approved, and monitored.
Responsibility and accountability for adherence to underwriting policies and accurate risk ratings lies in each portfolio segment. For the consumer portfolio segment, the risk management process focuses on managing customers who become delinquent in their payments. For the commercial and real estate portfolio segments, the risk management process focuses on underwriting new business and, on an ongoing basis, monitoring the credit of the portfolios. To ensure problem credits are identified on a timely basis, several specific portfolio reviews occur each year to assess the larger adversely rated credits for proper risk rating and accrual status.
Credit quality and trends in the loan portfolio segments are measured and monitored regularly. Detailed reports, by product, collateral, accrual status, etc., are reviewed by the Chief Credit Officer, Officers Loan Committee and Directors Loan Committee.
F-20
Table of Contents
NOTES TO UNAUDITED CONSOLIDATED FINANCIAL STATEMENTS
(In thousands, except per share amounts)
| NOTE 3. | LOANS (Continued) |
Credit Risk Management (Continued)
A description of the general characteristics of the risk categories used by the Company is as follows:
| • | Pass - A pass loan is a strong credit with no existing or known potential weaknesses deserving of management’s close attention. |
| • | Special Mention - A loan that has potential weaknesses that deserve management’s close attention. If left uncorrected, these potential weaknesses may result in deterioration of the repayment prospects for the loan or in the institution’s credit position at some future date. These loans are not adversely classified and do not expose an institution to sufficient risk to warrant adverse classification. |
| • | Substandard - Substandard loans are inadequately protected by the current sound worth and paying capacity of the obligor or of the collateral pledged, if any. Loans so classified must have a well-defined weakness or weaknesses that jeopardize the liquidation of the debt. They are characterized by the distinct possibility that the institution will sustain some loss if the deficiencies are not corrected. |
| • | Doubtful - Loans classified Doubtful have all the weaknesses inherent in those classified Substandard with the added characteristic that the weaknesses make collection or liquidation in full, on the basis of currently known facts, conditions, and values, highly questionable and improbable. |
| • | Loss - Loans classified Loss are considered uncollectible and of such little value that their continuance as bankable assets is not warranted. This classification does not mean that the loan has absolutely no recovery or salvage value but rather it is not practical or desirable to defer writing off this basically worthless asset even though partial recovery may be effected in the future. |
F-21
Table of Contents
NOTES TO UNAUDITED CONSOLIDATED FINANCIAL STATEMENTS
(In thousands, except per share amounts)
| NOTE 3. | LOANS (Continued) |
Credit Risk Management (Continued)
The following tables summarize the risk category of the Company’s loan portfolio based upon the most recent analysis performed as of March 31, 2021 and December 31, 2020:
| Pass | Special Mention |
Substandard | Doubtful | Total | ||||||||||||||||
| March 31, 2021 |
||||||||||||||||||||
| Real estate mortgages: |
||||||||||||||||||||
| Construction and development |
$ | 113,350 | $ | 2,087 | $ | 5,762 | $ | — | $ | 121,199 | ||||||||||
| Residential |
144,505 | 5,847 | 1,425 | 106 | 151,883 | |||||||||||||||
| Commercial |
544,233 | 24,557 | 6,232 | — | 575,022 | |||||||||||||||
| Commercial and industrial |
218,689 | 10,885 | 317 | 266 | 230,157 | |||||||||||||||
| Consumer and other |
7,768 | 1,417 | 15 | — | 9,200 | |||||||||||||||
|
|
|
|
|
|
|
|
|
|
|
|||||||||||
| Total: |
$ | 1,028,545 | $ | 44,793 | $ | 13,751 | $ | 372 | $ | 1,087,461 | ||||||||||
|
|
|
|
|
|
|
|
|
|
|
|||||||||||
| December 31, 2020 |
||||||||||||||||||||
| Real estate mortgages: |
||||||||||||||||||||
| Construction and development |
$ | 95,214 | $ | 6,113 | $ | 1,232 | $ | — | $ | 102,559 | ||||||||||
| Residential |
144,256 | 6,245 | 1,627 | 84 | 152,212 | |||||||||||||||
| Commercial |
471,555 | 36,754 | 6,614 | — | 514,923 | |||||||||||||||
| Commercial and industrial |
240,646 | 13,138 | 611 | — | 254,395 | |||||||||||||||
| Consumer and other |
8,186 | 1,435 | 23 | — | 9,644 | |||||||||||||||
|
|
|
|
|
|
|
|
|
|
|
|||||||||||
| Total: |
$ | 959,857 | $ | 63,685 | $ | 10,107 | $ | 84 | $ | 1,033,733 | ||||||||||
|
|
|
|
|
|
|
|
|
|
|
|||||||||||
Past Due Loans
A loan is considered past due if any required principal and interest payments have not been received as of the date such payments were required to be made under the terms of the loan agreement. Generally, management places a loan on nonaccrual when there is a clear indication that the borrower’s cash flow may not be sufficient to meet payments as they become due, which is generally when a loan is 90 days past due. The following tables present the aging of the recorded investment in loans and leases as of March 31, 2021 and December 31, 2020:
F-22
Table of Contents
NOTES TO UNAUDITED CONSOLIDATED FINANCIAL STATEMENTS
(In thousands, except per share amounts)
| NOTE 3. | LOANS (Continued) |
Past Due Loans (Continued)
| Past Due Status (Accruing Loans) | ||||||||||||||||||||||||||||
| Current | 30-59 Days |
60-89 Days |
90+ Days |
Total Past Due |
Nonaccrual | Total | ||||||||||||||||||||||
| March 31, 2021 |
||||||||||||||||||||||||||||
| Real estate mortgages: |
||||||||||||||||||||||||||||
| Construction and development |
$ | 120,063 | $ | 74 | $ | — | $ | — | $ | 74 | $ | 1,062 | $ | 121,199 | ||||||||||||||
| Residential |
150,423 | 635 | — | — | 635 | 825 | 151,883 | |||||||||||||||||||||
| Commercial |
572,647 | 803 | — | — | 803 | 1,572 | 575,022 | |||||||||||||||||||||
| Commercial and industrial |
229,439 | 335 | — | — | 335 | 383 | 230,157 | |||||||||||||||||||||
| Consumer and other |
9,171 | 14 | — | — | 14 | 15 | 9,200 | |||||||||||||||||||||
|
|
|
|
|
|
|
|
|
|
|
|
|
|
|
|||||||||||||||
| Total: |
$ | 1,081,743 | $ | 1,861 | $ | — | $ | — | $ | 1,861 | $ | 3,857 | $ | 1,087,461 | ||||||||||||||
|
|
|
|
|
|
|
|
|
|
|
|
|
|
|
|||||||||||||||
| December 31, 2020 |
||||||||||||||||||||||||||||
| Real estate mortgages: |
||||||||||||||||||||||||||||
| Construction and development |
$ | 101,375 | $ | 117 | $ | 90 | $ | — | $ | 207 | $ | 977 | $ | 102,559 | ||||||||||||||
| Residential |
150,837 | 382 | 94 | 42 | 518 | 857 | 152,212 | |||||||||||||||||||||
| Commercial |
512,208 | 1,196 | — | 41 | 1,237 | 1,478 | 514,923 | |||||||||||||||||||||
| Commercial and industrial |
252,473 | 626 | 1,212 | — | 1,838 | 84 | 254,395 | |||||||||||||||||||||
| Consumer and other |
9,581 | 18 | 15 | 8 | 41 | 22 | 9,644 | |||||||||||||||||||||
|
|
|
|
|
|
|
|
|
|
|
|
|
|
|
|||||||||||||||
| Total: |
$ | 1,026,474 | $ | 2,339 | $ | 1,411 | $ | 91 | $ | 3,841 | $ | 3,418 | $ | 1,033,733 | ||||||||||||||
|
|
|
|
|
|
|
|
|
|
|
|
|
|
|
|||||||||||||||
Allowance for Loans Losses
The following tables detail activity in the allowance for loan losses by portfolio segment as of March 31, 2021 and March 31, 2020. Allocation of a portion of the allowance to one category of loans does not preclude its availability to absorb losses in other categories.
| Real Estate | Commercial | Consumer | Total | |||||||||||||
| March 31, 2021 |
||||||||||||||||
| Allowance for loan losses: |
||||||||||||||||
| Balance, beginning of year |
$ | 8,057 | $ | 3,609 | $ | 193 | $ | 11,859 | ||||||||
| Provision for loan losses |
1,231 | (428 | ) | (53 | ) | 750 | ||||||||||
| Loans charged off |
(16 | ) | — | (2 | ) | (18 | ) | |||||||||
| Recoveries of loans previously charged off |
2 | 11 | 1 | 14 | ||||||||||||
|
|
|
|
|
|
|
|
|
|||||||||
| Ending balance |
$ | 9,274 | $ | 3,192 | $ | 139 | $ | 12,605 | ||||||||
|
|
|
|
|
|
|
|
|
|||||||||
| Ending balance – individually evaluated for impairment |
$ | 357 | $ | 390 | $ | 12 | $ | 759 | ||||||||
| Ending balance – collectively evaluated for impairment |
8,823 | 2,802 | 127 | 11,752 | ||||||||||||
| Ending balance – loans acquired with deteriorated credit quality |
94 | — | — | 94 | ||||||||||||
|
|
|
|
|
|
|
|
|
|||||||||
| Total ending balance |
$ | 9,274 | $ | 3,192 | $ | 139 | $ | 12,605 | ||||||||
|
|
|
|
|
|
|
|
|
|||||||||
F-23
Table of Contents
NOTES TO UNAUDITED CONSOLIDATED FINANCIAL STATEMENTS
(In thousands, except per share amounts)
| NOTE 3. | LOANS (Continued) |
Allowance for Loans Losses (Continued)
| Real Estate | Commercial | Consumer | Total | |||||||||||||
| Loans: |
||||||||||||||||
| Ending balance – individually evaluated for impairment |
$ | 15,829 | $ | 583 | $ | 42 | $ | 16,454 | ||||||||
| Ending balance – collectively evaluated for impairment |
830,912 | 229,574 | 9,158 | 1,069,644 | ||||||||||||
| Ending balance – loans acquired with deteriorated credit quality |
1,363 | — | — | 1,363 | ||||||||||||
|
|
|
|
|
|
|
|
|
|||||||||
| Total ending balance |
$ | 848,104 | $ | 230,157 | $ | 9,200 | $ | 1,087,461 | ||||||||
|
|
|
|
|
|
|
|
|
|||||||||
| March 31, 2020 |
||||||||||||||||
| Allowance for loan losses: |
||||||||||||||||
| Balance, beginning of year |
$ | 7,254 | $ | 1,885 | $ | 126 | $ | 9,265 | ||||||||
| Provision for loan losses |
(1,875 | ) | 2,815 | (140 | ) | 800 | ||||||||||
| Loans charged off |
(48 | ) | — | (11 | ) | (59 | ) | |||||||||
| Recoveries of loans previously charged off |
2 | 112 | 79 | 193 | ||||||||||||
|
|
|
|
|
|
|
|
|
|||||||||
| Ending balance |
$ | 5,333 | $ | 4,812 | $ | 54 | $ | 10,199 | ||||||||
|
|
|
|
|
|
|
|
|
|||||||||
| Ending balance – individually evaluated for impairment |
$ | 35 | $ | 155 | $ | — | $ | 190 | ||||||||
| Ending balance – collectively evaluated for impairment |
5,296 | 4,656 | 52 | 10,004 | ||||||||||||
| Ending balance – loans acquired with deteriorated credit quality |
2 | 1 | 2 | 5 | ||||||||||||
|
|
|
|
|
|
|
|
|
|||||||||
| Total ending balance |
$ | 5,333 | $ | 4,812 | $ | 54 | $ | 10,199 | ||||||||
|
|
|
|
|
|
|
|
|
|||||||||
| Loans: |
||||||||||||||||
| Ending balance – individually evaluated for impairment |
$ | 4,645 | $ | 16,011 | $ | — | $ | 20,656 | ||||||||
| Ending balance – collectively evaluated for impairment |
717,496 | 138,386 | 11,064 | 866,946 | ||||||||||||
| Ending balance – loans acquired with deteriorated credit quality |
1,288 | 618 | 3 | 1,909 | ||||||||||||
|
|
|
|
|
|
|
|
|
|||||||||
| Total ending balance |
$ | 723,429 | $ | 155,015 | $ | 11,067 | $ | 889,511 | ||||||||
|
|
|
|
|
|
|
|
|
|||||||||
Impaired Loans
A loan held for investment is considered impaired when, based on current information and events, it is probable that we will be unable to collect all amounts due (both principal and interest) according to the terms of the loan agreement. The following tables detail our impaired loans, by portfolio class as of March 31, 2021 and December 31, 2020:
F-24
Table of Contents
NOTES TO UNAUDITED CONSOLIDATED FINANCIAL STATEMENTS
(In thousands, except per share amounts)
| NOTE 3. | LOANS (Continued) |
Impaired Loans (Continued)
| Recorded Investment |
Unpaid Principal Balance |
Related Allowance |
Average Recorded Investment |
|||||||||||||
| March 31, 2021 |
||||||||||||||||
| With no related allowance recorded: |
||||||||||||||||
| Real estate mortgages: |
||||||||||||||||
| Construction and development |
$ | 5,511 | $ | 5,511 | $ | $ | 5,511 | |||||||||
| Residential |
2,396 | 2,396 | — | 2,405 | ||||||||||||
| Commercial |
6,411 | 6,411 | — | 6,395 | ||||||||||||
| Commercial and industrial |
200 | 200 | — | 208 | ||||||||||||
| Consumer and other |
22 | 22 | — | 23 | ||||||||||||
|
|
|
|
|
|
|
|
|
|||||||||
| Total with no related allowance recorded |
14,540 | 14,540 | — | 14,542 | ||||||||||||
|
|
|
|
|
|
|
|
|
|||||||||
| With an allowance recorded: |
||||||||||||||||
| Real estate mortgages: |
||||||||||||||||
| Construction and development |
567 | 567 | 81 | 573 | ||||||||||||
| Residential |
800 | 871 | 166 | 804 | ||||||||||||
| Commercial |
1,507 | 1507 | 204 | 1,517 | ||||||||||||
| Commercial and industrial |
383 | 383 | 390 | 387 | ||||||||||||
| Consumer and other |
20 | 20 | 12 | 21 | ||||||||||||
|
|
|
|
|
|
|
|
|
|||||||||
| Total with an allowance recorded |
3,277 | 3,348 | 853 | 3,302 | ||||||||||||
|
|
|
|
|
|
|
|
|
|||||||||
| Total impaired loans: |
$ | 17,817 | $ | 17,888 | $ | 853 | $ | 17,844 | ||||||||
|
|
|
|
|
|
|
|
|
|||||||||
| December 31, 2020 |
||||||||||||||||
| With no related allowance recorded: |
||||||||||||||||
| Real estate mortgages: |
||||||||||||||||
| Construction and development |
$ | 977 | $ | 977 | $ | — | $ | 970 | ||||||||
| Residential |
1,537 | 1,537 | — | 1,669 | ||||||||||||
| Commercial |
5,117 | 5,117 | — | 5,425 | ||||||||||||
| Commercial and industrial |
65 | 65 | — | 91 | ||||||||||||
| Consumer and other |
22 | 22 | — | 24 | ||||||||||||
|
|
|
|
|
|
|
|
|
|||||||||
| Total with no related allowance recorded |
7,718 | 7,718 | — | 8,179 | ||||||||||||
|
|
|
|
|
|
|
|
|
|||||||||
| With an allowance recorded: |
||||||||||||||||
| Real estate mortgages: |
||||||||||||||||
| Construction and development |
644 | 644 | 106 | 668 | ||||||||||||
| Residential |
1,557 | 1,628 | 628 | 1,636 | ||||||||||||
| Commercial |
3,373 | 3,373 | 847 | 3,526 | ||||||||||||
| Commercial and industrial |
791 | 791 | 478 | 886 | ||||||||||||
| Consumer and other |
15 | 15 | 7 | 15 | ||||||||||||
|
|
|
|
|
|
|
|
|
|||||||||
| Total with an allowance recorded |
6,380 | 6,451 | 2,066 | 6,731 | ||||||||||||
|
|
|
|
|
|
|
|
|
|||||||||
| Total impaired loans: |
$ | 14,098 | $ | 14,169 | $ | 2,066 | $ | 14,910 | ||||||||
|
|
|
|
|
|
|
|
|
|||||||||
F-25
Table of Contents
NOTES TO UNAUDITED CONSOLIDATED FINANCIAL STATEMENTS
(In thousands, except per share amounts)
| NOTE 3. | LOANS (Continued) |
Impaired Loans (Continued)
A loan held for investment is considered impaired when, based on current information and events, it is probable that we will be unable to collect all amounts due (both principal and interest) according to the terms of the loan agreement. The following tables detail our income on impaired loans, by portfolio class as of March 31, 2021 and March 31, 2020:
| Recorded Investment |
Average Recorded Investment |
Interest Income Recognized |
||||||||||
| March 31, 2021 |
||||||||||||
| With no related allowance recorded: |
||||||||||||
| Real estate mortgages: |
||||||||||||
| Construction and development |
$ | 5,511 | $ | 5,511 | $ | 41 | ||||||
| Residential |
2,396 | 2,405 | 23 | |||||||||
| Commercial |
6,411 | 6,395 | 98 | |||||||||
| Commercial and industrial |
200 | 208 | 3 | |||||||||
| Consumer and other |
22 | 23 | — | |||||||||
|
|
|
|
|
|
|
|||||||
| Total with no related allowance recorded |
14,540 | 14,542 | 165 | |||||||||
|
|
|
|
|
|
|
|||||||
| With an allowance recorded: |
||||||||||||
| Real estate mortgages: |
||||||||||||
| Construction and development |
567 | 573 | 9 | |||||||||
| Residential |
800 | 804 | 11 | |||||||||
| Commercial |
1,507 | 1,517 | 22 | |||||||||
| Commercial and industrial |
383 | 387 | 5 | |||||||||
| Consumer and other |
20 | 21 | — | |||||||||
|
|
|
|
|
|
|
|||||||
| Total with an allowance recorded |
3,277 | 3,302 | 47 | |||||||||
|
|
|
|
|
|
|
|||||||
| Total impaired loans: |
$ | 17,817 | $ | 17,844 | $ | 212 | ||||||
|
|
|
|
|
|
|
|||||||
| March 31, 2020 |
||||||||||||
| With no related allowance recorded: |
||||||||||||
| Real estate mortgages: |
||||||||||||
| Construction and development |
$ | 1,974 | $ | 1,976 | $ | 7 | ||||||
| Residential |
2,710 | 2,727 | 36 | |||||||||
| Commercial |
775 | 778 | 7 | |||||||||
| Commercial and industrial |
15,750 | 15,770 | 99 | |||||||||
| Consumer and other |
— | — | — | |||||||||
|
|
|
|
|
|
|
|||||||
| Total with no related allowance recorded |
21,209 | 21,251 | 149 | |||||||||
|
|
|
|
|
|
|
|||||||
| With an allowance recorded: |
||||||||||||
| Real estate mortgages: |
||||||||||||
| Construction and development |
— | — | — | |||||||||
| Residential |
130 | 132 | 1 | |||||||||
| Commercial |
344 | 344 | 3 | |||||||||
| Commercial and industrial |
879 | 882 | 15 | |||||||||
| Consumer and other |
3 | 4 | — | |||||||||
|
|
|
|
|
|
|
|||||||
| Total with an allowance recorded |
1,356 | 1,362 | 19 | |||||||||
|
|
|
|
|
|
|
|||||||
| Total impaired loans: |
$ | 22,565 | $ | 22,613 | $ | 168 | ||||||
|
|
|
|
|
|
|
|||||||
F-26
Table of Contents
NOTES TO UNAUDITED CONSOLIDATED FINANCIAL STATEMENTS
(In thousands, except per share amounts)
| NOTE 4. | PREMISES AND EQUIPMENT |
Leases
The Company leases certain office facilities under long-term operating lease agreements. The leases expire at various dates through 2025 and some include renewal options. Many of these leases require the payment of property taxes, insurance premiums, maintenance, utilities and other costs. In many cases, rentals are subject to increase in relation to a cost-of-living index. The Company accounts for lease and non-lease components together as a single lease component. The Company determines if an arrangement is a lease at inception. The Company’s lease terms may include options to extend or terminate the lease when it is reasonably certain that the Company will exercise that option.
Future minimum lease payments on the leases described above, excluding any renewal options, are summarized as follows:
| April 1, 2021 – March 31, 2022 |
$ | 379 | ||
| April 1, 2022 – March 31, 2023 |
155 | |||
| April 1, 2023 – March 31, 2024 |
133 | |||
| April 1, 2024 – March 31, 2025 |
29 | |||
|
|
|
|||
| $ | 696 | |||
|
|
|
Rental expense included in the consolidated statements of income for the three months ended March 31, 2021 and March 31, 2020 is $121 and $120, respectively.
| NOTE 5. | DEPOSITS |
Major classifications of deposits are as follows:
| March 31, 2021 |
December 31, 2020 |
|||||||
| Noninterest-bearing transaction |
$ | 365,114 | $ | 290,867 | ||||
| Interest-bearing transaction |
519,991 | 475,757 | ||||||
| Savings |
46,495 | 42,731 | ||||||
| Time deposits, $250,000 and under |
296,042 | 293,707 | ||||||
| Time deposits, over $250,000 |
32,402 | 36,599 | ||||||
|
|
|
|
|
|||||
| $ | 1,260,044 | $ | 1,139,661 | |||||
|
|
|
|
|
|||||
Brokered deposits totaled approximately $39,151 at March 31, 20201 and $34,151 at December 31, 2020. The scheduled maturities of time deposits at March 31, 2021 are as follows:
| April 1, 2021 – March 31, 2022 |
$ | 258,650 | ||
| April 1, 2022 – March 31, 2023 |
42,191 | |||
| April 1, 2023 – March 31, 2024 |
8,651 | |||
| April 1, 2024 – March 31, 2025 |
15,350 | |||
| Thereafter |
3,602 | |||
|
|
|
|||
| $ 328,444 | ||||
|
|
|
|||
At March 31, 2021 and December 31, 2020, overdrawn transaction accounts reclassified to loans totaled $83 and $166, respectively.
Deposits from related parties held by the Company at March 31, 2021 and December 31, 2020 totaled $9,962 and $9,976, respectively.
F-27
Table of Contents
NOTES TO UNAUDITED CONSOLIDATED FINANCIAL STATEMENTS
(In thousands, except per share amounts)
| NOTE 6. | SUBORDINATED NOTES |
On June 23, 2016, the Company issued $4,500 of Fixed-to-Floating Rate Subordinated Notes due July 2026 (the “Notes”). The Notes will initially bear interest at 6.625% per annum, payable semi-annually in arrears on January 1 and July 1 of each year, commencing on January 1, 2017 until July 1, 2021. Thereafter and to, but excluding, the maturity date or earlier redemption, interest shall be payable quarterly in arrears, at an annual floating rate equal to three-month LIBOR as determined for the applicable quarterly period, plus 5.412%. The Company may, at its option, beginning on July 1, 2021 and on any scheduled interest payment date thereafter, redeem the Notes, in whole or in part, at a redemption price equal to the outstanding principal amount of the Notes to be redeemed plus accrued and unpaid interest to, but excluding, the date of redemption. Issuance costs related to the Notes totaled $79 and have been netted against the subordinated notes liability on the balance sheet. At March 31, 2021 and December 31, 2020, the remaining balance of the debt issuance cost was $3 and $7, respectively. The debt issuance costs are being amortized using the straight line method over sixty months and are recorded as a component of interest expense.
| NOTE 7. | DERIVATIVE INSTRUMENTS AND HEDGING ACTIVITIES |
Risk Management Objective of Using Derivatives
The Company is exposed to certain risk arising from both its business operations and economic conditions. The Company principally manages its exposures to a wide variety of business and operational risks through management of its core business activities. The Company manages economic risks, including interest rate, liquidity, and credit risk primarily by managing the amount, sources, and duration of its assets and liabilities and the use of derivative financial instruments. Specifically, the Company enters into derivative financial instruments to manage exposures that arise from business activities that result in the receipt or payment of future known and uncertain cash amounts, the value of which are determined by interest rates.
Non-designated Hedges
Derivatives not designated as hedges are not speculative and result from a service the Company provides to certain customers. The Company executes interest rate swaps with commercial banking customers to facilitate their respective risk management strategies. Those interest rate swaps are simultaneously hedged by offsetting derivatives that the Company executes with a third party, such that the Company minimizes its net risk exposure resulting from such transactions. As the interest rate derivatives associated with this program do not meet the strict hedge accounting requirements, changes in the fair value of both the customer derivatives and the offsetting derivatives are recognized directly in earnings.
Tabular Disclosure of Fair Values of Derivative Instruments on the Balance Sheet
The table below presents the fair value of the Company’s derivative financial instruments including the effects of offsetting as well as their classification on the consolidated balance sheets as of March 31, 2021 and December 31, 2020. As of March 31, 2021, the Company has posted cash collateral of $820. The amount of gain recognized in income on derivatives as a fair value adjustment and fee income, as of March 31, 2021, were $3 and $555, respectively.
F-28
Table of Contents
NOTES TO UNAUDITED CONSOLIDATED FINANCIAL STATEMENTS
(In thousands, except per share amounts)
| NOTE 7. | DERIVATIVE INSTRUMENTS AND HEDGING ACTIVITIES (Continued) |
Tabular Disclosure of Fair Values of Derivative Instruments on the Balance Sheet (Continued)
| March 31, 2021 | December 31, 2020 | |||||||||||||
| Derivatives not |
Notional |
Balance |
Fair |
Derivatives not |
Notional |
Balance |
Fair | |||||||
| Interest Rate Products |
$ 73,728 | Other Assets | $1,553 | Interest Rate Products | $49,664 | Other Assets | $ 983 | |||||||
| Interest Rate Products |
73,728 | Other Liabilities | (1,580) | Interest Rate Products | 49,664 | Other Liabilities | (1,013) | |||||||
Credit-risk-related Contingent Features
Applicable for OTC derivatives with dealers
The company has agreements with each of its derivative counterparties that contain a provision where if the Company defaults on any of its indebtedness, including default where repayment of the indebtedness has not been accelerated by the lender, then the company could also be declared in default on its derivative obligations.
The Company has agreements with certain of its derivative counterparties that contain a provision where if the company fails to maintain its status as a well / adequate capitalized institution, then the Company could be required to post additional collateral.
As of March 31, 2021, the fair value of derivatives in a net liability position, which includes accrued interest but excludes any adjustment for nonperformance risk, related to these agreements was $1,555. If the Company had breached any of these provisions at March 31, 2021, it could have been required to settle its obligations under the agreements at their termination value of $1,555, less the required collateral of $820.
| NOTE 8. | COMMITMENTS AND CONTINGENCIES |
Loan Commitments
The Company is a party to financial instruments with off-balance sheet risk in the normal course of business to meet the financing needs of its customers. These financial instruments include commitments to extend credit and standby letters of credit. Such commitments involve, to varying degrees, elements of credit risk and interest rate risk in excess of the amount recognized in the balance sheets. The majority of all commitments to extend credit and standby letters of credit are variable rate instruments.
The Company’s exposure to credit loss in the event of nonperformance by the other party to the financial instrument for commitments to extend credit is represented by the contractual amount of those instruments. The Company uses the same credit policies in making commitments as it does for on-balance sheet instruments. A summary of the Company’s commitments is as follows:
| March 31, 2021 |
December 31, 2020 |
|||||||
| Commitments to extend credit |
$ | 229,347 | $ | 181,925 | ||||
| Standby letters of credit |
3,566 | 2,814 | ||||||
|
|
|
|
|
|||||
| $ | 232,913 | $ | 184,739 | |||||
|
|
|
|
|
|||||
F-29
Table of Contents
NOTES TO UNAUDITED CONSOLIDATED FINANCIAL STATEMENTS
(In thousands, except per share amounts)
| NOTE 8. | COMMITMENTS AND CONTINGENCIES (Continued) |
Loan Commitments (Continued)
Commitments to extend credit are agreements to lend to a customer as long as there is no violation of any condition established in the contract. Commitments generally have fixed expiration dates or other termination clauses and may require payment of a fee. Since many of the commitments are expected to expire without being drawn upon, the total commitment amounts do not necessarily represent future cash requirements. The amount of collateral obtained, if deemed necessary by the Company upon extension of credit, is based on management’s credit evaluation of the customer. Collateral held varies, but may include accounts receivable, inventory, property and equipment, residential real estate, and income-producing commercial properties.
Standby letters of credit are conditional commitments issued by the Company to guarantee the performance of a customer to a third party. Those letters of credit are primarily issued to support public and private borrowing arrangements. The credit risk involved in issuing letters of credit is essentially the same as that involved in extending loans to customers. Collateral held varies and is required in instances which the Company deems necessary.
The Company has not been required to perform on any standby letters of credit, and the Company has not incurred any losses on financial standby letters of credit for the three months ended March 31, 2021 and March 31, 2020.
Contingencies
In the normal course of business, the Company is involved in various legal proceedings. In the opinion of management, any liability resulting from such proceedings would not have a material effect on the Company’s financial statements.
| NOTE 9. | CONCENTRATIONS OF CREDIT |
The Company originates primarily commercial, commercial real estate, residential real estate, and consumer loans to customers in Alabama and Georgia. The ability of the majority of the Company’s customers to honor their contractual loan obligations is dependent on the economy in these areas.
Seventy-eight percent of the Company’s loan portfolio is concentrated in real estate. A substantial portion of these loans are secured by real estate in the Company’s primary market area. In addition, a substantial portion of the other real estate owned is located in those same markets. Accordingly, the ultimate collectibility of the loan portfolio and the recovery of the carrying amount of the other real estate owned are susceptible to changes in market conditions in the Company’s primary market area. The other concentrations of credit by type of loan are set forth in Note 3.
The Company, according to regulatory restrictions, may not generally extend credit to any single borrower or group of related borrowers on a secured basis in excess of 20% of capital, as defined, or approximately $29,557 or on an unsecured basis in excess of 10% of capital, as defined, or approximately $14,778.
| NOTE 10. | STOCKHOLDERS’ EQUITY |
As of March 31, 2021, the Company had 7,716,428 shares of common stock issued and outstanding, of which 805,715 shares were non-voting.
As of December 31, 2020, the Company had 7,678,195 shares of common stock issued and outstanding, of which 805,715 shares were non-voting.
F-30
Table of Contents
NOTES TO UNAUDITED CONSOLIDATED FINANCIAL STATEMENTS
(In thousands, except per share amounts)
| NOTE 11. | REGULATORY MATTERS |
The Bank is subject to certain restrictions on the amount of dividends that may be declared without prior regulatory approval. At March 31, 2021, approximately $9,185 of retained earnings was available for dividend declaration without regulatory approval.
The Bank is also subject to various regulatory capital requirements administered by the federal banking agencies. Failure to meet minimum capital requirements can initiate certain mandatory, and possibly additional discretionary actions by regulators that, if undertaken, could have a direct material effect on the Bank’s financial statements. Under capital adequacy guidelines and the regulatory framework for prompt corrective action, the Bank must meet specific capital guidelines that involve quantitative measures of its assets, liabilities, and certain off-balance sheet items as calculated under regulatory accounting practices. Capital amounts and classification are also subject to qualitative judgments by the regulators about components, risk weightings, and other factors.
Quantitative measures established by regulation to ensure capital adequacy require the Bank to maintain minimum amounts and ratios of total capital, Tier 1 capital, and common equity Tier 1 capital to risk-weighted assets, and of Tier 1 capital to average assets. In addition, the Bank is subject to an institution-specific capital buffer, which must exceed 2.50% to avoid limitations on distributions and discretionary bonus payments. Management believes, as of March 31, 2021 and December 31, 2020, that the Bank meets all capital adequacy requirements to which it is subject.
As of March 31, 2021, the Company and the Bank believe they are each well capitalized on a consolidated basis for bank regulatory purposes as their respective capital ratios exceed minimum total Tier 1 and CET1 risk-based capital ratios and Tier 1 leverage capital ratios as set forth in the following table.
| Actual | For Capital Adequacy Purposes 1 |
Minimums To Be Well Capitalized Under Prompt Corrective Action |
||||||||||||||||||||||
| Amount | Ratio | Amount | Ratio | Amount | Ratio | |||||||||||||||||||
| March 31, 2021: |
||||||||||||||||||||||||
| Tier I Capital to Average Total Assets |
||||||||||||||||||||||||
| Company |
$ | 124,231 | 9.21 | % | $ | 53,938 | 4.00 | % | $ | N/A | N/A | |||||||||||||
| Bank |
$ | 136,185 | 10.10 | % | $ | 53,938 | 4.00 | % | $ | 67,422 | 5.00 | % | ||||||||||||
| CET1 Capital to Risk Weighted Assets |
||||||||||||||||||||||||
| Company |
$ | 124,231 | 10.19 | % | $ | 85,311 | 7.00 | % | $ | N/A | N/A | |||||||||||||
| Bank |
$ | 136,185 | 11.17 | % | $ | 85,311 | 7.00 | % | $ | 79,217 | 6.50 | % | ||||||||||||
| Tier I Capital to Risk Weighted Assets |
||||||||||||||||||||||||
| Company |
$ | 124,231 | 10.19 | % | $ | 103,591 | 8.50 | % | $ | N/A | N/A | |||||||||||||
| Bank |
$ | 136,185 | 11.17 | % | $ | 103,591 | 8.50 | % | $ | 97,498 | 8.00 | % | ||||||||||||
| Total Capital to Risk Weighted Assets |
||||||||||||||||||||||||
| Company |
$ | 141,336 | 11.60 | % | $ | 127,966 | 10.50 | % | $ | N/A | N/A | |||||||||||||
| Bank |
$ | 148,790 | 12.21 | % | $ | 127,966 | 10.50 | % | $ | 121,872 | 10.00 | % | ||||||||||||
| December 31, 2020: |
||||||||||||||||||||||||
| Tier I Capital to Average Total Assets |
||||||||||||||||||||||||
| Company |
$ | 118,837 | 9.24 | % | $ | 51,426 | 4.00 | % | $ | N/A | N/A | |||||||||||||
| Bank |
$ | 130,852 | 10.18 | % | $ | 51,426 | 4.00 | % | $ | 77,139 | 5.00 | % | ||||||||||||
| CET1 Capital to Risk Weighted Assets |
||||||||||||||||||||||||
| Company |
$ | 118,837 | 10.63 | % | $ | 78,257 | 7.00 | % | $ | N/A | N/A | |||||||||||||
| Bank |
$ | 130,852 | 11.70 | % | $ | 78,257 | 7.00 | % | $ | 72,667 | 6.50 | % | ||||||||||||
F-31
Table of Contents
NOTES TO UNAUDITED CONSOLIDATED FINANCIAL STATEMENTS
(In thousands, except per share amounts)
| NOTE 11. | REGULATORY MATTERS (Continued) |
| Actual | For Capital Adequacy Purposes 1 |
Minimums To Be Well Capitalized Under Prompt Corrective Action |
||||||||||||||||||||||
| Amount | Ratio | Amount | Ratio | Amount | Ratio | |||||||||||||||||||
| Tier I Capital to Risk Weighted Assets |
||||||||||||||||||||||||
| Company |
$ | 118,837 | 10.63 | % | $ | 95,026 | 8.50 | % | $ | N/A | N/A | |||||||||||||
| Bank |
$ | 130,852 | 11.70 | % | $ | 95,026 | 8.50 | % | $ | 89,436 | 8.00 | % | ||||||||||||
| Total Capital to Risk Weighted Assets |
||||||||||||||||||||||||
| Company |
$ | 135,196 | 12.09 | % | $ | 117,385 | 10.50 | % | $ | N/A | N/A | |||||||||||||
| Bank |
$ | 142,711 | 12.77 | % | $ | 117,385 | 10.50 | % | $ | 111,795 | 10.00 | % | ||||||||||||
| 1 | Includes the capital conservation buffer. |
| NOTE 12. | FAIR VALUE OF ASSETS AND LIABILITIES |
Determination of Fair Value
The Company uses fair value measurements to record fair value adjustments to certain assets and liabilities and to determine fair value disclosures. In accordance with the Fair Value Measurements and Disclosures topic (FASB ASC 820), the fair value of a financial instrument is the price that would be received to sell an asset or paid to transfer a liability in an orderly transaction between market participants at the measurement date. Fair value is best determined based upon quoted market prices. However, in many instances, there are no quoted market prices for the Company’s various financial instruments. In cases where quoted market prices are not available, fair values are based on estimates using present value or other valuation techniques. Those techniques are significantly affected by the assumptions used, including the discount rate and estimates of future cash flows. Accordingly, the fair value estimates may not be realized in an immediate settlement of the instrument.
The fair value guidance provides a consistent definition of fair value, which focuses on exit price in an orderly transaction (that is, not a forced liquidation or distressed sale) between market participants at the measurement date under current market conditions. If there has been a significant decrease in the volume and level of activity for the asset or liability, a change in valuation technique or the use of multiple valuation techniques may be appropriate. In such instances, determining the price at which willing market participants would transact at the measurement date under current market conditions depends on the facts and circumstances and requires the use of significant judgment. The fair value is a reasonable point within the range that is most representative of fair value under current market conditions.
Fair Value Hierarchy
In accordance with this guidance, the Company groups its financial assets and financial liabilities generally measured at fair value in three levels, based on the markets in which the assets and liabilities are traded and the reliability of the assumptions used to determine fair value.
Level 1—Valuation is based on quoted prices in active markets for identical assets or liabilities that the reporting entity has the ability to access at the measurement date. Level 1 assets and liabilities generally include debt and equity securities that are traded in an active exchange market. Valuations are obtained from readily available pricing sources for market transactions involving identical assets or liabilities.
F-32
Table of Contents
NOTES TO UNAUDITED CONSOLIDATED FINANCIAL STATEMENTS
(In thousands, except per share amounts)
| NOTE 12. | FAIR VALUE OF ASSETS AND LIABILITIES (Continued) |
Fair Value Hierarchy (Continued)
Level 2—Valuation is based on inputs other than quoted prices included within level 1 that are observable for the asset or liability, either directly or indirectly. The valuation may be based on quoted prices for similar assets or liabilities; quoted prices in markets that are not active; or other inputs that are observable or can be corroborated by observable market data for substantially the full term of the asset or liability.
Level 3—Valuation is based on unobservable inputs that are supported by little or no market activity and that are significant to the fair value of the assets or liabilities. Level 3 assets and liabilities include financial instruments whose value is determined using pricing models, discounted cash flow methodologies, or similar techniques, as well as instruments for which determination of fair value requires significant management judgment or estimation.
A financial instrument’s categorization within the valuation hierarchy is based upon the lowest level of input that is significant to the fair value measurement.
The following methods and assumptions were used by the Company in estimating fair value disclosures for financial instruments:
Cash and Cash Equivalents: The carrying amounts of cash and due from banks, interest-bearing deposits in banks, and federal funds sold make up cash and cash equivalents. The carrying amount of these short-term instruments approximate fair value.
Securities: Where quoted prices are available in an active market, management classifies the securities within level 1 of the valuation hierarchy. Level 1 securities include highly liquid government bonds and exchange-traded equities.
If quoted market prices are not available, management estimates fair values using pricing models and discounted cash flows that consider standard input factors such as observable market data, benchmark yields, interest rate volatilities, broker/dealer quotes, and credit spreads. Examples of such instruments, which would generally be classified within level 2 of the valuation hierarchy, include GSE obligations, and state and municipal securities. Mortgage-backed securities are included in level 2 if observable inputs are available. In certain cases where there is limited activity or less transparency around inputs to the valuation, those securities would be classified in level 3.
Other Equity Securities: The carrying amounts approximates fair value.
Restricted Equity Securities: The carrying amount of restricted equity securities with no readily determinable fair value approximates fair value based on the redemption provisions of the issuers which is cost.
Loans Held for Sale: The carrying amounts of loans held for sale approximates fair value.
Loans: The carrying amount of variable-rate loans that reprice frequently and have no significant change in credit risk approximates fair value. The fair values of fixed rate loans is estimated based on discounted contractual cash flows using interest rates currently being offered for loans with similar terms to borrowers with similar credit quality.
Bank Owned Life Insurance: The carrying amount of bank owned life insurance approximates fair value.
Annuities: The carrying amounts of annuities approximate their fair values.
Deposits: The fair values disclosed for transaction deposits are, by definition, equal to the amount payable on demand at the reporting date (that is, their carrying amounts). Fair values for fixed-rate
F-33
Table of Contents
NOTES TO UNAUDITED CONSOLIDATED FINANCIAL STATEMENTS
(In thousands, except per share amounts)
| NOTE 12. | FAIR VALUE OF ASSETS AND LIABILITIES (Continued) |
Fair Value Hierarchy (Continued)
certificates of deposit are estimated using a discounted cash flow calculation that applies market interest rates on comparable instruments to a schedule of aggregated expected monthly maturities on time deposits.
Other Borrowings: The fair value of fixed-rate other borrowings is based on discounted contractual cash flows using interest rates currently being offered for borrowings of similar maturities. The fair values of the Company’s variable-rate other borrowings approximate their carrying values.
Subordinated Notes: The carrying amounts of the subordinated notes approximate fair value.
Accrued Interest: The carrying amounts of accrued interest approximate fair value.
Trading Assets and Liabilities: The Company has derivative instruments in the form of interest rate swap agreements accounted for as trading assets and liabilities and carried at fair value. The fair value of these instruments is based on information obtained from a third party financial institution. The Company reflects these instruments within level 2 of the valuation hierarchy.
Off-Balance Sheet Credit-Related Instruments: Fair values for off-balance sheet, credit-related financial instruments are based on fees currently charged to enter into similar agreements, taking into account the remaining terms of the agreements and the counterparties’ credit standing.
Assets Measured at Fair Value on a Recurring Basis
The only assets and liabilities measured at fair value on a recurring basis are our securities available-for-sale and swaps. There were no transfers between levels during the period. Information related to the Company’s assets and liabilities measured at fair value on a recurring basis at March 31, 2021 and December 31, 2020 is as follows
| Fair Value Measurements At Reporting Date Using: | ||||||||||||||||
| Fair Value | Quoted Prices In Active Markets For Identical Assets (Level 1) |
Significant Other Observable Inputs (Level 2) |
Significant Unobservable Inputs (Level 3) |
|||||||||||||
| March 31, 2021: |
||||||||||||||||
| U.S. Treasury securities |
$ | 2,663 | $ | — | $ | 2,663 | $ | — | ||||||||
| U.S. Government sponsored Enterprises (GSEs) |
9,376 | — | 9,376 | — | ||||||||||||
| State and municipal securities |
58,984 | — | 58,984 | — | ||||||||||||
| Corporate debt securities |
9,184 | — | 9,184 | — | ||||||||||||
| Asset based securities |
9,105 | — | 9,105 | — | ||||||||||||
| Mortgage-backed GSE residential/multifamily |
16,905 | — | 16,905 | — | ||||||||||||
| Other equity securities |
4,995 | — | 4,995 | — | ||||||||||||
| Interest Rate Products - asset |
1,553 | — | 1,553 | — | ||||||||||||
| Interest Rate Products - liabilities |
(1,580 | ) | — | (1,580 | ) | — | ||||||||||
F-34
Table of Contents
NOTES TO UNAUDITED CONSOLIDATED FINANCIAL STATEMENTS
(In thousands, except per share amounts)
| NOTE 12. | FAIR VALUE OF ASSETS AND LIABILITIES (Continued) |
Assets Measured at Fair Value on a Recurring Basis (Continued)
| Fair Value Measurements At Reporting Date Using: | ||||||||||||||||
| Fair Value | Quoted Prices In Active Markets For Identical Assets (Level 1) |
Significant Other Observable Inputs (Level 2) |
Significant Unobservable Inputs (Level 3) |
|||||||||||||
| December 31, 2020: |
||||||||||||||||
| U.S. Treasury securities |
$ | — | $ | — | $ | — | $ | — | ||||||||
| U.S. Government sponsored Enterprises (GSEs) |
9,366 | — | 9,366 | — | ||||||||||||
| State and municipal securities |
67,941 | — | 67,941 | — | ||||||||||||
| Corporate debt securities |
8,469 | — | 8,469 | — | ||||||||||||
| Asset based securities |
9,111 | — | 9,111 | — | ||||||||||||
| Mortgage-backed GSE residential/multifamily |
19,114 | — | 19,114 | — | ||||||||||||
| Other equity securities |
5,017 | — | 5,017 | — | ||||||||||||
| Interest Rate Products - asset |
983 | — | 983 | — | ||||||||||||
| Interest Rate Products - liabilities |
(1,013 | ) | — | (1,013 | ) | — | ||||||||||
Assets Measured at Fair Value on a Nonrecurring Basis
Under certain circumstances management makes adjustments to fair value for assets and liabilities although they are not measured at fair value on an ongoing basis. The following table presents the financial instruments carried on the consolidated balance sheet by caption and by level in the fair value hierarchy at March 31, 2021 and December 31, 2020, for which a nonrecurring change in fair value has been recorded:
| Fair Value Measurements at Reporting Date Using | ||||||||||||||||
| Fair Value |
Quoted Prices in Active Markets for Identical Assets (Level 1) |
Significant Other Observable Inputs (Level 2) |
Significant Unobservable Inputs (Level 3) |
|||||||||||||
| March 31, 2021: |
||||||||||||||||
| Impaired loans |
$ | 2,657 | $ | — | $ | — | $ | 2,657 | ||||||||
| Foreclosed assets |
10,229 | — | — | 10,229 | ||||||||||||
|
|
|
|
|
|
|
|
|
|||||||||
| Total |
$ | 12,886 | $ | — | $ | — | $ | 12,886 | ||||||||
|
|
|
|
|
|
|
|
|
|||||||||
| Fair Value Measurements at Reporting Date Using | ||||||||||||||||
| Fair Value |
Quoted Prices in Active Markets for Identical Assets (Level 1) |
Significant Other Observable Inputs (Level 2) |
Significant Unobservable Inputs (Level 3) |
|||||||||||||
| December 31, 2020: |
||||||||||||||||
| Impaired loans |
$ | 4,392 | $ | — | $ | — | $ | 4,392 | ||||||||
| Foreclosed assets |
10,224 | — | — | 10,224 | ||||||||||||
|
|
|
|
|
|
|
|
|
|||||||||
| Total |
$ | 14,616 | $ | — | $ | — | $ | 14,616 | ||||||||
|
|
|
|
|
|
|
|
|
|||||||||
F-35
Table of Contents
NOTES TO UNAUDITED CONSOLIDATED FINANCIAL STATEMENTS
(In thousands, except per share amounts)
| NOTE 12. | FAIR VALUE OF ASSETS AND LIABILITIES (Continued) |
Assets Measured at Fair Value on a Nonrecurring Basis (Continued)
Impaired Loans
Loans considered impaired under ASC 310-10-35, Receivables, are loans for which, based on current information and events, it is probable that the Company will be unable to collect all principal and interest payments due in accordance with the contractual terms of the loan agreement. Impaired loans can be measured based on the present value of expected payments using the loan’s original effective rate as the discount rate, the loan’s observable market price, or the fair value of the collateral less estimated selling costs if the loan is collateral dependent.
The fair value of impaired loans were primarily measured based on the value of the collateral securing these loans. Impaired loans are classified within level 3 of the fair value hierarchy. Collateral may be real estate and/or business assets including equipment, inventory, and/or accounts receivable. The Company generally determines the value of real estate collateral based on independent appraisals performed by qualified licensed appraisers. These appraisals may utilize a single valuation approach or a combination of approaches including comparable sales and the income approach. Appraised values are discounted for estimated costs to sell and may be discounted further based on management’s historical knowledge, changes in market conditions from the date of the most recent appraisal, and/or management’s expertise and knowledge of the customer and the customer’s business. Such discounts by management are subjective and are typically significant unobservable inputs for determining fair value. Impaired loans are reviewed and evaluated on at least a quarterly basis for additional impairment and adjusted accordingly, based on the same factors discussed above.
Impaired loans, which are usually measured for impairment using the fair value of collateral, had a carrying amount of $17,817 and $14,098 with a specific valuation allowance of $853 and $2,066 at March 31, 2021 and December 31, 2020, respectively. Of the $17,817 and $14,098 impaired loan portfolio, $3,510 and $6,458 were carried at fair value as a result of charge offs, specific valuation allowances, and the fair market adjustments at March 31, 2021 and December 31, 2020, respectively. The remaining $14,307 and $7,640 was carried at cost, as the fair value of the collateral on these loans exceeded the book value for each individual credit at March 31, 2021 and December 31, 2020, respectively. Charge offs and changes in specific valuation allowances at March 31, 2021 and December 31, 2020 on impaired loans carried at fair value resulted in additional provision for loan losses of $682 and $1,828, respectively.
Foreclosed Assets
Foreclosed assets, consisting of properties/assets obtained through foreclosure or in satisfaction of loans, are initially recorded at fair value less estimated costs to sell upon transfer of the loans to foreclosed assets. Subsequently, foreclosed assets are carried at the lower of carrying value or fair value less estimated costs to sell. Fair values are generally based on third party appraisals of the property/assets and are classified within level 3 of the fair value hierarchy. The appraisals are sometimes further discounted based on management’s historical knowledge, and/or changes in market conditions from the date of the most recent appraisal, and/or management’s expertise and knowledge of the customer and the customer’s business. Such discounts are typically significant unobservable inputs for determining fair value. In cases where the carrying amount exceeds the fair value, less estimated costs to sell, a loss is recognized in noninterest expense.
F-36
Table of Contents
NOTES TO UNAUDITED CONSOLIDATED FINANCIAL STATEMENTS
(In thousands, except per share amounts)
| NOTE 12. | FAIR VALUE OF ASSETS AND LIABILITIES (Continued) |
Quantitative Disclosures for Level 3 Fair Value Measurements
The Company had no Level 3 assets measured at fair value on a recurring basis at March 31, 2021 or December 31, 2020.
For Level 3 assets measured at fair value on a non-recurring basis as of March 31, 2021, the significant unobservable inputs used in the fair value measurements are presented below.
| Carrying Amount |
Valuation Technique |
Significant Unobservable Input |
Weighted Average of Input |
|||||||||||
| Nonrecurring: |
||||||||||||||
| Impaired loans |
$ | 2,657 | Appraisal | Appraisal discounts (%) | 15-20 | % | ||||||||
| Foreclosed assets |
$ | 10,229 | Appraisal | Appraisal discounts (%) | 10-15 | % | ||||||||
For Level 3 assets measured at fair value on a non-recurring basis as of December 31, 2020, the significant unobservable inputs used in the fair value measurements are presented below.
| Carrying Amount |
Valuation Technique |
Significant Unobservable Input |
Weighted Average of Input |
|||||||||||
| Nonrecurring: |
||||||||||||||
| Impaired loans |
$ | 4,392 | Appraisal | Appraisal discounts (%) | 15-20 | % | ||||||||
| Foreclosed assets |
$ | 10,224 | Appraisal | Appraisal discounts (%) | 10-15 | % | ||||||||
Fair Value of Financial Instruments
The carrying amount and estimated fair value of the Company’s financial instruments were as follows:
| March 31, 2021 | ||||||||||||||||
| Estimated Fair Value | ||||||||||||||||
| Carrying Amount |
Level 1 | Level 2 | Level 3 | |||||||||||||
| Financial assets: |
||||||||||||||||
| Cash and cash equivalents |
$ | 170,728 | $ | 170,728 | $ | — | $ | — | ||||||||
| Securities available for sale |
106,217 | — | 106,217 | — | ||||||||||||
| Other equity securities |
4,995 | — | 4,995 | — | ||||||||||||
| Loans held for sale |
2,268 | — | 2,268 | — | ||||||||||||
| Trading assets |
1,553 | — | 1,553 | — | ||||||||||||
| Loans, net |
1,070,669 | — | 1,064,773 | 2,657 | ||||||||||||
| Bank owned life insurance |
22,583 | — | 22,583 | — | ||||||||||||
| Annuities |
12,920 | — | 12,903 | — | ||||||||||||
| Foreclosed assets |
10,229 | — | — | 10,229 | ||||||||||||
| Accrued interest receivable |
4,088 | — | 4,243 | — | ||||||||||||
| Restricted equity securities |
2,788 | — | — | 2,788 | ||||||||||||
| Financial liabilities: |
||||||||||||||||
| Deposits |
$ | 1,260,044 | $ | — | $ | 1,260,635 | $ | — | ||||||||
| Trading liabilities |
1,580 | — | 1,580 | — | ||||||||||||
| FHLB advances |
31,900 | — | 31,938 | — | ||||||||||||
| Other borrowings |
7,983 | — | 7,983 | — | ||||||||||||
| Subordinated notes |
4,497 | — | 4,493 | — | ||||||||||||
| Accrued interest payable |
274 | — | 274 | — | ||||||||||||
F-37
Table of Contents
NOTES TO UNAUDITED CONSOLIDATED FINANCIAL STATEMENTS
(In thousands, except per share amounts)
| NOTE 12. | FAIR VALUE OF ASSETS AND LIABILITIES (Continued) |
Fair Value of Financial Instruments (Continued)
| December 31, 2020 | ||||||||||||||||
| Estimated Fair Value | ||||||||||||||||
| Carrying Amount |
Level 1 | Level 2 | Level 3 | |||||||||||||
| Financial assets: |
||||||||||||||||
| Cash and cash equivalents |
$ | 84,907 | $ | 84,907 | $ | 84,907 | $ | — | ||||||||
| Securities available for sale |
114,001 | — | 114,001 | — | ||||||||||||
| Other equity securities |
5,017 | — | 5,017 | — | ||||||||||||
| Loans held for sale |
5,696 | — | 5,696 | — | ||||||||||||
| Trading assets |
938 | — | 983 | — | ||||||||||||
| Loans, net |
1,018,256 | — | 1,030,104 | 4,392 | ||||||||||||
| Bank owned life insurance |
22,458 | — | 22,458 | — | ||||||||||||
| Annuities |
12,920 | — | 12,903 | — | ||||||||||||
| Foreclosed assets |
10,224 | — | — | 10,224 | ||||||||||||
| Accrued interest receivable |
4,243 | — | 4,243 | — | ||||||||||||
| Restricted equity securities |
3,224 | — | — | 3,224 | ||||||||||||
| Financial liabilities: |
||||||||||||||||
| Deposits |
$ | 1,139,661 | — | $ | 1,140,979 | $ | — | |||||||||
| Trading liabilities |
1,013 | — | 1,013 | — | ||||||||||||
| FHLB advances |
30,900 | — | 30,962 | — | ||||||||||||
| Other borrowings |
7,975 | — | 7,975 | — | ||||||||||||
| Subordinated notes |
4,493 | — | 4,493 | — | ||||||||||||
| Accrued interest payable |
278 | — | 278 | — | ||||||||||||
| NOTE 13. | SUBSEQUENT EVENTS |
On May 17, 2021, the Company provided a notice of redemption to the holders of the Notes to redeem the Notes on June 23, 2021. The Company will borrow approximately $4.5 million under its line of credit from First Horizon Bank to redeem the Notes.
F-38
Table of Contents

REPORT OF INDEPENDENT REGISTERED PUBLIC ACCOUNTING FIRM
To the Board of Directors and Stockholders
Southern States Bancshares and Subsidiary
Anniston, Alabama
Opinion on the Financial Statements
We have audited the accompanying consolidated balance sheets of Southern States Bancshares, Inc. and Subsidiary (the “Company”) as of December 31, 2020 and 2019, and the related consolidated statements of income, comprehensive income, changes in stockholders’ equity, and cash flows for each of the years in the two-year period ended December 31, 2020, and the related notes (collectively referred to as the financial statements). In our opinion, the consolidated financial statements present fairly, in all material respects, the financial position of the Company as of December 31, 2020 and 2019, and the results of its operations and its cash flows for each of the years in the two-year period ended December 31, 2020, in conformity with accounting principles generally accepted in the United States of America.
Basis for Opinion
These financial statements are the responsibility of the Company’s management. Our responsibility is to express an opinion on the Company’s financial statements based on our audits. We are a public accounting firm registered with the Public Company Accounting Oversight Board (United States) (PCAOB) and are required to be independent with respect to the Company in accordance with the U.S. federal securities laws and the applicable rules and regulations of the Securities and Exchange Commission and the PCAOB.
We conducted our audits in accordance with the standards of the PCAOB. Those standards require that we plan and perform the audit to obtain reasonable assurance about whether the financial statements are free of material misstatement, whether due to error or fraud. The Company is not required to have, nor were we engaged to perform, an audit of its internal control over financial reporting. As part of our audits, we are required to obtain an understanding of internal control over financial reporting, but not for the purpose of expressing an opinion on the effectiveness of the Company’s internal control over financial reporting. Accordingly, we express no such opinion.
Our audits included performing procedures to assess the risks of material misstatement of the financial statements, whether due to error or fraud, and performing procedures that respond to those risks. Such procedures included examining, on a test basis, evidence regarding the amounts and disclosures in the financial statements. Our audits also included evaluating the accounting principles used and significant estimates made by management, as well as evaluating the overall presentation of the financial statements. We believe that our audits provide a reasonable basis for our opinion.
2000 SOUTHBRIDGE PARKWAY, SUITE 501 • BIRMINGHAM, AL 35209 • 205-445-2880 • 888-277-0020 • FAX 205-445-2940 • www.mjcpa.com
Members of The American Institute of Certified Public Accountants
F-39
Table of Contents
Other Matters
We have also audited, in accordance with auditing standards generally accepted in the United States of America, the Company’s internal control over financial reporting as of December 31, 2020, based on criteria established in Internal Control – Integrated Framework issued by the Committee of Sponsoring Organizations of the Treadway Commission (COSO) in 2013, and our report dated March 12, 2021 expressed an unqualified opinion on the effectiveness of the Company’s internal control over financial reporting.
We have served as the Company’s auditor since 2007.
Birmingham, Alabama
March 12, 2021
2000 SOUTHBRIDGE PARKWAY, SUITE 501 • BIRMINGHAM, AL 35209 • 205-445-2880 • 888-277-0020 • FAX 205-445-2940 • www.mjcpa.com
Members of The American Institute of Certified Public Accountants
F-40
Table of Contents
SOUTHERN STATES BANCSHARES, INC.
AND SUBSIDIARY
(In thousands, except per share amounts)
CONSOLIDATED BALANCE SHEETS
DECEMBER 31, 2020 AND 2019
| 2020 | 2019 | |||||||
| Assets |
||||||||
| Cash and due from banks |
$ | 23,229 | 13,545 | |||||
| Interest-bearing deposits in banks |
51,503 | 77,574 | ||||||
| Federal funds sold |
10,175 | 24,116 | ||||||
|
|
|
|
|
|||||
| Total cash and cash equivalents |
84,907 | 115,235 | ||||||
| Securities available for sale |
114,001 | 59,947 | ||||||
| Other equity securities, at fair value |
5,017 | — | ||||||
| Restricted equity securities, at cost |
3,224 | 2,022 | ||||||
| Loans held for sale |
5,696 | 2,578 | ||||||
| Loans, net of unearned income |
1,030,115 | 837,441 | ||||||
| Less allowance for loan losses |
11,859 | 9,265 | ||||||
|
|
|
|
|
|||||
| Loans, net |
1,018,256 | 828,176 | ||||||
| Premises and equipment, net |
24,426 | 20,126 | ||||||
| Accrued interest receivable |
4,243 | 2,986 | ||||||
| Bank owned life insurance |
22,458 | 22,078 | ||||||
| Annuities |
12,903 | 12,903 | ||||||
| Foreclosed assets |
10,224 | 7,042 | ||||||
| Goodwill |
16,862 | 16,862 | ||||||
| Core deposit intangible |
1,764 | 2,027 | ||||||
| Other assets |
8,525 | 3,509 | ||||||
|
|
|
|
|
|||||
| Total assets |
$ | 1,332,506 | 1,095,491 | |||||
|
|
|
|
|
|||||
| Liabilities and Stockholders' Equity |
||||||||
| Liabilities: |
||||||||
| Deposits: |
||||||||
| Noninterest-bearing |
$ | 290,867 | 188,270 | |||||
| Interest-bearing |
848,794 | 762,243 | ||||||
|
|
|
|
|
|||||
| Total deposits |
1,139,661 | 950,513 | ||||||
| Other borrowings |
7,975 | 7,984 | ||||||
| FHLB Advances |
30,900 | — | ||||||
| Subordinated notes |
4,493 | 4,478 | ||||||
| Accrued interest payable |
278 | 473 | ||||||
| Other liabilities |
8,543 | 5,406 | ||||||
|
|
|
|
|
|||||
| Total liabilities |
1,191,850 | 968,854 | ||||||
|
|
|
|
|
|||||
| Commitments and contingencies: |
||||||||
| Stockholders' equity: |
||||||||
| Preferred stock, $0.01 par value; 1,000,000 shares authorized 0 shares issued and outstanding at December 31, 2020 and 2019, respectively |
— | — | ||||||
| Common stock, $5 par value, 15,000,000 shares authorized; 7,678,195 and 7,650,772 shares issued and outstanding at December 31, 2020 and 2019, respectively |
38,391 | 38,254 | ||||||
| Capital surplus |
65,327 | 64,592 | ||||||
| Retained earnings |
34,183 | 23,918 | ||||||
| Accumulated other comprehensive income |
3,194 | 265 | ||||||
| Unvested restricted stock |
(439 | ) | (392 | ) | ||||
|
|
|
|
|
|||||
| Total stockholders' equity |
140,656 | 126,637 | ||||||
|
|
|
|
|
|||||
| Total liabilities and stockholders' equity |
$ | 1,332,506 | 1,095,491 | |||||
|
|
|
|
|
|||||
See Notes to Consolidated Financial Statements.
F-41
Table of Contents
SOUTHERN STATES BANCSHARES, INC.
AND SUBSIDIARY
(In thousands, except per share amounts)
CONSOLIDATED STATEMENTS OF INCOME
YEARS ENDED DECEMBER 31, 2020 AND 2019
| 2020 | 2019 | |||||||
| Interest income: |
||||||||
| Loans, including fees |
$ | 47,786 | $ | 43,171 | ||||
| Taxable securities |
1,317 | 718 | ||||||
| Nontaxable securities |
643 | 619 | ||||||
| Other interest and dividends |
539 | 2,447 | ||||||
|
|
|
|
|
|||||
| Total interest income |
50,285 | 46,955 | ||||||
|
|
|
|
|
|||||
| Interest expense: |
||||||||
| Deposits |
7,854 | 11,620 | ||||||
| Other borrowings |
854 | 486 | ||||||
|
|
|
|
|
|||||
| Total interest expense |
8,708 | 12,106 | ||||||
|
|
|
|
|
|||||
| Net interest income |
41,577 | 34,849 | ||||||
| Provision for loan losses |
3,300 | 5,700 | ||||||
|
|
|
|
|
|||||
| Net interest income after provision for loan losses |
38,277 | 29,149 | ||||||
|
|
|
|
|
|||||
| Noninterest income: |
||||||||
| Service charges on deposit accounts |
1,458 | 1,535 | ||||||
| SWAP fees |
1,405 | — | ||||||
| SBA fees |
756 | 929 | ||||||
| Mortgage origination fees |
1,529 | 909 | ||||||
| Net gain on sale of securities |
742 | 14 | ||||||
| Other operating income |
2,651 | 3,323 | ||||||
|
|
|
|
|
|||||
| Total noninterest income |
8,541 | 6,710 | ||||||
|
|
|
|
|
|||||
| Noninterest expenses: |
||||||||
| Salaries and employee benefits |
18,765 | 14,942 | ||||||
| Equipment and occupancy expenses |
3,682 | 2,537 | ||||||
| Acquisition related expenses |
— | 3,373 | ||||||
| Data processing fees |
1,729 | 1,175 | ||||||
| Regulatory assessments |
775 | 240 | ||||||
| Other operating expenses |
7,234 | 5,504 | ||||||
|
|
|
|
|
|||||
| Total noninterest expenses |
32,185 | 27,771 | ||||||
|
|
|
|
|
|||||
| Income before income taxes |
14,633 | 8,088 | ||||||
| Income tax expense |
2,526 | 2,486 | ||||||
|
|
|
|
|
|||||
| Net income |
$ | 12,107 | $ | 5,602 | ||||
|
|
|
|
|
|||||
| Basic earnings per share |
$ | 1.58 | $ | 0.82 | ||||
|
|
|
|
|
|||||
| Diluted earnings per share |
$ | 1.56 | $ | 0.81 | ||||
|
|
|
|
|
|||||
See Notes to Consolidated Financial Statements.
F-42
Table of Contents
SOUTHERN STATES BANCSHARES, INC.
AND SUBSIDIARY
(In thousands, except per share amounts)
CONSOLIDATED STATEMENTS OF COMPREHENSIVE INCOME
YEARS ENDED DECEMBER 31, 2020 AND 2019
| 2020 | 2019 | |||||||
| Net income |
$ | 12,107 | $ | 5,602 | ||||
|
|
|
|
|
|||||
| Other comprehensive income (loss): |
||||||||
| Unrealized holding gains on securities available for sale arising during the period, net of tax of $1,222 and $531, respectively |
3,478 | 1,511 | ||||||
| Reclassification adjustment for gains on securities available for sale realized in net income, net of tax of $193 and $4, respectively |
(549 | ) | (10 | ) | ||||
|
|
|
|
|
|||||
| Other comprehensive income |
2,929 | 1,501 | ||||||
|
|
|
|
|
|||||
| Comprehensive income |
$ | 15,036 | $ | 7,103 | ||||
|
|
|
|
|
|||||
See Notes to Consolidated Financial Statements.
F-43
Table of Contents
SOUTHERN STATES BANCSHARES, INC.
AND SUBSIDIARY
(In thousands, except per share amounts)
CONSOLIDATED STATEMENTS OF STOCKHOLDERS' EQUITY
YEARS ENDED DECEMBER 31, 2020 AND 2019
| Preferred Stock | Common Stock | Capital Surplus |
Retained Earnings |
Accumulated Other Comprehensive Income (Loss) |
Unvested Restricted Stock |
Total Stockholders' Equity |
||||||||||||||||||||||||||||||
| Shares | Par Value | Shares | Par Value | |||||||||||||||||||||||||||||||||
| Balance, December 31, 2018 |
— | $ | — | 6,483,183 | 32,416 | 43,735 | 20,688 | (1,236 | ) | (128 | ) | $ | 95,475 | |||||||||||||||||||||||
| Net income |
— | — | — | — | — | 5,602 | — | — | 5,602 | |||||||||||||||||||||||||||
| Issuance of common stock—acquisition |
— | — | 1,142,846 | 5,714 | 20,285 | — | — | — | 25,999 | |||||||||||||||||||||||||||
| Issuance of restricted stock |
— | — | 24,809 | 124 | 353 | — | — | (477 | ) | — | ||||||||||||||||||||||||||
| Forfeiture of restricted stock |
— | — | (66 | ) | — | (1 | ) | — | — | 1 | — | |||||||||||||||||||||||||
| Stock-based compensation |
— | — | — | — | 220 | — | — | 212 | 432 | |||||||||||||||||||||||||||
| Common stock dividends paid |
— | — | — | (2,372 | ) | — | — | (2,372 | ) | |||||||||||||||||||||||||||
| Other comprehensive income |
— | — | — | — | — | — | 1,501 | — | 1,501 | |||||||||||||||||||||||||||
|
|
|
|
|
|
|
|
|
|
|
|
|
|
|
|
|
|
|
|||||||||||||||||||
| Balance, December 31, 2019 |
— | — | 7,650,772 | 38,254 | 64,592 | 23,918 | 265 | (392 | ) | 126,637 | ||||||||||||||||||||||||||
| Net income |
— | — | — | — | — | 12,107 | — | — | 12,107 | |||||||||||||||||||||||||||
| Issuance of common stock |
— | — | 3,822 | 19 | 57 | — | — | — | 76 | |||||||||||||||||||||||||||
| Exercise of common stock options |
1,000 | 5 | 5 | 10 | ||||||||||||||||||||||||||||||||
| Issuance of restricted stock |
— | — | 22,869 | 114 | 328 | — | — | (442 | ) | — | ||||||||||||||||||||||||||
| Forfeiture of restricted stock |
— | — | (268 | ) | (1 | ) | (4 | ) | — | — | 5 | — | ||||||||||||||||||||||||
| Stock-based compensation |
— | — | — | — | 349 | — | — | 390 | 739 | |||||||||||||||||||||||||||
| Common stock dividends paid |
— | — | — | — | — | (1,842 | ) | — | — | (1,842 | ) | |||||||||||||||||||||||||
| Other comprehensive income |
— | — | — | — | — | — | 2,929 | — | 2,929 | |||||||||||||||||||||||||||
|
|
|
|
|
|
|
|
|
|
|
|
|
|
|
|
|
|
|
|||||||||||||||||||
| Balance, December 31, 2020 |
— | $ | — | 7,678,195 | $ | 38,391 | $ | 65,327 | $ | 34,183 | $ | 3,194 | $ | (439 | ) | $ | 140,656 | |||||||||||||||||||
|
|
|
|
|
|
|
|
|
|
|
|
|
|
|
|
|
|
|
|||||||||||||||||||
See Notes to Consolidated Financial Statements.
F-44
Table of Contents
SOUTHERN STATES BANCSHARES, INC.
AND SUBSIDIARY
(In thousands, except per share amounts)
CONSOLIDATED STATEMENTS OF CASH FLOWS
YEARS ENDED DECEMBER 31, 2020 AND 2019
| 2020 | 2019 | |||||||
| OPERATING ACTIVITIES |
||||||||
| Net income |
$ | 12,107 | $ | 5,602 | ||||
| Adjustments to reconcile net income to net cash provided by operating activities: |
||||||||
| Depreciation and software amortization |
1,956 | 1,135 | ||||||
| Net (gain) loss on sale of securities available for sale |
(742 | ) | (14 | ) | ||||
| Net amortization of securities |
605 | 507 | ||||||
| Amortization of core deposit intangible |
264 | 157 | ||||||
| Provision for loan losses |
3,300 | 5,700 | ||||||
| Deferred income taxes |
(1,587 | ) | (206 | ) | ||||
| Gain on sale of foreclosed assets |
(76 | ) | (62 | ) | ||||
| Write-down of foreclosed assets |
920 | 14 | ||||||
| Loss on sale of premises, equipment and software |
15 | — | ||||||
| Stock-based compensation |
739 | 432 | ||||||
| Net increase in loans held for sale |
(3,118 | ) | (2,345 | ) | ||||
| Income from bank owned life insurance |
(528 | ) | (470 | ) | ||||
| (Increase) decrease in interest receivable |
(1,256 | ) | 745 | |||||
| Increase (decrease) in interest payable |
(195 | ) | 79 | |||||
| Net other operating activities |
(950 | ) | (253 | ) | ||||
|
|
|
|
|
|||||
| Net cash provided by operating activities |
11,454 | 11,021 | ||||||
|
|
|
|
|
|||||
| INVESTING ACTIVITIES |
||||||||
| Purchase of securities available for sale |
(85,255 | ) | (23,499 | ) | ||||
| Proceeds from sale of securities available for sale |
26,185 | 95,099 | ||||||
| Proceeds from maturities, calls, and paydowns of securities available for sale |
9,111 | 5,378 | ||||||
| Net redemption of restricted equity securities |
(1,213 | ) | 97 | |||||
| Purchase of other equity securities |
(5,007 | ) | — | |||||
| Purchase of annuity contracts |
— | (2,500 | ) | |||||
| Purchase of bank owned life insurance contracts |
— | (4,250 | ) | |||||
| Net increase in loans |
(199,324 | ) | (27,794 | ) | ||||
| Proceeds from sale of foreclosed assets |
1,554 | 199 | ||||||
| Proceeds from bank owned life insurance |
148 | — | ||||||
| Cash paid in acquisition |
— | (4,951 | ) | |||||
| Proceeds from sale of premises, equipment and software |
376 | — | ||||||
| Purchase of premises, equipment and software |
(6,648 | ) | (1,394 | ) | ||||
|
|
|
|
|
|||||
| Net cash provided by (used in) investing activities |
(260,073 | ) | 36,385 | |||||
|
|
|
|
|
|||||
| FINANCING ACTIVITIES |
||||||||
| Net increase (decrease) in deposits |
189,147 | (16,711 | ) | |||||
| Proceeds from issuance of common stock |
86 | — | ||||||
| Net proceeds of other borrowings |
42,650 | 7,984 | ||||||
| Repayment of other borrowings |
(11,750 | ) | (7,500 | ) | ||||
| Common stock dividends paid |
(1,842 | ) | (2,372 | ) | ||||
|
|
|
|
|
|||||
| Net cash provided by (used in) financing activities |
218,291 | (18,599 | ) | |||||
|
|
|
|
|
|||||
| Net increase (decrease) in cash and cash equivalents |
(30,328 | ) | 28,807 | |||||
| Cash and cash equivalents at beginning of year |
115,235 | 86,428 | ||||||
|
|
|
|
|
|||||
| Cash and cash equivalents at end of year |
$ | 84,907 | $ | 115,235 | ||||
|
|
|
|
|
|||||
| SUPPLEMENTAL DISCLOSURE |
||||||||
| Cash paid during the year for: |
||||||||
| Interest |
$ | 8,903 | $ | 12,027 | ||||
| Income Taxes |
$ | 4,304 | $ | 3,194 | ||||
| NONCASH TRANSACTIONS |
||||||||
| Transfers of loans to foreclosed assets |
$ | 10,300 | $ | 6,624 | ||||
| Internally financed sale of foreclosed assets |
$ | 4,356 | $ | — | ||||
See Notes to Consolidated Financial Statements.
F-45
Table of Contents
SOUTHERN STATES BANCSHARES, INC.
AND SUBSIDIARY
NOTES TO CONSOLIDATED FINANCIAL STATEMENTS
(In thousands, except per share amounts)
| NOTE 1. | SUMMARY OF SIGNIFICANT ACCOUNTING POLICIES |
Nature of Business
Southern States Bancshares, Inc. (the “Company”) is a bank holding company whose principal activity is the ownership and management of its wholly-owned subsidiary, Southern States Bank (the “Bank”). The Bank is a commercial bank headquartered in Anniston, Calhoun County, Alabama. The Bank also operates branch offices in Birmingham, Opelika, Auburn, Huntsville, Sylacauga, Wedowee, Ranburne, Roanoke, Heflin, Alabama as well as Columbus, Carrollton, Dallas, and Newnan, Georgia. The Bank also has an LPO office located in Atlanta, Georgia. The Bank provides a full range of banking services in its primary market areas and the surrounding areas.
On September 13, 2019, the Company completed the acquisition of Wedowee, Alabama based East Alabama Financial Group, Inc, the holding company for Small Town Bank (STB) for $ 50 million in cash and stock (the “merger”). Upon closing of the transaction, Small Town Bank merged into Southern States Bank. See Note 2 for additional discussion.
Basis of Presentation and Accounting Estimates
The consolidated financial statements include the accounts of the Company and its subsidiary. Significant intercompany transactions and balances have been eliminated in consolidation.
In preparing the consolidated financial statements in conformity with accounting principles generally accepted in the United States of America, management is required to make estimates and assumptions that affect the reported amounts of assets and liabilities and the disclosure of contingent assets and liabilities as of the balance sheet date and the reported amounts of revenues and expenses during the reporting period. Actual results could differ from those estimates.
Material estimates that are particularly susceptible to significant change in the near term relate to the determination of the allowance for loan losses, the valuation of other real estate owned, financial instruments, deferred taxes, and other-than-temporary impairment of securities. In connection with the determination of the estimated losses on loans and the valuation of other real estate owned, management obtains independent appraisals for significant collateral.
The determination of the adequacy of the allowance for loan losses is based on estimates that are particularly susceptible to significant changes in the economic environment and market conditions.
The Company’s loans are generally secured by specific items of collateral including real property, consumer assets, and business assets. Although the Company has a diversified loan portfolio, a substantial portion of its borrowers’ ability to honor their contracts is dependent on local economic conditions.
While management uses available information to recognize losses on loans, further reductions in the carrying amounts of loans may be necessary based on changes in local economic conditions.
In addition, regulatory agencies, as an integral part of their examination process, periodically review the estimated losses on loans. Such agencies may require the Company to recognize additional losses based on their judgments about information available to them at the time of their examination. Because of these factors, it is reasonably possible that the estimated losses on loans may change materially in the near term. However, the amount of the change that is reasonably possible cannot be estimated.
The Company has evaluated all transactions, events, and circumstances for consideration or disclosure through March 12, 2021, the date these financial statements were available to be issued, and has reflected or disclosed those items within the consolidated financial statements and related footnotes as deemed appropriate.
F-46
Table of Contents
NOTES TO CONSOLIDATED FINANCIAL STATEMENTS
(In thousands, except per share amounts)
| NOTE 1. | SUMMARY OF SIGNIFICANT ACCOUNTING POLICIES (Continued) |
Cash, Cash Equivalents and Cash Flows
For purposes of reporting cash flows, cash and cash equivalents includes cash on hand, cash items in process of collection, amounts due from banks, interest-bearing deposits in banks and federal funds sold. Cash flows from loans held for sale, loans, restricted equity securities, and deposits are reported net.
The Company maintains amounts due from banks which, at times, may exceed federally insured limits. The Company has not experienced any losses in such accounts.
The Bank is required to maintain reserve balances in cash or on deposit with a correspondent bank for the Federal Reserve Bank, based on a percentage of deposits. The total of those reserve balances was approximately $0 at December 31, 2020 and 2019.
Securities
All securities are classified as “available for sale” and recorded at fair value, with unrealized gains and losses excluded from earnings and reported in other comprehensive income (loss). Purchase premiums and discounts are recognized in interest income using the interest method over the terms of the securities. Gains and losses on the sale of securities are recorded on the trade date and are determined using the specific identification method.
The Company evaluates investment securities for other-than-temporary impairment (OTTI) using relevant accounting guidance on a regular basis. Consideration is given to (1) the length of time and the extent to which the fair value has been less than cost, (2) the financial condition and near term prospects of the issuer including an evaluation of credit ratings, (3) the impact of changes in market interest rates, (4) the intent of the Company to sell a security, and (5) whether it is more likely than not the Company will have to sell the security before recovery of its cost basis. If the Company intends to sell an impaired security, or if it is more likely than not the Company will have to sell the security before recovery of its cost basis, the Company records an other-than-temporary loss in an amount equal to the entire difference between fair value and amortized cost. Otherwise, only the credit portion of the estimated loss is recognized in earnings, with the other portion of the loss is recognized in other comprehensive income (loss).
Other Equity Securities
The Bank adopted Accounting Standards Update (ASU) No. 2016-01, Financial Instruments – Overall (Subtopic 825-10) as of January 1, 2019. The main provisions of this update are to eliminate the available- for-sale classification of accounting for equity securities and to adjust the fair value disclosures for financial instruments carried at amortized costs such that the disclosed fair values represent an exit price as opposed to an entry price. The provisions of this update require that equity securities be carried at fair market value on the balance sheet and any periodic changes in market value are adjustments to the income statement. The remaining requirements of this update did not have a material impact on the financial position, results of operations, or cash flows.
The mutual fund owned by the Bank is classified as an equity security, and subsequent to the adoption of ASU 2016-01, it is carried at fair value with any periodic changes in value recorded through the income statement. Prior to the adoption of this standard, equity securities were included in available-for-sale securities.
F-47
Table of Contents
NOTES TO CONSOLIDATED FINANCIAL STATEMENTS
(In thousands, except per share amounts)
| NOTE 1. | SUMMARY OF SIGNIFICANT ACCOUNTING POLICIES (Continued) |
Restricted Equity Securities
Restricted equity securities are investments that are restricted in marketability. The Company, as a member of the Federal Home Loan Bank (FHLB) system, is required to maintain an investment in capital stock of the FHLB based upon its assets or outstanding advances. The Company has also purchased stock in First National Banker’s Bankshares, Inc. (FNBB), and Pacific Coast Banker’s Bank (PCBB), both correspondent banks.
Loans Held For Sale
Loans originated and intended for sale in the secondary market are carried at the lower of cost or fair value (LOCOM). For loans carried at LOCOM, gains and losses on loan sales (sales proceeds minus carrying value) are recorded in noninterest income, and direct loan origination costs and fees are deferred at origination of the loan and are recognized in noninterest income upon sale of the loan. The estimated fair value of loans held for sale is based on independent third party quoted prices.
Loans
Loans that management has the intent and ability to hold for the foreseeable future or until maturity or pay-off are reported at their outstanding principal balances less deferred fees and costs on originated loans and the allowance for loan losses. Interest income is accrued on the outstanding principal balance. Loan origination fees, net of certain direct origination costs, are deferred and recognized as an adjustment of the related loan yield over the life of the loan, using the straight line method without anticipating prepayments.
The accrual of interest on loans is discontinued when, in management’s opinion, the borrower may be unable to meet payments as they become due, or at the time the loan is 90 days past due, unless the loan is well-secured and in the process of collection. In all cases, loans are placed on nonaccrual or charged off at an earlier date if collection of principal and interest is considered doubtful. All interest accrued but not collected for loans that are placed on nonaccrual or charged off is reversed against interest income or charged to the allowance; unless management believes that the accrual of interest is recoverable through the liquidation of collateral. Interest income on nonaccrual loans is recognized on the cash basis, until the loans are returned to accrual status. Loans are returned to accrual status when all the principal and interest amounts contractually due are brought current and the loan has been performing according to the contractual terms generally for a period of not less than six months.
Certain Purchased Loans
Purchased loans are recorded at their fair value at the acquisition date. Credit discounts are included in the determination of fair value; therefore, an allowance for loan losses is not recorded at the acquisition date. Acquired loans are evaluated upon acquisition and classified as either purchased impaired or purchased non-impaired. Purchased impaired loans reflect credit deterioration since origination such that it is probable at acquisition that the Company will be unable to collect all contractually required payments. The purchased impaired loans acquired are subject to the Company’s internal and external credit review and monitoring. If credit deterioration is experienced subsequent to the initial acquisition fair value amount, such deterioration will be measured, and a provision for credit losses will be charged to earnings.
Such purchased loans are accounted for individually. The Company estimates the amount and timing of expected cash flows for each purchased loan, and the expected cash flows in excess of the amount
F-48
Table of Contents
NOTES TO CONSOLIDATED FINANCIAL STATEMENTS
(In thousands, except per share amounts)
| NOTE 1. | SUMMARY OF SIGNIFICANT ACCOUNTING POLICIES (Continued) |
Certain Purchased Loans (Continued)
paid is recorded as interest income over the remaining life of the loan or pool (accretable yield). The excess of the loan’s contractual principal and interest over expected cash flows is not recorded (nonaccretable difference). Over the life of the loan, expected cash flows will continue to be estimated. If the present value of expected cash flows is less than the carrying amount, a loss is recorded. If the present value of expected cash flows is greater than the carrying amount, it is recognized as part of future interest income. Purchased impaired loans at the time of acquisition are accounted for under ASC 310-30.
Purchased non-impaired loans are accounted for under ASC 310-20, with the difference between the fair value and unpaid principal balance of the loan at the acquisition date amortized or accreted to interest income over the estimated life of the loans.
Allowance for Loan Losses
The allowance for loan losses is established as losses are estimated to have occurred through a provision for loan losses charged to expense. Loan losses are charged against the allowance when management believes the uncollectibility of a loan balance is confirmed. Confirmed losses are charged off immediately. Subsequent recoveries, if any, are credited to the allowance.
The allowance is an amount that management believes will be adequate to absorb estimated losses relating to specifically identified loans, as well as probable credit losses inherent in the balance of the loan portfolio. The allowance for loan losses is evaluated on a regular basis by management and is based upon management’s periodic review of the collectibility of loans in light of historical experience, the nature and volume of the loan portfolio, overall portfolio quality, review of specific problem loans, current economic conditions that may affect the borrower’s ability to pay, estimated value of any underlying collateral and prevailing economic conditions. This evaluation is inherently subjective as it requires estimates that are susceptible to significant revision as more information becomes available. This evaluation does not include the effects of expected losses on specific loans or groups of loans that are related to future events or expected changes in economic conditions.
The allowance consists of specific and general components. The specific component relates to loans that are classified as impaired. For those loans that are classified as impaired, an allowance is established when the discounted cash flows, collateral value, or observable market price of the impaired loan is lower than the carrying value of that loan. The general component covers non-impaired loans and is based on historical loss experience adjusted for qualitative factors. Other adjustments may be made to the allowance for pools of loans after an assessment of internal or external influences on credit quality that are not fully reflected in the historical loss or risk rating data.
A loan is considered impaired when it is probable, based on current information and events, the Company will be unable to collect all principal and interest payments due in accordance with the contractual terms of the loan agreement. Loans, for which the terms have been modified at the borrower’s request, and for which the borrower is experiencing financial difficulties, are considered troubled debt restructurings and classified as impaired.
Factors considered by management in determining impairment include payment status, collateral value, and the probability of collecting scheduled principal and interest when due. Loans that experience insignificant payment delays and payment shortfalls are not generally classified as
F-49
Table of Contents
NOTES TO CONSOLIDATED FINANCIAL STATEMENTS
(In thousands, except per share amounts)
| NOTE 1. | SUMMARY OF SIGNIFICANT ACCOUNTING POLICIES (Continued) |
Allowance for Loan Losses (Continued)
impaired. Impaired loans are measured by either the present value of expected future cash flows discounted at the loan’s effective interest rate, the loan’s obtainable market price, or the fair value of the collateral if the loan is collateral dependent. Interest on accruing impaired loans is recognized as long as such loans do not meet the criteria for nonaccrual status. Large groups of smaller balance homogeneous loans are collectively evaluated for impairment.
The Company’s allowance is allocated among commercial real estate loans, real estate construction and development loans, residential real estate loans, commercial and industrial loans, and consumer loans. The general allocations to these loan pools are based on the historical loss rates for specific loan types and the internal risk grade, if applicable, adjusted for both internal and external qualitative risk factors. The qualitative factors considered by management include, among other factors, (1) changes in local and national economic conditions; (2) changes in asset quality and foreclosure rates; (3) changes in loan portfolio volume; (4) the composition and concentrations of credit; (5) the impact of competition on loan structuring and pricing; (6) the experience and ability of lending personnel and management; (7) effectiveness of the Company’s loan policies, procedures and internal controls; (8) current conditions in the real estate and construction markets; (9) the effect of entrance into new markets or the offering of a new product; (10) the loan review system and oversight of the Board of Directors. The total allowance established for each homogeneous loan pool represents the product of the historical loss ratio adjusted for internal and external factors and the total dollar amount of the loans in the pool.
Troubled Debt Restructurings
A loan is considered a troubled debt restructuring (TDR) based on individual facts and circumstances. The Company designates loan modifications as TDRs when for economic or legal reasons related to the borrower’s financial difficulties, it grants a concession to the borrower that it would not otherwise consider. These concessions may include rate reductions, principal forgiveness, extension of maturity date and other actions intended to minimize potential losses.
In determining whether a borrower is experiencing financial difficulties, the Company considers if the borrower is in payment default or would be in payment default in the foreseeable future without the modification, the borrower declared or is in the process of declaring bankruptcy, the borrower’s projected cash flows will not be sufficient to service any of its debt, or the borrower cannot obtain funds from sources other than the Company at a market rate for debt with similar risk characteristics.
In determining whether the Company has granted a concession, the Company assesses, if it does not expect to collect all amounts due, whether the current value of the collateral will satisfy the amounts owed, whether additional collateral or guarantees from the borrower will serve as adequate compensation for other terms of the restructuring, and whether the borrower otherwise has access to funds at a market rate for debt with similar risk characteristics.
Premises and Equipment
Land is carried at cost. Premises and equipment are carried at cost less accumulated depreciation computed on the straight-line method over the estimated useful lives of the assets or the expected terms of the leases, if shorter. Expected terms include lease option periods to the extent that the
F-50
Table of Contents
NOTES TO CONSOLIDATED FINANCIAL STATEMENTS
(In thousands, except per share amounts)
| NOTE 1. | SUMMARY OF SIGNIFICANT ACCOUNTING POLICIES (Continued) |
Premises and Equipment (Continued)
exercise of such options is reasonably assured. Maintenance and repairs are expensed as incurred while major additions and improvements are capitalized. Gains and losses on dispositions are reflected in income.
| Years | ||||
| Buildings |
10-39 | |||
| Furniture and equipment |
3-7 | |||
Transfers of Financial Assets
Transfers of financial assets are accounted for as sales, when control over the assets has been surrendered. Control over transferred assets is deemed to be surrendered when (1) the assets have been isolated from the Company - put presumptively beyond the reach of the transferor and its creditors, even in bankruptcy or other receivership, (2) the transferee obtains the right (free of conditions that constrain it from taking advantage of that right) to pledge or exchange the transferred assets, and (3) the Company does not maintain effective control over the transferred assets through an agreement to repurchase them before their maturity or the ability to unilaterally cause the holder to return specific assets.
Foreclosed Assets
Assets acquired through, or in lieu of, loan foreclosure are held for sale and are initially recorded at fair value less estimated selling costs. Any write-down to fair value at the time of transfer to foreclosed assets is charged to the allowance for loan losses. Subsequent to foreclosure, valuations are periodically performed by management and the assets are carried at the lower of carrying amount or fair value less estimated costs to sell. Costs of improvements are capitalized, whereas costs related to holding foreclosed assets and subsequent write-downs to the value are expensed. Any gains and losses realized at the time of disposal are reflected in income.
Goodwill
Goodwill represents the excess of the amount paid over the fair value of the net assets at the date of acquisition. Goodwill is subject to an annual evaluation of impairment. If desired, the Company can assess qualitative factors to determine if comparing the carrying value of the reporting unit to its fair value is necessary. Should the fair value be less than the carrying value, an impairment write-down would be taken. Based on its assessment of qualitative factors, the Company determined that no impairment exists at December 31, 2020.
Goodwill is not amortized but is evaluated for impairment on an annual basis or whenever an event occurs or circumstances change to indicate that it is more likely than not that an impairment loss has been incurred (i.e., a triggering event). During 2020, the Company performed a goodwill impairment test in December 2020. The qualitative factors considered in determining if fair value of the unit was less than the carrying amount were economic conditions related to the COVID-19 virus and the change in the interest rate environment. A quantitative assessment of goodwill impairment included determining the estimated fair value of Company using a market-based approach. The market approach was based on a comparison of certain financial metrics of the Company to public company peers. It was determined there was no impairment.
F-51
Table of Contents
NOTES TO CONSOLIDATED FINANCIAL STATEMENTS
(In thousands, except per share amounts)
| NOTE 1. | SUMMARY OF SIGNIFICANT ACCOUNTING POLICIES (Continued) |
Core Deposit Intangible
A core deposit intangible is initially recognized based on a valuation, of acquired deposits, performed as of the acquisition date. The acquisition of Small Town Bank resulted in the core deposit intangible increasing by $1,851. The core deposit intangible is amortized over the average remaining life of the acquired customer deposits, or approximately 7 years. The intangible asset is reviewed annually for events or circumstances that could negatively impact the recoverability of the intangible. These events could include loss of core deposits, increased competition, or adverse changes in the economy. To the extent this intangible asset is deemed unrecoverable, an impairment charge would be recorded. The Company maintains steady deposit growth across our markets and continues to attract new customer deposits. The intangible asset was evaluated for impairment as of December 31, 2020 and based on that evaluation there was no impairment.
The following table provides a summary of the Company’s core deposit intangible asset:
| Gross Carrying Amount |
Accumulated Amortization |
Net Carrying Amount |
||||||||||
| December 31, 2020 |
||||||||||||
| Core deposit intangible |
$ | 2,746 | $ | (982) | $ | 1,764 | ||||||
| December 31, 2019 |
||||||||||||
| Core deposit intangible |
$ | 2,746 | $ | (718) | $ | 2,027 | ||||||
Amortization expense related to core deposit intangibles was $264 and $157 for the years ended December 31, 2020 and 2019. The estimated amortization expense related to core deposit intangible assets for future periods is summarized as follows:
| 2021 |
$ | 264 | ||
| 2022 |
251 | |||
| 2023 |
185 | |||
| 2024 |
185 | |||
| 2025 |
185 | |||
| Thereafter |
694 | |||
|
|
|
|||
| Total |
$ | 1,764 | ||
|
|
|
Accounting Policy for Derivative Instruments and Hedging Activities
FASB ASC 815, Derivatives and Hedging (“ASC 815”), provides the disclosure requirements for derivatives and hedging activities with the intent to provide users of financial statements with an enhanced understanding of: (a) how and why an entity uses derivative instruments, (b) how the entity accounts for derivative instruments and related hedged items, and (c) how derivative instruments and related hedged items affect an entity’s financial position, financial performance, and cash flows. Further, qualitative disclosures are required that explain the Company’s objectives and strategies for using derivatives, as well as quantitative disclosures about the fair value of and gains and losses on derivative instruments, and disclosures about credit-risk-related contingent features in derivative instruments.
As required by ASC 815, the Company records all derivatives on the balance sheet at fair value. The accounting for changes in the fair value of derivatives depends on the intended use of the derivative,
F-52
Table of Contents
NOTES TO CONSOLIDATED FINANCIAL STATEMENTS
(In thousands, except per share amounts)
| NOTE 1. | SUMMARY OF SIGNIFICANT ACCOUNTING POLICIES (Continued) |
Accounting Policy for Derivative Instruments and Hedging Activities (Continued)
whether the Company has elected to designate a derivative in a hedging relationship and apply hedge accounting and whether the hedging relationship has satisfied the criteria necessary to apply hedge accounting. Derivatives designated and qualifying as a hedge of the exposure to changes in the fair value of an asset, liability, or firm commitment attributable to a particular risk, such as interest rate risk, are considered fair value hedges. Derivatives designated and qualifying as a hedge of the exposure to variability in expected future cash flows, or other types of forecasted transactions, are considered cash flow hedges. Derivatives may also be designated as hedges of the foreign currency exposure of a net investment in a foreign operation. Hedge accounting generally provides for the matching of the timing of the hedged asset or liability that are attributable to the hedged risk in a fair value hedge or the earnings effect of the hedged forecasted transactions in a cash flow hedge. The Company may enter into derivative contracts that are intended to economically hedge certain of its risks, even though hedge accounting does not apply or the Company elects not to apply hedge accounting.
In accordance with the FASB’s fair value measurement guidance in ASU 2011-04, the Company made an accounting policy election to measure the credit risk of its derivative financial instruments that are subject to master netting agreements on a net basis by counterparty portfolio.
Income Taxes
Income tax accounting guidance results in two components of income tax expense: current and deferred. Current income tax expense reflects taxes to be paid or refunded for the current period by applying the provisions of the enacted tax law to the taxable income or excess of deductions over revenues. The Company determines deferred income taxes using the liability (or balance sheet) method. Under this method, the net deferred tax asset or liability is based on the tax effects of the differences between the book and tax bases of assets and liabilities, and enacted changes in tax rates and laws are recognized in the period in which they occur.
Deferred income tax expense results from changes in deferred tax assets and liabilities between periods. Deferred tax assets are recognized if it is more likely than not, based on the technical merits, that the tax position will be realized or sustained upon examination. The term more likely than not means a likelihood of more than 50 percent; the terms examined and upon examination also include resolution of the related appeals or litigation processes, if any. A tax position that meets the more-likely-than-not recognition threshold is initially and subsequently measured as the largest amount of tax benefit that has a greater than 50 percent likelihood of being realized upon settlement with a taxing authority that has full knowledge of all relevant information. The determination of whether or not a tax position has met the more-likely-than-not recognition threshold considers the facts, circumstances, and information available at the reporting date and is subject to management’s judgment. Deferred tax assets may be reduced by deferred tax liabilities and a valuation allowance if, based on the weight of evidence available, it is more likely than not that some portion or all of a deferred tax asset will not be realized. Management believes that the Company will generate sufficient operating earnings to realize the deferred tax benefits.
Earnings Per Share
Basic earnings per share is calculated by dividing net income available to common shareholders by the weighted average number of common shares outstanding. Diluted earnings per share reflect
F-53
Table of Contents
NOTES TO CONSOLIDATED FINANCIAL STATEMENTS
(In thousands, except per share amounts)
| NOTE 1. | SUMMARY OF SIGNIFICANT ACCOUNTING POLICIES (Continued) |
Earnings Per Share (Continued)
additional potential common shares that would have been outstanding if dilutive potential common shares had been issued, as well as any adjustment to income that would result from the assumed issuance. Potential common shares that may be issued by the Company relate to outstanding stock options.
| Years Ended December 31, | ||||||||
| 2020 | 2019 | |||||||
| Basic Earnings Per Share: |
||||||||
| Net income |
$ | 12,107 | $ | 5,602 | ||||
|
|
|
|
|
|||||
| Weighted average common shares outstanding |
7,673,085 | 6,840,411 | ||||||
|
|
|
|
|
|||||
| Basic earnings per share |
$ | 1.58 | $ | 0.82 | ||||
|
|
|
|
|
|||||
| Diluted Earnings Per Share: |
||||||||
| Net income allocated to common shareholders |
$ | 12,095 | $ | 5,578 | ||||
|
|
|
|
|
|||||
| Weighted average common shares outstanding |
7,673,085 | 6,840,411 | ||||||
| Net dilutive effect of: |
||||||||
| Assumed exercises of stock options |
92,778 | 61,210 | ||||||
|
|
|
|
|
|||||
| Average shares and dilutive potential common shares |
7,765,863 | 6,901,621 | ||||||
|
|
|
|
|
|||||
| Diluted earnings per share |
$ | 1.56 | $ | 0.81 | ||||
|
|
|
|
|
|||||
Stock Compensation Plans
Stock compensation accounting guidance requires that the compensation cost relating to share-based payment transactions be recognized in financial statements. That cost will be measured based on the grant date fair value of the equity or liability instruments issued. The stock compensation accounting guidance covers a wide range of share-based compensation arrangements including stock options and warrants, restricted stock plans, performance-based awards, share appreciation rights, and employee share purchase plans.
The stock compensation accounting guidance requires that compensation cost for all stock awards be calculated and recognized over the employees’ service period, generally defined as the vesting period. For awards with graded-vesting, compensation cost is recognized on a straight-line basis over the requisite service period for the entire award. A Black-Scholes model is used to estimate the fair value of stock options, while the estimated market price of the Company’s common stock at the date of grant is used for restricted stock awards and stock grants.
Comprehensive Income
Accounting principles generally require that recognized revenue, expenses, gains and losses be included in net income. Although certain changes in assets and liabilities, such as unrealized gains and losses on available for sale securities, are reported as a separate component of the equity section of the balance sheet, such items, along with net income, are components of comprehensive income.
F-54
Table of Contents
NOTES TO CONSOLIDATED FINANCIAL STATEMENTS
(In thousands, except per share amounts)
| NOTE 1. | SUMMARY OF SIGNIFICANT ACCOUNTING POLICIES (Continued) |
Fair Value of Financial Instruments
Fair values of financial instruments are estimates using relevant market information and other assumptions, as more fully disclosed in Note 16. Fair value estimates involve uncertainties and matters of significant judgment. Changes in assumptions or in market conditions could significantly affect the estimates.
Revenue Recognition
On January 1, 2018, the Company adopted ASC 606 and all subsequent amendments (collectively “ASC 606”) which (1) creates a single framework for recognizing revenue from contracts with customers that fall within its scope and (2) revises when it is appropriate to recognize a gain (loss) from the transfer of nonfinancial assets, such as other real estate owned (OREO). The majority of the Company’s revenues come from interest income and other sources, including loans and securities that are outside the scope of ASC 606. With the exception of gains/losses on sale of OREO, the Company’s services that fall within the scope of ASC 606 are presented within noninterest income and are recognized as revenue as the Company satisfies its obligations to the customer. Services within the scope of ASC 606 reported in noninterest income include service charges on deposit accounts, bank card services and interchange fees, and ATM fees.
Recent Accounting Pronouncements
In February 2016 the Financial Accounting Standards Board (FASB) issued ASU 2016-02, “Leases (Topic 842)” to increase transparency and comparability among organizations by recognizing lease assets and lease liabilities on the balance sheet and by disclosing key information about leasing arrangements. ASU 2016-02 requires organizations that lease assets (lessees) to recognize on the balance sheet the assets and liabilities for the rights and obligations created by the lease for all operating leases under current U.S. GAAP with a term of more than 12 months. The ASU is effective for non public business entities for fiscal years beginning after December 15, 2021. Early adoption is permitted. The ASU should be applied on a modified retrospective basis, with a cumulative-effect adjustment directly to retained earnings as of the beginning of the period of adoption. The adoption of ASU 2016-02 is not expected to have a material impact on the Company’s consolidated financial statements.
In July 2018 the FASB issued ASU 2018-11, “Leases –Targeted Improvements” to provide entities with relief from the costs of implementing certain aspects of the new leasing standard, ASU 2016-02. Specifically, under the amendments in ASU 2018-11: (1) entities may elect not to recast the comparative periods presented when transitioning to the new leasing standard, and (2) lessors may elect not to separate lease and non-lease components when certain conditions are met. The amendments have the same effective date as ASU 2016-02 (January 1, 2022 for the Company). The adoption of ASU 2018-11 is not expected to have a material impact on the Company’s consolidated financial statements.
In June 2016 the FASB issued ASU 2016-13, “Financial Instruments – Credit Losses (Topic 326): Measurement of Credit Losses on Financial Instruments.” The new guidance will apply to most financial assets measured at amortized cost and certain other instruments including loans, debt securities held to maturity, net investments in leases and off-balance sheet credit exposures. The guidance will replace the current incurred loss accounting model that delays recognition of a loss until it is probable a loss has been incurred with an expected loss model that reflects expected credit losses based upon a broader range of estimates including consideration of past events, current conditions and supportable forecasts. The guidance also eliminates the current accounting model for
F-55
Table of Contents
NOTES TO CONSOLIDATED FINANCIAL STATEMENTS
(In thousands, except per share amounts)
| NOTE 1. | SUMMARY OF SIGNIFICANT ACCOUNTING POLICIES (Continued) |
Recent Accounting Pronouncements (Continued)
purchased credit impaired loans and debt securities, which will require re-measurement of the related allowance at each reporting period. The guidance includes enhanced disclosure requirements intended to help financial statement users better understand estimates and judgement used in estimating credit losses. As originally issued, ASU 2016-13 was effective for financial statements issued for fiscal years and for interim periods within those fiscal years beginning after December 15, 2020, with institutions required to apply the changes through a cumulative-effect adjustment to their
retained earnings balance as of the beginning of the first reporting period in which the guidance is effective. On October 16, 2019, the FASB approved a delay in the implementation of ASU 2016-13 by two years for non pubic business entities, including the Company. Management has been in the process of developing a revised model to calculate the allowance for loan and leases losses upon implementation of ASU 2016-13 in order to determine the impact on the Company’s consolidated financial statements and, at this time, expects to recognize a one-time cumulative effect adjustment to the allowance for loan and lease losses as of the beginning of the first reporting period in which the new standard is effective. The magnitude of any such one-time adjustments is not yet known.
| NOTE 2. | ACQUISITION ACTIVITY |
The merger was accounted for under the purchase method of accounting, resulting in goodwill of $10,821.
The acquired assets and assumed liabilities as of September 13, 2019, as well as the adjustments to record the assets and liabilities at fair value, are presented in the following table:
| Book Value |
Fair Value and Other Adjustments |
As Recorded by the Company |
||||||||||||
| Cash and cash equivalents |
$ | 19,051 | $ | — | $ | 19,051 | ||||||||
| Securities available for sale |
84,850 | (1,593 | ) | (a) | 83,257 | |||||||||
| Restricted equity securities |
737 | — | 737 | |||||||||||
| Loans |
118,357 | (1,563 | ) | (b) | 116,794 | |||||||||
| Less allowance for loan losses |
(1,489 | ) | 1,489 | (c) | — | |||||||||
| Core deposit intangible |
— | 1,851 | (d) | 1,851 | ||||||||||
| Goodwill |
2,612 | (2,612 | ) | (e) | — | |||||||||
| Bank owned life insurance |
5,143 | — | 5,143 | |||||||||||
| Premises, equipment and software, net |
2,710 | 847 | (f) | 3,557 | ||||||||||
| Other assets |
1,234 | — | 1,234 | |||||||||||
|
|
|
|
|
|
|
|||||||||
| Total assets acquired |
$ | 233,205 | $ | (1,581 | ) | $ | 231,624 | |||||||
|
|
|
|
|
|
|
|||||||||
| Deposits |
$ | 191,429 | $ | — | $ | 191,429 | ||||||||
| Other liabilities |
1,773 | (759 | ) | (g) | 1,014 | |||||||||
|
|
|
|
|
|
|
|||||||||
| Total liabilities assumed |
$ | 193,202 | $ | (759 | ) | $ | 192,443 | |||||||
|
|
|
|
|
|
|
|||||||||
| Net assets acquired |
$ | 39,181 | ||||||||||||
|
|
|
|||||||||||||
| Cash |
$ | 24,002 | ||||||||||||
| Stock |
26,000 | |||||||||||||
|
|
|
|||||||||||||
| Total Consideration paid |
$ | 50,002 | ||||||||||||
|
|
|
|||||||||||||
| Goodwill |
$ | 10,821 | ||||||||||||
|
|
|
|||||||||||||
F-56
Table of Contents
NOTES TO CONSOLIDATED FINANCIAL STATEMENTS
(In thousands, except per share amounts)
| NOTE 2. | ACQUISITION ACTIVITY (Continued) |
Explanation of fair value adjustments:
| (a) | Adjustment reflects the fair value adjustments based on the Company’s evaluation of the acquired securities portfolio. |
| (b) | Adjustment reflects the fair value adjustments based on the Company’s evaluation of the acquired loan portfolio. |
| (c) | Adjustment reflects the elimination of STB’s allowance for loan losses. |
| (d) | Adjustment reflects the recording of core deposit intangible on the acquired core deposit accounts. |
| (e) | Adjustment reflects the elimination of STB’s goodwill. |
| (f) | Adjustment reflects the fair value adjustments based on the Company’s evaluation of the acquired premises. |
| (g) | Adjustment reflects the deferred taxes on the difference in the carrying values of acquired assets and assumed liabilities for financial reporting purposes and their basis for federal income tax purposes. |
| NOTE 3. | SECURITIES |
The amortized cost and fair value of securities are summarized as follows:
| Amortized Cost |
Gross Unrealized Gains |
Gross Unrealized Losses |
Fair Value |
|||||||||||||
| Securities Available for Sale |
||||||||||||||||
| U.S. Government sponsored enterprises (GSEs) |
$ | 9,154 | $ | 246 | $ | (34 | ) | $ | 9,366 | |||||||
| State and municipal securities |
64,468 | 3,531 | (58 | ) | 67,941 | |||||||||||
| Corporate debt securities |
8,286 | 188 | (5 | ) | 8,469 | |||||||||||
| Asset based securities |
9,035 | 76 | — | 9,111 | ||||||||||||
| Mortgage-backed |
||||||||||||||||
| GSE residential/multifamily |
18,753 | 394 | (33 | ) | 19,114 | |||||||||||
|
|
|
|
|
|
|
|
|
|||||||||
| Total securities available for sale |
$ | 109,696 | $ | 4,435 | $ | (130 | ) | $ | 114,001 | |||||||
|
|
|
|
|
|
|
|
|
|||||||||
| December 31, 2019: |
||||||||||||||||
| U.S. Government sponsored enterprises (GSEs) |
$ | 7,258 | $ | 9 | $ | (102 | ) | $ | 7,165 | |||||||
| State and municipal securities |
29,239 | 525 | (105 | ) | 29,659 | |||||||||||
| Corporate debt securities |
2,547 | 86 | — | 2,633 | ||||||||||||
| Mortgage-backed |
||||||||||||||||
| GSE residential/multifamily |
20,545 | 31 | (86 | ) | 20,490 | |||||||||||
|
|
|
|
|
|
|
|
|
|||||||||
| Total securities available for sale |
$ | 59,589 | $ | 651 | $ | (293 | ) | $ | 59,947 | |||||||
|
|
|
|
|
|
|
|
|
|||||||||
Securities with a carrying value of approximately $40,983 and $25,359 at December 31, 2020 and 2019, respectively, were pledged to secure public deposits and for other purposes as required or permitted by law.
F-57
Table of Contents
NOTES TO CONSOLIDATED FINANCIAL STATEMENTS
(In thousands, except per share amounts)
| NOTE 3. | SECURITIES (Continued) |
The amortized cost and fair value of securities available for sale as of December 31, 2020 by contractual maturity are shown below. Actual maturities may differ from contractual maturities in mortgage-backed securities because the mortgages underlying the securities may be called or repaid with or without penalty. Therefore, these securities are not included by maturity in the following summary:
| Securities Available for Sale |
||||||||
| Amortized Cost |
Fair Value |
|||||||
| Due from one year to five years |
$ | 1,200 | $ | 1,241 | ||||
| Due after five to ten years |
15,518 | 15,873 | ||||||
| Due after ten years |
74,225 | 77,773 | ||||||
| Mortgage-backed securities |
18,753 | 19,114 | ||||||
|
|
|
|
|
|||||
| $ | 109,696 | $ | 114,001 | |||||
|
|
|
|
|
|||||
Gains and losses on sales of securities available for sale consist of the following:
| Years Ended December 31, |
||||||||
| 2020 | 2019 | |||||||
| Gross gains |
$ | 765 | $ | 78 | ||||
| Gross losses |
(23 | ) | (64 | ) | ||||
|
|
|
|
|
|||||
| Net realized gain |
$ | 742 | $ | 14 | ||||
|
|
|
|
|
|||||
Restricted equity securities consist of the following:
| December 31, | ||||||||
| 2020 | 2019 | |||||||
| Federal Home Loan Bank stock |
$ | 2,299 | $ | 1,097 | ||||
| First National Banker’s Bankshares, Inc. stock |
675 | 675 | ||||||
| Pacific Coast Banker’s Bank stock |
250 | 250 | ||||||
|
|
|
|
|
|||||
| $ | 3,224 | $ | 2,022 | |||||
|
|
|
|
|
|||||
Temporarily Impaired Securities
The following table shows the gross unrealized losses and fair value of securities, aggregated by category and length of time that securities have been in a continuous unrealized loss position at December 31, 2020 and 2019.
| Less Than Twelve Months |
Over Twelve Months |
|||||||||||||||||||
| Gross Unrealized Losses |
Fair Value |
Gross Unrealized Losses |
Fair Value |
Total Unrealized Losses |
||||||||||||||||
| December 31, 2020 |
||||||||||||||||||||
| U.S. Government sponsored enterprises (GSEs) |
$ | (34 | ) | $ | 2,051 | $ | — | $ | — | $ | (34 | ) | ||||||||
| State and municipal securities |
(58 | ) | 4,979 | — | — | (58 | ) | |||||||||||||
| Corporate debt securities |
(5 | ) | 1,495 | — | — | (5 | ) | |||||||||||||
| Asset based securities |
— | 960 | — | — | — | |||||||||||||||
| Mortgage-backed GSE residential/multifamily |
(33 | ) | 6,643 | — | — | (33 | ) | |||||||||||||
|
|
|
|
|
|
|
|
|
|
|
|||||||||||
| Total securities |
$ | (130 | ) | $ | 16,128 | $ | — | $ | — | $ | (130 | ) | ||||||||
|
|
|
|
|
|
|
|
|
|
|
|||||||||||
F-58
Table of Contents
NOTES TO CONSOLIDATED FINANCIAL STATEMENTS
(In thousands, except per share amounts)
| NOTE 3. | SECURITIES (Continued) |
Temporarily Impaired Securities (Continued)
| Less Than Twelve Months |
Over Twelve Months | |||||||||||||||||||
| Gross Unrealized Losses |
Fair Value |
Gross Unrealized Losses |
Fair Value |
Total Unrealized Losses |
||||||||||||||||
| December 31, 2019 |
||||||||||||||||||||
| U.S. Government sponsored enterprises (GSEs) |
$ | (45 | ) | $ | 3,890 | $ | (57 | ) | $ | 2,401 | $ | (102 | ) | |||||||
| State and municipal securities |
(90 | ) | 5,967 | (15 | ) | 1,090 | (105 | ) | ||||||||||||
| Corporate debt securities |
— | — | — | — | — | |||||||||||||||
| Mortgage-backed GSE residential/multifamily |
(58 | ) | 11,954 | (28 | ) | 2,236 | (86 | ) | ||||||||||||
|
|
|
|
|
|
|
|
|
|
|
|||||||||||
| Total securities |
$ | (193 | ) | $ | 21,811 | $ | (100 | ) | $ | 5,727 | $ | (293 | ) | |||||||
|
|
|
|
|
|
|
|
|
|
|
|||||||||||
The unrealized losses on twenty securities were caused by interest rate changes. Because the Company does not intend to sell the securities and it is not more likely than not that the Company will be required to sell the securities before recovery of the amortized cost bases, at maturity, the Company does not consider these securities to be other-than-temporarily impaired at December 31, 2020.
Other-Than-Temporary Impairment
The Company routinely conducts periodic reviews to identify and evaluate each investment security to determine whether an other-than-temporary impairment has occurred. Factors included in the evaluation process may include geographic concentrations, credit ratings, and other performance indicators of the underlying asset. As of December 31, 2020 and 2019, no securities within the Company’s investment securities portfolio was considered other-than-temporarily impaired.
| NOTE 4. | LOANS |
Portfolio Segments and Classes
The composition of loans, excluding loans held for sale, is summarized as follows:
| December 31, | ||||||||
| 2020 | 2019 | |||||||
| Real estate mortgages: |
||||||||
| Construction and development |
$ | 102,559 | $ | 93,011 | ||||
| Residential |
152,212 | 152,312 | ||||||
| Commercial |
514,923 | 441,946 | ||||||
| Commercial and industrial |
254,395 | 139,765 | ||||||
| Consumer and other |
9,644 | 11,955 | ||||||
|
|
|
|
|
|||||
| 1,033,733 | 838,989 | |||||||
| Deferred loan fees |
(3,618 | ) | (1,548 | ) | ||||
| Allowance for loan losses |
(11,859 | ) | (9,265 | ) | ||||
|
|
|
|
|
|||||
| Loans, net |
$ | 1,018,256 | $ | 828,176 | ||||
|
|
|
|
|
|||||
F-59
Table of Contents
NOTES TO CONSOLIDATED FINANCIAL STATEMENTS
(In thousands, except per share amounts)
| NOTE 4. | LOANS (Continued) |
Portfolio Segments and Classes (Continued)
For purposes of the disclosures required pursuant to ASC 310, the loan portfolio was disaggregated into segments and then further disaggregated into classes for certain disclosures. A portfolio segment is defined as the level at which an entity develops and documents a systematic method for determining its allowance for credit losses. There are three loan portfolio segments that include real estate, commercial and industrial, and consumer and other. A class is generally determined based on the initial measurement attribute, risk characteristic of the loan, and an entity’s method for monitoring and assessing credit risk. Commercial and industrial is a separate commercial loan class. Classes within the real estate portfolio segment include construction and development, residential mortgages, and commercial mortgages. Consumer loans and other are a class in itself.
In light of the U.S. and global economic crisis brought about by the COVID-19 pandemic, the Company has prioritized assisting its clients through this troubled time. The CARES Act provides for Paycheck Protection Plan (PPP) loans to be made by banks to employers with less than 500 employees if they continue to employ their existing workers. As of December 31, 2020, the Company has outstanding approximately 367 loans for a total amount of $66,556 under the PPP. At December 31, 2020, unaccreted deferred loan origination fees related to PPP loans totaled $1,612. PPP loan origination fees recorded as an adjustment to loan yield for the year were $1,028. These PPP loans are included within the commercial and industrial loan category in the table above.
The following describe risk characteristics relevant to each of the portfolio segments and classes:
Real estate - As discussed below, the Company offers various types of real estate loan products. All loans within this portfolio segment are particularly sensitive to the valuation of real estate:
| • | Loans for real estate construction and development are repaid through cash flow related to the operations, sale or refinance of the underlying property. This portfolio class includes extensions of credit to real estate developers or investors where repayment is dependent on the sale of the real estate or income generated from the real estate collateral. |
| • | Residential mortgages include 1-4 family first mortgage loans which are repaid by various means such as a borrower’s income, sale of the property, or rental income derived from the property. Also included in residential mortgages are real estate loans secured by farmland, second liens, or open end real estate loans, such as home equity lines. These loans are typically repaid in the same means as 1-4 family first mortgages. |
| • | Commercial real estate mortgage loans include both owner-occupied commercial real estate loans and other commercial real estate loans such as commercial loans secured by income producing properties. Owner-occupied commercial real estate loans made to operating businesses are long-term financing of land and buildings and are repaid by cash flows generated from business operations. Real estate loans for income-producing properties such as apartment buildings, hotels, office and industrial buildings, and retail shopping centers are repaid by cash flows from rent income derived from the properties. |
Commercial and industrial - The commercial loan portfolio segment includes commercial and industrial loans. These loans include those loans to commercial customers for use in normal business operations to finance working capital needs, equipment purchases, leases, or expansion projects. Loans are repaid by business cash flows. Collection risk in this portfolio is driven by the creditworthiness of the underlying borrower, particularly cash flows from the borrowers’ business operations.
F-60
Table of Contents
NOTES TO CONSOLIDATED FINANCIAL STATEMENTS
(In thousands, except per share amounts)
| NOTE 4. | LOANS (Continued) |
Portfolio Segments and Classes (Continued)
Consumer and other - The consumer loan portfolio segment includes direct consumer installment
loans, overdrafts and other revolving credit loans. Loans in this portfolio are sensitive to unemployment and other key consumer economic measures which affects borrowers’ incomes and cash for repayment.
Credit Risk Management
The Chief Credit Officer, Officers Loan Committee and Directors Loan Committee are each involved in the credit risk management process and assess the accuracy of risk ratings, the quality of the portfolio and the estimation of inherent credit losses in the loan portfolio. This comprehensive process also assists in the prompt identification of problem credits. The Company has taken a number of measures to manage the portfolios and reduce risk, particularly in the more problematic portfolios.
The Company employs a credit risk management process with defined policies, accountability and routine reporting to manage credit risk in the loan portfolio segments. Credit risk management is guided by a comprehensive Loan Policy that provides for a consistent and prudent approach to underwriting and approvals of credits. Within the Board approved Loan Policy, procedures exist that elevate the approval requirements as credits become larger and more complex. All loans are individually underwritten, risk-rated, approved, and monitored.
Responsibility and accountability for adherence to underwriting policies and accurate risk ratings lies in each portfolio segment. For the consumer portfolio segment, the risk management process focuses on managing customers who become delinquent in their payments. For the commercial and real estate portfolio segments, the risk management process focuses on underwriting new business and, on an ongoing basis, monitoring the credit of the portfolios. To ensure problem credits are identified on a timely basis, several specific portfolio reviews occur each year to assess the larger adversely rated credits for proper risk rating and accrual status.
Credit quality and trends in the loan portfolio segments are measured and monitored regularly. Detailed reports, by product, collateral, accrual status, etc., are reviewed by the Chief Credit Officer, Officers Loan Committee and Directors Loan Committee.
A description of the general characteristics of the risk categories used by the Company is as follows:
| • | Pass - A pass loan is a strong credit with no existing or known potential weaknesses deserving of management’s close attention. |
| • | Special Mention - A loan that has potential weaknesses that deserve management’s close attention. If left uncorrected, these potential weaknesses may result in deterioration of the repayment prospects for the loan or in the institution’s credit position at some future date. These loans are not adversely classified and do not expose an institution to sufficient risk to warrant adverse classification. |
| • | Substandard - Substandard loans are inadequately protected by the current sound worth and paying capacity of the obligor or of the collateral pledged, if any. Loans so classified must have a well-defined weakness or weaknesses that jeopardize the liquidation of the debt. They |
| are characterized by the distinct possibility that the institution will sustain some loss if the deficiencies are not corrected. |
F-61
Table of Contents
NOTES TO CONSOLIDATED FINANCIAL STATEMENTS
(In thousands, except per share amounts)
| NOTE 4. | LOANS (Continued) |
Credit Risk Management (Continued)
| • | Doubtful - Loans classified Doubtful have all the weaknesses inherent in those classified Substandard with the added characteristic that the weaknesses make collection or liquidation in full, on the basis of currently known facts, conditions, and values, highly questionable and improbable. |
| • | Loss - Loans classified Loss are considered uncollectible and of such little value that their continuance as bankable assets is not warranted. This classification does not mean that the loan has absolutely no recovery or salvage value but rather it is not practical or desirable to defer writing off this basically worthless asset even though partial recovery may be effected in the future. |
The following tables summarize the risk category of the Company’s loan portfolio based upon the most recent analysis performed as of December 31, 2020 and 2019:
| Pass | Special Mention | Substandard | Doubtful | Total | ||||||||||||||||
| December 31, 2020 |
||||||||||||||||||||
| Real estate mortgages: |
||||||||||||||||||||
| Construction and development |
$ | 95,214 | $ | 6,113 | $ | 1,232 | $ | — | $ | 102,559 | ||||||||||
| Residential |
144,256 | 6,245 | 1,627 | 84 | 152,212 | |||||||||||||||
| Commercial |
471,555 | 36,754 | 6,614 | — | 514,923 | |||||||||||||||
| Commercial and industrial |
240,646 | 13,138 | 611 | — | 254,395 | |||||||||||||||
| Consumer and other |
8,186 | 1,435 | 23 | — | 9,644 | |||||||||||||||
|
|
|
|
|
|
|
|
|
|
|
|||||||||||
| Total: |
$ | 959,857 | $ | 63,685 | $ | 10,107 | $ | 84 | $ | 1,033,733 | ||||||||||
|
|
|
|
|
|
|
|
|
|
|
|||||||||||
| December 31, 2019 |
||||||||||||||||||||
| Real estate mortgages: |
||||||||||||||||||||
| Construction and development |
$ | 82,250 | $ | 8,523 | $ | 2,238 | $ | — | $ | 93,011 | ||||||||||
| Residential |
143,864 | 4,717 | 3,631 | 100 | 152,312 | |||||||||||||||
| Commercial |
406,726 | 17,530 | 17,690 | — | 441,946 | |||||||||||||||
| Commercial and industrial |
118,288 | 20,368 | 1,109 | — | 139,765 | |||||||||||||||
| Consumer and other |
10,423 | 1,532 | — | — | 11,955 | |||||||||||||||
|
|
|
|
|
|
|
|
|
|
|
|||||||||||
| Total: |
$ | 761,551 | $ | 52,670 | $ | 24,668 | $ | 100 | $ | 838,989 | ||||||||||
|
|
|
|
|
|
|
|
|
|
|
|||||||||||
F-62
Table of Contents
NOTES TO CONSOLIDATED FINANCIAL STATEMENTS
(In thousands, except per share amounts)
| NOTE 4. | LOANS (Continued) |
Past Due Loans
A loan is considered past due if any required principal and interest payments have not been received as of the date such payments were required to be made under the terms of the loan agreement. Generally, management places a loan on nonaccrual when there is a clear indication that the borrower’s cash flow may not be sufficient to meet payments as they become due, which is generally when a loan is 90 days past due. The following tables present the aging of the recorded investment in loans and leases as of December 31, 2020 and 2019:
| Past Due Status (Accruing Loans) | ||||||||||||||||||||||||||||
| Current | 30-59 Days |
60-89 Days |
90+ Days |
Total Past Due |
Nonaccrual | Total | ||||||||||||||||||||||
| December 31, 2020 |
||||||||||||||||||||||||||||
| Real estate mortgages: |
||||||||||||||||||||||||||||
| Construction and development |
$ | 101,375 | $ | 117 | $ | 90 | $ | — | $ | 207 | $ | 977 | $ | 102,559 | ||||||||||||||
| Residential |
150,837 | 382 | 94 | 42 | 518 | 857 | 152,212 | |||||||||||||||||||||
| Commercial |
512,208 | 1,196 | — | 41 | 1,237 | 1,478 | 514,923 | |||||||||||||||||||||
| Commercial and industrial |
252,473 | 626 | 1,212 | — | 1,838 | 84 | 254,395 | |||||||||||||||||||||
| Consumer and other |
9,581 | 18 | 15 | 8 | 41 | 22 | 9,644 | |||||||||||||||||||||
|
|
|
|
|
|
|
|
|
|
|
|
|
|
|
|||||||||||||||
| Total: |
$ | 1,026,474 | $ | 2,339 | $ | 1,411 | $ | 91 | $ | 3,841 | $ | 3,418 | $ | 1,033,733 | ||||||||||||||
|
|
|
|
|
|
|
|
|
|
|
|
|
|
|
|||||||||||||||
| December 31, 2019 |
||||||||||||||||||||||||||||
| Real estate mortgages: |
||||||||||||||||||||||||||||
| Construction and development |
$ | 91,056 | $ | 466 | $ | 82 | $ | — | $ | 548 | $ | 1,407 | $ | 93,011 | ||||||||||||||
| Residential |
150,710 | 704 | 26 | — | 730 | 872 | 152,312 | |||||||||||||||||||||
| Commercial |
429,367 | 1,487 | — | 132 | 1,619 | 10,960 | 441,946 | |||||||||||||||||||||
| Commercial and industrial |
137,811 | 1,423 | 100 | 319 | 1,842 | 112 | 139,765 | |||||||||||||||||||||
| Consumer and other |
11,731 | 180 | 44 | — | 224 | — | 11,955 | |||||||||||||||||||||
|
|
|
|
|
|
|
|
|
|
|
|
|
|
|
|||||||||||||||
| Total: |
$ | 820,675 | $ | 4,260 | $ | 252 | $ | 451 | $ | 4,963 | $ | 13,351 | $ | 838,989 | ||||||||||||||
|
|
|
|
|
|
|
|
|
|
|
|
|
|
|
|||||||||||||||
Allowance for Loans Losses
The following tables detail activity in the allowance for loan losses by portfolio segment for the years ended December 31, 2020 and 2019. Allocation of a portion of the allowance to one category of loans does not preclude its availability to absorb losses in other categories.
| Real Estate | Commercial | Consumer | Total | |||||||||||||
| December 31, 2020 |
||||||||||||||||
| Allowance for loan losses: |
||||||||||||||||
| Balance, beginning of year |
$ | 7,254 | $ | 1,885 | $ | 126 | $ | 9,265 | ||||||||
| Provision for loan losses |
1,702 | 1,598 | — | 3,300 | ||||||||||||
| Loans charged off |
(908 | ) | — | (18 | ) | (926 | ) | |||||||||
| Recoveries of loans previously charged off |
9 | 126 | 85 | 220 | ||||||||||||
|
|
|
|
|
|
|
|
|
|||||||||
| Ending balance |
$ | 8,057 | $ | 3,609 | $ | 193 | $ | 11,859 | ||||||||
|
|
|
|
|
|
|
|
|
|||||||||
F-63
Table of Contents
NOTES TO CONSOLIDATED FINANCIAL STATEMENTS
(In thousands, except per share amounts)
| NOTE 4. | LOANS (Continued) |
Allowance for Loans Losses (Continued)
| Real Estate | Commercial | Consumer | Total | |||||||||||||
| Ending balance – individually evaluated for impairment |
$ | 1,352 | $ | 478 | $ | 7 | $ | 1,837 | ||||||||
| Ending balance – collectively evaluated for impairment |
6,476 | 3,131 | 186 | 9,793 | ||||||||||||
| Ending balance – loans acquired with deteriorated credit quality |
229 | — | — | 229 | ||||||||||||
|
|
|
|
|
|
|
|
|
|||||||||
| Total ending balance |
$ | 8,057 | $ | 3,609 | $ | 193 | $ | 11,859 | ||||||||
|
|
|
|
|
|
|
|
|
|||||||||
| Loans: |
||||||||||||||||
| Ending balance – individually evaluated for impairment |
$ | 11,527 | $ | 856 | $ | 37 | $ | 12,420 | ||||||||
| Ending balance – collectively evaluated for impairment |
756,489 | 253,539 | 9,607 | 1,019,635 | ||||||||||||
| Ending balance – loans acquired with deteriorated credit quality |
1,678 | — | — | 1,678 | ||||||||||||
|
|
|
|
|
|
|
|
|
|||||||||
| Total ending balance |
$ | 769,694 | $ | 254,395 | $ | 9,644 | $ | 1,033,733 | ||||||||
|
|
|
|
|
|
|
|
|
|||||||||
| December 31, 2019 |
||||||||||||||||
| Allowance for loan losses: |
||||||||||||||||
| Balance, beginning of year |
$ | 5,706 | $ | 2,017 | $ | 110 | $ | 7,833 | ||||||||
| Provision for loan losses |
1,972 | 3,455 | 273 | 5,700 | ||||||||||||
| Loans charged off |
(442 | ) | (3,627 | ) | (267 | ) | (4,336 | ) | ||||||||
| Recoveries of loans previously charged off |
18 | 40 | 10 | 68 | ||||||||||||
|
|
|
|
|
|
|
|
|
|||||||||
| Ending balance |
$ | 7,254 | $ | 1,885 | $ | 126 | $ | 9,265 | ||||||||
|
|
|
|
|
|
|
|
|
|||||||||
| Ending balance – individually evaluated for impairment |
$ | 203 | $ | 102 | $ | — | $ | 305 | ||||||||
| Ending balance – collectively evaluated for impairment |
7,044 | 1,783 | 126 | 8,953 | ||||||||||||
| Ending balance – loans acquired with deteriorated credit quality |
7 | — | — | 7 | ||||||||||||
|
|
|
|
|
|
|
|
|
|||||||||
| Total ending balance |
$ | 7,254 | $ | 1,885 | $ | 126 | $ | 9,265 | ||||||||
|
|
|
|
|
|
|
|
|
|||||||||
| Loans: |
||||||||||||||||
| Ending balance – individually evaluated for impairment |
$ | 16,206 | $ | 315 | $ | — | $ | 16,521 | ||||||||
| Ending balance – collectively evaluated for impairment |
668,969 | 139,450 | 11,949 | 820,368 | ||||||||||||
| Ending balance – loans acquired with deteriorated credit quality |
2,094 | — | 6 | 2,100 | ||||||||||||
|
|
|
|
|
|
|
|
|
|||||||||
| Total ending balance |
$ | 687,269 | $ | 139,765 | $ | 11,955 | $ | 838,989 | ||||||||
|
|
|
|
|
|
|
|
|
|||||||||
F-64
Table of Contents
NOTES TO CONSOLIDATED FINANCIAL STATEMENTS
(In thousands, except per share amounts)
| NOTE 4. | LOANS (Continued) |
Impaired Loans
A loan held for investment is considered impaired when, based on current information and events, it is probable that we will be unable to collect all amounts due (both principal and interest) according to the terms of the loan agreement. The following tables detail our impaired loans, by portfolio class as of December 31, 2020 and 2019:
| Recorded Investment |
Unpaid Principal Balance |
Related Allowance |
Average Recorded Investment |
Interest Income Recognized |
||||||||||||||||
| December 31, 2020 |
||||||||||||||||||||
| With no related allowance recorded: |
||||||||||||||||||||
| Real estate mortgages: |
||||||||||||||||||||
| Construction and development |
$ | 977 | $ | 977 | $ | $ | 970 | $ | 18 | |||||||||||
| Residential |
1,537 | 1,537 | — | 1,669 | 93 | |||||||||||||||
| Commercial |
5,117 | 5,117 | — | 5,425 | 290 | |||||||||||||||
| Commercial and industrial |
65 | 65 | — | 91 | 6 | |||||||||||||||
| Consumer and other |
22 | 22 | — | 24 | 2 | |||||||||||||||
|
|
|
|
|
|
|
|
|
|
|
|||||||||||
| Total with no related allowance recorded |
7,718 | 7,718 | — | 8,179 | 409 | |||||||||||||||
|
|
|
|
|
|
|
|
|
|
|
|||||||||||
| With an allowance recorded: |
||||||||||||||||||||
| Real estate mortgages: |
||||||||||||||||||||
| Construction and development |
644 | 644 | 106 | 668 | 34 | |||||||||||||||
| Residential |
1,557 | 1,628 | 628 | 1,636 | 82 | |||||||||||||||
| Commercial |
3,373 | 3.373 | 847 | 3,526 | 194 | |||||||||||||||
| Commercial and industrial |
791 | 791 | 478 | 886 | 58 | |||||||||||||||
| Consumer and other |
15 | 15 | 7 | 15 | — | |||||||||||||||
|
|
|
|
|
|
|
|
|
|
|
|||||||||||
| Total with an allowance recorded |
6,380 | 6,451 | 2,066 | 6,731 | 368 | |||||||||||||||
|
|
|
|
|
|
|
|
|
|
|
|||||||||||
| Total impaired loans: |
$ | 14,098 | $ | 14,169 | $2,066 | $ | 14,910 | $ | 777 | |||||||||||
|
|
|
|
|
|
|
|
|
|
|
|||||||||||
| December 31, 2019 |
||||||||||||||||||||
| With no related allowance recorded: |
||||||||||||||||||||
| Real estate mortgages: |
||||||||||||||||||||
| Construction and development |
$ | 2,011 | $ | 2,011 | $ | — | $ | 2,110 | $ | 63 | ||||||||||
| Residential |
1,918 | 1,989 | — | 2,068 | 125 | |||||||||||||||
| Commercial |
12,628 | 12,628 | — | 12,694 | 475 | |||||||||||||||
| Commercial and industrial |
— | — | — | — | — | |||||||||||||||
| Consumer and other |
7 | 7 | — | 40 | 1 | |||||||||||||||
|
|
|
|
|
|
|
|
|
|
|
|||||||||||
| Total with no related allowance recorded |
16,564 | 16,635 | — | 16,912 | 664 | |||||||||||||||
|
|
|
|
|
|
|
|
|
|
|
|||||||||||
| With an allowance recorded: |
||||||||||||||||||||
| Real estate mortgages: |
||||||||||||||||||||
| Construction and development |
65 | 65 | 3 | 64 | 4 | |||||||||||||||
| Residential |
552 | 552 | 102 | 569 | 20 | |||||||||||||||
| Commercial |
1,126 | 1,126 | 105 | 1,171 | 56 | |||||||||||||||
| Commercial and industrial |
315 | 315 | 102 | 346 | 20 | |||||||||||||||
| Consumer and other |
— | — | — | — | — | |||||||||||||||
|
|
|
|
|
|
|
|
|
|
|
|||||||||||
| Total with an allowance recorded |
2,058 | 2,058 | 312 | 2,150 | 100 | |||||||||||||||
|
|
|
|
|
|
|
|
|
|
|
|||||||||||
| Total impaired loans: |
$ | 18,622 | $ | 18,693 | $ | 312 | $ | 19,062 | $ | 764 | ||||||||||
|
|
|
|
|
|
|
|
|
|
|
|||||||||||
F-65
Table of Contents
NOTES TO CONSOLIDATED FINANCIAL STATEMENTS
(In thousands, except per share amounts)
| NOTE 4. | LOANS (Continued) |
Purchased Impaired Loans
The Company elected to account for impaired loans acquired in acquisitions under ASC 310-30. ASC 310-30, Loans and Debt Securities Acquired with Deteriorated Credit Quality, applies to a loan with evidence of deterioration of credit quality since origination, acquired by completion of a transfer for which it is probable, at acquisition, that the investor will be unable to collect all contractually required payments receivable. ASC 310 prohibits carrying over or creating an allowance for loan losses upon initial recognition for loans which fall under the scope of this statement.
The outstanding balance of acquired Columbus Community Bank (2015) loans with deteriorated credit quality at the time of acquisition was $2,562, with the fair value of these loans totaling $2,174. The variation between the outstanding balance and the fair value of acquired loans with deteriorated credit quality was due to a non-accretable fair market value adjustment of $388. As of December 31, 2020, and 2019, the outstanding balance of these loans was $821 and $730. There were no non-accretable differences as of December 31, 2020 and 2019.
The outstanding balance of acquired Alabama Trust Bank, N.A. (2012) loans with deteriorated credit quality at the time of acquisition was $5,466, with the fair value of these loans totaling $4,219. The variation between the outstanding balance and the fair value of acquired loans with deteriorated credit quality was due to a non-accretable fair market value adjustment of $1,247. As of December 31, 2020, and 2019, the outstanding balance of these loans was $857 and $1,370. There were no non-accretable differences as of December 31, 2020 and 2019.
The Company did not identify any loans with deteriorated credit quality at the time of acquisition of Small Town Bank.
Accretable Yield
Changes in the accretable yield, or income expected to be collected, on the purchased non-impaired loans for the years ended December 31, 2020 and 2019 were as follows:
| Years Ended December 31, | ||||||||
| 2020 | 2019 | |||||||
| Balance, beginning of year |
$ | 1,327 | $ | 517 | ||||
| Additions |
— | 1,563 | ||||||
| Accretion |
(543 | ) | (753 | ) | ||||
|
|
|
|
|
|||||
| Balance, end of year |
$ | 784 | $ | 1,327 | ||||
|
|
|
|
|
|||||
Disposals of loans with accretable yield for the years ending December 31, 2020 and 2019 were not significant.
Troubled Debt Restructurings
As of December 31, 2020, and 2019, impaired loans included $1,754 and $3,025, respectively, in loans that were classified as Troubled Debt Restructurings (TDRs). The restructuring of a loan is considered a TDR if both (i) the borrower is experiencing financial difficulties and (ii) the Company has granted a concession.
In assessing whether a borrower is experiencing financial difficulties, the Company considers information currently available regarding the financial condition of the borrower. This information
F-66
Table of Contents
NOTES TO CONSOLIDATED FINANCIAL STATEMENTS
(In thousands, except per share amounts)
| NOTE 4. | LOANS (Continued) |
Troubled Debt Restructurings (Continued)
includes, but is not limited to, whether (i) the borrower is currently in payment default on any of its debt; (ii) a payment default is probable in the foreseeable future without the modification; (iii) the borrower has declared or is in the process of declaring bankruptcy and (iv) the borrower’s projected cash flow is sufficient to satisfy contractual payments due under the original terms of the loan without a modification.
The Company considers all aspects of the modification to loan terms to determine whether or not a concession has been granted to the borrower. Key factors considered by the Company include the borrower’s ability to access funds at a market rate for debt with similar risk characteristics, the significance of the modification relative to unpaid principal balance or collateral value of the debt, and the significance of a delay in the timing of payments relative to the original contractual terms of the loan. The most common concessions granted by the Company generally include one or more modifications to the terms of the debt, such as (i) a reduction in the interest rate for the remaining life of the debt, (ii) an extension of the maturity date at an interest rate lower than the current market rate for new debt with similar risk, (iii) a temporary period of interest-only payments, and (iv) a reduction in the contractual payment amount for either a short period or remaining term of the loan.
As of December 31, 2020, and 2019, the Company had $1,275 and $2,712, respectively, in loans considered restructured that are not on nonaccrual status. Of the nonaccrual loans at December 31, 2020 and 2019, $479 and $313, respectively, met the criteria for a TDR. A loan is placed back on accrual status when both principal and interest are current, and it is probable that the Company will be able to collect all amounts due (both principal and interest) according to the terms of the loan agreement.
Recorded investment prior to modification reflects the Company’s recorded investment immediately before the modification. Recorded investment after modification represents the Company’s recorded investment at the end of the year. The following table summarizes the loans that were modified as a TDR during the years ended December 31, 2020 and 2019.
| Troubled-Debt Restructurings | ||||||||||||||||
| Number of Loans |
Recorded Investment Prior to Modification |
Recorded Investment After Modification |
Impact on the Allowance for Loan Losses |
|||||||||||||
| December 31, 2020 |
||||||||||||||||
| Real estate mortgages: |
||||||||||||||||
| Construction and development |
— | $ | — | $ | — | $ | — | |||||||||
| Residential |
— | — | — | — | ||||||||||||
| Commercial |
— | — | — | — | ||||||||||||
| Commercial and industrial |
1 | 277 | 271 | 271 | ||||||||||||
| Consumer and other |
1 | 16 | 15 | 7 | ||||||||||||
|
|
|
|
|
|
|
|
|
|||||||||
| Total |
2 | $ | 293 | $ | 286 | $ | 278 | |||||||||
|
|
|
|
|
|
|
|
|
|||||||||
F-67
Table of Contents
NOTES TO CONSOLIDATED FINANCIAL STATEMENTS
(In thousands, except per share amounts)
| NOTE 4. | LOANS (Continued) |
Troubled Debt Restructurings (Continued)
| Troubled-Debt Restructurings | ||||||||||||||||
| Number of Loans |
Recorded Investment Prior to Modification |
Recorded Investment After Modification |
Impact on the Allowance for Loan Losses |
|||||||||||||
| December 31, 2019 |
||||||||||||||||
| Real estate mortgages: |
||||||||||||||||
| Construction and development |
— | $ | — | $ | — | $ | — | |||||||||
| Residential |
— | — | — | — | ||||||||||||
| Commercial |
1 | 288 | 286 | 49 | ||||||||||||
| Commercial and industrial |
1 | 13 | 12 | — | ||||||||||||
| Consumer and other |
— | — | — | — | ||||||||||||
|
|
|
|
|
|
|
|
|
|||||||||
| Total |
2 | $ | 301 | $ | 298 | $ | 49 | |||||||||
|
|
|
|
|
|
|
|
|
|||||||||
The Company considers a loan to have defaulted when it becomes 90 or more days delinquent under the modified terms, has been transferred to nonaccrual status subsequent to the modification or has been transferred to foreclosed assets. As of December 31, 2020, no loans modified in a TDR over the last twelve months, subsequently defaulted. As of December 31, 2019, one commercial and industrial loan in the amount of $12 modified in a TDR over the last twelve months, subsequently defaulted.
Related Party Transactions
In the ordinary course of business, the Company has granted loans to certain related parties, including directors, executive officers, and their affiliates. The interest rates on these loans were substantially the same as rates prevailing at the time of the transaction and repayment terms are customary for the type of loan. Changes in related party loans for the years ended December 31, 2020 and 2019 are as follows:
| Years Ended December 31, | ||||||||
| 2020 | 2019 | |||||||
| Balance, beginning of year |
$ | 6,809 | $ | 7,417 | ||||
| Advances |
3,952 | 4,247 | ||||||
| Repayments |
(2,720 | ) | (4,855 | ) | ||||
|
|
|
|
|
|||||
| Balance, end of year |
$ | 8,041 | $ | 6,809 | ||||
|
|
|
|
|
|||||
F-68
Table of Contents
NOTES TO CONSOLIDATED FINANCIAL STATEMENTS
(In thousands, except per share amounts)
| NOTE 5. | FORECLOSED ASSETS |
A summary of foreclosed assets is presented as follows:
| December 31, | ||||||||
| 2020 | 2019 | |||||||
| Balance, beginning of year |
$ | 7,042 | $ | 572 | ||||
| Acquired through settlement of loans |
10,088 | 6,624 | ||||||
| Sales proceeds |
(5,910 | ) | (199 | ) | ||||
| Write-downs |
(920 | ) | (14 | ) | ||||
| Rent payments |
— | (3 | ) | |||||
| Net gain on sales of foreclosed assets |
76 | 62 | ||||||
| Receivable from SBA |
(152 | ) | — | |||||
|
|
|
|
|
|||||
| Balance, end of year |
$ | 10,224 | $ | 7,042 | ||||
|
|
|
|
|
|||||
Net expenses related to foreclosed assets include the following:
| Years Ended December 31, | ||||||||
| 2020 | 2019 | |||||||
| Net gain on sales of foreclosed assets |
$ | (76 | ) | $ | (62 | ) | ||
| Write-downs |
920 | 14 | ||||||
| Operating expenses, net of rental income |
102 | 317 | ||||||
|
|
|
|
|
|||||
| $ | 946 | $ | 269 | |||||
|
|
|
|
|
|||||
The carrying amount of other real estate owned categorized as residential real estate at December 31, 2020 and 2019 was $145 and $705, respectively.
| NOTE 6. | PREMISES AND EQUIPMENT |
Premises and equipment is summarized as follows:
| December 31, | ||||||||
| 2020 | 2019 | |||||||
| Land and land improvements |
$ | 8,169 | $ | 4,419 | ||||
| Building |
21,109 | 18,733 | ||||||
| Furniture and equipment |
7,260 | 7,219 | ||||||
|
|
|
|
|
|||||
| 36,538 | 30,371 | |||||||
| Accumulated depreciation |
(12,112 | ) | (10,245 | ) | ||||
|
|
|
|
|
|||||
| $ | 24,426 | $ | 20,126 | |||||
|
|
|
|
|
|||||
Leases
The Company leases certain office facilities under long-term operating lease agreements. The leases expire at various dates through 2024 and some include renewal options. Many of these leases require the payment of property taxes, insurance premiums, maintenance, utilities and other costs. In many cases, rentals are subject to increase in relation to a cost-of-living index. The Company accounts for lease and non-lease components together as a single lease component. The Company determines if
F-69
Table of Contents
NOTES TO CONSOLIDATED FINANCIAL STATEMENTS
(In thousands, except per share amounts)
| NOTE 6. | PREMISES AND EQUIPMENT (Continued) |
Leases (Continued)
an arrangement is a lease at inception. The Company’s lease terms may include options to extend or terminate the lease when it is reasonably certain that the Company will exercise that option.
Future minimum lease payments on the leases described above, excluding any renewal options, are summarized as follows:
| 2021 | $ | 453 | ||
| 2022 | 159 | |||
| 2023 | 142 | |||
| 2024 | 58 | |||
|
|
|
|||
| $ | 812 | |||
|
|
|
Rental expense included in the consolidated statements of income for the years ended December 31, 2020 and 2019 is $473 and $490, respectively.
| NOTE 7. | DEPOSITS |
Major classifications of deposits are as follows:
| December 31, | ||||||||
| 2020 | 2019 | |||||||
| Noninterest-bearing transaction |
$ | 290,867 | $ | 188,270 | ||||
| Interest-bearing transaction |
475,757 | 372,751 | ||||||
| Savings |
42,731 | 31,362 | ||||||
| Time deposits, $250,000 and under |
293,707 | 311,888 | ||||||
| Time deposits, over $250,000 |
36,599 | 46,242 | ||||||
|
|
|
|
|
|||||
| $ | 1,139,661 | $ | 950,513 | |||||
|
|
|
|
|
|||||
Brokered deposits totaled approximately $34,151 and $35,172 at December 31, 2020 and 2019. The scheduled maturities of time deposits at December 31, 2020 are as follows:
| 2021 |
$ | 265,668 | ||
| 2022 |
35,148 | |||
| 2023 |
9,132 | |||
| 2024 |
16,847 | |||
| 2025 |
3,268 | |||
| Thereafter |
243 | |||
|
|
|
|||
| $ | 330,306 | |||
|
|
|
At December 31, 2020 and 2019, overdrawn transaction accounts reclassified to loans totaled $166 and $195, respectively.
Deposits from related parties held by the Company at December 31, 2020 and 2019 totaled $9,976 and $13,333, respectively.
F-70
Table of Contents
NOTES TO CONSOLIDATED FINANCIAL STATEMENTS
(In thousands, except per share amounts)
| NOTE 8. | BORROWINGS |
Note payable and subordinated notes consist of the following:
| December 31, | ||||||||
| 2020 | 2019 | |||||||
| Short-term variable $25 million line of credit with interest due quarterly at 90-Day LIBOR + 2.50%, maturity August 2022 |
$ | 7,975 | $ | 7,984 | ||||
| Short-term fixed rate Federal Home Loan Bank advances with interest and principal payments due at various maturity dates through 2022 and interest rates ranging from .31% to 1.52%. |
30,900 | — | ||||||
| Subordinated notes with interest due semi-annually beginning January 1, 2017 at a fixed rate of 6.625% through July 2021, then quarterly interest due based on LIBOR + 5.412% through maturity on July 1, 2026. |
4,493 | 4,478 | ||||||
|
|
|
|
|
|||||
| $ | 43,368 | 12,462 | ||||||
|
|
|
|
|
|||||
Contractual maturities of other borrowings as of December 31, 2020 are as follows:
| 2021 |
$ | 16,950 | ||
| 2022 |
21,925 | |||
| 2023 |
— | |||
| 2024 |
— | |||
| 2025 |
— | |||
| Thereafter |
4,493 | |||
|
|
|
|||
| $ | 43,368 | |||
|
|
|
The short-term variable $25 million line of credit from First Horizon Bank is collateralized by 100% of the capital stock of the Bank.
Advances from the Federal Home Loan Bank of Atlanta are secured by a blanket floating lien on qualifying commercial mortgages of approximately $72,218, residential mortgages of approximately $19,071, and on qualifying home equity lines of credit of approximately $5,316. At December 31, 2020 the Company had $30,900 in outstanding advances and approximately $65,706 was available for borrowing on lines with the FHLB.
At December 31, 2020, the Company has accommodations which allow the purchase of federal funds from several correspondent banks on an overnight basis at prevailing overnight market rates. These accommodations are subject to various restrictions as to their term and availability, and in most cases, must be repaid in less than a month. At December 31, 2020 and 2019, the Company had $0 outstanding under these arrangements. The Company may borrow up to $75,700 under these arrangements as of December 31, 2020.
Subordinated Notes
On June 23, 2016, the Company issued $4,500 of Fixed-to-Floating Rate Subordinated Notes due July 2026 (the “Notes”). The Notes will initially bear interest at 6.625% per annum, payable semi-annually in arrears on January 1 and July 1 of each year, commencing on January 1, 2017 until July 1, 2021. Thereafter and to, but excluding, the maturity date or earlier redemption, interest shall be payable quarterly in arrears, at an annual floating rate equal to three-month LIBOR as determined for the
F-71
Table of Contents
NOTES TO CONSOLIDATED FINANCIAL STATEMENTS
(In thousands, except per share amounts)
| NOTE 8. | BORROWINGS (Continued) |
Subordinated Notes (Continued)
applicable quarterly period, plus 5.412%. The Company may, at its option, beginning on July 1, 2021 and on any scheduled interest payment date thereafter, redeem the Notes, in whole or in part, at a redemption price equal to the outstanding principal amount of the Notes to be redeemed plus accrued and unpaid interest to, but excluding, the date of redemption. Issuance costs related to the Notes totaled $79 and have been netted against the subordinated notes liability on the balance sheet. At December 31, 2020 and 2019, the remaining balance of the debt issuance cost was $7 and $22, respectively. The debt issuance costs are being amortized using the straight line method over sixty months and are recorded as a component of interest expense.
| NOTE 9. | DERIVATIVE INSTRUMENTS AND HEDGING ACTIVITIES |
Risk Management Objective of Using Derivatives
The Company is exposed to certain risk arising from both its business operations and economic conditions. The Company principally manages its exposures to a wide variety of business and operational risks through management of its core business activities. The Company manages economic risks, including interest rate, liquidity, and credit risk primarily by managing the amount, sources, and duration of its assets and liabilities and the use of derivative financial instruments. Specifically, the Company enters into derivative financial instruments to manage exposures that arise from business activities that result in the receipt or payment of future known and uncertain cash amounts, the value of which are determined by interest rates.
Non-designated Hedges
Derivatives not designated as hedges are not speculative and result from a service the Company provides to certain customers. The Company executes interest rate swaps with commercial banking customers to facilitate their respective risk management strategies. Those interest rate swaps are simultaneously hedged by offsetting derivatives that the Company executes with a third party, such that the Company minimizes its net risk exposure resulting from such transactions. As the interest rate derivatives associated with this program do not meet the strict hedge accounting requirements, changes in the fair value of both the customer derivatives and the offsetting derivatives are recognized directly in earnings.
Tabular Disclosure of Fair Values of Derivative Instruments on the Balance Sheet
The table below presents the fair value of the Company’s derivative financial instruments including the effects of offsetting as well as their classification on the consolidated balance sheets as of December 31, 2020 and December 31, 2019. As of December 31, 2020, the Company has posted cash collateral of $910. The amount of loss recognized in income on derivatives as a fair value adjustment and fee income, as of December 31, 2020, were $30 and $1,435, respectively.
| December 31, 2020 |
December 31, 2019 |
|||||||||||||||
| Derivatives not |
Notional Amount |
Balance Sheet |
Fair Value |
Balance Sheet |
Fair Value |
|||||||||||
| Interest Rate Products |
$ | 49,664 | Other Assets | $ | 983 | Other Assets | $ | — | ||||||||
| Interest Rate Products |
49,664 | Other Liabilities | (1,013 | ) | Other Liabilities | — | ||||||||||
F-72
Table of Contents
NOTES TO CONSOLIDATED FINANCIAL STATEMENTS
(In thousands, except per share amounts)
| NOTE 9. | DERIVATIVE INSTRUMENTS AND HEDGING ACTIVITIES (Continued) |
Credit-risk-related Contingent Features
Applicable for OTC derivatives with dealers
The company has agreements with each of its derivative counterparties that contain a provision where if the Company defaults on any of its indebtedness, including default where repayment of the indebtedness has not been accelerated by the lender, then the company could also be declared in default on its derivative obligations.
The Company has agreements with certain of its derivative counterparties that contain a provision where if the company fails to maintain its status as a well / adequate capitalized institution, then the Company could be required to post additional collateral.
As of December 31, 2020, the fair value of derivatives in a net liability position, which includes accrued interest but excludes any adjustment for nonperformance risk, related to these agreements was $1,035. If the Company had breached any of these provisions at December 31, 2020, it could have been required to settle its obligations under the agreements at their termination value of $1,035, less the required collateral of $910.
| NOTE 10. | EMPLOYEE AND DIRECTOR BENEFITS |
Incentive Stock Option Plan
The Company adopted an Incentive Stock Compensation Plan during 2007 which grants directors, key employees and others options to purchase shares of common stock of the Company. Options may be granted as incentive stock options or nonqualified stock options depending on the eligibility of the recipient. Option prices and terms are determined by a committee appointed by the Board of Directors. The plan provides for a total of 450,000 options to purchase common shares of the Company. During 2016, the Board of Directors of the Company approved to increase the total number of options available to the Plan from 450,000 to 675,000. In December 2017, the Board of Directors of the Company approved to further increase the total number of options available to the Plan from 675,000 to 975,000. During 2020, the Board of Directors of the Company approved to increase the total number of options available to the Plan from 975,000 to 1,400,000. As of December 31, 2020, there are 530,335 options under the plan available to be granted.
Other pertinent information related to the options is as follows:
| Number | Weighted- Average Exercise Price |
|||||||
| Year Ended December 31, 2020: |
||||||||
| Options outstanding, beginning of year |
373,392 | $ | 13.55 | |||||
| Granted |
113,086 | 19,49 | ||||||
| Exercised |
(1,000 | ) | 10.00 | |||||
| Forfeited |
(5,000 | ) | 14.20 | |||||
|
|
|
|||||||
| Options outstanding, end of year |
480,478 | $ | 14.95 | |||||
|
|
|
|||||||
| Exercisable, end of year |
216,677 | $ | 12.67 | |||||
|
|
|
|||||||
| Weighted-average remaining contractual life |
7.26 years | |||||||
F-73
Table of Contents
NOTES TO CONSOLIDATED FINANCIAL STATEMENTS
(In thousands, except per share amounts)
| NOTE 10. | EMPLOYEE AND DIRECTOR BENEFITS (Continued) |
Incentive Stock Option Plan (Continued)
| Number | Weighted- Average Exercise Price |
|||||||
| Year Ended December 31, 2019: |
||||||||
| Options outstanding, beginning of year |
318,000 | $ | 12.15 | |||||
| Granted |
90,392 | 17.12 | ||||||
| Exercised |
— | — | ||||||
| Forfeited |
(35,000 | ) | 10.00 | |||||
|
|
|
|||||||
| Options outstanding, end of year |
373,392 | $ | 13.55 | |||||
|
|
|
|||||||
| Exercisable, end of year |
123,131 | $ | 11.65 | |||||
|
|
|
|||||||
| Weighted-average remaining contractual life |
7.64 years | |||||||
During 2019 and 2020, there were no vested stock options exchanged in a cashless exercise.
For the years ended December 31, 2020 and 2019, the Company recognized $349 and $220, respectively, in stock-based compensation expense related to stock option awards. As of December 31, 2020 and 2019, there is $587 and $473, respectively, of total unrecognized compensation cost related to nonvested share-based compensation arrangements granted under the plan. The cost is expected to be recognized over a weighted-average period of 1.90 years.
The fair value of each stock option award is estimated on the date of grant using a Black-Scholes-Merton valuation model that uses the assumptions noted in the following table. Expected volatilities are based on an average of traded community banks. The Company considers historical data and peer group data to estimate option exercise and employee termination within the valuation model; separate groups of employees that have similar historical exercise behavior are considered separately for valuation purposes. The expected term of options granted is based on the short-cut method and represents the period of time that options granted are expected to be outstanding. The risk-free rate for periods within the contractual life of the option is based on the U.S. Treasury yield curve in effect at the time of grant.
The following weighted-average assumptions were used in the calculations for 2020 and 2019 as follows:
| 2020 | 2019 | |||||||
| Dividend yield |
2.50 | % | 2.50 | % | ||||
| Weighted-average volatility |
29.15 | % | 19.88 | % | ||||
| Expected life in years |
6.68 years | 7.00 years | ||||||
| Risk-free interest rate |
1.56 | % | 2.46 | % | ||||
| Weighted-average grant-date fair value |
$ | 4.22 | $ | 2.90 | ||||
F-74
Table of Contents
NOTES TO CONSOLIDATED FINANCIAL STATEMENTS
(In thousands, except per share amounts)
| NOTE 10. | EMPLOYEE AND DIRECTOR BENEFITS (Continued) |
Restricted Stock
During 2013 the Company amended the 2007 Incentive Stock Compensation Plan to allow for restricted stock awards. The Company awarded 22,869 shares of restricted stock during 2020 and 24,809 in 2019. The restriction is based upon continuous service and the shares will vest equally over three to five years. Nonvested restricted stock consists of the following:
| Restricted Shares |
Weighted- Average Market Price At Grant Date |
|||||||
| Year Ended December 31, 2020: |
||||||||
| Nonvested, at beginning of year |
34,389 | $ | 16.06 | |||||
| Granted |
22,869 | 19.35 | ||||||
| Forfeited |
(268 | ) | 20.10 | |||||
| Vested |
(17,821 | ) | 16.39 | |||||
|
|
|
|
|
|||||
| Nonvested, at end of year |
39,169 | $ | 17.80 | |||||
|
|
|
|
|
|||||
| Year Ended December 31, 2019: |
||||||||
| Nonvested, at beginning of year |
18,224 | $ | 10.00 | |||||
| Granted |
24,809 | 19.20 | ||||||
| Forfeited |
(66 | ) | 22.75 | |||||
| Vested |
(8,578 | ) | 12.26 | |||||
|
|
|
|
|
|||||
| Nonvested, at end of year |
34,389 | $ | 16.06 | |||||
|
|
|
|
|
|||||
As of December 31, 2020, there was $439 of unrecognized compensation cost related to nonvested restricted stock awards. Expense for restricted stock awards of $390 and $212 was recorded for the years ended December 31, 2020 and 2019, respectively.
Supplemental Executive Retirement Plan
The Company sponsors a supplemental executive retirement plan (SERP) providing for death and retirement benefits for certain executive officers. In connection with the SERP plan, the Company has purchased annuity contracts and bank owned life insurance from various insurance entities. The Company is the annuity owner throughout the term of the contract and as such, the annuity payments are paid directly to the Company. The Company in turn will make the benefit payments to the executives upon retirement over the executives’ life using the funds received from the annuity contracts. The Company will accrue the total obligation under the SERP over the executive’s future service period to the date full eligibility for the benefit is attained. The amounts to be accrued shall result in an accrued amount at the full eligibility date equal to the then present value of all of the future benefits expected to be paid.
The Company has recorded a liability as of December 31, 2020 and 2019, amounting to $2,990 and $2,502, respectively, for the present value of the future benefits to be paid under the SERP, which is recorded in other liabilities on the consolidated balance sheets. Expense related to the SERP totaled $487 and $643 for the years ended December 31, 2020 and 2019, respectively.
F-75
Table of Contents
NOTES TO CONSOLIDATED FINANCIAL STATEMENTS
(In thousands, except per share amounts)
| NOTE 10. | EMPLOYEE AND DIRECTOR BENEFITS (Continued) |
Bank Owned Life Insurance
Investments in bank-owned life insurance programs are recorded at their respective cash surrender values. The cash surrender value and net interest earned on the related policies amounted to $22,458 and $528, respective, as of and for the year ended December 31, 2020 and $22,078 and $470, respectively, as of and for the year ended December 31, 2019.
| NOTE 11. | INCOME TAXES |
Income tax expense consists of the following:
| Years Ended December 31, | ||||||||
| 2020 | 2019 | |||||||
| Current |
$ | 4,113 | $ | 2,692 | ||||
| Deferred |
(1,587 | ) | (206 | ) | ||||
|
|
|
|
|
|||||
| Income tax expense |
$ | 2,526 | $ | 2,486 | ||||
|
|
|
|
|
|||||
The Company’s income tax expense differs from the amounts computed by applying the federal income tax statutory rates to income before income taxes. A reconciliation of the differences as of December 31, 2020 and 2019 is as follows:
| Years Ended December 31, | ||||||||
| 2020 | 2019 | |||||||
| Income tax expense at federal statutory rate |
$ | 3,073 | $ | 1,698 | ||||
| State income tax |
465 | 386 | ||||||
| Tax exempt income |
(170 | ) | (166 | ) | ||||
| Nondeductible merger (credit) expenses |
(685 | ) | 576 | |||||
| Other |
(157 | ) | (8 | ) | ||||
|
|
|
|
|
|||||
| Income tax expense |
$ | 2,526 | $ | 2,486 | ||||
|
|
|
|
|
|||||
The components of deferred income taxes are as follows:
| December 31, | ||||||||
| 2020 | 2019 | |||||||
| Deferred income tax assets: |
||||||||
| Loan loss reserves |
$ | 2,982 | $ | 2,270 | ||||
| Pre-opening and organization expenses |
36 | 58 | ||||||
| Deferred compensation |
904 | 779 | ||||||
| Other real estate owned |
— | 1 | ||||||
| Intangible assets created from asset purchase |
40 | 46 | ||||||
| Loans purchased at a premium |
142 | 347 | ||||||
| Restricted stock |
32 | 6 | ||||||
| Other |
— | 27 | ||||||
| Deferred origination fees |
642 | — | ||||||
|
|
|
|
|
|||||
| 4,778 | 3,534 | |||||||
|
|
|
|
|
|||||
F-76
Table of Contents
NOTES TO CONSOLIDATED FINANCIAL STATEMENTS
(In thousands, except per share amounts)
| NOTE 11. | INCOME TAXES (Continued) |
| December 31, | ||||||||
| 2020 | 2019 | |||||||
| Deferred income tax liabilities: |
||||||||
| Loans purchased at a discount |
163 | 241 | ||||||
| Depreciation |
208 | 518 | ||||||
| Intangible assets created from stock purchase |
461 | 531 | ||||||
| Other |
115 | — | ||||||
| Securities available for sale |
1,122 | 93 | ||||||
|
|
|
|
|
|||||
| 2,069 | 1,383 | |||||||
|
|
|
|
|
|||||
| Net deferred income tax asset |
$ | 2,709 | $ | 2,151 | ||||
|
|
|
|
|
|||||
The Company and its subsidiary are subject to U.S. federal income tax, as well as income tax within the States of Alabama and Georgia. The Company is no longer subject to examination by taxing authorities for years before 2017.
The deferred income tax asset is recorded in “Other assets” on the consolidated balance sheets.
| NOTE 12. | COMMITMENTS AND CONTINGENCIES |
Loan Commitments
The Company is a party to financial instruments with off-balance sheet risk in the normal course of business to meet the financing needs of its customers. These financial instruments include commitments to extend credit and standby letters of credit. Such commitments involve, to varying degrees, elements of credit risk and interest rate risk in excess of the amount recognized in the balance sheets. The majority of all commitments to extend credit and standby letters of credit are variable rate instruments.
The Company’s exposure to credit loss in the event of nonperformance by the other party to the financial instrument for commitments to extend credit is represented by the contractual amount of those instruments. The Company uses the same credit policies in making commitments as it does for on-balance sheet instruments. A summary of the Company’s commitments is as follows:
| December 31, | ||||||||
| 2020 | 2019 | |||||||
| Commitments to extend credit |
$ | 181,925 | $ | 170,955 | ||||
| Standby letters of credit |
2,814 | 2,636 | ||||||
|
|
|
|
|
|||||
| $ | 184,739 | $ | 173,591 | |||||
|
|
|
|
|
|||||
Commitments to extend credit are agreements to lend to a customer as long as there is no violation of any condition established in the contract. Commitments generally have fixed expiration dates or other termination clauses and may require payment of a fee. Since many of the commitments are expected to expire without being drawn upon, the total commitment amounts do not necessarily represent future cash requirements. The amount of collateral obtained, if deemed necessary by the Company upon extension of credit, is based on management’s credit evaluation of the customer. Collateral held varies, but may include accounts receivable, inventory, property and equipment, residential real estate, and income-producing commercial properties.
F-77
Table of Contents
NOTES TO CONSOLIDATED FINANCIAL STATEMENTS
(In thousands, except per share amounts)
| NOTE 12. | COMMITMENTS AND CONTINGENCIES (Continued) |
Loan Commitments (Continued)
Standby letters of credit are conditional commitments issued by the Company to guarantee the performance of a customer to a third party. Those letters of credit are primarily issued to support public and private borrowing arrangements. The credit risk involved in issuing letters of credit is essentially the same as that involved in extending loans to customers. Collateral held varies and is required in instances which the Company deems necessary.
The Company has not been required to perform on any standby letters of credit, and the Company has not incurred any losses on financial standby letters of credit for the years ended December 31, 2020 and 2019.
Contingencies
In the normal course of business, the Company is involved in various legal proceedings. In the opinion of management, any liability resulting from such proceedings would not have a material effect on the Company’s financial statements.
| NOTE 13. | CONCENTRATIONS OF CREDIT |
The Company originates primarily commercial, commercial real estate, residential real estate, and consumer loans to customers in Alabama and Georgia. The ability of the majority of the Company’s customers to honor their contractual loan obligations is dependent on the economy in these areas.
Seventy-four percent of the Company’s loan portfolio is concentrated in real estate. A substantial portion of these loans are secured by real estate in the Company’s primary market area. In addition, a substantial portion of the other real estate owned is located in those same markets. Accordingly, the ultimate collectibility of the loan portfolio and the recovery of the carrying amount of the other real estate owned are susceptible to changes in market conditions in the Company’s primary market area. The other concentrations of credit by type of loan are set forth in Note 4.
The Company, according to regulatory restrictions, may not generally extend credit to any single borrower or group of related borrowers on a secured basis in excess of 20% of capital, as defined, or approximately $28,358 or on an unsecured basis in excess of 10% of capital, as defined, or approximately $14,179.
| NOTE 14. | STOCKHOLDERS’ EQUITY |
In September 2019, the Company issued 1,142,846 shares of common stock in connection with the acquisition of East Alabama Financial Group, Inc. The shares were issued at a value of $22.75 per share.
As of December 31, 2020, the Company had 7,678,195 shares of common stock issued and outstanding, of which 805,715 shares were non-voting.
| NOTE 15. | REGULATORY MATTERS |
The Bank is subject to certain restrictions on the amount of dividends that may be declared without prior regulatory approval. At December 31, 2020, approximately $3,255 of retained earnings was available for dividend declaration without regulatory approval.
The Bank is also subject to various regulatory capital requirements administered by the federal banking agencies. Failure to meet minimum capital requirements can initiate certain mandatory, and possibly additional discretionary actions by regulators that, if undertaken, could have a direct material
F-78
Table of Contents
NOTES TO CONSOLIDATED FINANCIAL STATEMENTS
(In thousands, except per share amounts)
| NOTE 15. | REGULATORY MATTERS (Continued) |
effect on the Bank’s financial statements. Under capital adequacy guidelines and the regulatory framework for prompt corrective action, the Bank must meet specific capital guidelines that involve quantitative measures of its assets, liabilities, and certain off-balance sheet items as calculated under regulatory accounting practices. Capital amounts and classification are also subject to qualitative judgments by the regulators about components, risk weightings, and other factors.
Quantitative measures established by regulation to ensure capital adequacy require the Bank to maintain minimum amounts and ratios of total capital, Tier 1 capital, and common equity Tier 1 capital to risk-weighted assets, and of Tier 1 capital to average assets. In addition, the Bank is subject to an institution-specific capital buffer, which must exceed 2.50% to avoid limitations on distributions and discretionary bonus payments. Management believes, as of December 31, 2020 and 2019 , that the Bank meets all capital adequacy requirements to which it is subject.
As of December 31, 2020, the Company and the Bank believe they are each well capitalized on a consolidated basis for bank regulatory purposes as their respective capital ratios exceed minimum total Tier 1 and CET1 risk-based capital ratios and Tier 1 leverage capital ratios as set forth in the following table.
| Actual | For Capital Adequacy Purposes 1 |
Minimums To Be Well Capitalized Under Prompt Corrective Action |
||||||||||||||||||||||
| Amount | Ratio | Amount | Ratio | Amount | Ratio | |||||||||||||||||||
| December 31, 2020: |
||||||||||||||||||||||||
| Total Capital to Risk Weighted Assets |
||||||||||||||||||||||||
| Company |
$ | 135,196 | 12.09 | % | $ | 117,385 | 10.50 | % | $ | N/A | N/A | |||||||||||||
| Bank |
$ | 142,711 | 12.77 | % | $ | 117,385 | 10.50 | % | $ | 111,795 | 10.00 | % | ||||||||||||
| Tier I Capital to Risk Weighted Assets |
||||||||||||||||||||||||
| Company |
$ | 118,837 | 10.63 | % | $ | 95,026 | 8.50 | % | $ | N/A | N/A | |||||||||||||
| Bank |
$ | 130,852 | 11.70 | % | $ | 95,026 | 8.50 | % | $ | 89,436 | 8.00 | % | ||||||||||||
| CET1 Capital to Risk Weighted Assets |
||||||||||||||||||||||||
| Company |
$ | 118,837 | 10.63 | % | $ | 78,257 | 7.00 | % | $ | N/A | N/A | |||||||||||||
| Bank |
$ | 130,852 | 11.70 | % | $ | 78,257 | 7.00 | % | $ | 72,667 | 6.50 | % | ||||||||||||
| Tier I Capital to Average Total Assets |
||||||||||||||||||||||||
| Company |
$ | 118,837 | 9.24 | % | $ | 51,426 | 4.00 | % | $ | N/A | N/A | |||||||||||||
| Bank |
$ | 130,852 | 10.18 | % | $ | 51,426 | 4.00 | % | $ | 77,139 | 5.00 | % | ||||||||||||
| December 31, 2019: |
||||||||||||||||||||||||
| Total Capital to Risk Weighted Assets |
||||||||||||||||||||||||
| Company |
$ | 121,249 | 12.68 | % | $ | 100,377 | 10.50 | % | $ | N/A | N/A | |||||||||||||
| Bank |
$ | 128,386 | 13.43 | % | $ | 100,377 | 10.50 | % | $ | 95,597 | 10.00 | % | ||||||||||||
| Tier I Capital to Risk Weighted Assets |
||||||||||||||||||||||||
| Company |
$ | 107,484 | 11.24 | % | $ | 81,258 | 8.50 | % | $ | N/A | N/A | |||||||||||||
| Bank |
$ | 119,121 | 12.46 | % | $ | 81,258 | 8.50 | % | $ | 76,478 | 8.00 | % | ||||||||||||
| CET1 Capital to Risk Weighted Assets |
||||||||||||||||||||||||
| Company |
$ | 107,484 | 11.24 | % | $ | 66,918 | 7.00 | % | $ | N/A | N/A | |||||||||||||
| Bank |
$ | 119,121 | 12.46 | % | $ | 66,918 | 7.00 | % | $ | 62,138 | 6.50 | % | ||||||||||||
| Tier I Capital to Average Total Assets |
||||||||||||||||||||||||
| Company |
$ | 107,484 | 9.78 | % | $ | 43,939 | 4.000 | % | $ | N/A | N/A | |||||||||||||
| Bank |
$ | 119,121 | 10.84 | % | $ | 43,939 | 4.000 | % | $ | 54,923 | 5.00 | % | ||||||||||||
| 1 | Includes the capital conservation buffer. |
F-79
Table of Contents
NOTES TO CONSOLIDATED FINANCIAL STATEMENTS
(In thousands, except per share amounts)
| NOTE 16. | FAIR VALUE OF ASSETS AND LIABILITIES |
Determination of Fair Value
The Company uses fair value measurements to record fair value adjustments to certain assets and liabilities and to determine fair value disclosures. In accordance with the Fair Value Measurements and Disclosures topic (FASB ASC 820), the fair value of a financial instrument is the price that would be received to sell an asset or paid to transfer a liability in an orderly transaction between market participants at the measurement date. Fair value is best determined based upon quoted market prices. However, in many instances, there are no quoted market prices for the Company’s various financial instruments. In cases where quoted market prices are not available, fair values are based on estimates using present value or other valuation techniques. Those techniques are significantly affected by the assumptions used, including the discount rate and estimates of future cash flows. Accordingly, the fair value estimates may not be realized in an immediate settlement of the instrument.
The fair value guidance provides a consistent definition of fair value, which focuses on exit price in an orderly transaction (that is, not a forced liquidation or distressed sale) between market participants at the measurement date under current market conditions. If there has been a significant decrease in the volume and level of activity for the asset or liability, a change in valuation technique or the use of multiple valuation techniques may be appropriate. In such instances, determining the price at which willing market participants would transact at the measurement date under current market conditions depends on the facts and circumstances and requires the use of significant judgment. The fair value is a reasonable point within the range that is most representative of fair value under current market conditions.
Fair Value Hierarchy
In accordance with this guidance, the Company groups its financial assets and financial liabilities generally measured at fair value in three levels, based on the markets in which the assets and liabilities are traded and the reliability of the assumptions used to determine fair value.
Level 1 - Valuation is based on quoted prices in active markets for identical assets or liabilities that the reporting entity has the ability to access at the measurement date. Level 1 assets and liabilities generally include debt and equity securities that are traded in an active exchange market. Valuations are obtained from readily available pricing sources for market transactions involving identical assets or liabilities.
Level 2 - Valuation is based on inputs other than quoted prices included within level 1 that are observable for the asset or liability, either directly or indirectly. The valuation may be based on quoted prices for similar assets or liabilities; quoted prices in markets that are not active; or other inputs that are observable or can be corroborated by observable market data for substantially the full term of the asset or liability.
Level 3 - Valuation is based on unobservable inputs that are supported by little or no market activity and that are significant to the fair value of the assets or liabilities. Level 3 assets and liabilities include financial instruments whose value is determined using pricing models, discounted cash flow methodologies, or similar techniques, as well as instruments for which determination of fair value requires significant management judgment or estimation.
A financial instrument’s categorization within the valuation hierarchy is based upon the lowest level of input that is significant to the fair value measurement.
The following methods and assumptions were used by the Company in estimating fair value disclosures for financial instruments:
F-80
Table of Contents
NOTES TO CONSOLIDATED FINANCIAL STATEMENTS
(In thousands, except per share amounts)
| NOTE 16. | FAIR VALUE OF ASSETS AND LIABILITIES (Continued) |
Fair Value Hierarchy (Continued)
Cash and Cash Equivalents: The carrying amounts of cash and due from banks, interest-bearing deposits in banks, and federal funds sold make up cash and cash equivalents. The carrying amount of these short-term instruments approximate fair value.
Securities: Where quoted prices are available in an active market, management classifies the securities within level 1 of the valuation hierarchy. Level 1 securities include highly liquid government bonds and exchange-traded equities.
If quoted market prices are not available, management estimates fair values using pricing models and discounted cash flows that consider standard input factors such as observable market data, benchmark yields, interest rate volatilities, broker/dealer quotes, and credit spreads. Examples of such instruments, which would generally be classified within level 2 of the valuation hierarchy, include GSE obligations, and state and municipal securities. Mortgage-backed securities are included in level 2 if observable inputs are available. In certain cases where there is limited activity or less transparency around inputs to the valuation, those securities would be classified in level 3.
Other Equity Securities: The carrying amounts approximates fair value.
Restricted Equity Securities: The carrying amount of restricted equity securities with no readily determinable fair value approximates fair value based on the redemption provisions of the issuers which is cost.
Loans Held for Sale: The carrying amounts of loans held for sale approximates fair value.
Loans: The carrying amount of variable-rate loans that reprice frequently and have no significant change in credit risk approximates fair value. The fair values of fixed rate loans is estimated based on discounted contractual cash flows using interest rates currently being offered for loans with similar terms to borrowers with similar credit quality.
Bank Owned Life Insurance: The carrying amount of bank owned life insurance approximates fair value.
Annuities: The carrying amounts of annuities approximate their fair values.
Deposits: The fair values disclosed for transaction deposits are, by definition, equal to the amount payable on demand at the reporting date (that is, their carrying amounts). Fair values for fixed-rate certificates of deposit are estimated using a discounted cash flow calculation that applies market interest rates on comparable instruments to a schedule of aggregated expected monthly maturities on time deposits.
Other Borrowings: The fair value of fixed-rate other borrowings is based on discounted contractual cash flows using interest rates currently being offered for borrowings of similar maturities. The fair values of the Company’s variable-rate other borrowings approximate their carrying values.
Subordinated Notes: The carrying amounts of the subordinated notes approximate fair value.
Accrued Interest: The carrying amounts of accrued interest approximate fair value.
Trading Assets and Liabilities: The Company has derivative instruments in the form of interest rate swap agreements accounted for as trading assets and liabilities and carried at fair value. The fair value of these instruments is based on information obtained from a third party financial institution. The Company reflects these instruments within level 2 of the valuation hierarchy.
F-81
Table of Contents
NOTES TO CONSOLIDATED FINANCIAL STATEMENTS
(In thousands, except per share amounts)
| NOTE 16. | FAIR VALUE OF ASSETS AND LIABILITIES (Continued) |
Fair Value Hierarchy (Continued)
Off-Balance Sheet Credit-Related Instruments: Fair values for off-balance sheet, credit-related financial instruments are based on fees currently charged to enter into similar agreements, taking into account the remaining terms of the agreements and the counterparties’ credit standing.
Assets and Liabilities Measured at Fair Value on a Recurring Basis
Assets and liabilities measured at fair value on a recurring basis are summarized below:
| Fair Value Measurements Using | ||||||||||||||||
| Quoted Prices in Active Markets for Identical Assets (Level 1) |
Significant Other Observable Inputs (Level 2) |
Significant Unobservable Inputs (Level 3) |
Total Carrying Value |
|||||||||||||
| December 31, 2020: |
||||||||||||||||
| Assets: |
||||||||||||||||
| U.S. Government Sponsored enterprises (GSEs) |
$ | — | $ | 9,366 | $ | — | $ | 9,366 | ||||||||
| State and municipal securities |
— | 67,941 | — | 67,941 | ||||||||||||
| Corporate debt securities |
— | 8,469 | — | 8,469 | ||||||||||||
| Asset based securities |
— | 9,111 | — | 9,111 | ||||||||||||
| Mortgage-backed GSE residential/multifamily |
— | 19,114 | — | 19,114 | ||||||||||||
|
|
|
|
|
|
|
|
|
|||||||||
| Total securities at fair value |
— | 114,001 | — | 114,001 | ||||||||||||
|
|
|
|
|
|
|
|
|
|||||||||
| Other equity securities |
— | 5,017 | — | 5,017 | ||||||||||||
| Trading assets |
— | 983 | — | 983 | ||||||||||||
|
|
|
|
|
|
|
|
|
|||||||||
| Total assets at fair value |
$ | — | $ | 120,001 | $ | — | $ | 120,984 | ||||||||
|
|
|
|
|
|
|
|
|
|||||||||
| Liabilities: |
||||||||||||||||
| Trading liabilities |
— | 1,013 | — | 1,013 | ||||||||||||
|
|
|
|
|
|
|
|
|
|||||||||
| Total liabilities at fair value |
$ | — | $ | 1,013 | $ | — | $ | 1,013 | ||||||||
|
|
|
|
|
|
|
|
|
|||||||||
F-82
Table of Contents
NOTES TO CONSOLIDATED FINANCIAL STATEMENTS
(In thousands, except per share amounts)
| NOTE 16. | FAIR VALUE OF ASSETS AND LIABILITIES (Continued) |
Assets and Liabilities Measured at Fair Value on a Recurring Basis (Continued)
| Fair Value Measurements Using | ||||||||||||||||
| Quoted Prices in Active Markets for Identical Assets (Level 1) |
Significant Other Observable Inputs (Level 2) |
Significant Unobservable Inputs (Level 3) |
Total Carrying Value |
|||||||||||||
| December 31, 2019: |
||||||||||||||||
| U.S. Government Sponsored enterprises (GSEs) |
$ | — | $ | 7,165 | $ | — | $ | 7,165 | ||||||||
| State and municipal securities |
— | 29,659 | — | 29,659 | ||||||||||||
| Corporate debt securities |
— | 2,633 | — | 2,633 | ||||||||||||
| Mortgage-backed GSE Residential/multifamily |
— | 20,490 | — | 20,490 | ||||||||||||
|
|
|
|
|
|
|
|
|
|||||||||
| Total securities at fair value |
$ | — | $ | 59,947 | $ | — | $ | 59,947 | ||||||||
|
|
|
|
|
|
|
|
|
|||||||||
Assets Measured at Fair Value on a Nonrecurring Basis
Under certain circumstances management makes adjustments to fair value for assets and liabilities although they are not measured at fair value on an ongoing basis. The following table presents the financial instruments carried on the consolidated balance sheet by caption and by level in the fair value hierarchy at December 31, 2020 and 2019, for which a nonrecurring change in fair value has been recorded:
| Fair Value Measurements Using | ||||||||||||
| Quoted Prices in Active Markets for Identical Assets (Level 1) |
Significant Other Observable Inputs (Level 2) |
Significant Unobservable Inputs (Level 3) |
||||||||||
| December 31, 2020: |
||||||||||||
| Impaired loans |
$ | — | $ | — | $ | 4,392 | ||||||
| Foreclosed assets |
— | — | 10,224 | |||||||||
|
|
|
|
|
|
|
|||||||
| Total |
$ | — | $ | — | $ | 14,616 | ||||||
|
|
|
|
|
|
|
|||||||
| Fair Value Measurements Using | ||||||||||||
| Quoted Prices in Active Markets for Identical Assets (Level 1) |
Significant Other Observable Inputs (Level 2) |
Significant Unobservable Inputs (Level 3) |
||||||||||
| December 31, 2019: |
||||||||||||
| Impaired loans |
$ | — | $ | — | $ | 1,548 | ||||||
| Foreclosed assets |
— | — | 7,042 | |||||||||
|
|
|
|
|
|
|
|||||||
| Total |
$ | — | $ | — | $ | 8,590 | ||||||
|
|
|
|
|
|
|
|||||||
F-83
Table of Contents
NOTES TO CONSOLIDATED FINANCIAL STATEMENTS
(In thousands, except per share amounts)
| NOTE 16. | FAIR VALUE OF ASSETS AND LIABILITIES (Continued) |
Assets Measured at Fair Value on a Nonrecurring Basis (Continued)
Impaired Loans
Loans considered impaired under ASC 310-10-35, Receivables, are loans for which, based on current information and events, it is probable that the Company will be unable to collect all principal and interest payments due in accordance with the contractual terms of the loan agreement. Impaired loans can be measured based on the present value of expected payments using the loan’s original effective rate as the discount rate, the loan’s observable market price, or the fair value of the collateral less estimated selling costs if the loan is collateral dependent.
The fair value of impaired loans were primarily measured based on the value of the collateral securing these loans. Impaired loans are classified within level 3 of the fair value hierarchy. Collateral may be real estate and/or business assets including equipment, inventory, and/or accounts receivable. The Company generally determines the value of real estate collateral based on independent appraisals performed by qualified licensed appraisers. These appraisals may utilize a single valuation approach or a combination of approaches including comparable sales and the income approach. Appraised values are discounted for estimated costs to sell and may be discounted further based on management’s historical knowledge, changes in market conditions from the date of the most recent appraisal, and/or management’s expertise and knowledge of the customer and the customer’s business. Such discounts by management are subjective and are typically significant unobservable inputs for determining fair value. Impaired loans are reviewed and evaluated on at least a quarterly basis for additional impairment and adjusted accordingly, based on the same factors discussed above.
Impaired loans, which are usually measured for impairment using the fair value of collateral, had a carrying amount of $14,098 and $18,622, with a specific valuation allowance of $2,066 and $312 at December 31, 2020 and 2019, respectively. Of the $14,098 and $18,622 impaired loan portfolio, $6,458 and $1,859 were carried at fair value as a result of charge offs, specific valuation allowances, and the fair market adjustments at December 31, 2020 and 2019, respectively. The remaining $7,640 and $16,762 was carried at cost, as the fair value of the collateral on these loans exceeded the book value for each individual credit at December 31, 2020 and 2019, respectively. Charge offs and changes in specific valuation allowances during 2020 and 2019 on impaired loans carried at fair value resulted in additional provision for loan losses of $1,828 and $151, respectively.
Foreclosed Assets
Foreclosed assets, consisting of properties/assets obtained through foreclosure or in satisfaction of loans, are initially recorded at fair value less estimated costs to sell upon transfer of the loans to foreclosed assets. Subsequently, foreclosed assets are carried at the lower of carrying value or fair value less estimated costs to sell. Fair values are generally based on third party appraisals of the property/assets and are classified within level 3 of the fair value hierarchy. The appraisals are sometimes further discounted based on management’s historical knowledge, and/or changes in market conditions from the date of the most recent appraisal, and/or management’s expertise and knowledge of the customer and the customer’s business. Such discounts are typically significant unobservable inputs for determining fair value. In cases where the carrying amount exceeds the fair value, less estimated costs to sell, a loss is recognized in noninterest expense.
F-84
Table of Contents
NOTES TO CONSOLIDATED FINANCIAL STATEMENTS
(In thousands, except per share amounts)
| NOTE 16. | FAIR VALUE OF ASSETS AND LIABILITIES (Continued) |
Quantitative Disclosures for Level 3 Fair Value Measurements
The Company had no Level 3 assets measured at fair value on a recurring basis at December 31, 2020 or 2019.
For Level 3 assets measured at fair value on a non-recurring basis as of December 31, 2020, the significant unobservable inputs used in the fair value measurements are presented below.
| Carrying Amount |
Valuation Technique |
Significant Unobservable Input |
Weighted Average of Input |
|||||||||||
| Nonrecurring: |
||||||||||||||
| Impaired loans |
$ | 4,392 | Appraisal | Appraisal discounts (%) | 15-20 | % | ||||||||
| Foreclosed assets |
$ | 10,224 | Appraisal | Appraisal discounts (%) | 10-15 | % | ||||||||
For Level 3 assets measured at fair value on a non-recurring basis as of December 31, 2019, the significant unobservable inputs used in the fair value measurements are presented below.
| Carrying Amount |
Valuation Technique |
Significant Unobservable Input |
Weighted Average of Input |
|||||||||||||
| Nonrecurring: |
||||||||||||||||
| Impaired loans |
$ | 1,548 | Appraisal | Appraisal discounts (%) | 15-20 | % | ||||||||||
| Foreclosed assets |
$ | 7,042 | Appraisal | Appraisal discounts (%) | 10-15 | % | ||||||||||
F-85
Table of Contents
NOTES TO CONSOLIDATED FINANCIAL STATEMENTS
(In thousands, except per share amounts)
| NOTE 16. | FAIR VALUE OF ASSETS AND LIABILITIES (Continued) |
Fair Value of Financial Instruments
The carrying amount and estimated fair value of the Company’s financial instruments were as follows:
| December 31, 2020 | December 31, 2019 | |||||||||||||||
| Carrying Amount |
Fair Value |
Carrying Amount |
Fair Value |
|||||||||||||
| Financial assets: |
||||||||||||||||
| Level 1 Inputs |
||||||||||||||||
| Cash and cash equivalents |
$ | 84,907 | $ | 84,907 | $ | 115,235 | $ | 115,235 | ||||||||
| Level 2 Inputs |
||||||||||||||||
| Securities available for sale |
114,001 | 114,001 | 59,947 | 59,947 | ||||||||||||
| Other equity securities |
5,017 | 5,017 | — | — | ||||||||||||
| Loans held for sale |
5,696 | 5,696 | 2,578 | 2,578 | ||||||||||||
| Trading assets |
983 | 983 | — | — | ||||||||||||
| Level 3 Inputs |
||||||||||||||||
| Loans, net |
1,018,256 | 1,034,496 | 828,176 | 835,012 | ||||||||||||
| Bank owned life insurance |
22,458 | 22,458 | 22,078 | 22,078 | ||||||||||||
| Annuities |
12,903 | 12,903 | 12,903 | 12,903 | ||||||||||||
| Accrued interest receivable |
4,243 | 4,243 | 2,986 | 2,986 | ||||||||||||
| Restricted equity securities |
3,224 | 3,224 | 2,022 | 2,022 | ||||||||||||
| Financial liabilities: |
||||||||||||||||
| Level 2 Inputs |
||||||||||||||||
| Deposits |
$ | 1,139,661 | 1,140,979 | $ | 950,513 | 951,076 | ||||||||||
| Trading liabilities |
1,013 | 1,013 | — | — | ||||||||||||
| FHLB advances |
30,900 | 30,962 | — | — | ||||||||||||
| Other borrowings |
7,975 | 7,975 | 7,984 | 7,984 | ||||||||||||
| Subordinated notes |
4,493 | 4,493 | 4,478 | 4,478 | ||||||||||||
| Level 3 Inputs |
||||||||||||||||
| Accrued interest payable |
278 | 278 | 473 | 473 | ||||||||||||
| NOTE 17. | REVENUE FROM CONTRACTS WITH CUSTOMERS |
The majority of revenue-generating transactions are excluded from the scope of ASC 606, including revenue generated from financial instruments, such as securities and loans; SBA fees; income on bank owned life insurance contracts; and gains on sales of mortgage loans. Revenue-generating transactions that are within the scope of ASC 606, classified within noninterest income, are described as follows:
Service charges on deposit accounts – represent service fees for monthly activity and maintenance on customer accounts. Attributes can be transaction-based, item-based or time-based. Revenue is recognized when the Company’s performance obligation is completed which is generally monthly for maintenance services or when a transaction is processed. Payment for such performance obligations are generally received at the time the performance obligations are satisfied.
Interchange Income – bank card related fees primarily includes interchange income from client use of consumer and business debit cards. Interchange income is a fee paid by a merchant bank to the card-issuing bank through the interchange network. Interchange fees are set by the credit card
F-86
Table of Contents
NOTES TO CONSOLIDATED FINANCIAL STATEMENTS
(In thousands, except per share amounts)
| NOTE 17. | REVENUE FROM CONTRACTS WITH CUSTOMERS (Continued) |
associations and are based on cardholder purchase volumes. The Company records interchange income as transactions occur. This income is included in other noninterest income on the consolidated statements of income.
Gains and Losses from the Sale of Foreclosed Assets – the performance obligation in the sale of foreclosed assets typically will be the delivery of control over the asset to the buyer. If the Company is not financing the sale, the transaction price is typically identified in the purchase and sale agreement. However, if the Company provides seller financing, the Company must determine a transaction price, depending on if the sale contract is at market terms and taking into account the credit risk inherent in the arrangement.
Other non-interest income primarily includes income on bank owned life insurance contracts, both transaction-based fees and account maintenance fees, along with the one-time payment resulting from the termination of a Loan Guarantee Program operated by the State of Alabama. Transaction based fees are recognized at the time the transaction is executed as that is the point in time the Company fulfills the customer’s request. Other account maintenance fees are recognized over time, usually on a monthly basis, as the Company’s performance obligation for services is satisfied.
| NOTE 18. | PARENT COMPANY FINANCIAL INFORMATION |
The following information presents the condensed balance sheets of Southern States Bancshares, Inc. as of December 31, 2020 and 2019, and the condensed statements of income and cash flows for the years then ended.
CONDENSED BALANCE SHEETS
| 2020 | 2019 | |||||||
| Assets |
||||||||
| Cash |
$ | 161 | $ | 610 | ||||
| Investment in subsidiary |
152,671 | 138,275 | ||||||
| Other assets |
319 | 226 | ||||||
|
|
|
|
|
|||||
| Total assets |
$ | 153,151 | $ | 139,111 | ||||
|
|
|
|
|
|||||
| Liabilities and stockholders’ equity |
||||||||
| Other borrowings |
$ | 7,975 | $ | 7,984 | ||||
| Subordinated notes |
4,493 | 4,478 | ||||||
| Accrued interest |
27 | 12 | ||||||
|
|
|
|
|
|||||
| Total liabilities |
12,495 | 12,474 | ||||||
| Stockholders’ equity |
140,656 | 126,637 | ||||||
|
|
|
|
|
|||||
| Total liabilities and stockholders’ equity |
$ | 153,151 | $ | 139,111 | ||||
|
|
|
|
|
|||||
F-87
Table of Contents
NOTES TO CONSOLIDATED FINANCIAL STATEMENTS
(In thousands, except per share amounts)
| NOTE 18. | PARENT COMPANY FINANCIAL INFORMATION (Continued) |
CONDENSED STATEMENTS OF INCOME
| 2020 | 2019 | |||||||
| Income |
||||||||
| Dividend income from subsidiary |
$ | 1,842 | $ | 18,000 | ||||
|
|
|
|
|
|||||
| 1,842 | 18,000 | |||||||
| Expense |
||||||||
| Interest expense |
675 | 422 | ||||||
| Other |
847 | 489 | ||||||
|
|
|
|
|
|||||
| 1,522 | 911 | |||||||
| Income before income tax benefits and (distributions in excess of) equity in undistributed earnings (loss) of subsidiary |
320 | 17,089 | ||||||
| Income tax benefits |
320 | 181 | ||||||
|
|
|
|
|
|||||
| Income before (distributions in excess of) equity in undistributed earnings (loss) of subsidiary |
640 | 17,270 | ||||||
| (Distributions in excess of) equity in undistributed earnings (loss) of subsidiary |
11,467 | (11,668 | ) | |||||
|
|
|
|
|
|||||
| Net income |
$ | 12,107 | $ | 5,602 | ||||
|
|
|
|
|
|||||
F-88
Table of Contents
NOTES TO CONSOLIDATED FINANCIAL STATEMENTS
(In thousands, except per share amounts)
| NOTE 18. | PARENT COMPANY FINANCIAL INFORMATION (Continued) |
CONDENSED STATEMENTS OF CASH FLOWS
| 2020 | 2019 | |||||||
| OPERATING ACTIVITIES |
||||||||
| Net income |
$ | 12,107 | $ | 5,602 | ||||
| Adjustments to reconcile net income to net cash provided by (used in) operating activities: |
||||||||
| Distributions in excess of (equity in) undistributed earnings of subsidiary |
(11,467 | ) | 11,668 | |||||
| Stock-based compensation |
739 | 432 | ||||||
| Increase in accrued interest payable |
15 | 10 | ||||||
| Net other operating activities |
(87 | ) | 26 | |||||
|
|
|
|
|
|||||
| Net cash provided by operating activities |
1,307 | 17,738 | ||||||
|
|
|
|
|
|||||
| INVESTING ACTIVITIES |
||||||||
| Cash paid in acquisition |
— | (24,002 | ) | |||||
|
|
|
|
|
|||||
| Net cash used in investing activities |
— | (24,002 | ) | |||||
|
|
|
|
|
|||||
| FINANCING ACTIVITIES |
||||||||
| Net proceeds of other borrowings |
— | 7,984 | ||||||
| Issuance of common stock |
86 | — | ||||||
| Common stock dividends paid |
(1,842 | ) | (2,372 | ) | ||||
|
|
|
|
|
|||||
| Net cash provided by (used in) financing activities |
(1,756 | ) | 5,612 | |||||
|
|
|
|
|
|||||
| Net decrease in cash |
(449 | ) | (652 | ) | ||||
| Cash at beginning of year |
610 | 1,262 | ||||||
|
|
|
|
|
|||||
| Cash at end of year |
$ | 161 | $ | 610 | ||||
|
|
|
|
|
|||||
NOTE 19. CORONAVIRUS COVID-19 PANDEMIC
In December 2019, a novel strain of coronavirus (“COVID-19”) surfaced, which has and is continuing to spread throughout the world. In March of 2020, the World Health Organization declared the outbreak a pandemic. The extent to which COVID-19 impacts the Company’s operations, results of operations, liquidity and financial condition will depend on future developments, which are highly uncertain and cannot be predicted with confidence, including the duration, severity and scope of the outbreak, and the actions taken to contain its impact, as well as actions taken to limit the resulting economic impact, among others. The health and safety of customers and employees of the Company is of the utmost importance. The Company has taken, and will continue to take, precautionary measures in accordance with the guidelines of the Centers for Disease Control and other federal, state and local authorities.
F-89
Table of Contents
2,000,000 Shares
Common Stock
Preliminary Prospectus
July 30, 2021
Joint Book-Running Managers
| KEEFE, BRUYETTE & WOODS A Stifel Company |
TRUIST SECURITIES |
Co-Managers
| Hovde Group, LLC | Performance Trust Capital Partners, LLC |
Through and including , 2021 (the 25th day after the date of this prospectus), all dealers effecting transactions in our common stock, whether or not participating in this offering, may be required to deliver a prospectus. This delivery requirement is in addition to the obligation of dealers to deliver a prospectus when acting as underwriters and with respect to their unsold allotments or subscriptions.
Table of Contents
PART II
INFORMATION NOT REQUIRED IN PROSPECTUS
| ITEM 13. | OTHER EXPENSES OF ISSUANCE AND DISTRIBUTION. |
Set forth below is an itemization of total expenses, other than underwriting discounts and commissions, that we expect to incur in connection with the sale of our common stock in the offering. With the exception of the SEC registration fee, the FINRA filing fee and the NASDAQ listing fees and expenses, all amounts shown are estimates:
| Amount | ||||
| SEC registration fee |
5,269 | |||
| FINRA filing fee |
8,000 | |||
| NASDAQ listing fees and expenses |
150,000 | |||
| Transfer agent and registrar fees and expenses |
7,100 | |||
| Printing fees and expenses |
300,000 | |||
| Legal fees and expenses |
1,182,631 | |||
| Accounting expenses |
147,000 | |||
|
|
|
|||
| Total |
1,800,000 | |||
|
|
|
|||
| ITEM 14. | INDEMNIFICATION OF DIRECTORS AND OFFICERS |
| Alabama | Business Corporation Law of 2019 |
Subject to applicable law, a director shall not be held personally liable to Southern States or its stockholders for monetary damages for any action taken, or any failure to take any action as a director, except that a director’s liability shall not be eliminated for (i) the amount of a financial benefit received by a director to which he or she is not entitled; (ii) an intentional infliction of harm on Southern States or the stockholders; (iii) a violation of section 10A-2A-8.32 of the Alabama Business Corporation Law; or (iv) an intentional violation of criminal law. It is the intention that the directors of Southern States be protected from personal liability to the fullest extent permitted by the Alabama Business Corporation Law as it now or hereafter exists. If at any time in the future the ABCL is modified to permit further or additional limitations on the extent to which directors may be held personally liable to Southern States, the protection afforded by Southern States’ articles of incorporation shall be expanded to afford the maximum protection permitted under such law.
Subject to the above limitations and in accordance with the ABCL, Southern States will indemnify a director or officer who was successful, on the merits or otherwise, in the defense of any proceeding, or of any claim, issue or matter in the proceeding to which he or she was a party because he or she is or was a director or officer of Southern States against reasonable expenses incurred in connection with the proceeding, notwithstanding that he or she was not successful on any other claim, issue or matter in any such proceeding.
Furthermore, the ABCL provides that Southern States may indemnify an individual made a party to a proceeding because he or she is or was a director or officer of Southern States against liability incurred in a proceeding if: (1) he or she conducted himself or herself in good faith; and (2) he or she reasonably believed (a) in the case of conduct in his or her official capacity with Southern States, that his or her conduct was in its best interest; and (b) in all other cases, that his or her conduct was at least not opposed to its best interest; and (3) in the case of any criminal proceeding he or she had no reasonable cause to believe his or her conduct was unlawful. Southern States may not indemnify a director or officer in connection with a proceeding by or in the right of Southern States in which the director or officer has not met the relevant standard of conduct; or in connection with any other proceeding charging improper personal benefit to him or her, whether or not involving
II-1
Table of Contents
action in his or her official capacity, in which he or she was adjudged liable on the basis that financial benefit was improperly received by him or her. Southern States’ bylaws also require indemnification to the fullest extent provided by the ABCL.
Under the ABCL, Southern States may, before final disposition of a proceeding, advance funds to pay for or reimburse expenses incurred in connection with a proceeding by an individual who is a party to the proceeding because that individual is a director, if the director delivers to Southern States a signed written undertaking to repay any funds advanced if (i) the director is not entitled to mandatory indemnification, and (ii) it is ultimately determined that the director is not entitled to indemnification.
Bylaws
Under its bylaws, Southern States must indemnify any persons who may be indemnified under the ABCL.
Insurance Coverage
Southern States and Southern States Bank have procured a directors and officers liability insurance policy providing for insurance against certain liabilities incurred by directors and officers of Southern States and Southern States Bank while serving in their capacities as such, to the extent such liabilities could be indemnified under the above provisions.
Underwriting Agreement
The form of Underwriting Agreement to be filed as an exhibit hereto obligates the underwriters to indemnify our directors, officers and controlling persons under limited circumstances against certain liabilities under the Securities Act.
| ITEM 15. | RECENT SALES OF UNREGISTERED SECURITIES. |
Within the past three years, we have not engaged in the issuance of securities not registered under the Securities Act, other than grants of options to purchase shares of its common stock as well as restricted stock pursuant to its stock option plan to certain officers and employees pursuant to SEC Rule 701 (and Section 4(a)(2) of the Securities Act), and shares to certain directors in instead of cash director fees under the same exemptions.
| ITEM 16. | EXHIBITS AND FINANCIAL STATEMENT SCHEDULES. |
(a) Exhibits:
II-2
Table of Contents
| * | Previously field. |
| † | Indicates a management contract or compensatory plan. |
| # | Certain schedules, exhibits and appendices have been omitted pursuant to Item 601(b)(5). We will furnish the omitted schedules exhibits and appendices to the Securities and Exchange Commission upon request by the Commission. |
(b) Financial Statement Schedules: None. All financial statement schedules are omitted because the information required to be set forth therein is not applicable or is shown in the consolidated financial statements and related notes.
II-3
Table of Contents
| ITEM 17. | UNDERTAKINGS. |
The undersigned registrant hereby undertakes to provide to the underwriters at the closing specified in the underwriting agreement certificates (if certificates are requested) in such denominations and registered in such names as required by the underwriters to permit prompt delivery to each purchaser. Otherwise shares shall be uncertificated.
Insofar as indemnification for liabilities arising under the Securities Act of 1933 may be permitted to directors, officers and controlling persons of the registrant pursuant to the foregoing provisions, or otherwise, the registrant has been advised that, in the opinion of the Securities and Exchange Commission, such indemnification is against public policy as expressed in the Securities Act of 1933 and is, therefore, unenforceable. In the event that a claim for indemnification against such liabilities (other than the payment by the registrant of expenses incurred or paid by a director, officer or controlling person of the registrant in the successful defense of any action, suit or proceeding) is asserted by such director, officer or controlling person in connection with the securities being registered, the registrant will, unless in the opinion of its counsel the matter has been settled by controlling precedent, submit to a court of appropriate jurisdiction the question whether such indemnification by it is against public policy as expressed in the Securities Act and will be governed by the final adjudication of such issue.
The registrant hereby further undertakes that:
| (1) | For purposes of determining any liability under the Securities Act of 1933, the information omitted from the form of prospectus filed as part of this Registration Statement in reliance upon Rule 430A and contained in a form of prospectus filed by the registrant pursuant to Rule 424(b)(1) or (4) or 497(h) under the Securities Act shall be deemed to be part of this Registration Statement as of the time it was declared effective; and |
| (2) | For purposes of determining any liability under the Securities Act of 1933, each post-effective amendment that contains a form of prospectus shall be deemed to be a new registration statement relating to the securities offered therein, and the offering of such securities at that time shall be deemed to be the initial bona fide offering thereof. |
II-4
Table of Contents
Pursuant to the requirements of the Securities Act of 1933, the registrant has duly caused this Registration Statement on Form S-1 to be signed on its behalf by the undersigned, thereunto duly authorized in Anniston, Alabama on July 30, 2021.
| SOUTHERN STATES BANCSHARES | ||
| By: | /s/ Stephen W. Whatley | |
| Name: Stephen W. Whatley | ||
| Title: Chairman and CEO | ||
Pursuant to the requirements of the Securities Act of 1933, this registration statement has been signed by the following persons in the capacities indicated on the dates set forth below.
| Signature | Title | Date | ||
| /s/ Stephen W. Whatley Stephen W. Whatley |
Chairman and Chief Executive Officer, and Director |
* | ||
| /s/ Lynn Joyce Lynn Joyce |
Senior Executive Vice President and Chief Financial
Officer |
* | ||
| ** Lewis Beavers |
Director |
* | ||
| ** Robert F. Davie |
Director |
* | ||
| ** Alfred Hayes, Jr. |
Director |
* | ||
| ** Brent David Hitson |
Director |
* | ||
| ** Brian Stacy Holmes |
Director |
* | ||
| ** Jimmy Alan LaFoy |
Director |
* | ||
| ** James J. Lynch |
Director |
* | ||
| ** Cynthia S. McCarty |
Director |
* | ||
II-5
Table of Contents
| Signature | Title | Date | ||
| ** Jay Florey Pumroy |
Director |
* | ||
| ** J. Henry Smith, IV |
Director |
* | ||
| ** Henry A. Turner |
Director |
* | ||
| * | July 30, 2021 |
| **By | /s/ Lynn Joyce | |
| Lynn Joyce Attorney-in-fact | ||
II-6