Attached files
| file | filename |
|---|---|
| 8-K - 8-K - EDISON INTERNATIONAL | eix-20210730x8k.htm |
Exhibit 99.1
| Business Update July 30, 2021 |
| 1 Statements contained in this presentation about future performance, including, without limitation, operating results, capital expenditures, rate base growth, dividend policy, financial outlook, and other statements that are not purely historical, are forward-looking statements. These forward-looking statements reflect our current expectations; however, such statements involve risks and uncertainties. Actual results could differ materially from current expectations. These forward-looking statements represent our expectations only as of the date of this presentation, and Edison International assumes no duty to update them to reflect new information, events or circumstances. Important factors that could cause different results include, but are not limited to the: • ability of SCE to recover its costs through regulated rates, including uninsured wildfire-related and debris flow-related costs, costs incurred to mitigate the risk of utility equipment causing future wildfires, costs incurred to implement SCE's new customer service system and costs incurred as a result of the COVID-19 pandemic; • ability of SCE to implement its Wildfire Mitigation Plan; • risks of regulatory or legislative restrictions that would limit SCE’s ability to implement Public Safety Power Shutoff (“PSPS”) when conditions warrant or would otherwise limit SCE’s operational PSPS practices; • risks associated with implementing PSPS, including regulatory fines and penalties, claims for damages and reputational harm; • ability of SCE to maintain a valid safety certification; • ability to obtain sufficient insurance at a reasonable cost, including insurance relating to SCE's nuclear facilities and wildfire-related claims, and to recover the costs of such insurance or, in the event liabilities exceed insured amounts, the ability to recover uninsured losses from customers or other parties; • extreme weather-related incidents (including events caused, or exacerbated, by climate change, such as wildfires, debris flows, droughts, high wind events and extreme heat events) and other natural disasters (such as earthquakes), which could cause, among other things, public safety issues, property damage, operational issues (such as rotating outages and issues due to damaged infrastructure), PSPS activations and unanticipated costs; • risks associated with California Assembly Bill 1054 (“AB 1054”) effectively mitigating the significant risk faced by California investor-owned utilities related to liability for damages arising from catastrophic wildfires where utility facilities are alleged to be a substantial cause, including the longevity of the Wildfire Insurance Fund and the CPUC's interpretation of and actions under AB 1054, including its interpretation of the new prudency standard established under AB 1054; • ability of SCE to effectively manage its workforce, including its contract workers; • decisions and other actions by the California Public Utilities Commission, the Federal Energy Regulatory Commission, the Nuclear Regulatory Commission and other governmental authorities, including decisions and actions related to nationwide or statewide crisis, determinations of authorized rates of return or return on equity, the recoverability of wildfire-related and debris-flow-related costs, issuance of SCE's wildfire safety certification, wildfire mitigation efforts, and delays in executive, regulatory and legislative actions; • ability of Edison International or SCE to borrow funds and access bank and capital markets on reasonable terms; • risks associated with the decommissioning of San Onofre, including those related to worker and public safety, public opposition, permitting, governmental approvals, on- site storage of spent nuclear fuel, delays, contractual disputes, and cost overruns; • pandemics, such as COVID-19, and other events that cause regional, statewide, national or global disruption, which could impact, among other things, Edison International's and SCE's business, operations, cash flows, liquidity and/or financial results and cause Edison International and SCE to incur unanticipated costs; • physical security of Edison International's and SCE's critical assets and personnel and the cybersecurity of Edison International's and SCE's critical information technology systems for grid control, and business, employee and customer data; • risks associated with cost allocation resulting in higher rates for utility bundled service customers because of possible customer bypass or departure for other electricity providers such as Community Choice Aggregators (“CCA,” which are cities, counties, and certain other public agencies with the authority to generate and/or purchase electricity for their local residents and businesses) and Electric Service Providers (entities that offer electric power and ancillary services to retail customers, other than electrical corporations (like SCE) and CCAs); • risks inherent in SCE's transmission and distribution infrastructure investment program, including those related to project site identification, public opposition, environmental mitigation, construction, permitting, power curtailment costs (payments due under power contracts in the event there is insufficient transmission to enable acceptance of power delivery), changes in the California Independent System Operator’s transmission plans, and governmental approvals; and • risks associated with the operation of transmission and distribution assets and power generating facilities, including worker and public safety issues, the risk of utility assets causing or contributing to wildfires, failure, availability, efficiency, and output of equipment and facilities, and availability and cost of spare parts. Other important factors are discussed under the headings “Forward-Looking Statements”, “Risk Factors” and “Management’s Discussion and Analysis” in Edison International’s Form 10-K and other reports filed with the Securities and Exchange Commission, which are available on our website: www.edisoninvestor.com. These filings also provide additional information on historical and other factual data contained in this presentation. Forward-Looking Statements July 30, 2021 |
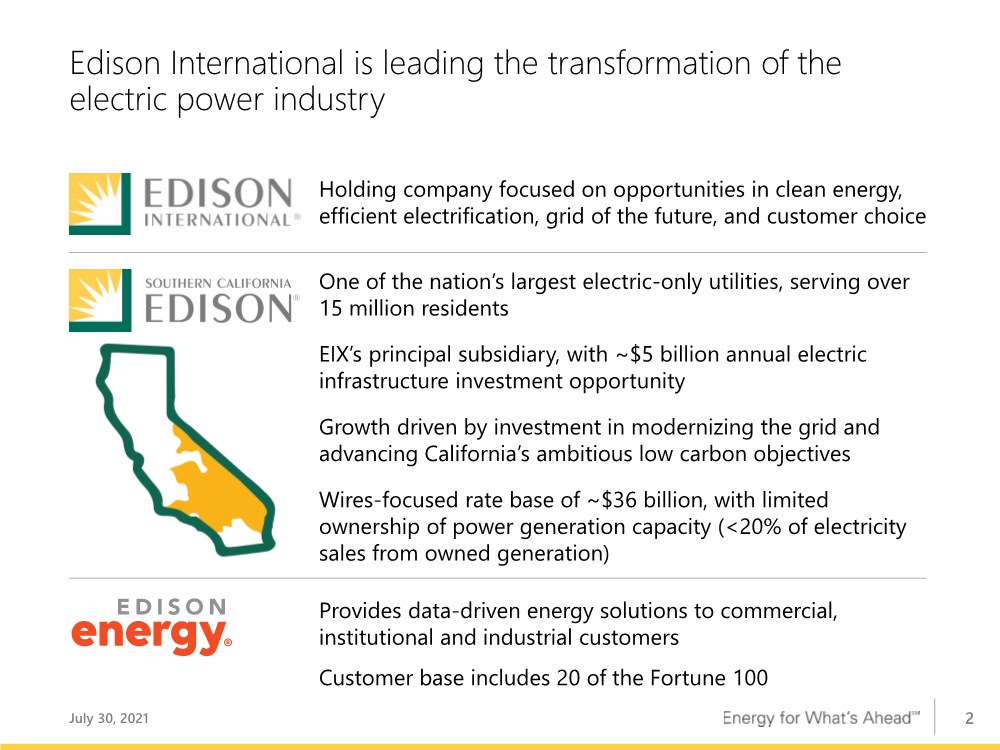
| 2 Edison International is leading the transformation of the electric power industry One of the nation’s largest electric-only utilities, serving over 15 million residents EIX’s principal subsidiary, with ~$5 billion annual electric infrastructure investment opportunity Growth driven by investment in modernizing the grid and advancing California’s ambitious low carbon objectives Wires-focused rate base of ~$36 billion, with limited ownership of power generation capacity (<20% of electricity sales from owned generation) Provides data-driven energy solutions to commercial, institutional and industrial customers Customer base includes 20 of the Fortune 100 Holding company focused on opportunities in clean energy, efficient electrification, grid of the future, and customer choice July 30, 2021 |
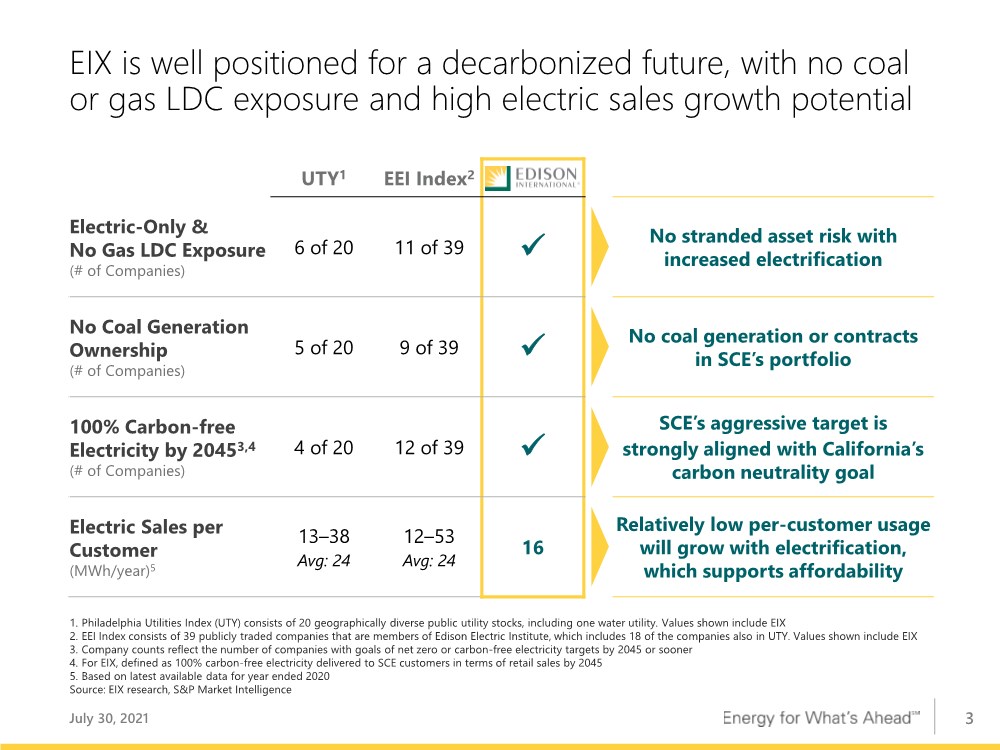
| 3 EIX is well positioned for a decarbonized future, with no coal or gas LDC exposure and high electric sales growth potential UTY1 EEI Index2 Electric-Only & No Gas LDC Exposure (# of Companies) 6 of 20 11 of 39 ✓ No stranded asset risk with increased electrification No Coal Generation Ownership (# of Companies) 5 of 20 9 of 39 ✓ No coal generation or contracts in SCE’s portfolio 100% Carbon-free Electricity by 20453,4 (# of Companies) 4 of 20 12 of 39 ✓ SCE’s aggressive target is strongly aligned with California’s carbon neutrality goal Electric Sales per Customer (MWh/year)5 13–38 Avg: 24 12–53 Avg: 24 16 Relatively low per-customer usage will grow with electrification, which supports affordability 1. Philadelphia Utilities Index (UTY) consists of 20 geographically diverse public utility stocks, including one water utility. Values shown include EIX 2. EEI Index consists of 39 publicly traded companies that are members of Edison Electric Institute, which includes 18 of the companies also in UTY. Values shown include EIX 3. Company counts reflect the number of companies with goals of net zero or carbon-free electricity targets by 2045 or sooner 4. For EIX, defined as 100% carbon-free electricity delivered to SCE customers in terms of retail sales by 2045 5. Based on latest available data for year ended 2020 Source: EIX research, S&P Market Intelligence July 30, 2021 |
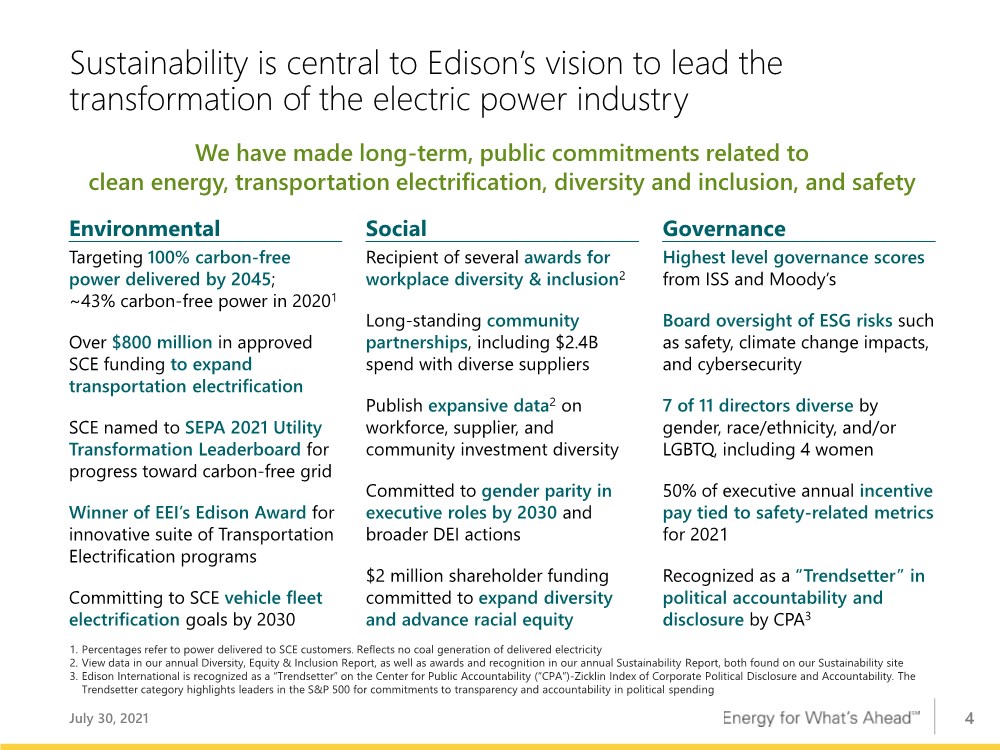
| 4 Sustainability is central to Edison’s vision to lead the transformation of the electric power industry Social Environmental Governance Targeting 100% carbon-free power delivered by 2045; ~43% carbon-free power in 20201 Over $800 million in approved SCE funding to expand transportation electrification SCE named to SEPA 2021 Utility Transformation Leaderboard for progress toward carbon-free grid Winner of EEI’s Edison Award for innovative suite of Transportation Electrification programs Committing to SCE vehicle fleet electrification goals by 2030 Highest level governance scores from ISS and Moody’s Board oversight of ESG risks such as safety, climate change impacts, and cybersecurity 7 of 11 directors diverse by gender, race/ethnicity, and/or LGBTQ, including 4 women 50% of executive annual incentive pay tied to safety-related metrics for 2021 Recognized as a “Trendsetter” in political accountability and disclosure by CPA3 Recipient of several awards for workplace diversity & inclusion2 Long-standing community partnerships, including $2.4B spend with diverse suppliers Publish expansive data2 on workforce, supplier, and community investment diversity Committed to gender parity in executive roles by 2030 and broader DEI actions $2 million shareholder funding committed to expand diversity and advance racial equity We have made long-term, public commitments related to clean energy, transportation electrification, diversity and inclusion, and safety 1. Percentages refer to power delivered to SCE customers. Reflects no coal generation of delivered electricity 2. View data in our annual Diversity, Equity & Inclusion Report, as well as awards and recognition in our annual Sustainability Report, both found on our Sustainability site 3. Edison International is recognized as a “Trendsetter” on the Center for Public Accountability (“CPA”)-Zicklin Index of Corporate Political Disclosure and Accountability. The Trendsetter category highlights leaders in the S&P 500 for commitments to transparency and accountability in political spending July 30, 2021 |
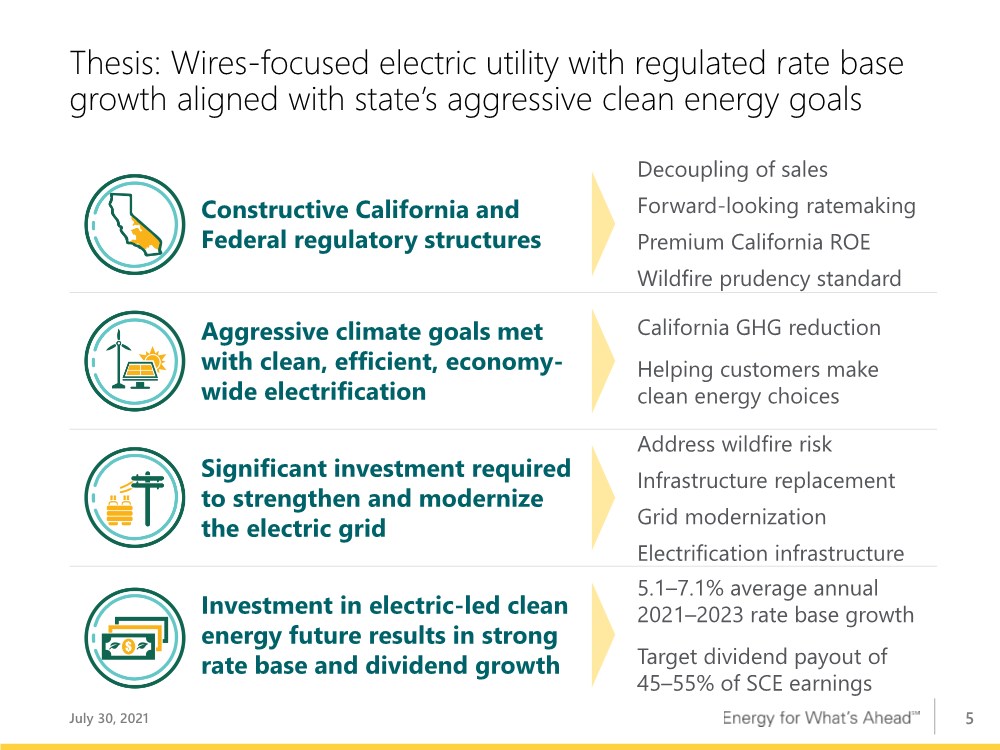
| 5 Thesis: Wires-focused electric utility with regulated rate base growth aligned with state’s aggressive clean energy goals Constructive California and Federal regulatory structures Aggressive climate goals met with clean, efficient, economy- wide electrification Significant investment required to strengthen and modernize the electric grid Investment in electric-led clean energy future results in strong rate base and dividend growth Decoupling of sales Forward-looking ratemaking Premium California ROE Wildfire prudency standard California GHG reduction Helping customers make clean energy choices Address wildfire risk Infrastructure replacement Grid modernization Electrification infrastructure 5.1–7.1% average annual 2021–2023 rate base growth Target dividend payout of 45–55% of SCE earnings July 30, 2021 |
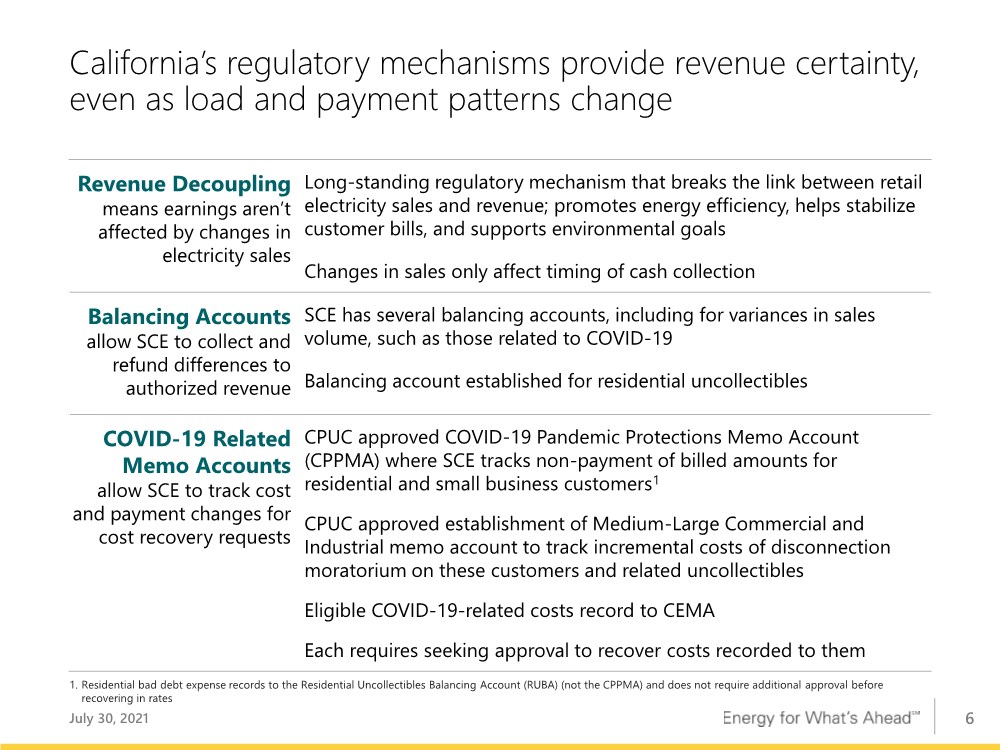
| 6 California’s regulatory mechanisms provide revenue certainty, even as load and payment patterns change Revenue Decoupling means earnings aren’t affected by changes in electricity sales Long-standing regulatory mechanism that breaks the link between retail electricity sales and revenue; promotes energy efficiency, helps stabilize customer bills, and supports environmental goals Changes in sales only affect timing of cash collection Balancing Accounts allow SCE to collect and refund differences to authorized revenue SCE has several balancing accounts, including for variances in sales volume, such as those related to COVID-19 Balancing account established for residential uncollectibles COVID-19 Related Memo Accounts allow SCE to track cost and payment changes for cost recovery requests CPUC approved COVID-19 Pandemic Protections Memo Account (CPPMA) where SCE tracks non-payment of billed amounts for residential and small business customers1 CPUC approved establishment of Medium-Large Commercial and Industrial memo account to track incremental costs of disconnection moratorium on these customers and related uncollectibles Eligible COVID-19-related costs record to CEMA Each requires seeking approval to recover costs recorded to them 1. Residential bad debt expense records to the Residential Uncollectibles Balancing Account (RUBA) (not the CPPMA) and does not require additional approval before recovering in rates July 30, 2021 |
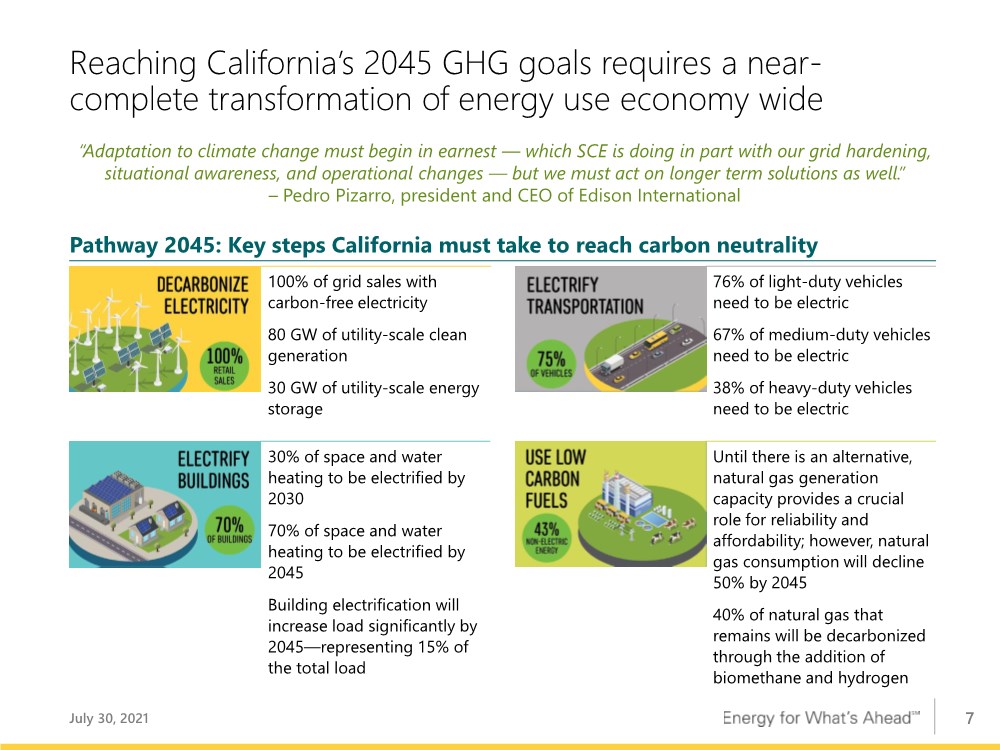
| 7 Reaching California’s 2045 GHG goals requires a near- complete transformation of energy use economy wide 100% of grid sales with carbon-free electricity 80 GW of utility-scale clean generation 30 GW of utility-scale energy storage 30% of space and water heating to be electrified by 2030 70% of space and water heating to be electrified by 2045 Building electrification will increase load significantly by 2045—representing 15% of the total load 76% of light-duty vehicles need to be electric 67% of medium-duty vehicles need to be electric 38% of heavy-duty vehicles need to be electric Until there is an alternative, natural gas generation capacity provides a crucial role for reliability and affordability; however, natural gas consumption will decline 50% by 2045 40% of natural gas that remains will be decarbonized through the addition of biomethane and hydrogen Pathway 2045: Key steps California must take to reach carbon neutrality “Adaptation to climate change must begin in earnest — which SCE is doing in part with our grid hardening, situational awareness, and operational changes — but we must act on longer term solutions as well.” – Pedro Pizarro, president and CEO of Edison International July 30, 2021 |
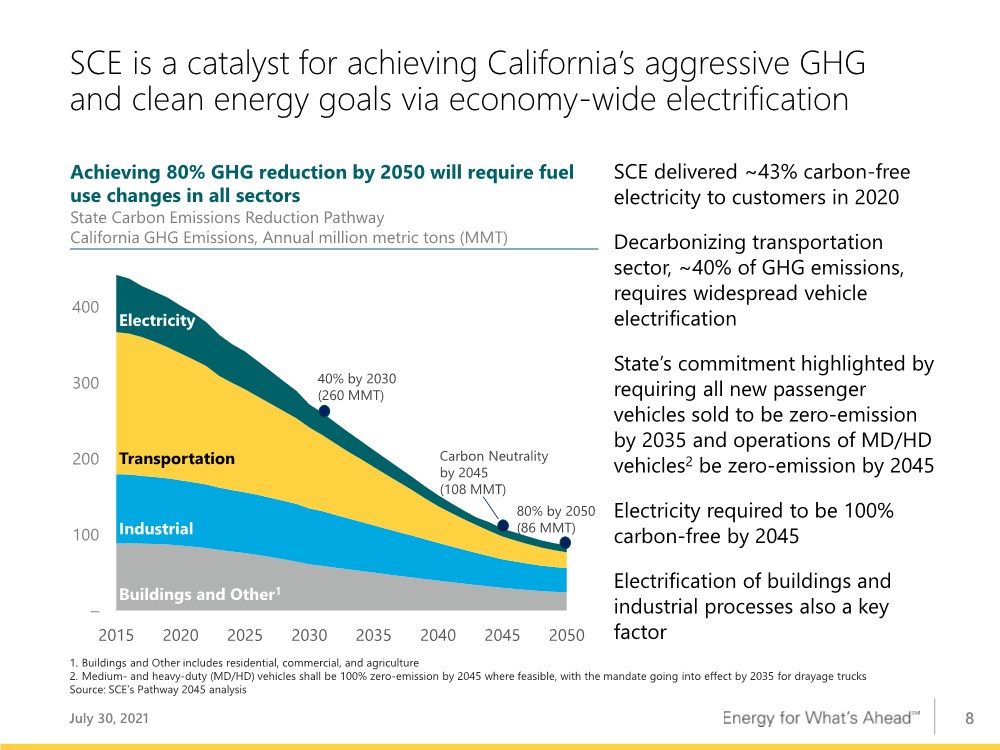
| 8 SCE delivered ~43% carbon-free electricity to customers in 2020 Decarbonizing transportation sector, ~40% of GHG emissions, requires widespread vehicle electrification State’s commitment highlighted by requiring all new passenger vehicles sold to be zero-emission by 2035 and operations of MD/HD vehicles2 be zero-emission by 2045 Electricity required to be 100% carbon-free by 2045 Electrification of buildings and industrial processes also a key factor 1. Buildings and Other includes residential, commercial, and agriculture 2. Medium- and heavy-duty (MD/HD) vehicles shall be 100% zero-emission by 2045 where feasible, with the mandate going into effect by 2035 for drayage trucks Source: SCE’s Pathway 2045 analysis SCE is a catalyst for achieving California’s aggressive GHG and clean energy goals via economy-wide electrification Achieving 80% GHG reduction by 2050 will require fuel use changes in all sectors State Carbon Emissions Reduction Pathway California GHG Emissions, Annual million metric tons (MMT) – 100 200 300 400 2015 2020 2025 2030 2035 2040 2045 2050 80% by 2050 (86 MMT) Carbon Neutrality by 2045 (108 MMT) 40% by 2030 (260 MMT) Electricity Transportation Industrial Buildings and Other1 July 30, 2021 |
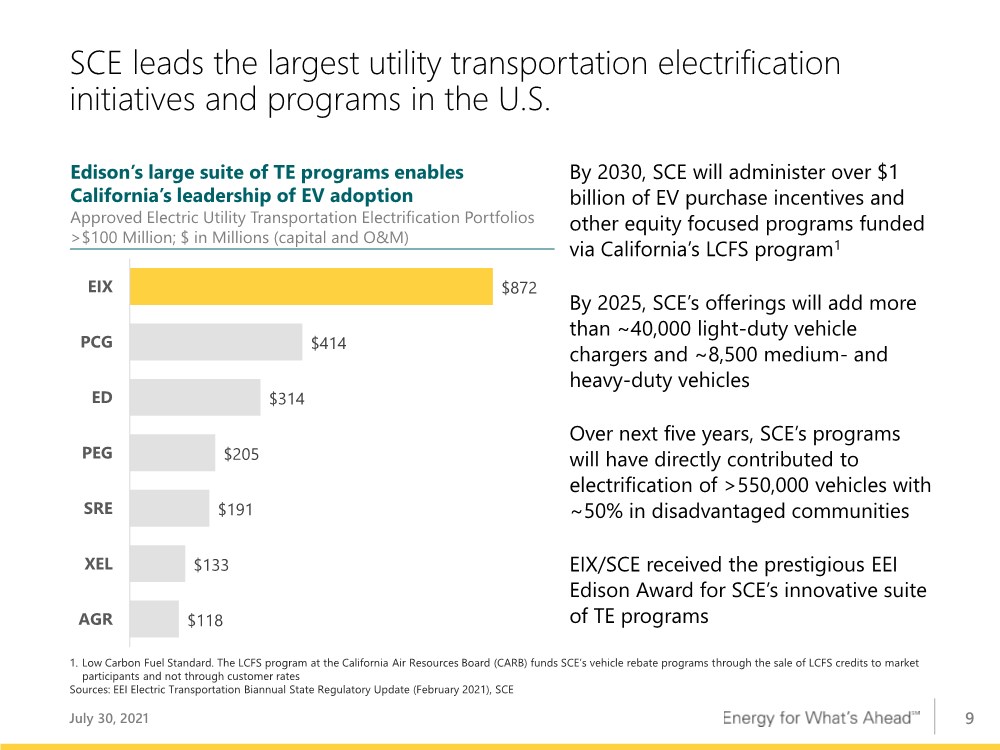
| 9 SCE leads the largest utility transportation electrification initiatives and programs in the U.S. $872 $414 $314 $205 $191 $133 $118 EIX PCG ED PEG SRE XEL AGR 1. Low Carbon Fuel Standard. The LCFS program at the California Air Resources Board (CARB) funds SCE’s vehicle rebate programs through the sale of LCFS credits to market participants and not through customer rates Sources: EEI Electric Transportation Biannual State Regulatory Update (February 2021), SCE Edison’s large suite of TE programs enables California’s leadership of EV adoption Approved Electric Utility Transportation Electrification Portfolios >$100 Million; $ in Millions (capital and O&M) By 2030, SCE will administer over $1 billion of EV purchase incentives and other equity focused programs funded via California’s LCFS program1 By 2025, SCE’s offerings will add more than ~40,000 light-duty vehicle chargers and ~8,500 medium- and heavy-duty vehicles Over next five years, SCE’s programs will have directly contributed to electrification of >550,000 vehicles with ~50% in disadvantaged communities EIX/SCE received the prestigious EEI Edison Award for SCE’s innovative suite of TE programs July 30, 2021 |
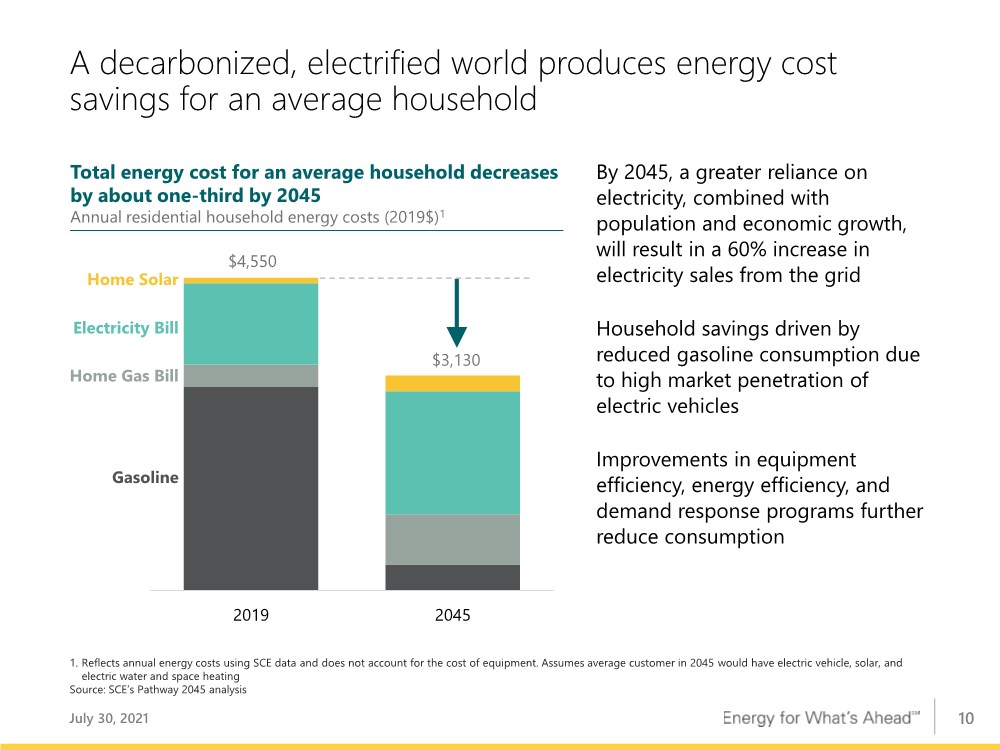
| 10 Annual residential household energy costs (2019$)1 2019 2045 By 2045, a greater reliance on electricity, combined with population and economic growth, will result in a 60% increase in electricity sales from the grid Household savings driven by reduced gasoline consumption due to high market penetration of electric vehicles Improvements in equipment efficiency, energy efficiency, and demand response programs further reduce consumption Total energy cost for an average household decreases by about one-third by 2045 A decarbonized, electrified world produces energy cost savings for an average household $3,130 $4,550 Home Solar Electricity Bill Home Gas Bill Gasoline 1. Reflects annual energy costs using SCE data and does not account for the cost of equipment. Assumes average customer in 2045 would have electric vehicle, solar, and electric water and space heating Source: SCE’s Pathway 2045 analysis July 30, 2021 |
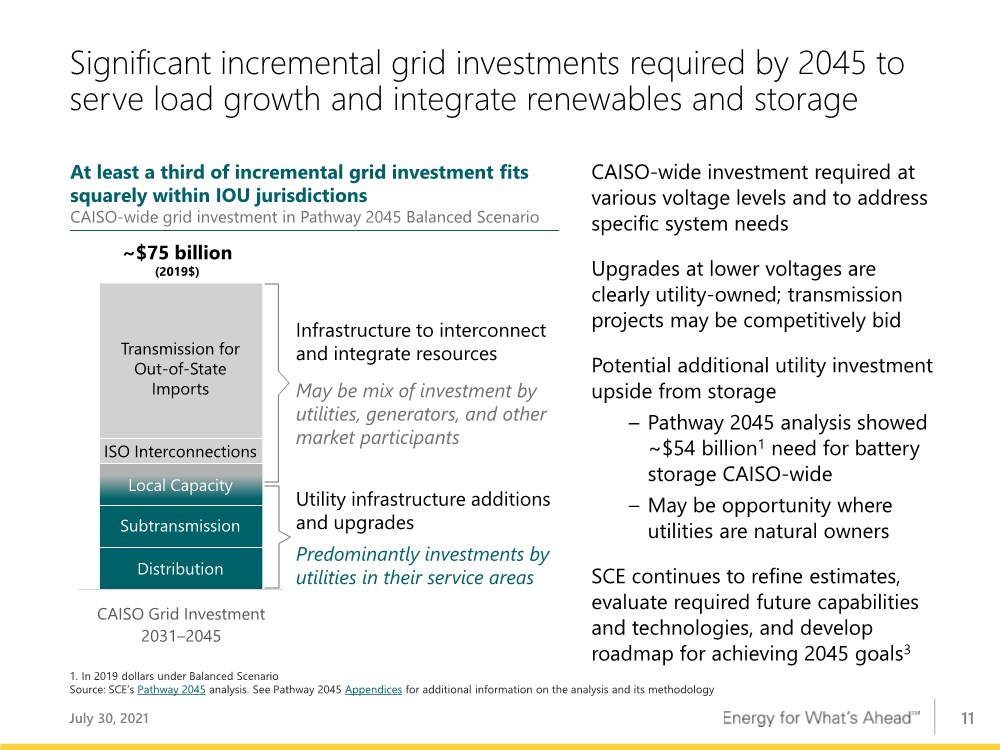
| 11 Significant incremental grid investments required by 2045 to serve load growth and integrate renewables and storage July 30, 2021 1. In 2019 dollars under Balanced Scenario Source: SCE’s Pathway 2045 analysis. See Pathway 2045 Appendices for additional information on the analysis and its methodology CAISO Grid Investment 2031–2045 At least a third of incremental grid investment fits squarely within IOU jurisdictions CAISO-wide grid investment in Pathway 2045 Balanced Scenario ~$75 billion (2019$) Transmission for Out-of-State Imports ISO Interconnections Local Capacity Distribution Subtransmission Infrastructure to interconnect and integrate resources May be mix of investment by utilities, generators, and other market participants Utility infrastructure additions and upgrades Predominantly investments by utilities in their service areas CAISO-wide investment required at various voltage levels and to address specific system needs Upgrades at lower voltages are clearly utility-owned; transmission projects may be competitively bid Potential additional utility investment upside from storage – Pathway 2045 analysis showed ~$54 billion1 need for battery storage CAISO-wide – May be opportunity where utilities are natural owners SCE continues to refine estimates, evaluate required future capabilities and technologies, and develop roadmap for achieving 2045 goals3 |
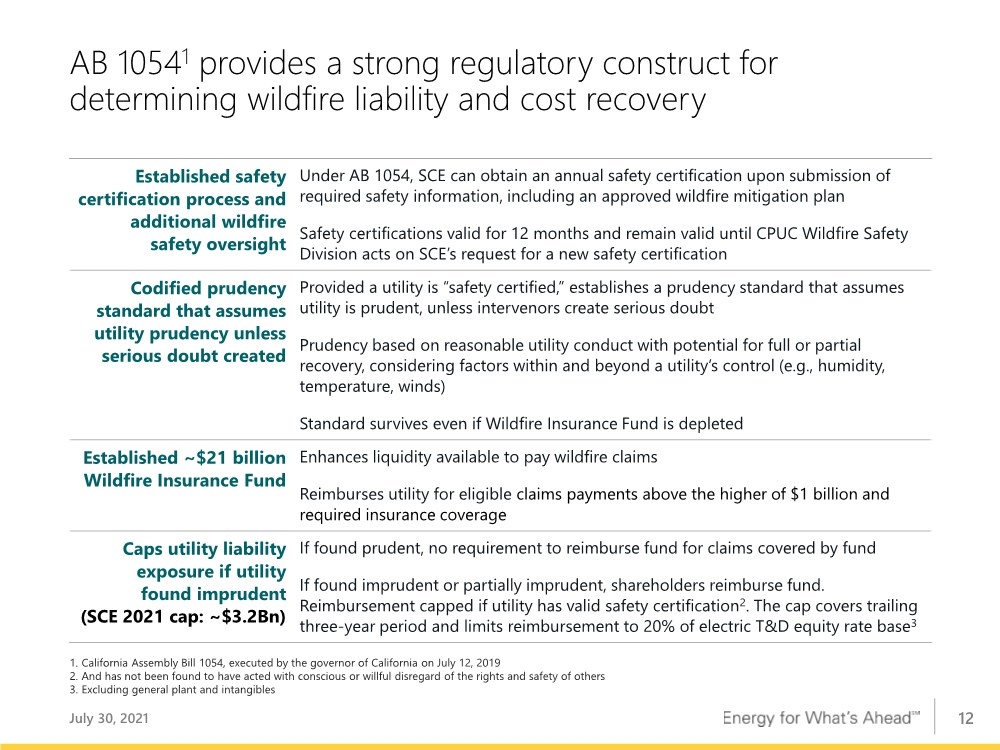
| 12 AB 10541 provides a strong regulatory construct for determining wildfire liability and cost recovery July 30, 2021 Established safety certification process and additional wildfire safety oversight Under AB 1054, SCE can obtain an annual safety certification upon submission of required safety information, including an approved wildfire mitigation plan Safety certifications valid for 12 months and remain valid until CPUC Wildfire Safety Division acts on SCE’s request for a new safety certification Codified prudency standard that assumes utility prudency unless serious doubt created Provided a utility is “safety certified,” establishes a prudency standard that assumes utility is prudent, unless intervenors create serious doubt Prudency based on reasonable utility conduct with potential for full or partial recovery, considering factors within and beyond a utility’s control (e.g., humidity, temperature, winds) Standard survives even if Wildfire Insurance Fund is depleted Established ~$21 billion Wildfire Insurance Fund Enhances liquidity available to pay wildfire claims Reimburses utility for eligible claims payments above the higher of $1 billion and required insurance coverage Caps utility liability exposure if utility found imprudent (SCE 2021 cap: ~$3.2Bn) If found prudent, no requirement to reimburse fund for claims covered by fund If found imprudent or partially imprudent, shareholders reimburse fund. Reimbursement capped if utility has valid safety certification2. The cap covers trailing three-year period and limits reimbursement to 20% of electric T&D equity rate base3 1. California Assembly Bill 1054, executed by the governor of California on July 12, 2019 2. And has not been found to have acted with conscious or willful disregard of the rights and safety of others 3. Excluding general plant and intangibles |
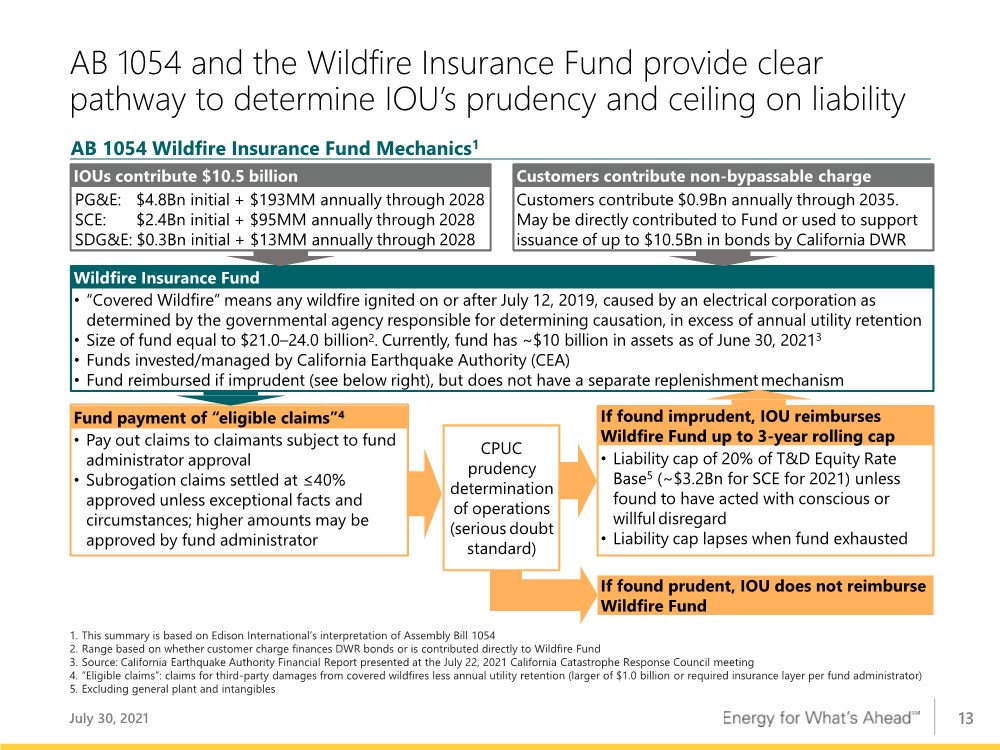
| 13 • Pay out claims to claimants subject to fund administrator approval • Subrogation claims settled at ≤40% approved unless exceptional facts and circumstances; higher amounts may be approved by fund administrator Fund payment of “eligible claims”4 AB 1054 and the Wildfire Insurance Fund provide clear pathway to determine IOU’s prudency and ceiling on liability CPUC prudency determination of operations (serious doubt standard) 1. This summary is based on Edison International’s interpretation of Assembly Bill 1054 2. Range based on whether customer charge finances DWR bonds or is contributed directly to Wildfire Fund 3. Source: California Earthquake Authority Financial Report presented at the July 22, 2021 California Catastrophe Response Council meeting 4. “Eligible claims”: claims for third-party damages from covered wildfires less annual utility retention (larger of $1.0 billion or required insurance layer per fund administrator) 5. Excluding general plant and intangibles July 30, 2021 AB 1054 Wildfire Insurance Fund Mechanics1 •“Covered Wildfire” means any wildfire ignited on or after July 12, 2019, caused by an electrical corporation as determined by the governmental agency responsible for determining causation, in excess of annual utility retention • Size of fund equal to $21.0–24.0 billion2. Currently, fund has ~$10 billion in assets as of June 30, 20213 • Funds invested/managed by California Earthquake Authority (CEA) • Fund reimbursed if imprudent (see below right), but does not have a separate replenishmentmechanism Wildfire Insurance Fund • Liability cap of 20% of T&D Equity Rate Base5 (~$3.2Bn for SCE for 2021) unless found to have acted with conscious or willfuldisregard • Liability cap lapses when fund exhausted If found imprudent, IOU reimburses Wildfire Fund up to 3-year rolling cap If found prudent, IOU does not reimburse Wildfire Fund PG&E: $4.8Bn initial + $193MM annually through 2028 SCE: $2.4Bn initial + $95MM annually through 2028 SDG&E: $0.3Bn initial + $13MM annually through 2028 IOUs contribute $10.5 billion Customers contribute $0.9Bn annually through 2035. May be directly contributed to Fund or used to support issuance of up to $10.5Bn in bonds by California DWR Customers contribute non-bypassable charge |
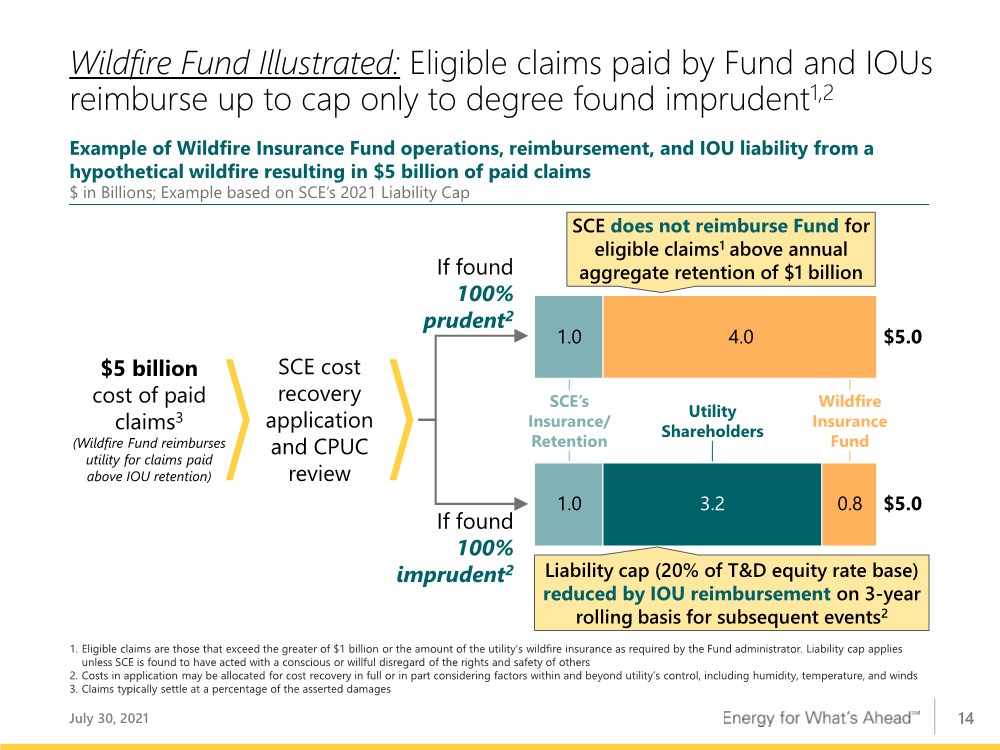
| 14 Wildfire Fund Illustrated: Eligible claims paid by Fund and IOUs reimburse up to cap only to degree found imprudent1,2 July 30, 2021 SCE does not reimburse Fund for eligible claims1 above annual aggregate retention of $1 billion If found 100% prudent2 SCE’s Insurance/ Retention Wildfire Insurance Fund Utility Shareholders 1. Eligible claims are those that exceed the greater of $1 billion or the amount of the utility's wildfire insurance as required by the Fund administrator. Liability cap applies unless SCE is found to have acted with a conscious or willful disregard of the rights and safety of others 2. Costs in application may be allocated for cost recovery in full or in part considering factors within and beyond utility’s control, including humidity, temperature, and winds 3. Claims typically settle at a percentage of the asserted damages 1.0 4.0 1.0 0.8 3.2 If found 100% imprudent2 $5 billion cost of paid claims3 (Wildfire Fund reimburses utility for claims paid above IOU retention) SCE cost recovery application and CPUC review Example of Wildfire Insurance Fund operations, reimbursement, and IOU liability from a hypothetical wildfire resulting in $5 billion of paid claims $ in Billions; Example based on SCE’s 2021 Liability Cap Liability cap (20% of T&D equity rate base) reduced by IOU reimbursement on 3-year rolling basis for subsequent events2 $5.0 $5.0 |
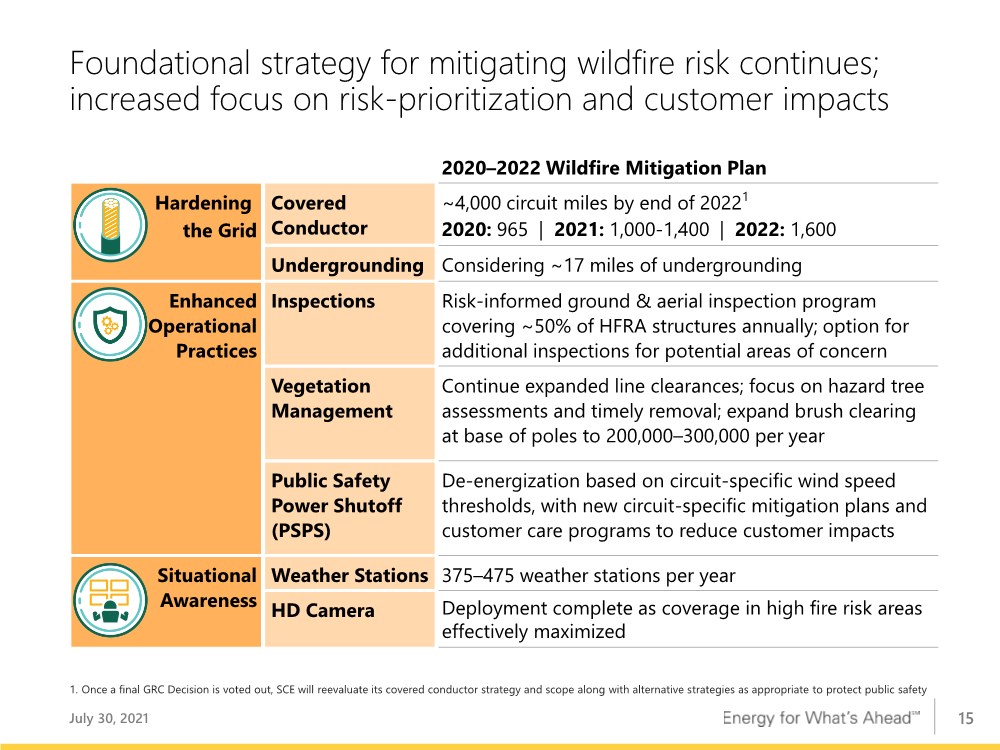
| 15 Foundational strategy for mitigating wildfire risk continues; increased focus on risk-prioritization and customer impacts 2020–2022 Wildfire Mitigation Plan Hardening the Grid Covered Conductor ~4,000 circuit miles by end of 20221 2020: 965 | 2021: 1,000-1,400 | 2022: 1,600 Undergrounding Considering ~17 miles of undergrounding Enhanced Operational Practices Inspections Risk-informed ground & aerial inspection program covering ~50% of HFRA structures annually; option for additional inspections for potential areas of concern Vegetation Management Continue expanded line clearances; focus on hazard tree assessments and timely removal; expand brush clearing at base of poles to 200,000–300,000 per year Public Safety Power Shutoff (PSPS) De-energization based on circuit-specific wind speed thresholds, with new circuit-specific mitigation plans and customer care programs to reduce customer impacts Situational Awareness Weather Stations 375–475 weather stations per year HD Camera Deployment complete as coverage in high fire risk areas effectively maximized July 30, 2021 1. Once a final GRC Decision is voted out, SCE will reevaluate its covered conductor strategy and scope along with alternative strategies as appropriate to protect public safety |
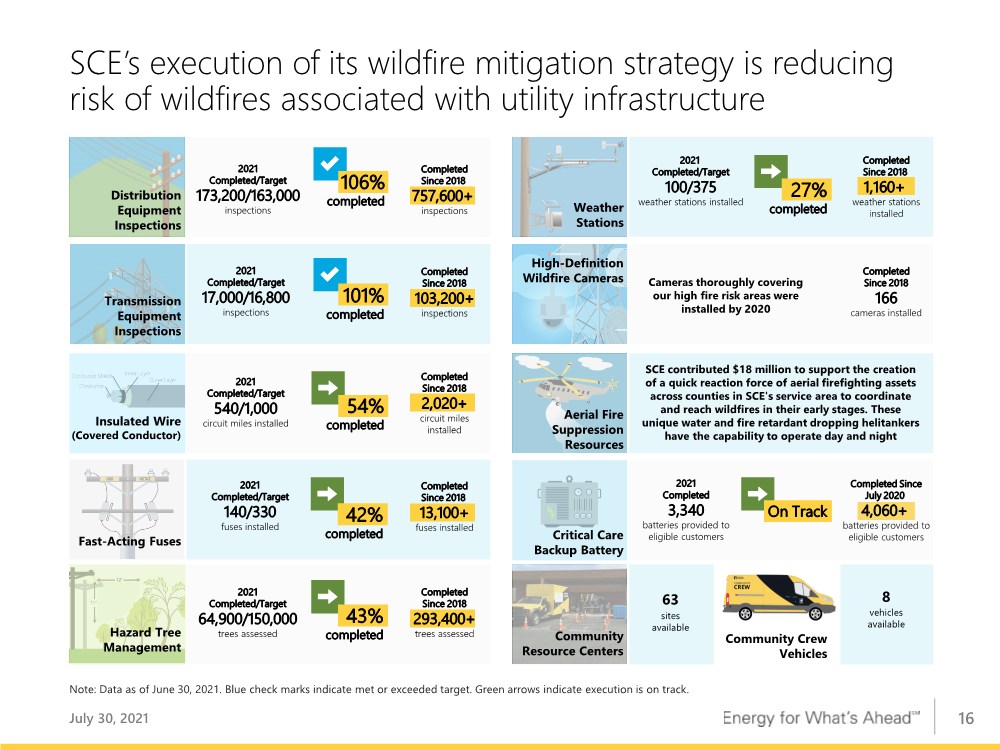
| 16 SCE’s execution of its wildfire mitigation strategy is reducing risk of wildfires associated with utility infrastructure July 30, 2021 Note: Data as of June 30, 2021. Blue check marks indicate met or exceeded target. Green arrows indicate execution is on track. Community Resource Centers Community Crew Vehicles 63 sites available 8 vehicles available High-Definition Wildfire Cameras Completed Since 2018 166 cameras installed Cameras thoroughly covering our high fire risk areas were installed by 2020 Distribution Equipment Inspections 2021 Completed/Target 173,200/163,000 inspections Completed Since 2018 757,600+ inspections Transmission Equipment Inspections 2021 Completed/Target 17,000/16,800 inspections Completed Since 2018 103,200+ inspections Insulated Wire (Covered Conductor) 2021 Completed/Target 540/1,000 circuit miles installed Completed Since 2018 2,020+ circuit miles installed 54% completed Fast-Acting Fuses 2021 Completed/Target 140/330 fuses installed Completed Since 2018 13,100+ fuses installed Hazard Tree Management 2021 Completed/Target 64,900/150,000 trees assessed Completed Since 2018 293,400+ trees assessed 43% completed Weather Stations 2021 Completed/Target 100/375 weather stations installed Completed Since 2018 1,160+ weather stations installed Aerial Fire Suppression Resources SCE contributed $18 million to support the creation of a quick reaction force of aerial firefighting assets across counties in SCE's service area to coordinate and reach wildfires in their early stages. These unique water and fire retardant dropping helitankers have the capability to operate day and night Critical Care Backup Battery Completed Since July 2020 4,060+ batteries provided to eligible customers 2021 Completed 3,340 batteries provided to eligible customers On Track 42% completed 27% completed 106% completed 101% completed |
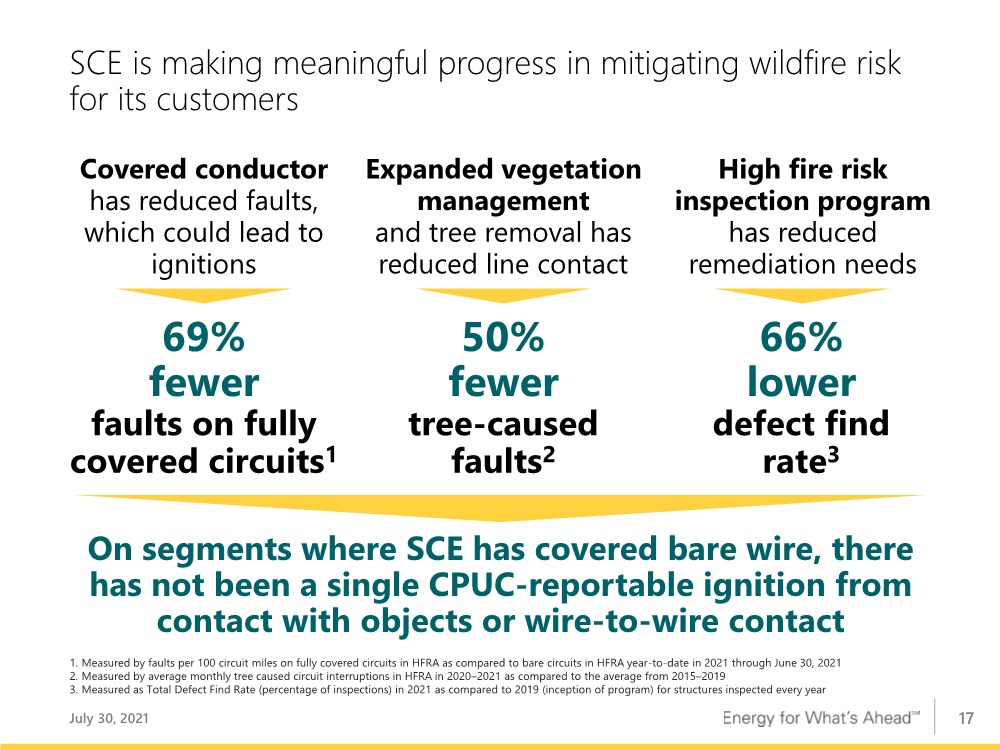
| 17 SCE is making meaningful progress in mitigating wildfire risk for its customers July 30, 2021 Covered conductor has reduced faults, which could lead to ignitions High fire risk inspection program has reduced remediation needs Expanded vegetation management and tree removal has reduced line contact 69% fewer faults on fully covered circuits1 50% fewer tree-caused faults2 66% lower defect find rate3 1. Measured by faults per 100 circuit miles on fully covered circuits in HFRA as compared to bare circuits in HFRA year-to-date in 2021 through June 30, 2021 2. Measured by average monthly tree caused circuit interruptions in HFRA in 2020–2021 as compared to the average from 2015–2019 3. Measured as Total Defect Find Rate (percentage of inspections) in 2021 as compared to 2019 (inception of program) for structures inspected every year On segments where SCE has covered bare wire, there has not been a single CPUC-reportable ignition from contact with objects or wire-to-wire contact |
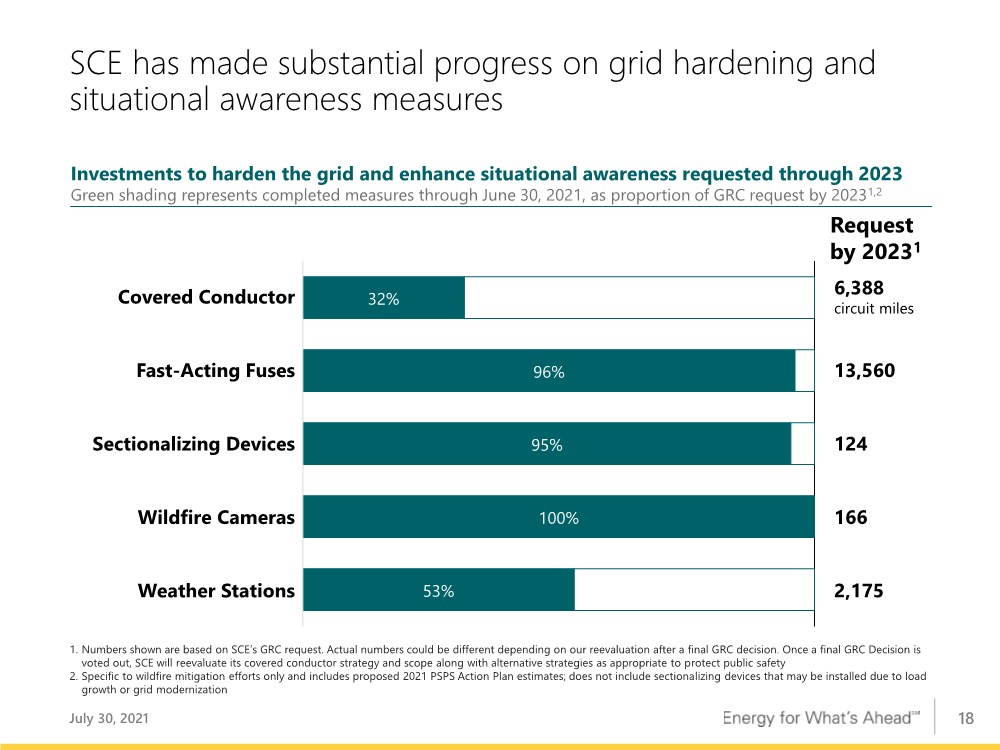
| 18 SCE has made substantial progress on grid hardening and situational awareness measures July 30, 2021 Investments to harden the grid and enhance situational awareness requested through 2023 Green shading represents completed measures through June 30, 2021, as proportion of GRC request by 20231,2 Covered Conductor 6,388 circuit miles Fast-Acting Fuses 13,560 Sectionalizing Devices 124 Wildfire Cameras 166 Weather Stations 2,175 1. Numbers shown are based on SCE’s GRC request. Actual numbers could be different depending on our reevaluation after a final GRC decision. Once a final GRC Decision is voted out, SCE will reevaluate its covered conductor strategy and scope along with alternative strategies as appropriate to protect public safety 2. Specific to wildfire mitigation efforts only and includes proposed 2021 PSPS Action Plan estimates; does not include sectionalizing devices that may be installed due to load growth or grid modernization Request by 20231 53% 100% 95% 96% 32% |
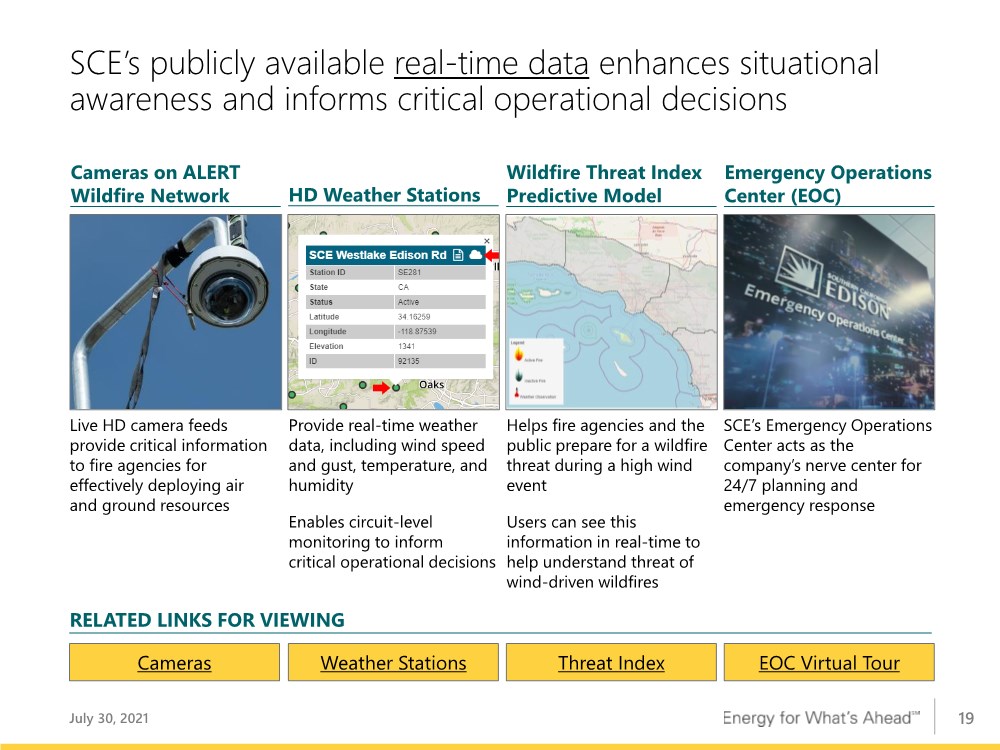
| 19 SCE’s publicly available real-time data enhances situational awareness and informs critical operational decisions Live HD camera feeds provide critical information to fire agencies for effectively deploying air and ground resources Provide real-time weather data, including wind speed and gust, temperature, and humidity Enables circuit-level monitoring to inform critical operational decisions Helps fire agencies and the public prepare for a wildfire threat during a high wind event Users can see this information in real-time to help understand threat of wind-driven wildfires Cameras on ALERT Wildfire Network HD Weather Stations Wildfire Threat Index Predictive Model Cameras Weather Stations Threat Index RELATED LINKS FOR VIEWING EOC Virtual Tour Emergency Operations Center (EOC) SCE’s Emergency Operations Center acts as the company’s nerve center for 24/7 planning and emergency response July 30, 2021 |
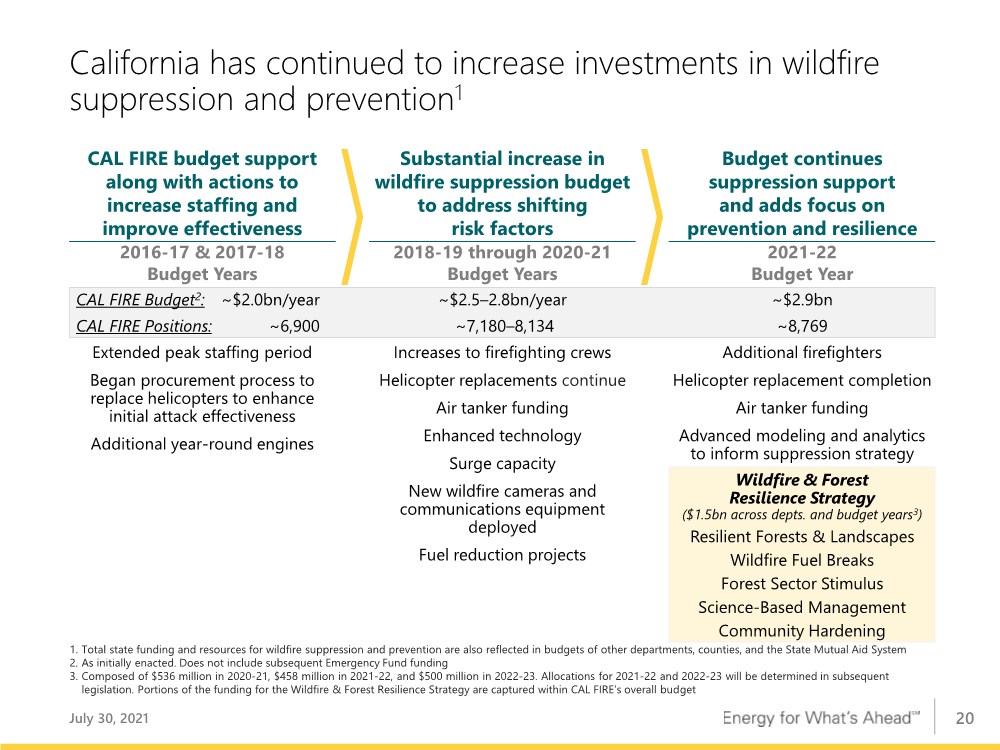
| 20 California has continued to increase investments in wildfire suppression and prevention1 July 30, 2021 CAL FIRE budget support along with actions to increase staffing and improve effectiveness ~$2.5–2.8bn/year ~7,180–8,134 Increases to firefighting crews Helicopter replacements continue Air tanker funding Enhanced technology Surge capacity New wildfire cameras and communications equipment deployed Fuel reduction projects ~$2.9bn ~8,769 Additional firefighters Helicopter replacement completion Air tanker funding Advanced modeling and analytics to inform suppression strategy Wildfire & Forest Resilience Strategy ($1.5bn across depts. and budget years3) Resilient Forests & Landscapes Wildfire Fuel Breaks Forest Sector Stimulus Science-Based Management Community Hardening Substantial increase in wildfire suppression budget to address shifting risk factors Budget continues suppression support and adds focus on prevention and resilience 2016-17 & 2017-18 Budget Years 2018-19 through 2020-21 Budget Years 2021-22 Budget Year CAL FIRE Budget2: ~$2.0bn/year CAL FIRE Positions: ~6,900 Extended peak staffing period Began procurement process to replace helicopters to enhance initial attack effectiveness Additional year-round engines 1. Total state funding and resources for wildfire suppression and prevention are also reflected in budgets of other departments, counties, and the State Mutual Aid System 2. As initially enacted. Does not include subsequent Emergency Fund funding 3. Composed of $536 million in 2020-21, $458 million in 2021-22, and $500 million in 2022-23. Allocations for 2021-22 and 2022-23 will be determined in subsequent legislation. Portions of the funding for the Wildfire & Forest Resilience Strategy are captured within CAL FIRE’s overall budget |
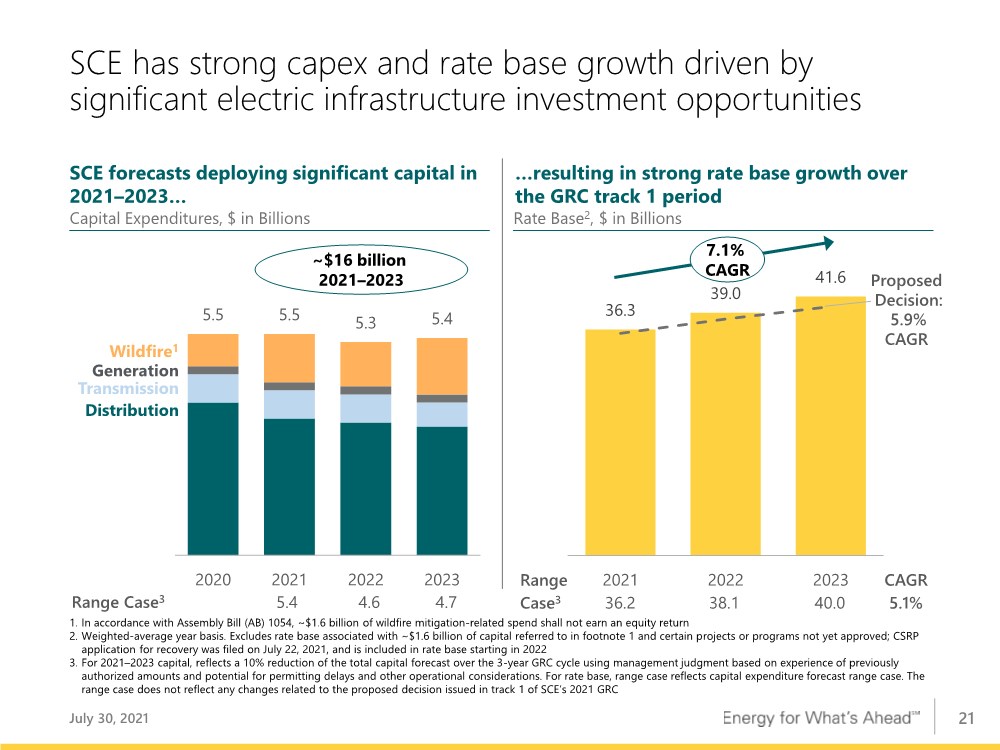
| 21 36.3 39.0 41.6 2021 2022 2023 5.5 5.5 5.3 5.4 2020 2021 2022 2023 SCE has strong capex and rate base growth driven by significant electric infrastructure investment opportunities 1. In accordance with Assembly Bill (AB) 1054, ~$1.6 billion of wildfire mitigation-related spend shall not earn an equity return 2. Weighted-average year basis. Excludes rate base associated with ~$1.6 billion of capital referred to in footnote 1 and certain projects or programs not yet approved; CSRP application for recovery was filed on July 22, 2021, and is included in rate base starting in 2022 3. For 2021–2023 capital, reflects a 10% reduction of the total capital forecast over the 3-year GRC cycle using management judgment based on experience of previously authorized amounts and potential for permitting delays and other operational considerations. For rate base, range case reflects capital expenditure forecast range case. The range case does not reflect any changes related to the proposed decision issued in track 1 of SCE’s 2021 GRC SCE forecasts deploying significant capital in 2021–2023… Capital Expenditures, $ in Billions Wildfire1 …resulting in strong rate base growth over the GRC track 1 period Rate Base2, $ in Billions 7.1% CAGR Generation Transmission Distribution ~$16 billion 2021–2023 July 30, 2021 Range Case3 36.2 38.1 40.0 CAGR 5.1% Range Case3 5.4 4.6 4.7 Proposed Decision: 5.9% CAGR |
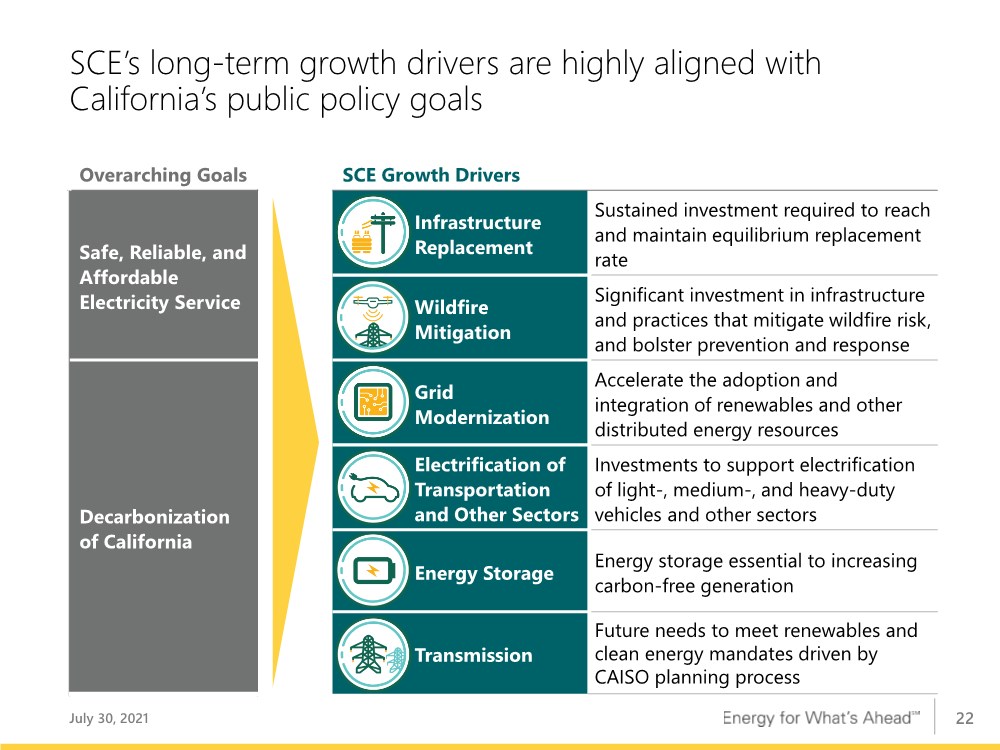
| 22 SCE’s long-term growth drivers are highly aligned with California’s public policy goals Overarching Goals SCE Growth Drivers Safe, Reliable, and Affordable Electricity Service Infrastructure Replacement Sustained investment required to reach and maintain equilibrium replacement rate Wildfire Mitigation Significant investment in infrastructure and practices that mitigate wildfire risk, and bolster prevention and response Decarbonization of California Grid Modernization Accelerate the adoption and integration of renewables and other distributed energy resources Electrification of Transportation and Other Sectors Investments to support electrification of light-, medium-, and heavy-duty vehicles and other sectors Energy Storage Energy storage essential to increasing carbon-free generation Transmission Future needs to meet renewables and clean energy mandates driven by CAISO planning process July 30, 2021 |
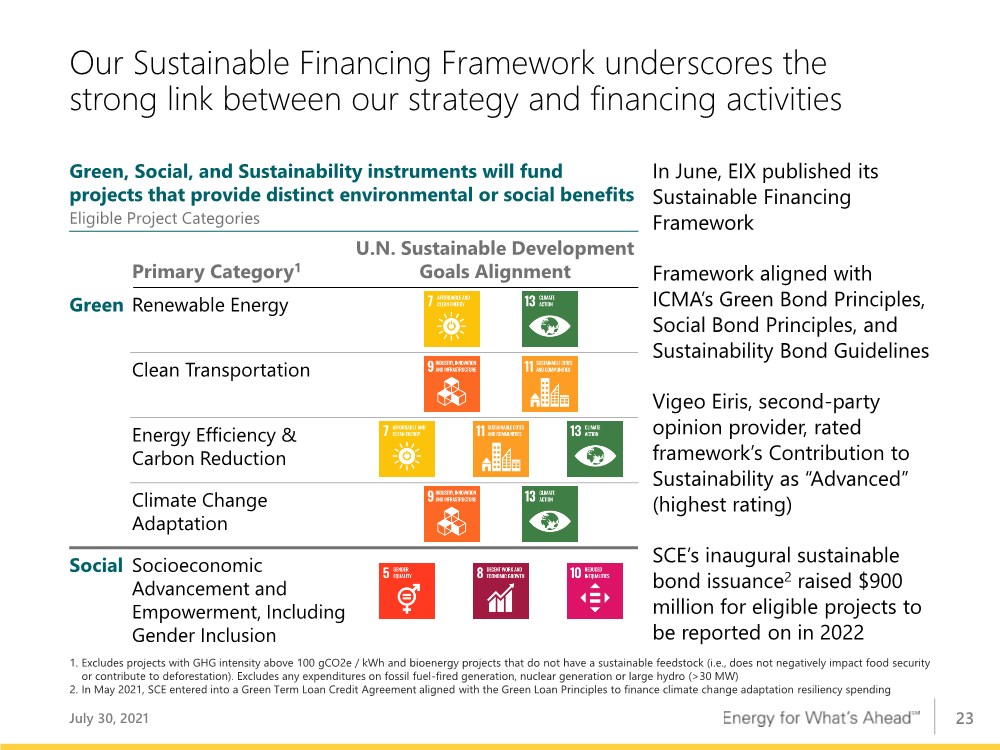
| 23 Our Sustainable Financing Framework underscores the strong link between our strategy and financing activities July 30, 2021 Primary Category1 U.N. Sustainable Development Goals Alignment Green Renewable Energy Clean Transportation Energy Efficiency & Carbon Reduction Climate Change Adaptation Social Socioeconomic Advancement and Empowerment, Including Gender Inclusion Green, Social, and Sustainability instruments will fund projects that provide distinct environmental or social benefits Eligible Project Categories 1. Excludes projects with GHG intensity above 100 gCO2e / kWh and bioenergy projects that do not have a sustainable feedstock (i.e., does not negatively impact food security or contribute to deforestation). Excludes any expenditures on fossil fuel-fired generation, nuclear generation or large hydro (>30 MW) 2. In May 2021, SCE entered into a Green Term Loan Credit Agreement aligned with the Green Loan Principles to finance climate change adaptation resiliency spending In June, EIX published its Sustainable Financing Framework Framework aligned with ICMA’s Green Bond Principles, Social Bond Principles, and Sustainability Bond Guidelines Vigeo Eiris, second-party opinion provider, rated framework’s Contribution to Sustainability as “Advanced” (highest rating) SCE’s inaugural sustainable bond issuance2 raised $900 million for eligible projects to be reported on in 2022 |
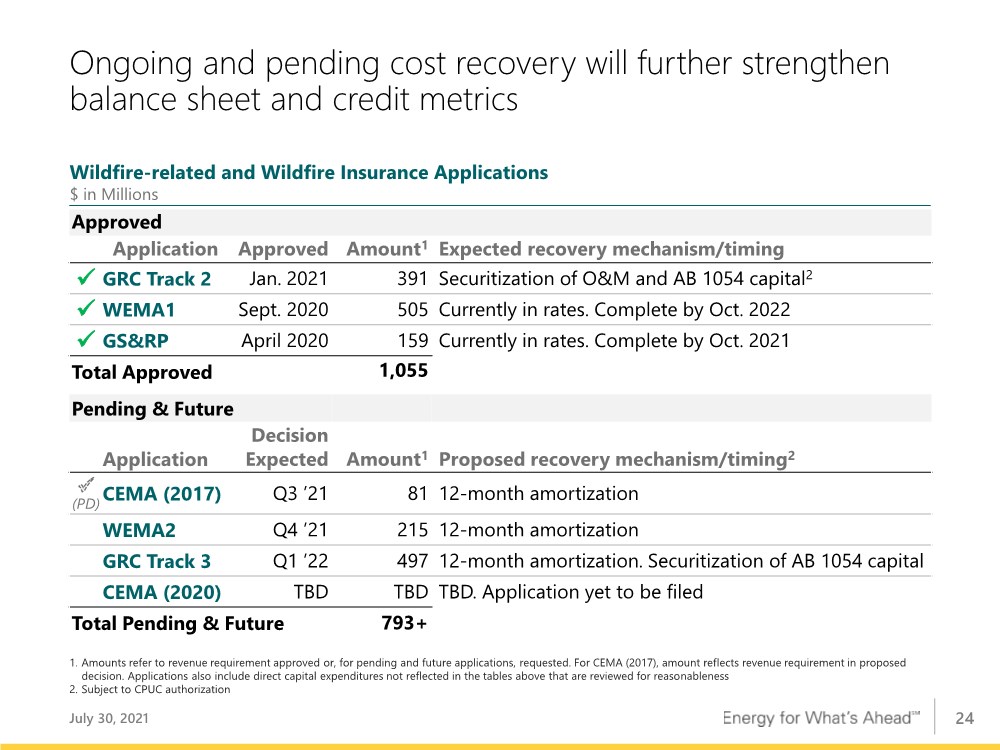
| 24 Ongoing and pending cost recovery will further strengthen balance sheet and credit metrics Approved Application Approved Amount1 Expected recovery mechanism/timing ✓ GRC Track 2 Jan. 2021 391 Securitization of O&M and AB 1054 capital2 ✓ WEMA1 Sept. 2020 505 Currently in rates. Complete by Oct. 2022 ✓ GS&RP April 2020 159 Currently in rates. Complete by Oct. 2021 Total Approved 1,055 Pending & Future Application Decision Expected Amount1 Proposed recovery mechanism/timing2 (PD) CEMA (2017) Q3 ’21 81 12-month amortization WEMA2 Q4 ’21 215 12-month amortization GRC Track 3 Q1 ’22 497 12-month amortization. Securitization of AB 1054 capital CEMA (2020) TBD TBD TBD. Application yet to be filed Total Pending & Future 793+ 1. Amounts refer to revenue requirement approved or, for pending and future applications, requested. For CEMA (2017), amount reflects revenue requirement in proposed decision. Applications also include direct capital expenditures not reflected in the tables above that are reviewed for reasonableness 2. Subject to CPUC authorization July 30, 2021 Wildfire-related and Wildfire Insurance Applications $ in Millions |
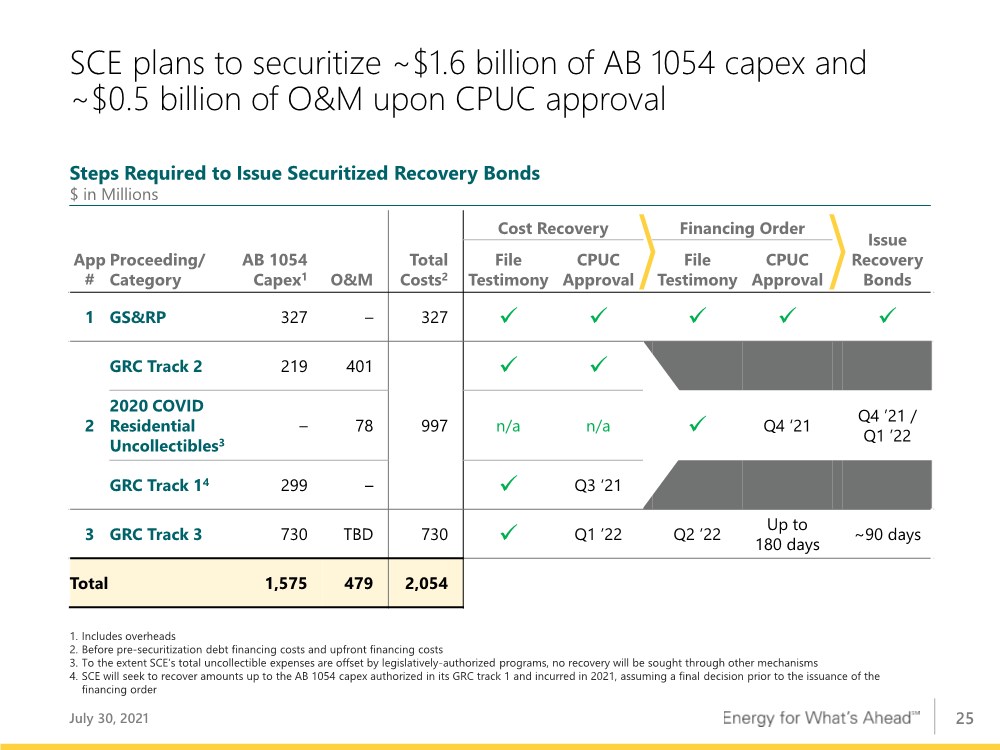
| 25 SCE plans to securitize ~$1.6 billion of AB 1054 capex and ~$0.5 billion of O&M upon CPUC approval July 30, 2021 O&M Total Costs2 Cost Recovery Financing Order Issue Recovery Bonds App # Proceeding/ Category AB 1054 Capex1 File Testimony CPUC Approval File Testimony CPUC Approval 1 GS&RP 327 – 327 ✓ ✓ ✓ ✓ ✓ 2 GRC Track 2 219 401 997 ✓ ✓ 2020 COVID Residential Uncollectibles3 – 78 n/a n/a ✓ Q4 ‘21 Q4 ’21 / Q1 ’22 GRC Track 14 299 – ✓ Q3 ‘21 3 GRC Track 3 730 TBD 730 ✓ Q1 ’22 Q2 ’22 Up to 180 days ~90 days Total 1,575 479 2,054 1. Includes overheads 2. Before pre-securitization debt financing costs and upfront financing costs 3. To the extent SCE’s total uncollectible expenses are offset by legislatively-authorized programs, no recovery will be sought through other mechanisms 4. SCE will seek to recover amounts up to the AB 1054 capex authorized in its GRC track 1 and incurred in 2021, assuming a final decision prior to the issuance of the financing order Steps Required to Issue Securitized Recovery Bonds $ in Millions |
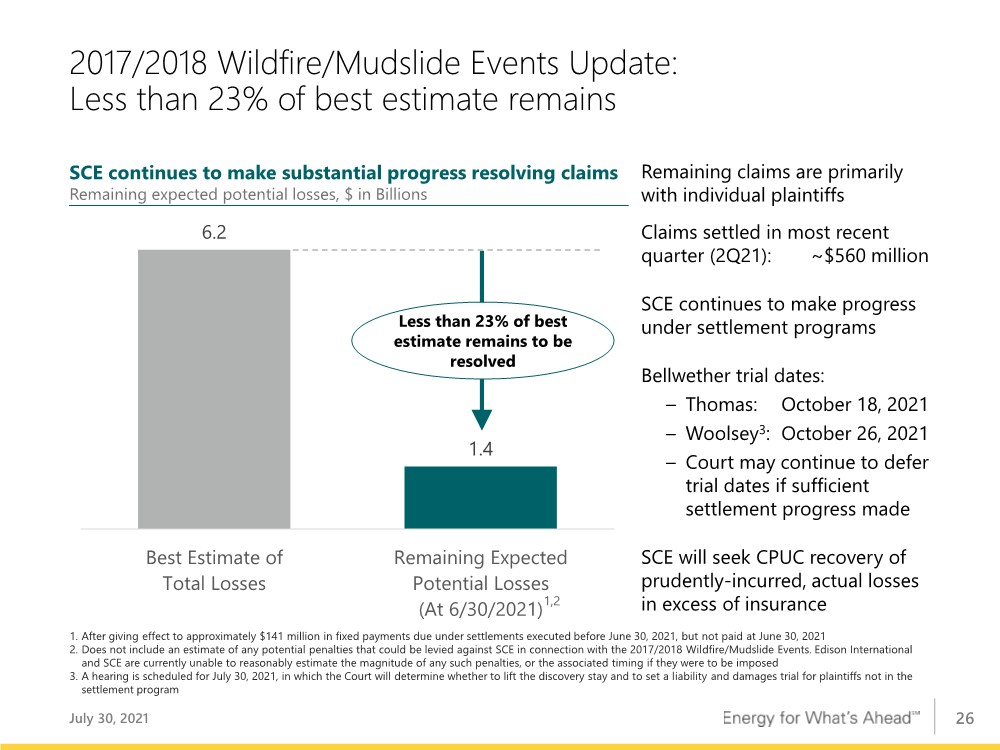
| 26 2017/2018 Wildfire/Mudslide Events Update: Less than 23% of best estimate remains July 30, 2021 SCE continues to make substantial progress resolving claims Remaining expected potential losses, $ in Billions 6.2 1.4 Best Estimate of Total Losses Remaining Expected Potential Losses (At 6/30/2021) Less than 23% of best estimate remains to be resolved Remaining claims are primarily with individual plaintiffs Claims settled in most recent quarter (2Q21): ~$560 million SCE continues to make progress under settlement programs Bellwether trial dates: – Thomas: October 18, 2021 – Woolsey3: October 26, 2021 – Court may continue to defer trial dates if sufficient settlement progress made SCE will seek CPUC recovery of prudently-incurred, actual losses in excess of insurance 1,2 1. After giving effect to approximately $141 million in fixed payments due under settlements executed before June 30, 2021, but not paid at June 30, 2021 2. Does not include an estimate of any potential penalties that could be levied against SCE in connection with the 2017/2018 Wildfire/Mudslide Events. Edison International and SCE are currently unable to reasonably estimate the magnitude of any such penalties, or the associated timing if they were to be imposed 3. A hearing is scheduled for July 30, 2021, in which the Court will determine whether to lift the discovery stay and to set a liability and damages trial for plaintiffs not in the settlement program |
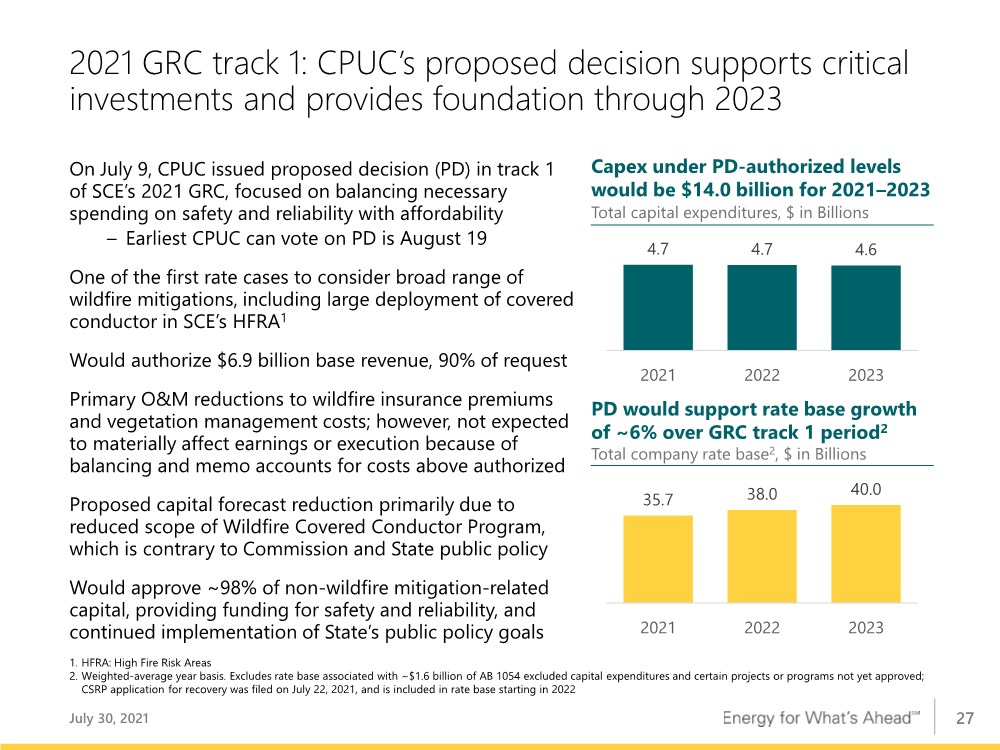
| 27 2021 GRC track 1: CPUC’s proposed decision supports critical investments and provides foundation through 2023 July 30, 2021 PD would support rate base growth of ~6% over GRC track 1 period2 Total company rate base2, $ in Billions 35.7 38.0 40.0 2021 2022 2023 Capex under PD-authorized levels would be $14.0 billion for 2021–2023 Total capital expenditures, $ in Billions 4.7 4.7 4.6 2021 2022 2023 1. HFRA: High Fire Risk Areas 2. Weighted-average year basis. Excludes rate base associated with ~$1.6 billion of AB 1054 excluded capital expenditures and certain projects or programs not yet approved; CSRP application for recovery was filed on July 22, 2021, and is included in rate base starting in 2022 On July 9, CPUC issued proposed decision (PD) in track 1 of SCE’s 2021 GRC, focused on balancing necessary spending on safety and reliability with affordability – Earliest CPUC can vote on PD is August 19 One of the first rate cases to consider broad range of wildfire mitigations, including large deployment of covered conductor in SCE’s HFRA1 Would authorize $6.9 billion base revenue, 90% of request Primary O&M reductions to wildfire insurance premiums and vegetation management costs; however, not expected to materially affect earnings or execution because of balancing and memo accounts for costs above authorized Proposed capital forecast reduction primarily due to reduced scope of Wildfire Covered Conductor Program, which is contrary to Commission and State public policy Would approve ~98% of non-wildfire mitigation-related capital, providing funding for safety and reliability, and continued implementation of State’s public policy goals |
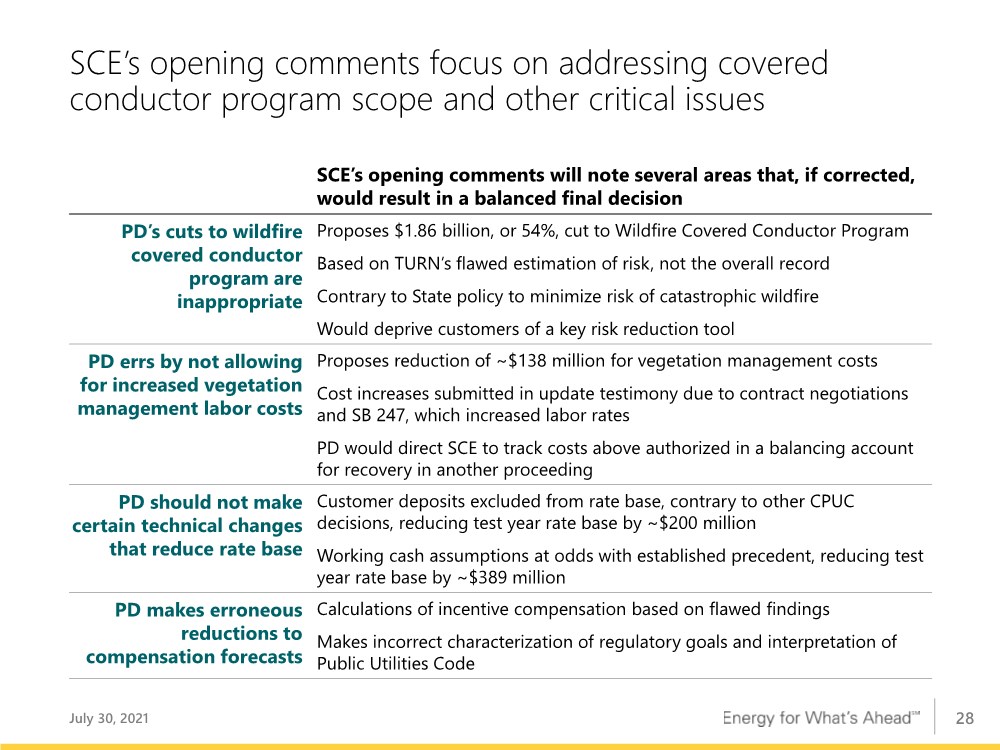
| 28 SCE’s opening comments focus on addressing covered conductor program scope and other critical issues July 30, 2021 SCE’s opening comments will note several areas that, if corrected, would result in a balanced final decision PD’s cuts to wildfire covered conductor program are inappropriate Proposes $1.86 billion, or 54%, cut to Wildfire Covered Conductor Program Based on TURN’s flawed estimation of risk, not the overall record Contrary to State policy to minimize risk of catastrophic wildfire Would deprive customers of a key risk reduction tool PD errs by not allowing for increased vegetation management labor costs Proposes reduction of ~$138 million for vegetation management costs Cost increases submitted in update testimony due to contract negotiations and SB 247, which increased labor rates PD would direct SCE to track costs above authorized in a balancing account for recovery in another proceeding PD should not make certain technical changes that reduce rate base Customer deposits excluded from rate base, contrary to other CPUC decisions, reducing test year rate base by ~$200 million Working cash assumptions at odds with established precedent, reducing test year rate base by ~$389 million PD makes erroneous reductions to compensation forecasts Calculations of incentive compensation based on flawed findings Makes incorrect characterization of regulatory goals and interpretation of Public Utilities Code |
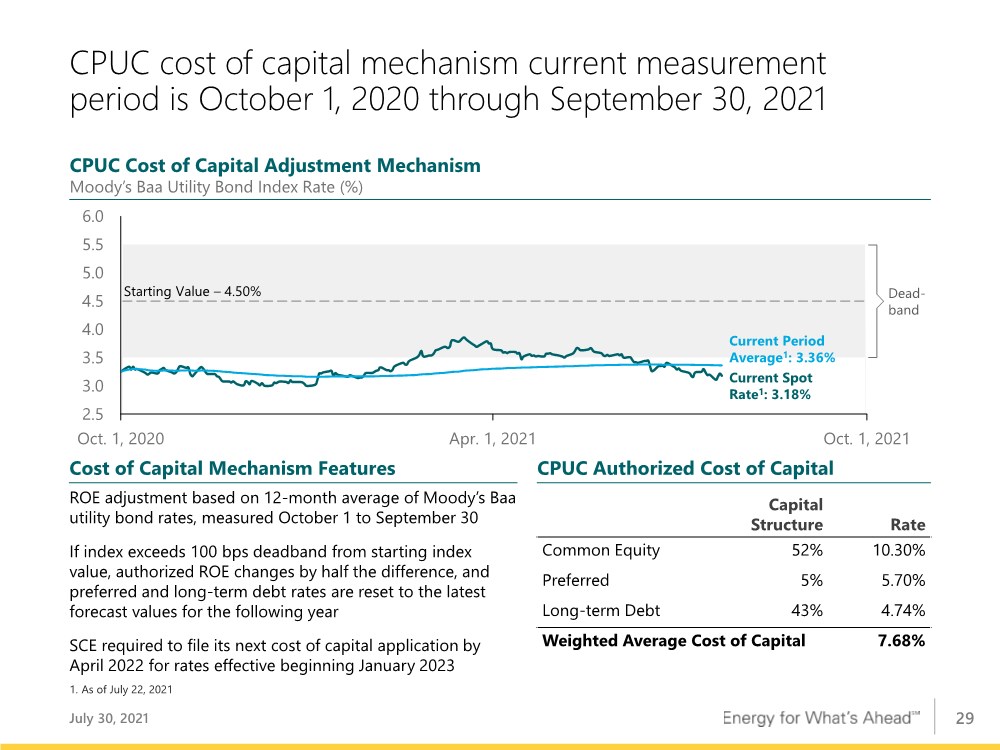
| 29 2.5 3.0 3.5 4.0 4.5 5.0 5.5 6.0 Oct. 1, 2020 Apr. 1, 2021 Oct. 1, 2021 CPUC cost of capital mechanism current measurement period is October 1, 2020 through September 30, 2021 ROE adjustment based on 12-month average of Moody’s Baa utility bond rates, measured October 1 to September 30 If index exceeds 100 bps deadband from starting index value, authorized ROE changes by half the difference, and preferred and long-term debt rates are reset to the latest forecast values for the following year SCE required to file its next cost of capital application by April 2022 for rates effective beginning January 2023 Capital Structure Rate Common Equity 52% 10.30% Preferred 5% 5.70% Long-term Debt 43% 4.74% Weighted Average Cost of Capital 7.68% CPUC Cost of Capital Adjustment Mechanism Moody’s Baa Utility Bond Index Rate (%) Cost of Capital Mechanism Features CPUC Authorized Cost of Capital Current Period Average1: 3.36% 1. As of July 22, 2021 Current Spot Rate1: 3.18% Starting Value – 4.50% Dead- band July 30, 2021 |
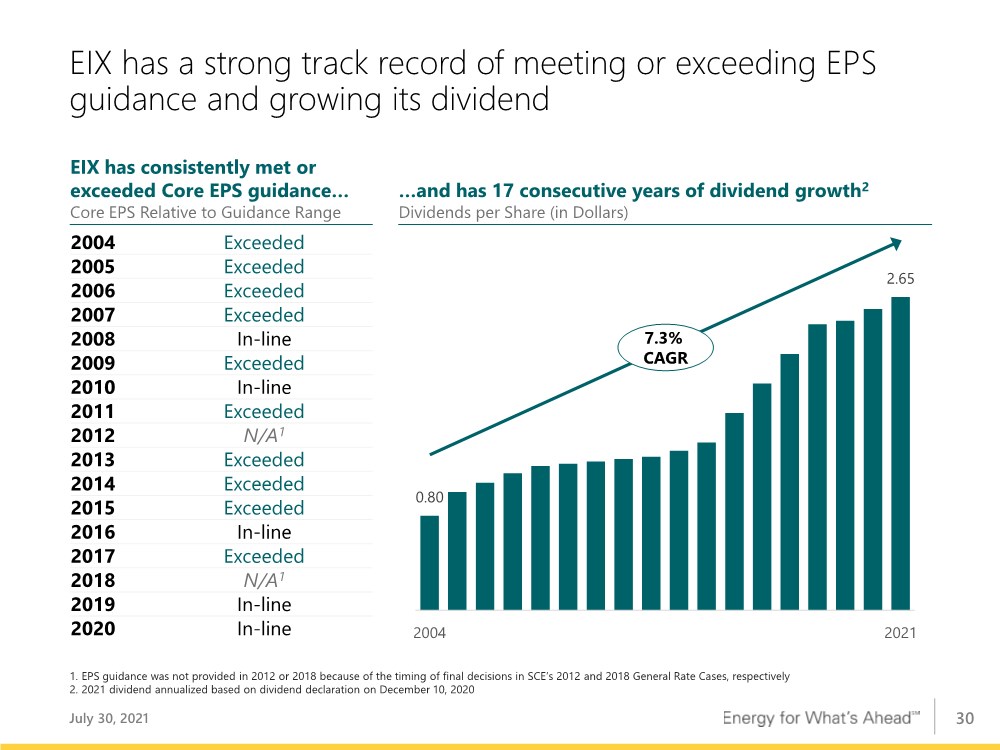
| 30 EIX has a strong track record of meeting or exceeding EPS guidance and growing its dividend 0.80 2.65 2004 2021 7.3% CAGR …and has 17 consecutive years of dividend growth2 Dividends per Share (in Dollars) 1. EPS guidance was not provided in 2012 or 2018 because of the timing of final decisions in SCE’s 2012 and 2018 General Rate Cases, respectively 2. 2021 dividend annualized based on dividend declaration on December 10, 2020 EIX has consistently met or exceeded Core EPS guidance… Core EPS Relative to Guidance Range July 30, 2021 2004 Exceeded 2005 Exceeded 2006 Exceeded 2007 Exceeded 2008 In-line 2009 Exceeded 2010 In-line 2011 Exceeded 2012 N/A1 2013 Exceeded 2014 Exceeded 2015 Exceeded 2016 In-line 2017 Exceeded 2018 N/A1 2019 In-line 2020 In-line |
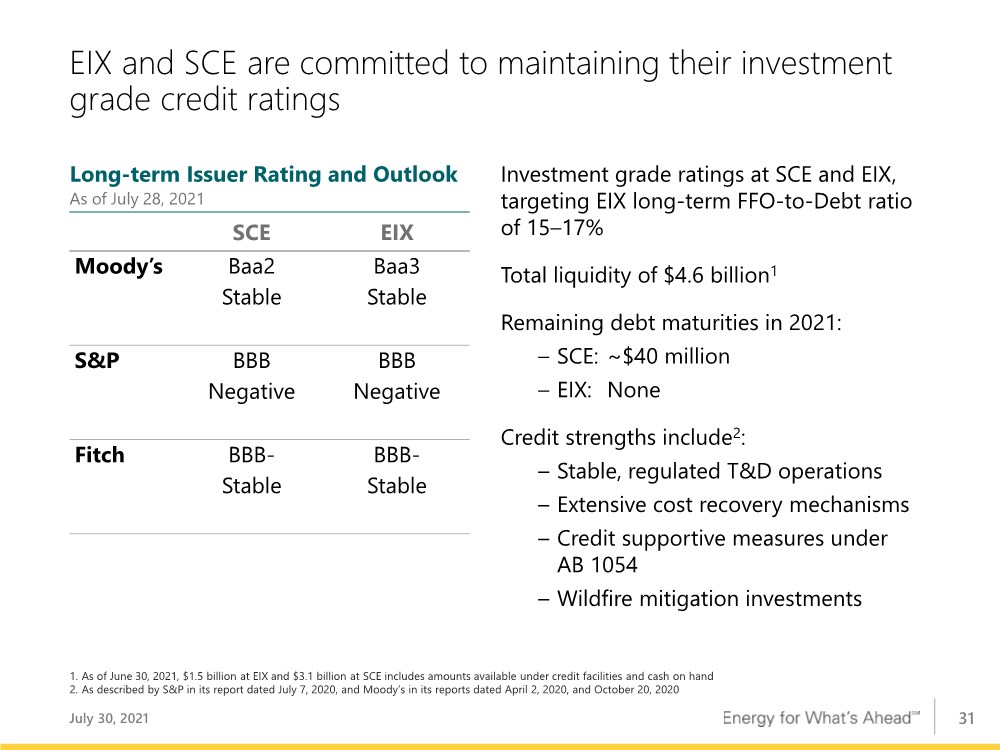
| 31 EIX and SCE are committed to maintaining their investment grade credit ratings SCE EIX Moody’s Baa2 Stable Baa3 Stable S&P BBB Negative BBB Negative Fitch BBB- Stable BBB- Stable Long-term Issuer Rating and Outlook As of July 28, 2021 Investment grade ratings at SCE and EIX, targeting EIX long-term FFO-to-Debt ratio of 15–17% Total liquidity of $4.6 billion1 Remaining debt maturities in 2021: – SCE: ~$40 million – EIX: None Credit strengths include2: – Stable, regulated T&D operations – Extensive cost recovery mechanisms – Credit supportive measures under AB 1054 – Wildfire mitigation investments 1. As of June 30, 2021, $1.5 billion at EIX and $3.1 billion at SCE includes amounts available under credit facilities and cash on hand 2. As described by S&P in its report dated July 7, 2020, and Moody’s in its reports dated April 2, 2020, and October 20, 2020 July 30, 2021 |
| 32 Edison Energy empowers organizations to conquer biggest challenges in energy today: Cost. Carbon. Complex Choices. Partners with market leaders to align energy spend with strategic, financial, and sustainability goals Provide independent, expert advice and services Using an integrated approach, provides energy solutions for clients designed to achieve the right cost, performance, and sustainability outcomes for their organizations Deliver comprehensive data-driven portfolio solutions Provides suite of specialized services across sustainability, analytics, renewables, supply, and energy optimization Serve large-scale, global customer base Clients include 20 of the Fortune 100 Offices in North America and Europe Helped customers execute renewable energy agreements totaling 2.2 GW in 2020 Provide insights for clean energy efforts Supports Edison International’s clean energy, electrification, and sustainability efforts July 30, 2021 |
| Appendix |

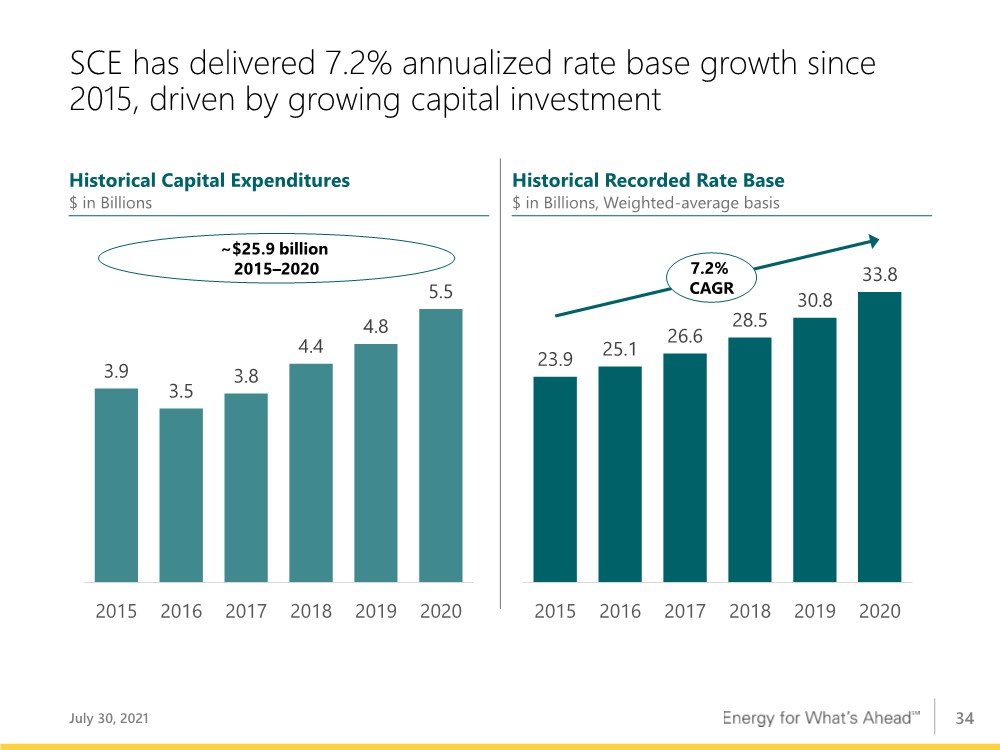
| 34 SCE has delivered 7.2% annualized rate base growth since 2015, driven by growing capital investment Historical Recorded Rate Base $ in Billions, Weighted-average basis Historical Capital Expenditures $ in Billions 3.9 3.5 3.8 4.4 4.8 5.5 2015 2016 2017 2018 2019 2020 23.9 25.1 26.6 28.5 30.8 33.8 2015 2016 2017 2018 2019 2020 7.2% CAGR ~$25.9 billion 2015–2020 July 30, 2021 |
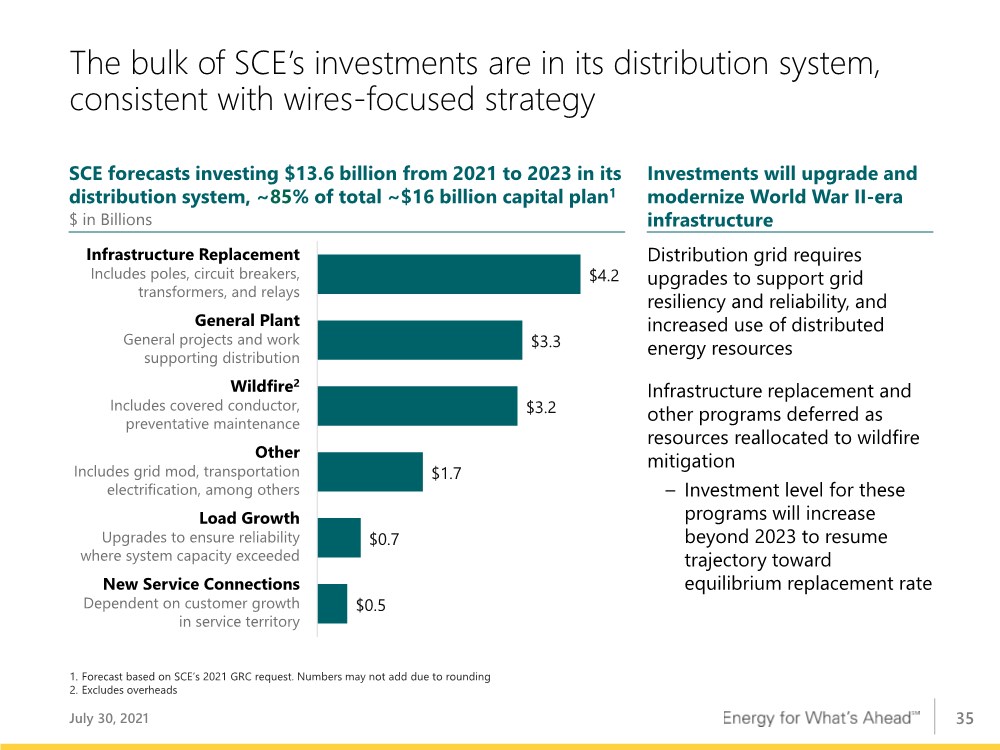
| 35 The bulk of SCE’s investments are in its distribution system, consistent with wires-focused strategy Investments will upgrade and modernize World War II-era infrastructure SCE forecasts investing $13.6 billion from 2021 to 2023 in its distribution system, ~85% of total ~$16 billion capital plan1 $ in Billions $0.5 $0.7 $1.7 $3.2 $3.3 $4.2 Infrastructure Replacement Includes poles, circuit breakers, transformers, and relays General Plant General projects and work supporting distribution Wildfire2 Includes covered conductor, preventative maintenance Other Includes grid mod, transportation electrification, among others Load Growth Upgrades to ensure reliability where system capacity exceeded New Service Connections Dependent on customer growth in service territory 1. Forecast based on SCE’s 2021 GRC request. Numbers may not add due to rounding 2. Excludes overheads Distribution grid requires upgrades to support grid resiliency and reliability, and increased use of distributed energy resources Infrastructure replacement and other programs deferred as resources reallocated to wildfire mitigation – Investment level for these programs will increase beyond 2023 to resume trajectory toward equilibrium replacement rate July 30, 2021 |
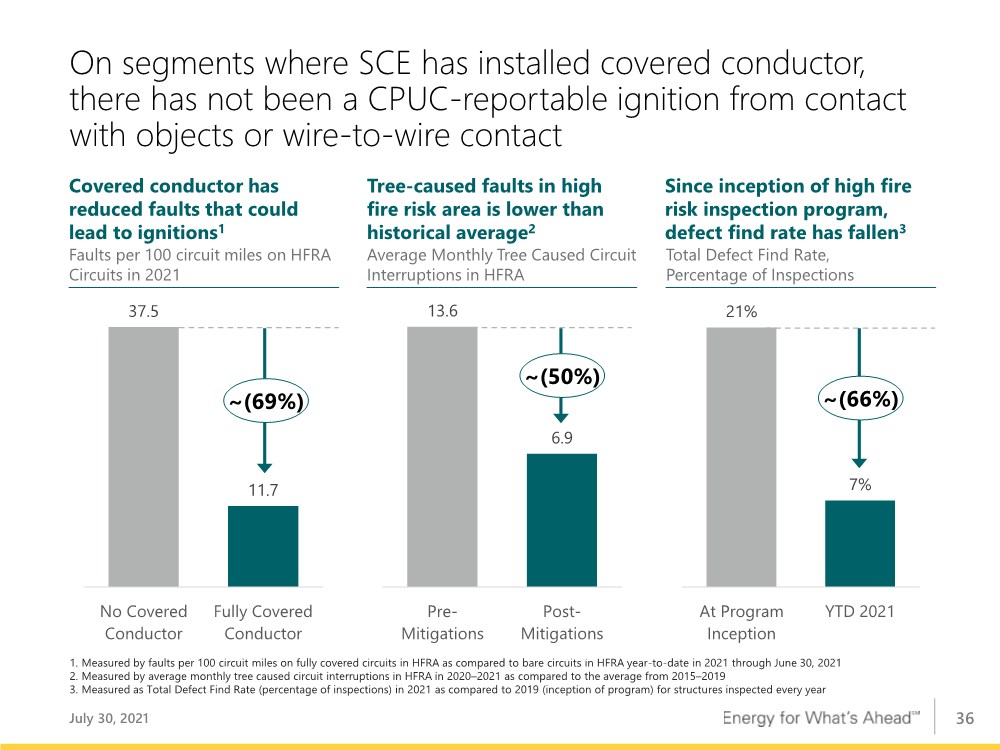
| 36 On segments where SCE has installed covered conductor, there has not been a CPUC-reportable ignition from contact with objects or wire-to-wire contact July 30, 2021 Covered conductor has reduced faults that could lead to ignitions1 Faults per 100 circuit miles on HFRA Circuits in 2021 Since inception of high fire risk inspection program, defect find rate has fallen3 Total Defect Find Rate, Percentage of Inspections 13.6 6.9 Pre- Mitigations Post- Mitigations 37.5 11.7 No Covered Conductor Fully Covered Conductor Tree-caused faults in high fire risk area is lower than historical average2 Average Monthly Tree Caused Circuit Interruptions in HFRA 21% 7% At Program Inception YTD 2021 ~(69%) ~(50%) ~(66%) 1. Measured by faults per 100 circuit miles on fully covered circuits in HFRA as compared to bare circuits in HFRA year-to-date in 2021 through June 30, 2021 2. Measured by average monthly tree caused circuit interruptions in HFRA in 2020–2021 as compared to the average from 2015–2019 3. Measured as Total Defect Find Rate (percentage of inspections) in 2021 as compared to 2019 (inception of program) for structures inspected every year |
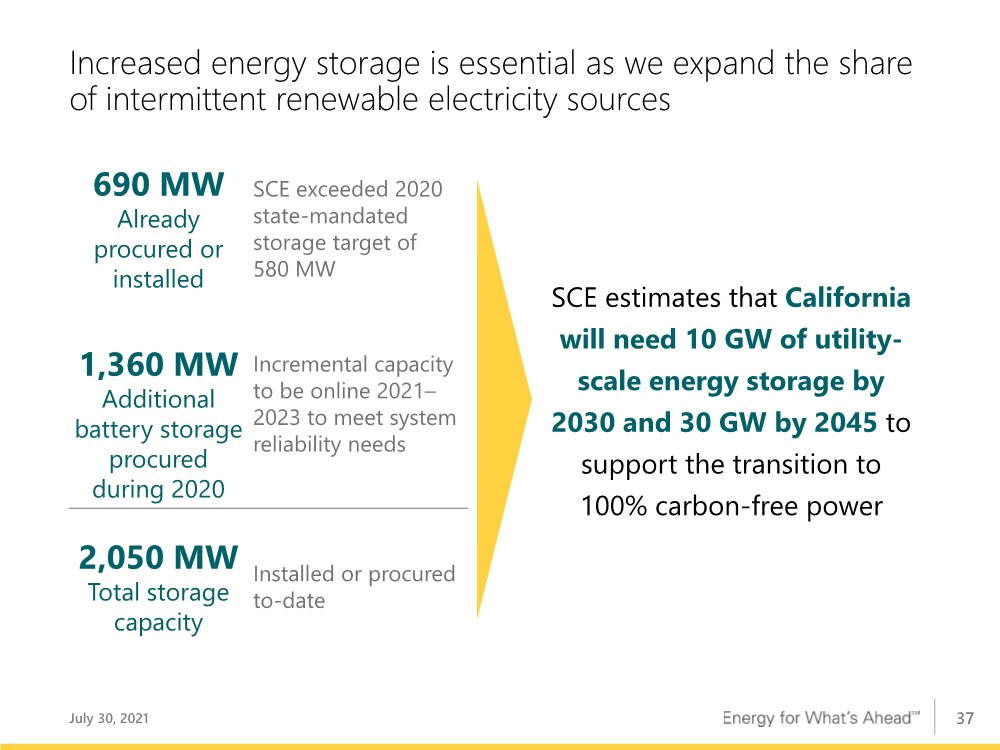
| 37 Increased energy storage is essential as we expand the share of intermittent renewable electricity sources SCE estimates that California will need 10 GW of utility- scale energy storage by 2030 and 30 GW by 2045 to support the transition to 100% carbon-free power 690 MW Already procured or installed SCE exceeded 2020 state-mandated storage target of 580 MW 1,360 MW Additional battery storage procured during 2020 Incremental capacity to be online 2021– 2023 to meet system reliability needs 2,050 MW Total storage capacity Installed or procured to-date July 30, 2021 |
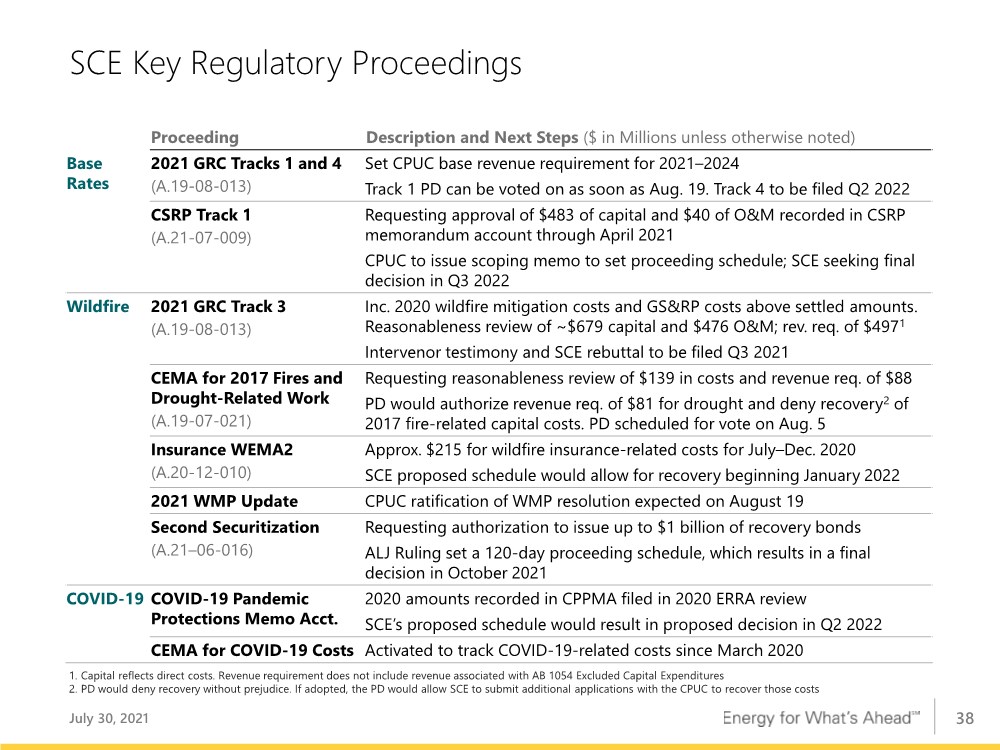
| 38 SCE Key Regulatory Proceedings Proceeding Description and Next Steps ($ in Millions unless otherwise noted) Base Rates 2021 GRC Tracks 1 and 4 (A.19-08-013) Set CPUC base revenue requirement for 2021–2024 Track 1 PD can be voted on as soon as Aug. 19. Track 4 to be filed Q2 2022 CSRP Track 1 (A.21-07-009) Requesting approval of $483 of capital and $40 of O&M recorded in CSRP memorandum account through April 2021 CPUC to issue scoping memo to set proceeding schedule; SCE seeking final decision in Q3 2022 Wildfire 2021 GRC Track 3 (A.19-08-013) Inc. 2020 wildfire mitigation costs and GS&RP costs above settled amounts. Reasonableness review of ~$679 capital and $476 O&M; rev. req. of $4971 Intervenor testimony and SCE rebuttal to be filed Q3 2021 CEMA for 2017 Fires and Drought-Related Work (A.19-07-021) Requesting reasonableness review of $139 in costs and revenue req. of $88 PD would authorize revenue req. of $81 for drought and deny recovery2 of 2017 fire-related capital costs. PD scheduled for vote on Aug. 5 Insurance WEMA2 (A.20-12-010) Approx. $215 for wildfire insurance-related costs for July–Dec. 2020 SCE proposed schedule would allow for recovery beginning January 2022 2021 WMP Update CPUC ratification of WMP resolution expected on August 19 Second Securitization (A.21–06-016) Requesting authorization to issue up to $1 billion of recovery bonds ALJ Ruling set a 120-day proceeding schedule, which results in a final decision in October 2021 COVID-19 COVID-19 Pandemic Protections Memo Acct. 2020 amounts recorded in CPPMA filed in 2020 ERRA review SCE’s proposed schedule would result in proposed decision in Q2 2022 CEMA for COVID-19 Costs Activated to track COVID-19-related costs since March 2020 July 30, 2021 1. Capital reflects direct costs. Revenue requirement does not include revenue associated with AB 1054 Excluded Capital Expenditures 2. PD would deny recovery without prejudice. If adopted, the PD would allow SCE to submit additional applications with the CPUC to recover those costs |
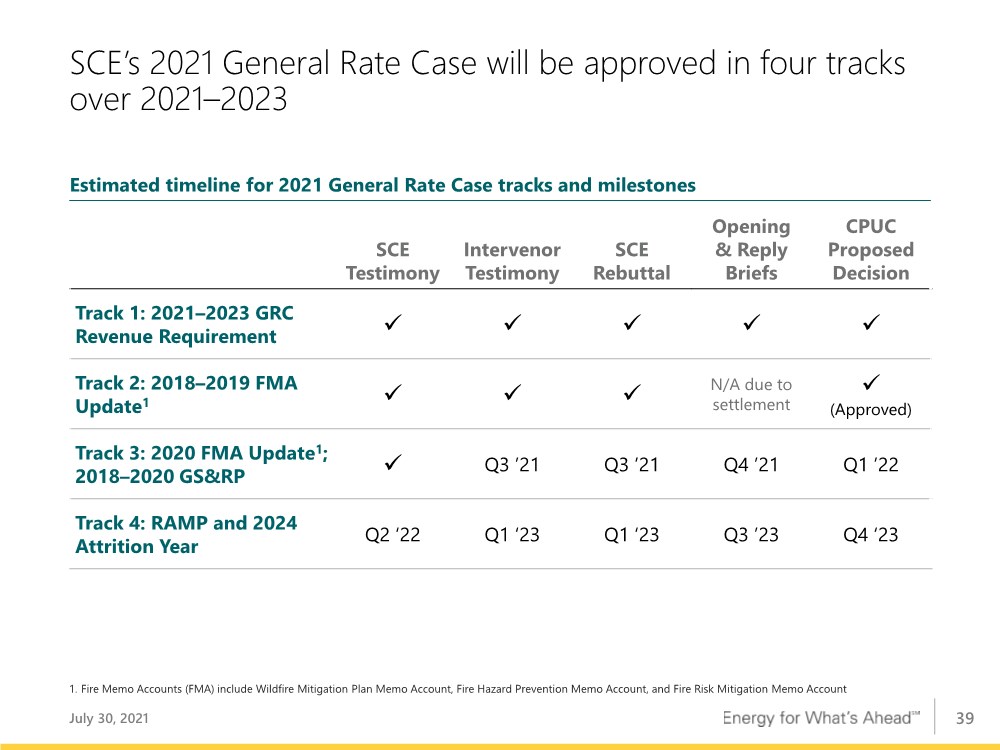
| 39 SCE’s 2021 General Rate Case will be approved in four tracks over 2021–2023 SCE Testimony Intervenor Testimony SCE Rebuttal Opening & Reply Briefs CPUC Proposed Decision Track 1: 2021–2023 GRC Revenue Requirement ✓ ✓ ✓ ✓ ✓ Track 2: 2018–2019 FMA Update1 ✓ ✓ ✓ N/A due to settlement ✓ (Approved) Track 3: 2020 FMA Update1; 2018–2020 GS&RP ✓ Q3 ’21 Q3 ’21 Q4 ’21 Q1 ’22 Track 4: RAMP and 2024 Attrition Year Q2 ‘22 Q1 ‘23 Q1 ‘23 Q3 ’23 Q4 ‘23 1. Fire Memo Accounts (FMA) include Wildfire Mitigation Plan Memo Account, Fire Hazard Prevention Memo Account, and Fire Risk Mitigation Memo Account July 30, 2021 Estimated timeline for 2021 General Rate Case tracks and milestones |
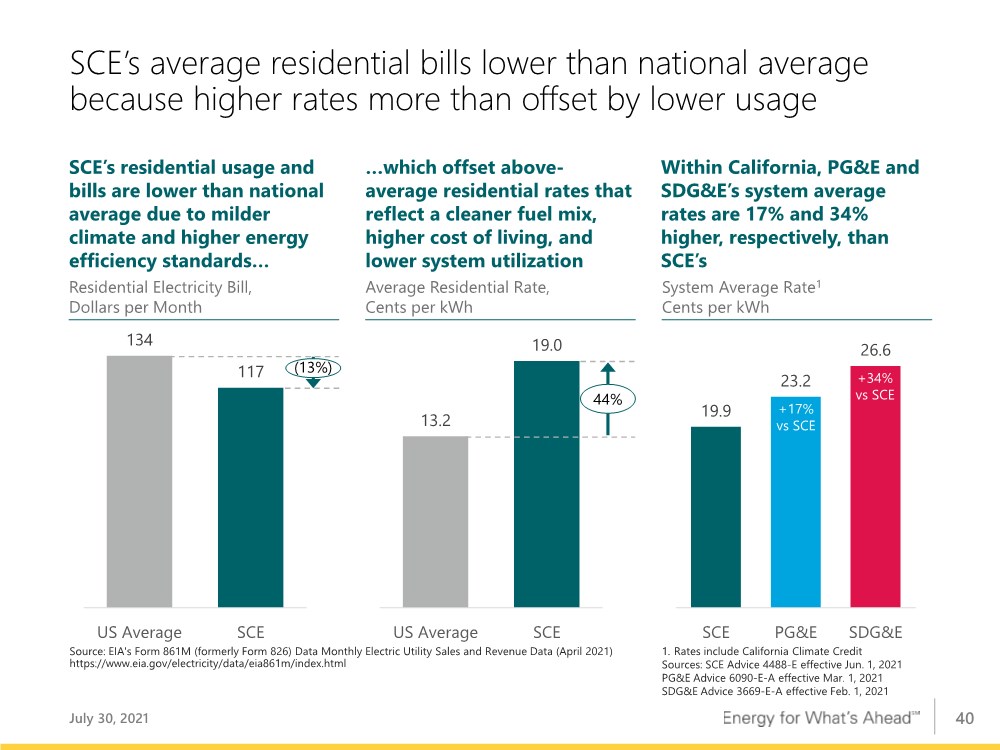
| 40 SCE’s average residential bills lower than national average because higher rates more than offset by lower usage July 30, 2021 …which offset above- average residential rates that reflect a cleaner fuel mix, higher cost of living, and lower system utilization Average Residential Rate, Cents per kWh SCE’s residential usage and bills are lower than national average due to milder climate and higher energy efficiency standards… Residential Electricity Bill, Dollars per Month Within California, PG&E and SDG&E’s system average rates are 17% and 34% higher, respectively, than SCE’s System Average Rate1 Cents per kWh Source: EIA's Form 861M (formerly Form 826) Data Monthly Electric Utility Sales and Revenue Data (April 2021) https://www.eia.gov/electricity/data/eia861m/index.html 13.2 19.0 US Average SCE 134 117 US Average SCE 44% 19.9 23.2 26.6 SCE PG&E SDG&E 1. Rates include California Climate Credit Sources: SCE Advice 4488-E effective Jun. 1, 2021 PG&E Advice 6090-E-A effective Mar. 1, 2021 SDG&E Advice 3669-E-A effective Feb. 1, 2021 +17% vs SCE +34% vs SCE (13%) |
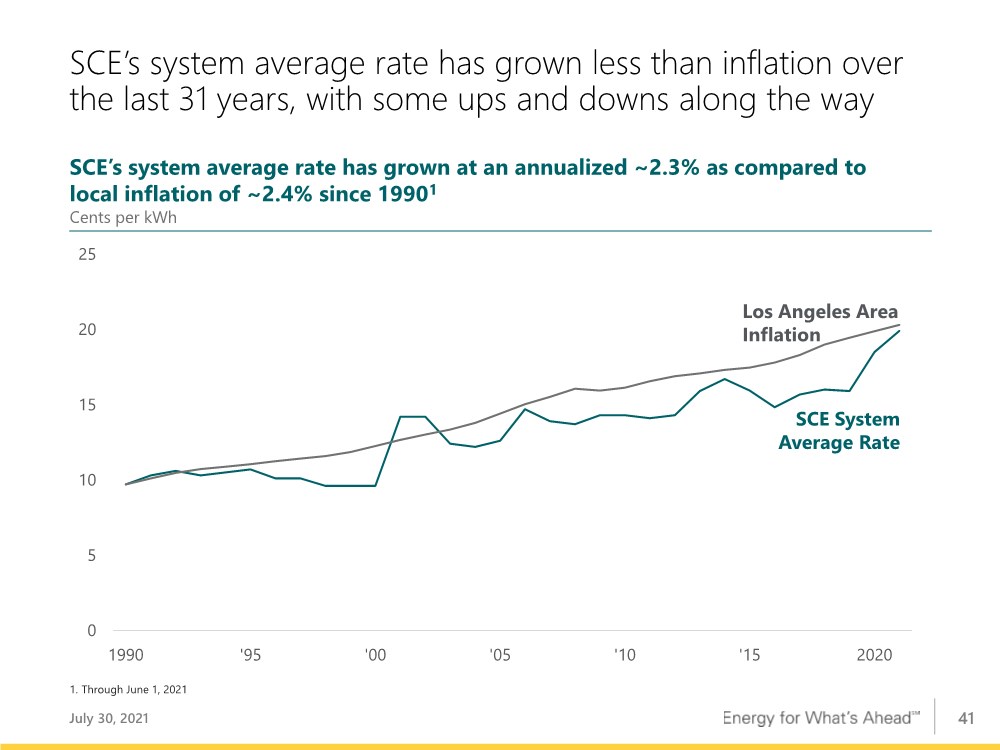
| 41 SCE’s system average rate has grown less than inflation over the last 31 years, with some ups and downs along the way July 30, 2021 SCE’s system average rate has grown at an annualized ~2.3% as compared to local inflation of ~2.4% since 19901 Cents per kWh 0 5 10 15 20 25 1990 '95 '00 '05 '10 '15 2020 SCE System Average Rate Los Angeles Area Inflation 1. Through June 1, 2021 |
| 42 Edison International's earnings are prepared in accordance with generally accepted accounting principles used in the United States. Management uses core earnings (losses) internally for financial planning and for analysis of performance. Core earnings (losses) are also used when communicating with investors and analysts regarding Edison International's earnings results to facilitate comparisons of the company's performance from period to period. Core earnings (losses) are a non-GAAP financial measure and may not be comparable to those of other companies. Core earnings (losses) are defined as earnings attributable to Edison International shareholders less non-core items. Non- core items include income or loss from discontinued operations and income or loss from significant discrete items that management does not consider representative of ongoing earnings, such as write downs, asset impairments and other income and expense related to changes in law, outcomes in tax, regulatory or legal proceedings, and exit activities, including sale of certain assets and other activities that are no longer continuing. A reconciliation of Non-GAAP information to GAAP information is included either on the slide where the information appears or on another slide referenced in this presentation. EIX Investor Relations Contact Sam Ramraj, Vice President (626) 302-2540 sam.ramraj@edisonintl.com Use of Non-GAAP Financial Measures July 30, 2021 |