Attached files
| file | filename |
|---|---|
| 8-K - 8-K - WESTINGHOUSE AIR BRAKE TECHNOLOGIES CORP | brhc10027316_8k.htm |
| EX-99.1 - EXHIBIT 99.1 - WESTINGHOUSE AIR BRAKE TECHNOLOGIES CORP | brhc10027316_ex99-1.htm |
Exhibit 99.2

Wabtec 2nd Quarter 2021 Financial Results & Company HighlightsJuly 29, 2021

Forward looking statements & non-GAAP financial information This communication contains
“forward-looking” statements as that term is defined in Section 27A of the Securities Act of 1933, as amended, and Section 21E of the Securities Exchange Act of 1934, as amended by the Private Securities Litigation Reform Act of 1995, including
statements regarding the acquisition by Wabtec of GE Transportation (the “GE Transportation merger”), statements regarding Wabtec’s expectations about future sales and earnings and statements about the impact of evolving global conditions on
Wabtec’s business. All statements, other than historical facts, including statements synergies from the GE Transportation merger; statements regarding Wabtec’s plans, objectives, expectations and intentions; and statements regarding
macro-economic conditions and evolving production and demand conditions; and any assumptions underlying any of the foregoing, are forward-looking statements. Forward-looking statements concern future circumstances and results and other
statements that are not historical facts and are sometimes identified by the words “may,” “will,” “should,” “potential,” “intend,” “expect,” “endeavor,” “seek,” “anticipate,” “estimate,” “overestimate,” “underestimate,” “believe,” “could,”
“project,” “predict,” “continue,” “target” or other similar words or expressions. Forward-looking statements are based upon current plans, estimates and expectations that are subject to risks, uncertainties and assumptions. Should one or more
of these risks or uncertainties materialize, or should underlying assumptions prove incorrect, actual results may vary materially from those indicated or anticipated by such forward-looking statements. The inclusion of such statements should
not be regarded as a representation that such plans, estimates or expectations will be achieved. Important factors that could cause actual results to differ materially from such plans, estimates or expectations include, among others, (1)
unexpected costs, charges or expenses resulting from acquisitions, including the GE Transportation merger; (2) uncertainty of Wabtec’s expected financial performance; (3) failure to realize the anticipated benefits of acquisitions, including as
a result of integrating acquired targets into Wabtec; (4) Wabtec’s ability to implement its business strategy; (5) difficulties and delays in achieving revenue and cost synergies; (6) inability to retain and hire key personnel; (7) evolving
legal, regulatory and tax regimes; (8) changes in general economic and/or industry specific conditions, including the impacts of tax and tariff programs, industry consolidation and changes in the financial condition or operating strategies of
our customers; (9) changes in the expected timing of projects; (10) a decrease in freight or passenger rail traffic; (11) an increase in manufacturing costs; (12) actions by third parties, including government agencies; (13) the severity and
duration of the evolving COVID-19 pandemic and the resulting impact on the global economy and, in particular, our customers, suppliers and end-markets; and (14) other risk factors as detailed from time to time in Wabtec’s reports filed with the
SEC, including Wabtec’s annual report on Form 10-K, periodic quarterly reports on Form 10-Q, periodic current reports on Form 8-K and other documents filed with the SEC. The foregoing list of important factors is not exclusive. Any
forward-looking statements speak only as of the date of this communication. Wabtec does not undertake any obligation to update any forward-looking statements, whether as a result of new information or development, future events or otherwise,
except as required by law. Readers are cautioned not to place undue reliance on any of these forward-looking statements.This presentation as well as Wabtec’s earnings release and 2021 financial guidance mention certain non-GAAP financial
performance measures, including adjusted gross profit, adjusted operating expenses, adjusted income from operations, adjusted interest and other expense, adjusted operating margin, adjusted income tax expense, adjusted effective tax rate,
adjusted earnings per diluted share, EBITDA and adjusted EBITDA, net debt, cash conversion rate and book-to-bill ratio. Wabtec defines EBITDA as earnings before interest, taxes, depreciation and amortization. Wabtec defines book-to-bill ratio
as new orders divided by sales. While Wabtec believes these are useful supplemental measures for investors, they are not presented in accordance with GAAP. Investors should not consider non-GAAP measures in isolation or as a substitute for net
income, cash flows from operations, or any other items calculated in accordance with GAAP. In addition, the non-GAAP financial measures included in this presentation have inherent material limitations as performance measures because they add
back certain expenses incurred by the company to GAAP financial measures, resulting in those expenses not being taken into account in the applicable non-GAAP financial measure. Because not all companies use identical calculations, Wabtec’s
presentation of non-GAAP financial measures may not be comparable to other similarly titled measures of other companies. Included in this presentation are reconciliation tables that provide details about how adjusted results relate to GAAP
results.

Today’s participants Rafael SantanaPresident & Chief Executive Officer Pat DuganChief Financial
Officer & Executive Vice President Eric GebhardtChief Technology Officer & Executive Vice President Kristine KubackiVice President, Investor Relations PRESENTERS INVESTOR RELATIONS

2Q 2021 overview Proven execution driving growth through the recovery 2nd quarter cash from
operations was negatively impacted by securitization of accounts receivable of $11M. SALES ADJUSTED OPERATING MARGIN ADJUSTED EARNINGS PER SHARE CASH FROM OPERATIONS (1) BACKLOG $1.06 GAAP:
$0.66 $2.0B 15.2% $223M $21.5B Recovery continues across portfolioOrganic sales growth in Transit, Freight Services and Components, offset by lower locomotive deliveriesOn track to achieve $250M synergy run-rate in 2021 … continued focus
on Lean initiatives Robust cash generation … year-to-date cash from operations >$0.5BYear-to-date book-to-bill >1… strong order pipeline for international locomotives 2Q 2021 HIGHLIGHTS GAAP: 10.1%
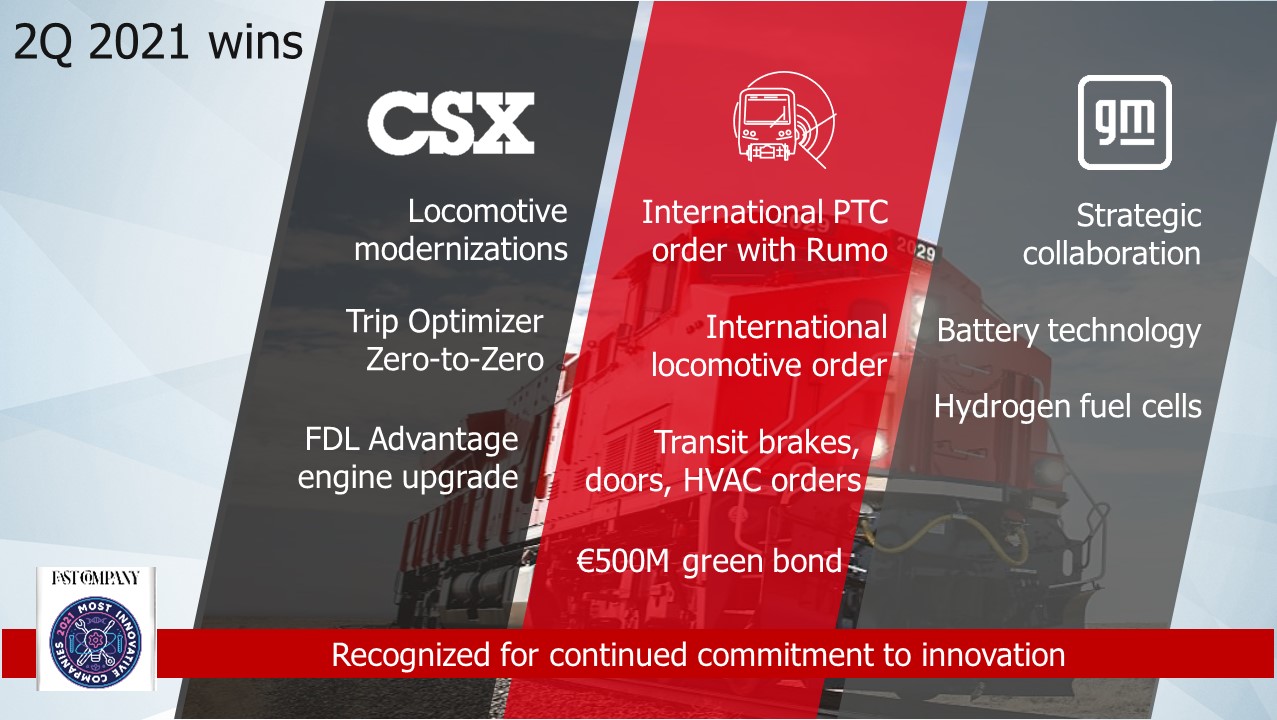
2Q 2021 wins FDL Advantage engine upgrade International PTCorder with RumoInternational
locomotive order Strategic collaborationBattery technologyHydrogen fuel cells Transit brakes, doors, HVAC orders Recognized for continued commitment to innovation Locomotive modernizations Trip Optimizer Zero-to-Zero €500M green bond
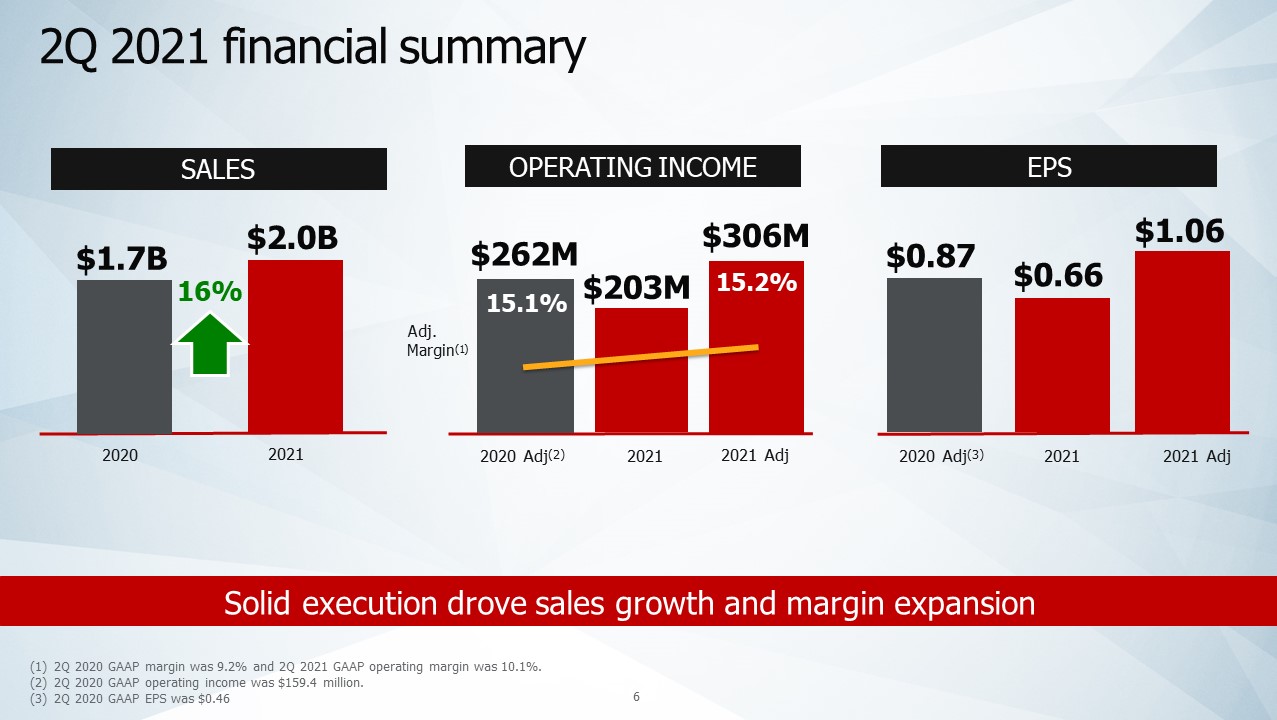
2Q 2021 financial summary SALES 2021 OPERATING INCOME 2021 EPS 2021 Adj 2020 Adj(3) 2021
2020 2021 Adj 2020 Adj(2) $2.0B $203M $0.66 $1.7B $262M $306M $0.87 $1.06 16% Adj. Margin(1) 15.1% 15.2% 2Q 2020 GAAP margin was 9.2% and 2Q 2021 GAAP operating margin was 10.1%.2Q 2020 GAAP operating income was
$159.4 million.2Q 2020 GAAP EPS was $0.46 Solid execution drove sales growth and margin expansion

2Q 2021 Freight segment performance PRODUCT LINE YoY Equipment (2%) Lower loco deliveries
driven by NA; Mining in recovery Components 15% Improving aftermarket & industrial offset by 19% decline in NA OE railcar build Services 22% Improving YoY freight trends drove unparking of locos … Nordco acquisition Digital
Electronics (2%) Order momentum book-to-bill >1 … continued international expansion of PTC; constrained NA capex spend SALES 2021 OPERATING INCOME 2021 BACKLOG 2Q21 1Q21 2020 2021 Adj 2020
Adj(2) $1.3B $173M $1.2B $229M $247M(3) $18.0B $17.8B(4) 19.0% 18.5% 11% 2Q 2020 Freight segment margin was 11.7% and 2Q 2021 Freight segment margin was 13.0%. 2Q 2020 Freight segment operating income was $141.5 million.Freight
segment income from operations was positively impacted by below market intangible amortization of $7 million. Freight segment income was adjusted by the following expenses: $6 million for restructuring and transaction costs and $68 million for
amortization expenses. Foreign exchange rates had a positive $81 million impact on the segment backlog. Adj Margin(1)
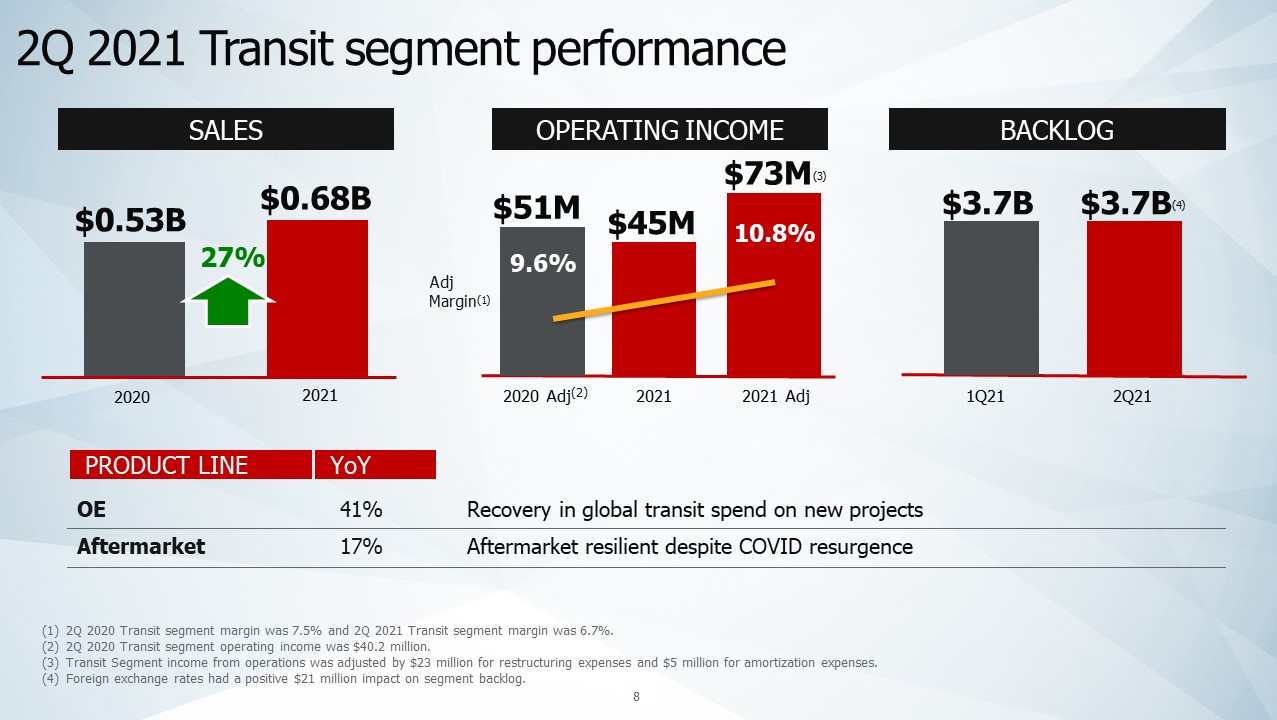
2Q 2021 Transit segment performance PRODUCT LINE YoY OE 41% Recovery in global transit spend on
new projects Aftermarket 17% Aftermarket resilient despite COVID resurgence SALES 2021 OPERATING INCOME 2021 BACKLOG 2Q21 1Q21 2020 2021 Adj 2020
Adj(2) $0.68B $45M $0.53B $51M $73M(3) $3.7B $3.7B(4) 9.6% 10.8% 2Q 2020 Transit segment margin was 7.5% and 2Q 2021 Transit segment margin was 6.7%. 2Q 2020 Transit segment operating income was $40.2 million.Transit Segment
income from operations was adjusted by $23 million for restructuring expenses and $5 million for amortization expenses.Foreign exchange rates had a positive $21 million impact on segment backlog. Adj Margin(1) 27%
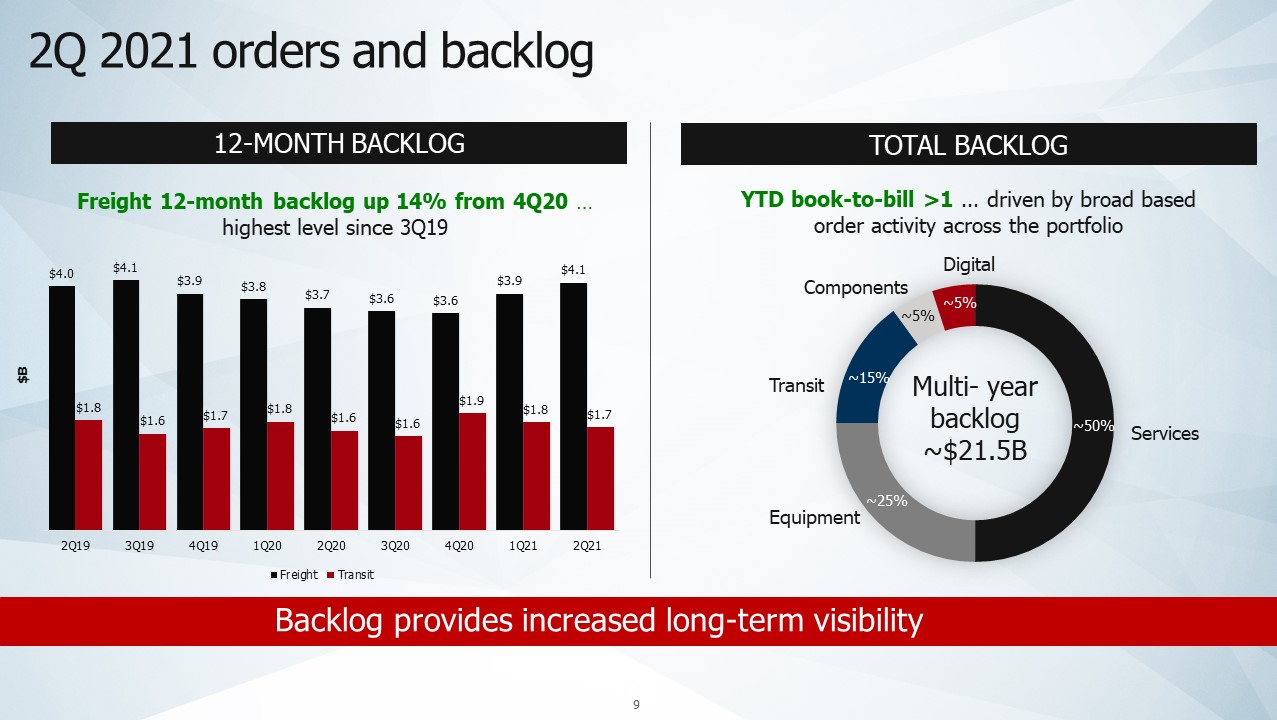
2Q 2021 orders and backlog TOTAL BACKLOG Backlog provides increased long-term visibility 12-MONTH
BACKLOG Freight 12-month backlog up 14% from 4Q20 … highest level since 3Q19 YTD book-to-bill >1 ... driven by broad based order activity across the portfolio Multi- year backlog
~$21.5B Services Digital Components Transit Equipment ~5% ~50% ~25% ~5% ~15%
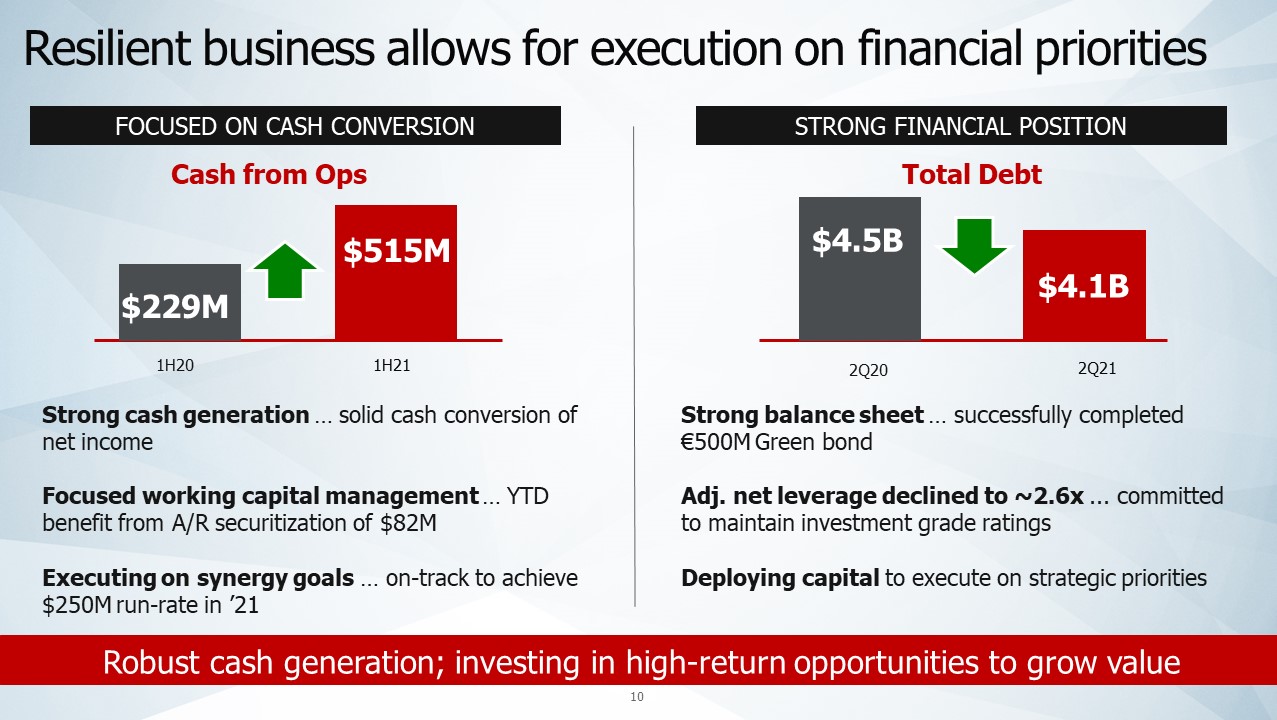
Resilient business allows for execution on financial priorities FOCUSED ON CASH
CONVERSION 1H21 1H20 $229M $515M Cash from Ops Strong cash generation … solid cash conversion of net incomeFocused working capital management … YTD benefit from A/R securitization of $82MExecuting on synergy goals … on-track to
achieve $250M run-rate in ’21 STRONG FINANCIAL POSITION 2Q21 2Q20 $4.1B Total Debt $4.5B Strong balance sheet … successfully completed €500M Green bondAdj. net leverage declined to ~2.6x ... committed to maintain investment grade
ratingsDeploying capital to execute on strategic priorities Robust cash generation; investing in high-return opportunities to grow value

Market outlook and guidance (1) Cash from Operations conversion % is defined as GAAP Cash from
Operations divided by GAAP Net Income plus Depreciation & Amortization FREIGHT NA carloads Locomotive & railcar parkings International freight volumes NA railcar production Mining
commodities TRANSIT Infrastructure investment Global ridership 2021 Market Outlook(vs 2020) Prior 2021 Guidance(as of 1Q21 earnings call) Updated 2021 Guidance REVENUES $7.7B to $7.9B $7.9B to $8.2B GAAP EPS $2.80 to
$3.05 $2.87 to $3.07 ADJUSTED EPS $4.05 to $4.30 $4.15 to $4.35 CASH CONVERSION(1) >90% >90%
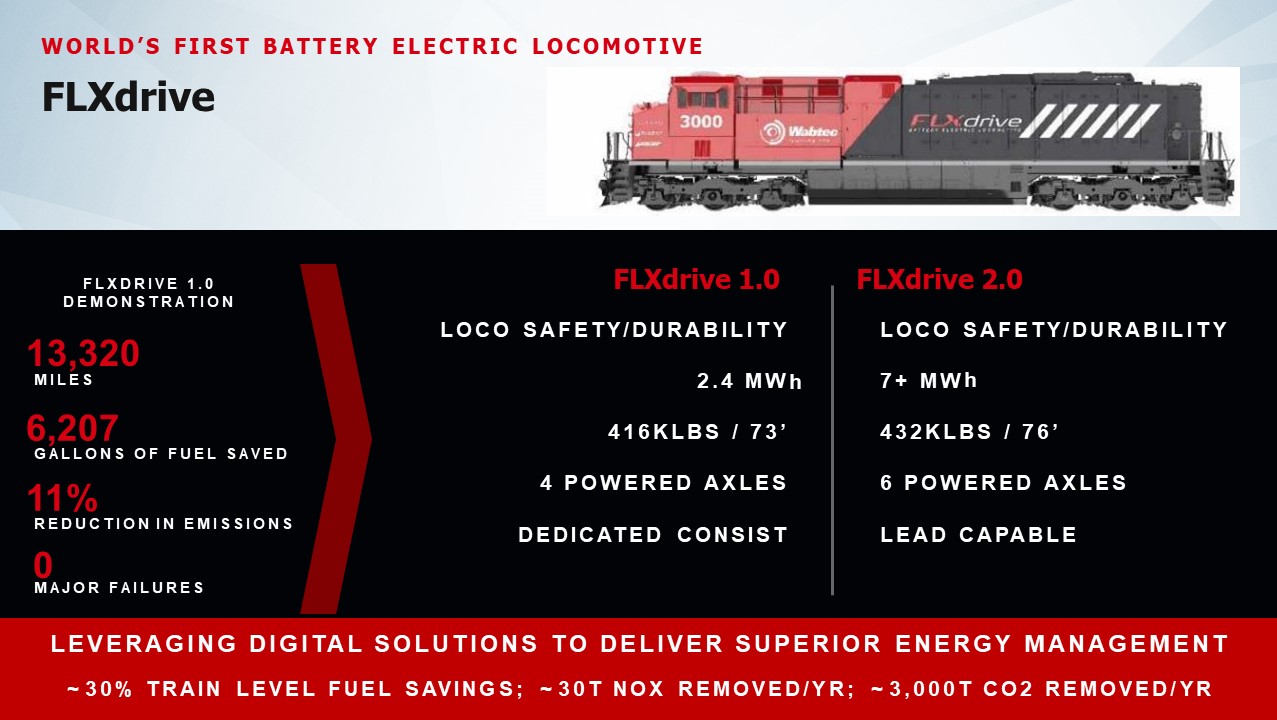
FLXdrive World’s first battery electric locomotive Loco safety/durability7+ mw432klbs / 76’6
powered axlesLead capable Loco safety/durability2.4 mw416klbs / 73’4 powered axlesDedicated consist FLXdrive 1.0 FLXdrive 2.0 Leveraging DIGITAL SOLUTIONS to deliver superior energy management~ 30% train level fuel savings; ~ 30t nox
removed/YR; ~ 3,000t co2 removed/YR Flxdrive 1.0 demonstration miles 13,320 Gallons of fuel saved 6,207 Major failures 0 Reduction in emissions 11% h h
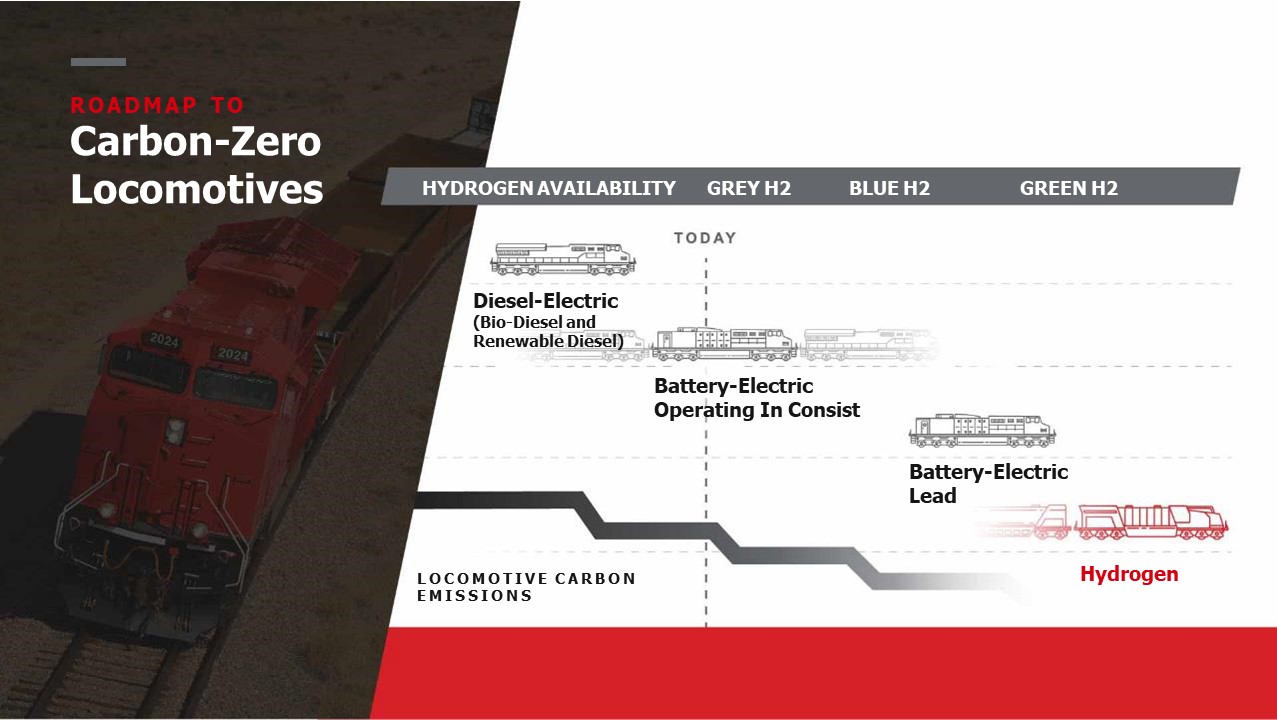
Carbon-ZeroLocomotives Roadmap to Diesel-Electric(Bio-Diesel and Renewable
Diesel) Battery-ElectricOperating In Consist Battery-Electric Lead Hydrogen HYDROGEN AVAILABILITY GREY H2 BLUE H2 GREEN H2 Locomotive Carbonemissions
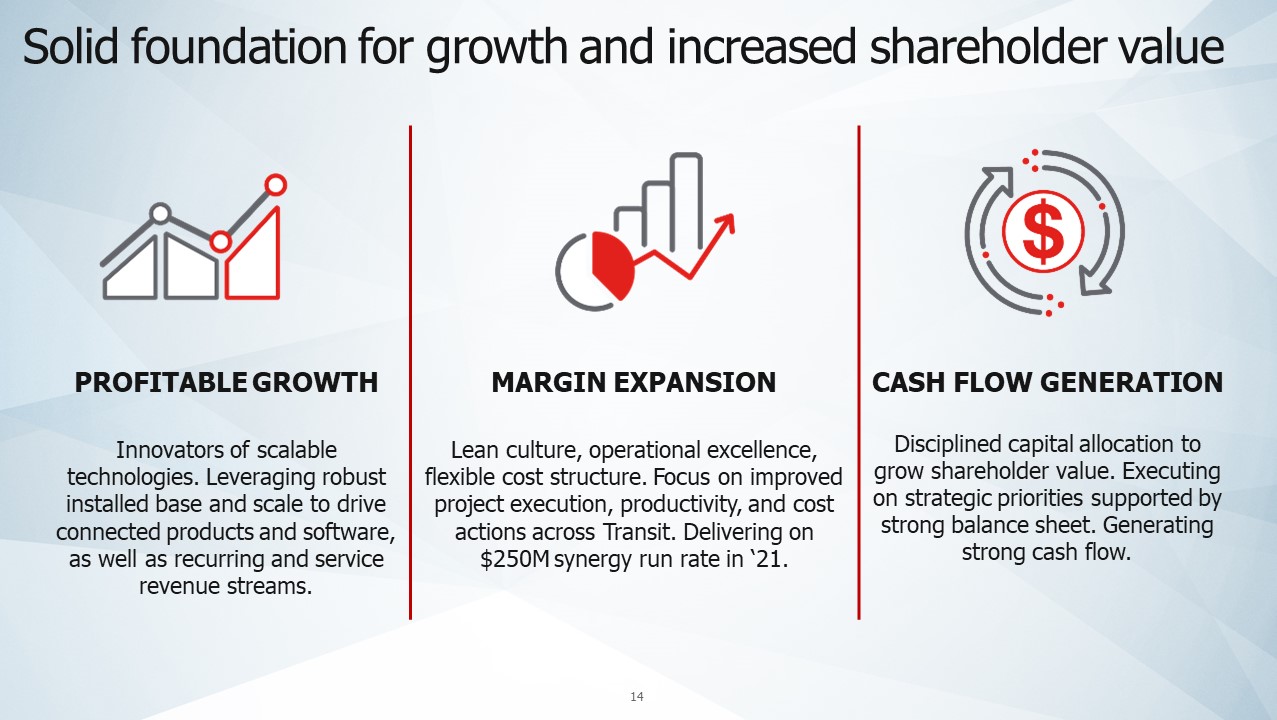
Solid foundation for growth and increased shareholder value PROFITABLE GROWTHInnovators of
scalable technologies. Leveraging robust installed base and scale to drive connected products and software, as well as recurring and service revenue streams. MARGIN EXPANSIONLean culture, operational excellence, flexible cost structure. Focus
on improved project execution, productivity, and cost actions across Transit. Delivering on $250M synergy run rate in ‘21. CASH FLOW GENERATIONDisciplined capital allocation to grow shareholder value. Executing on strategic priorities
supported by strong balance sheet. Generating strong cash flow.


Appendix

Income statement Appendix A ( 1 of 2)
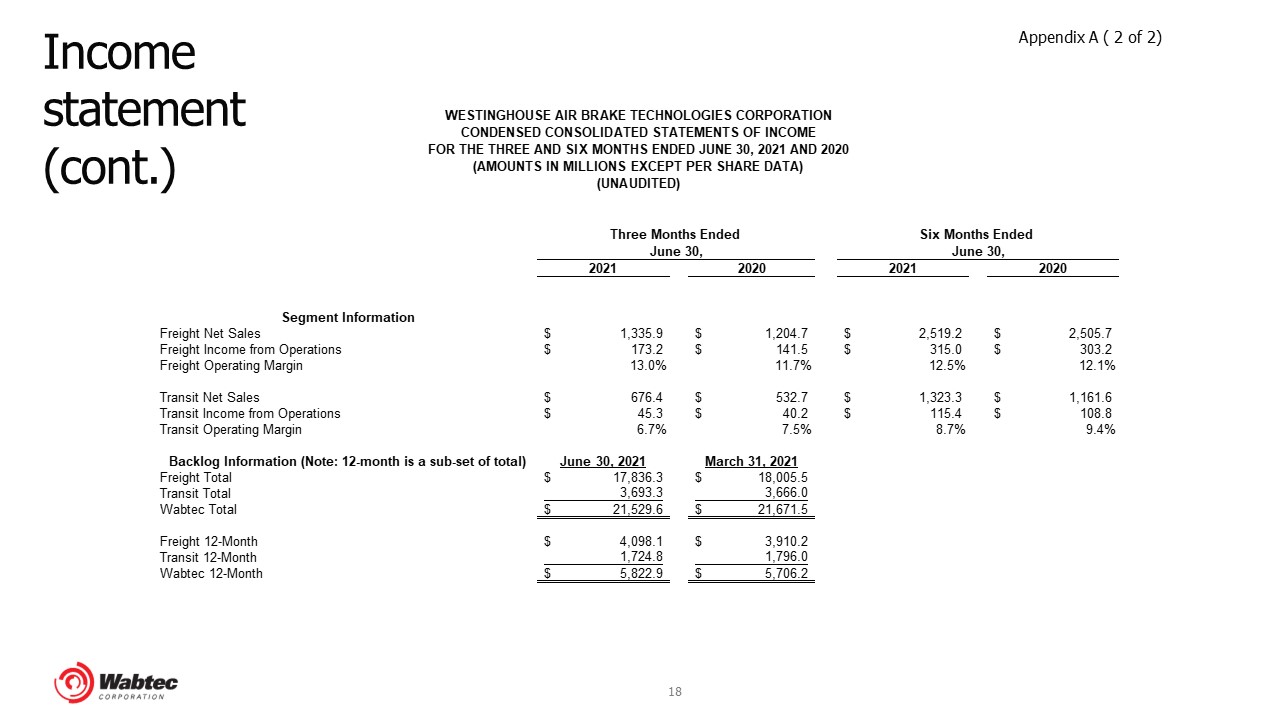
Income statement(cont.) Appendix A ( 2 of 2)
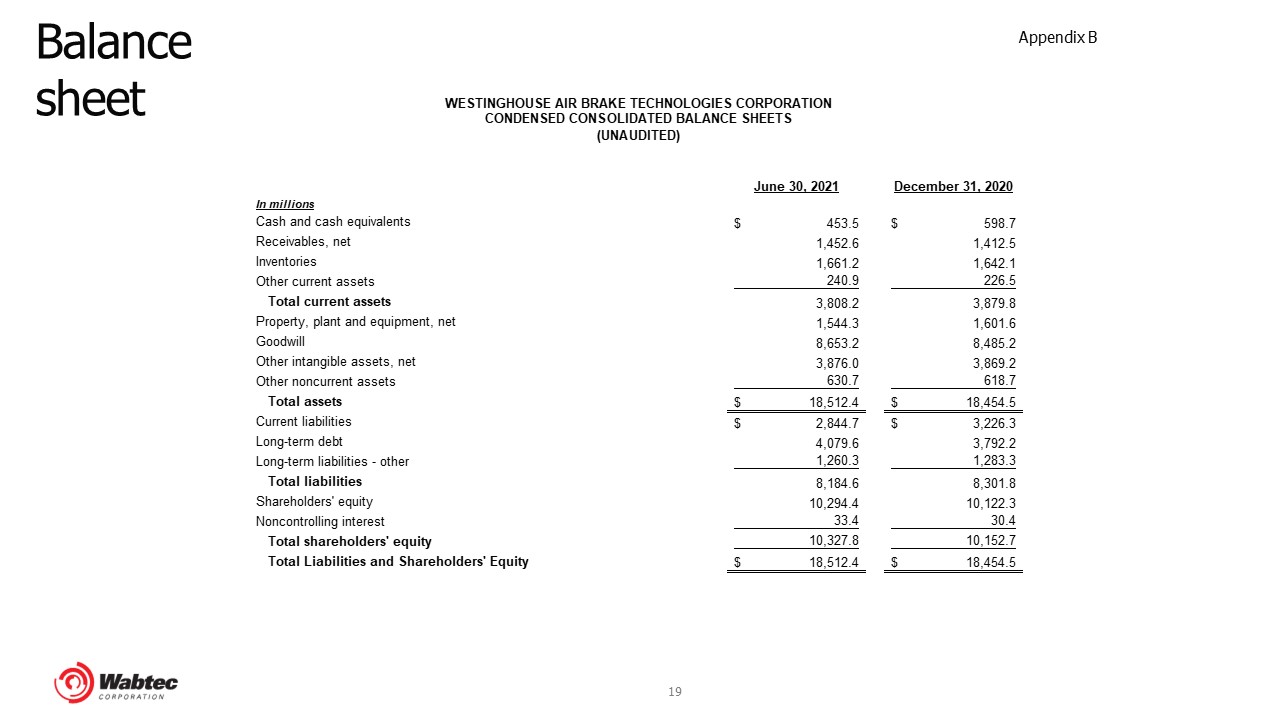
Balance sheet Appendix B
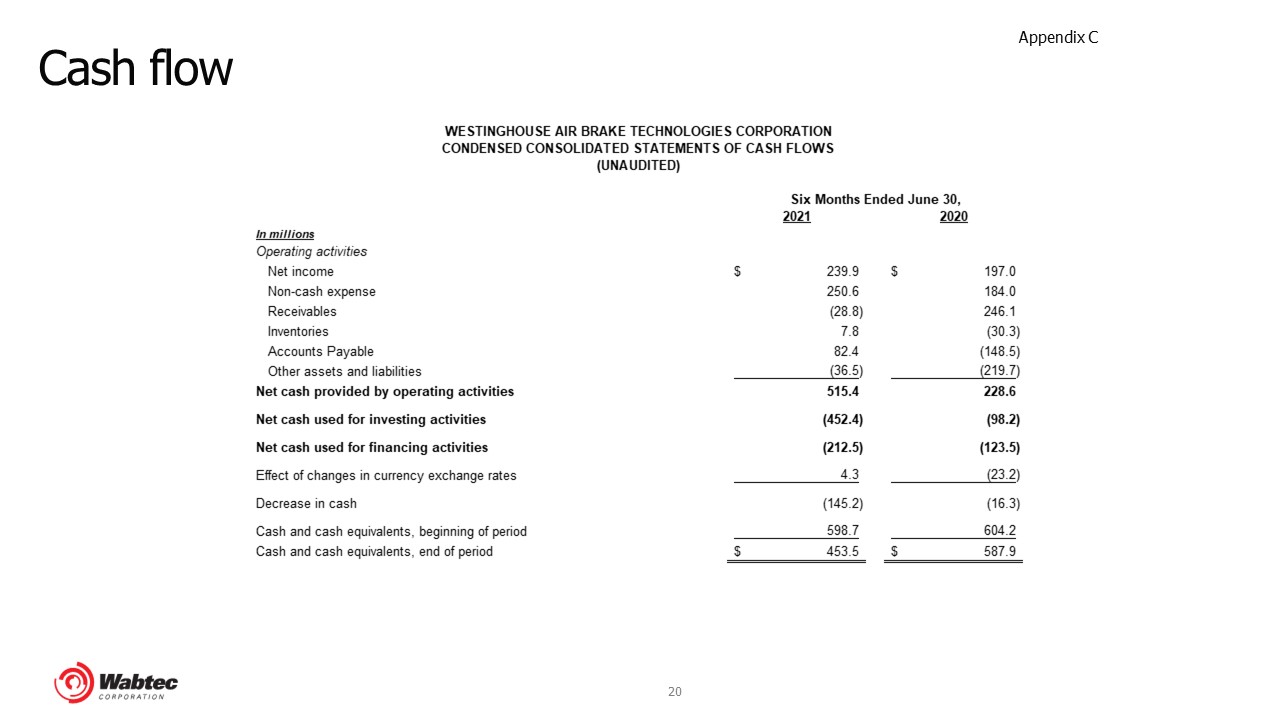
Cash flow Appendix C
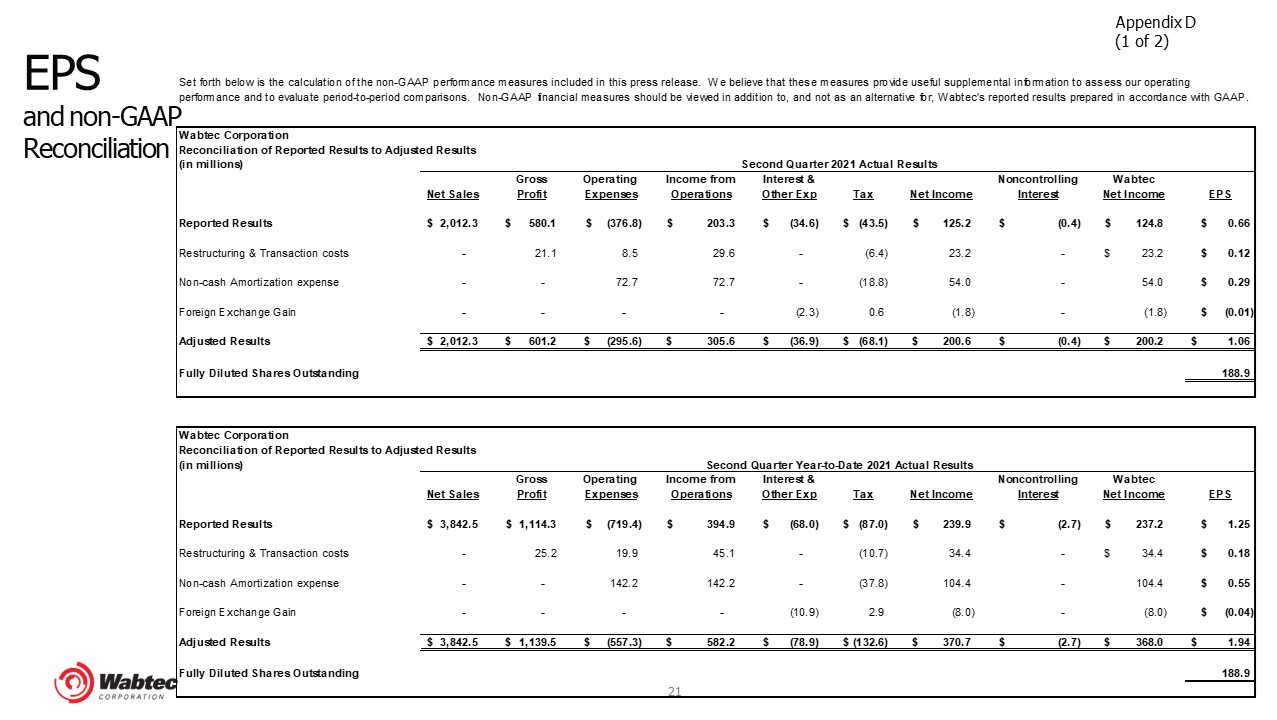
EPSand non-GAAP Reconciliation Appendix D(1 of 2)
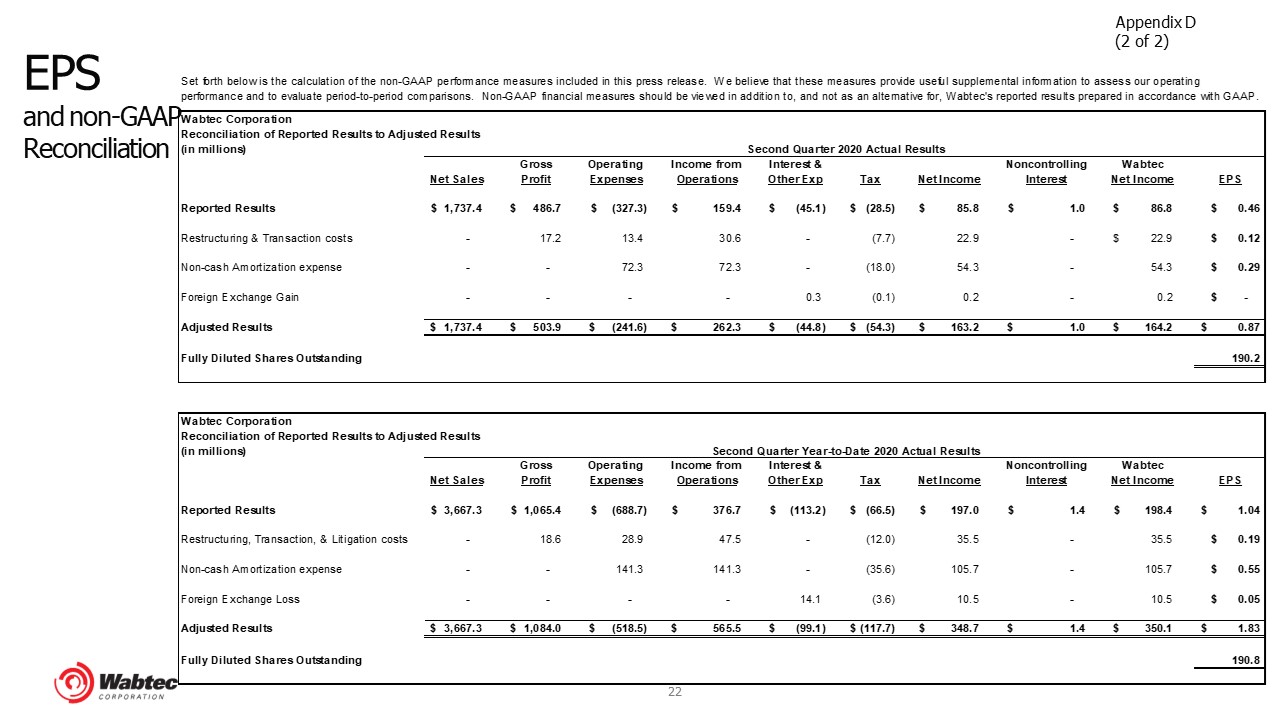
EPSand non-GAAP Reconciliation Appendix D(2 of 2)

EBITDA reconciliation Appendix E
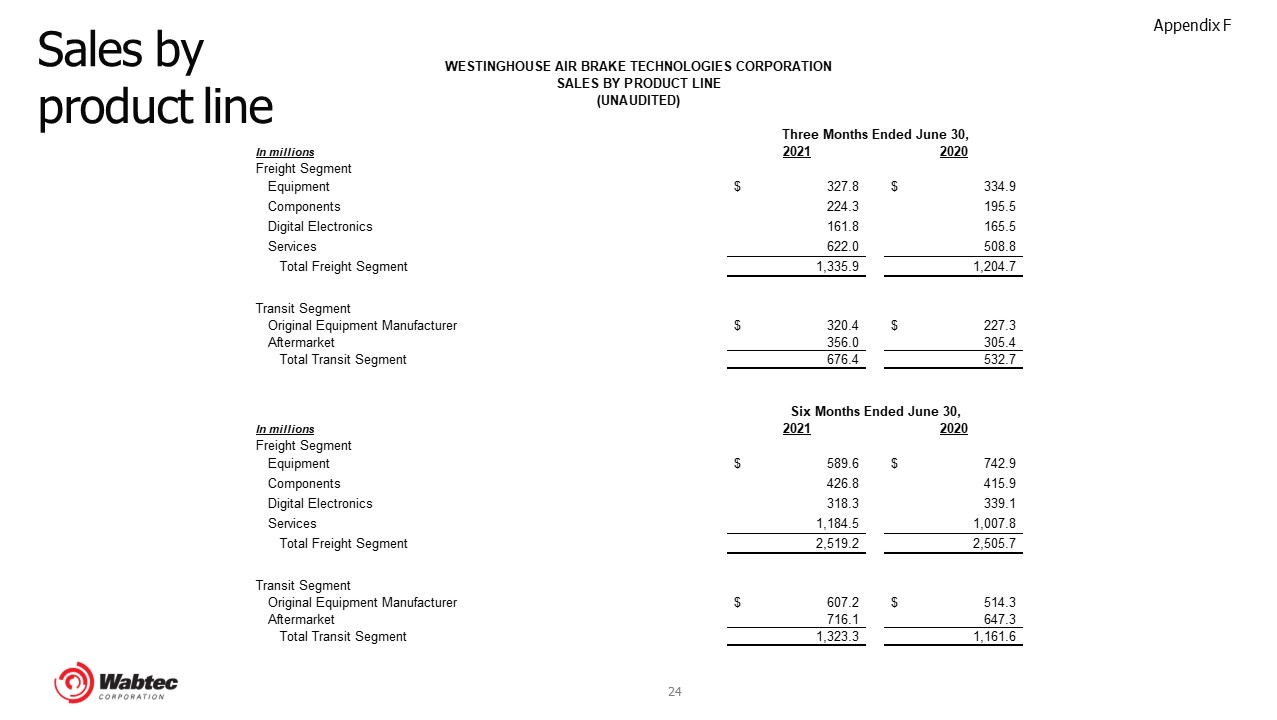
Sales by product line Appendix F
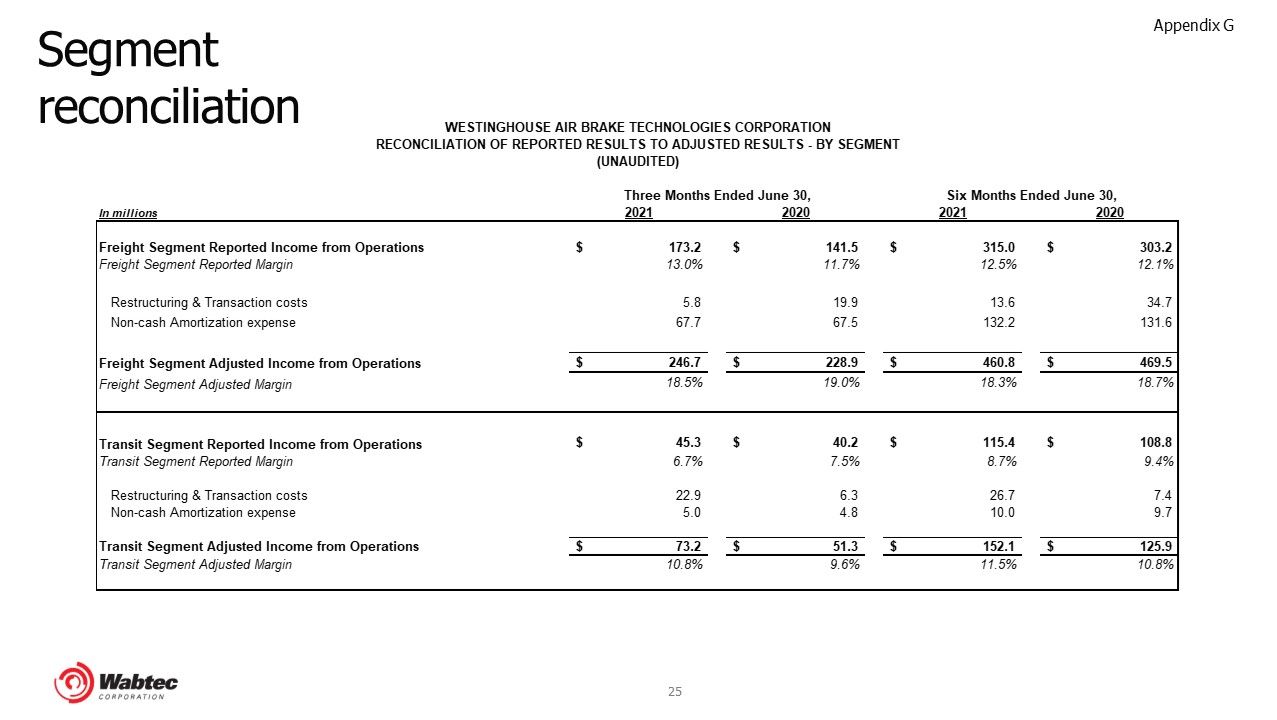
Segment reconciliation Appendix G