Attached files
| file | filename |
|---|---|
| 8-K - 8-K - JANUS HENDERSON GROUP PLC | jhg-20210729x8k.htm |
| EX-99.1 - EX-99.1 - JANUS HENDERSON GROUP PLC | jhg-20210729xex99d1.htm |
Exhibit 99.2
| Thursday 29 July 2021 SECOND QUARTER 2021 RESULTS Dick Weil Chief Executive Officer Roger Thompson Chief Financial Officer |
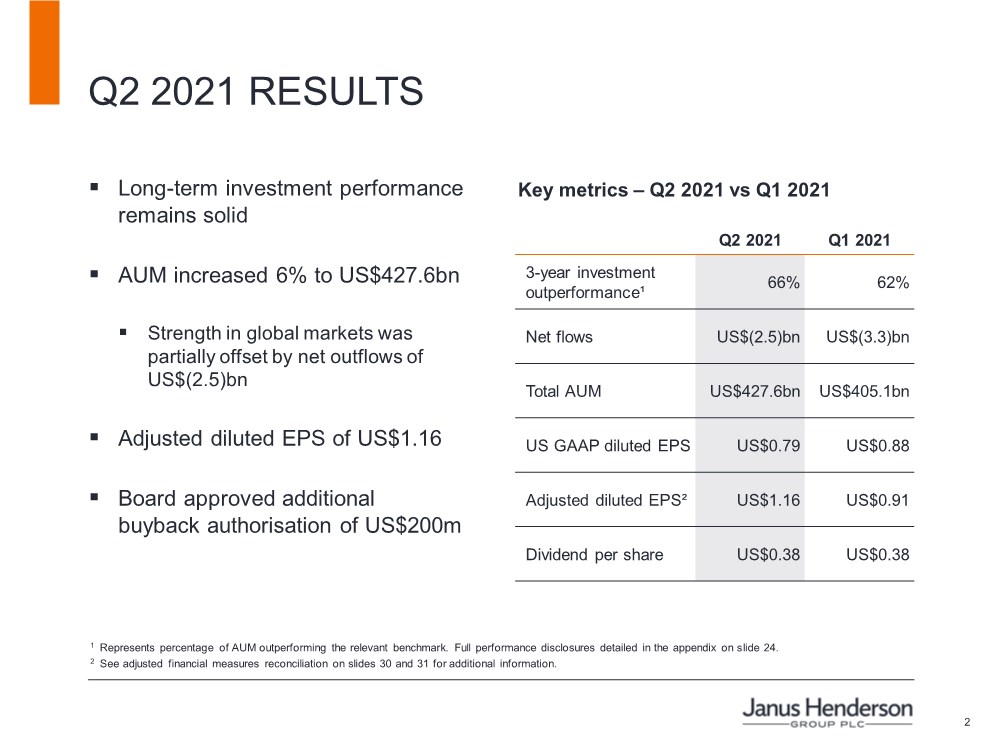
| 2 1 Represents percentage of AUM outperforming the relevant benchmark. Full performance disclosures detailed in the appendix on slide 24. 2 See adjusted financial measures reconciliation on slides 30 and 31 for additional information. Key metrics – Q2 2021 vs Q1 2021 Q2 2021 RESULTS ▪ Long-term investment performance remains solid ▪ AUM increased 6% to US$427.6bn ▪ Strength in global markets was partially offset by net outflows of US$(2.5)bn ▪ Adjusted diluted EPS of US$1.16 ▪ Board approved additional buyback authorisation of US$200m Q2 2021 Q1 2021 3-year investment outperformance¹ 66% 62% Net flows US$(2.5)bn US$(3.3)bn Total AUM US$427.6bn US$405.1bn US GAAP diluted EPS US$0.79 US$0.88 Adjusted diluted EPS² US$1.16 US$0.91 Dividend per share US$0.38 US$0.38 |
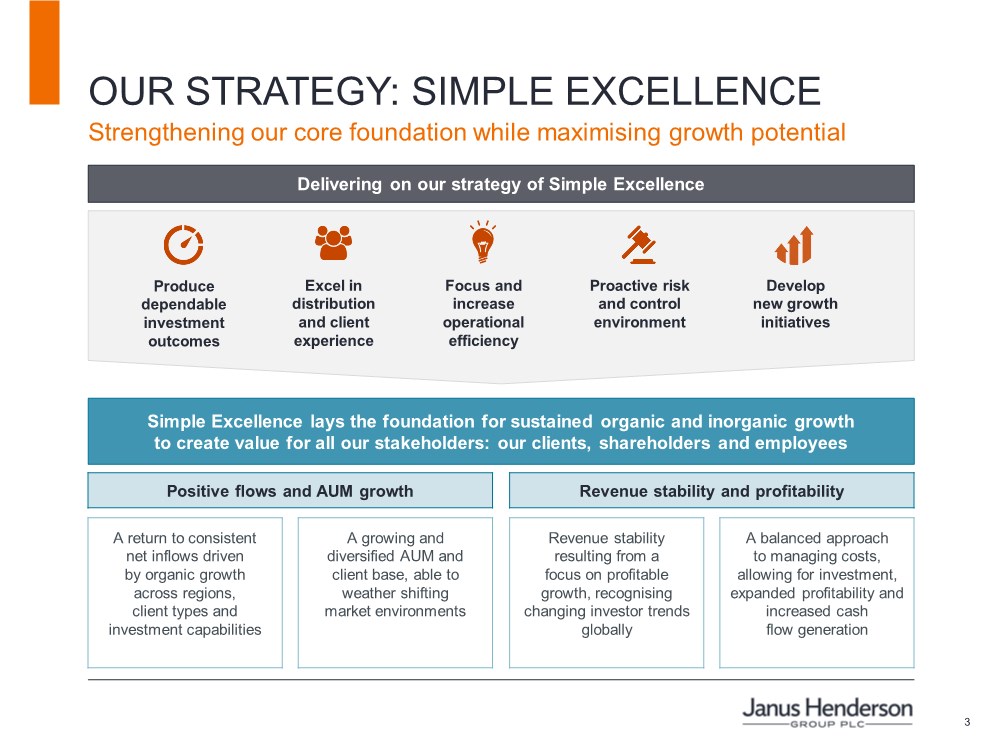
| 3 OUR STRATEGY: SIMPLE EXCELLENCE Strengthening our core foundation while maximising growth potential Delivering on our strategy of Simple Excellence Produce dependable investment outcomes Excel in distribution and client experience Develop new growth initiatives Focus and increase operational efficiency Proactive risk and control environment Positive flows and AUM growth Revenue stability and profitability A return to consistent net inflows driven by organic growth across regions, client types and investment capabilities A growing and diversified AUM and client base, able to weather shifting market environments Revenue stability resulting from a focus on profitable growth, recognising changing investor trends globally A balanced approach to managing costs, allowing for investment, expanded profitability and increased cash flow generation Simple Excellence lays the foundation for sustained organic and inorganic growth to create value for all our stakeholders: our clients, shareholders and employees |
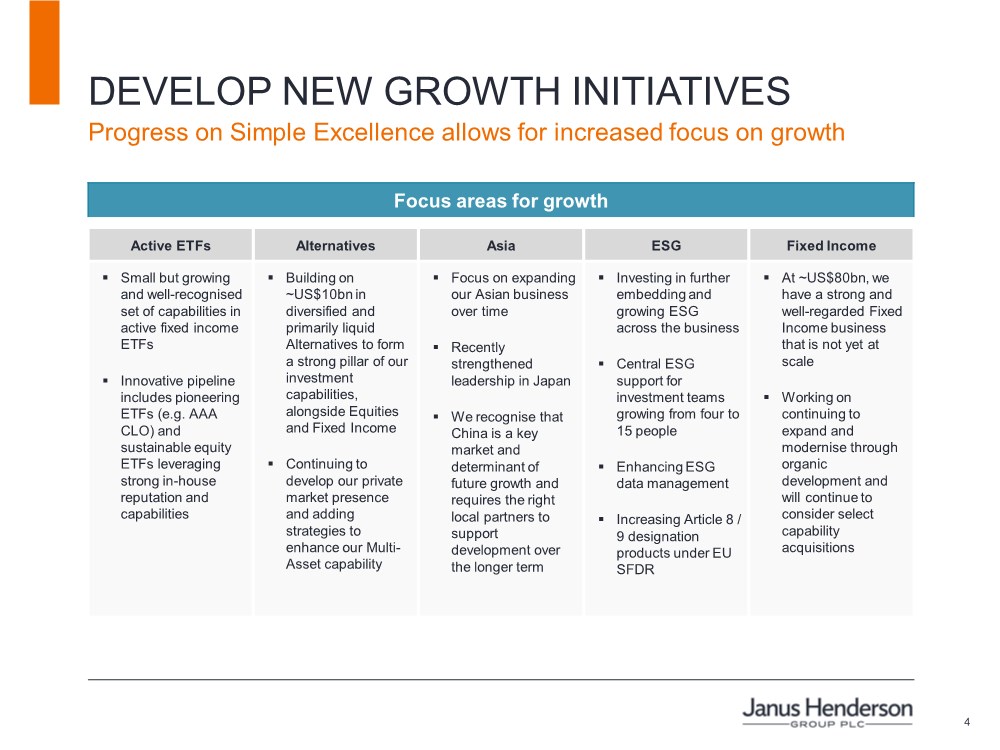
| 4 DEVELOP NEW GROWTH INITIATIVES Focus areas for growth Active ETFs Alternatives Asia ESG Fixed Income ▪ Small but growing and well-recognised set of capabilities in active fixed income ETFs ▪ Innovative pipeline includes pioneering ETFs (e.g. AAA CLO) and sustainable equity ETFs leveraging strong in-house reputation and capabilities ▪ Building on ~US$10bn in diversified and primarily liquid Alternatives to form a strong pillar of our investment capabilities, alongside Equities and Fixed Income ▪ Continuing to develop our private market presence and adding strategies to enhance our Multi- Asset capability ▪ Focus on expanding our Asian business over time ▪ Recently strengthened leadership in Japan ▪ We recognise that China is a key market and determinant of future growth and requires the right local partners to support development over the longer term ▪ Investing in further embedding and growing ESG across the business ▪ Central ESG support for investment teams growing from four to 15 people ▪ Enhancing ESG data management ▪ Increasing Article 8 / 9 designation products under EU SFDR ▪ At ~US$80bn, we have a strong and well-regarded Fixed Income business that is not yet at scale ▪ Working on continuing to expand and modernise through organic development and will continue to consider select capability acquisitions Progress on Simple Excellence allows for increased focus on growth |
| BUSINESS AND FINANCIAL UPDATE Roger Thompson Chief Financial Officer |

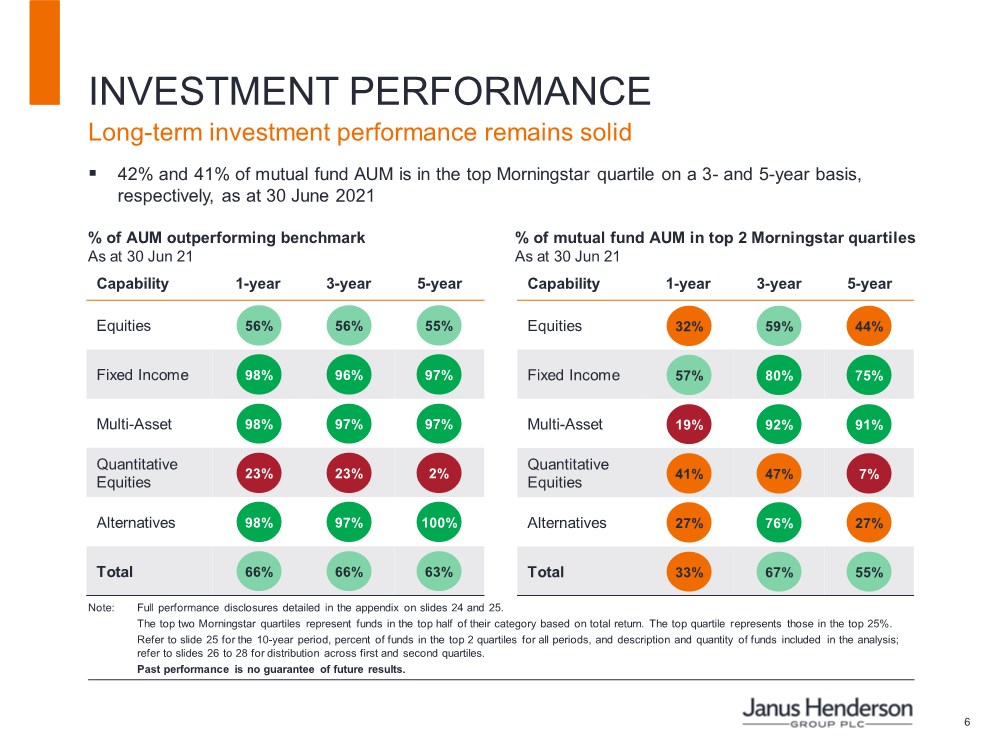
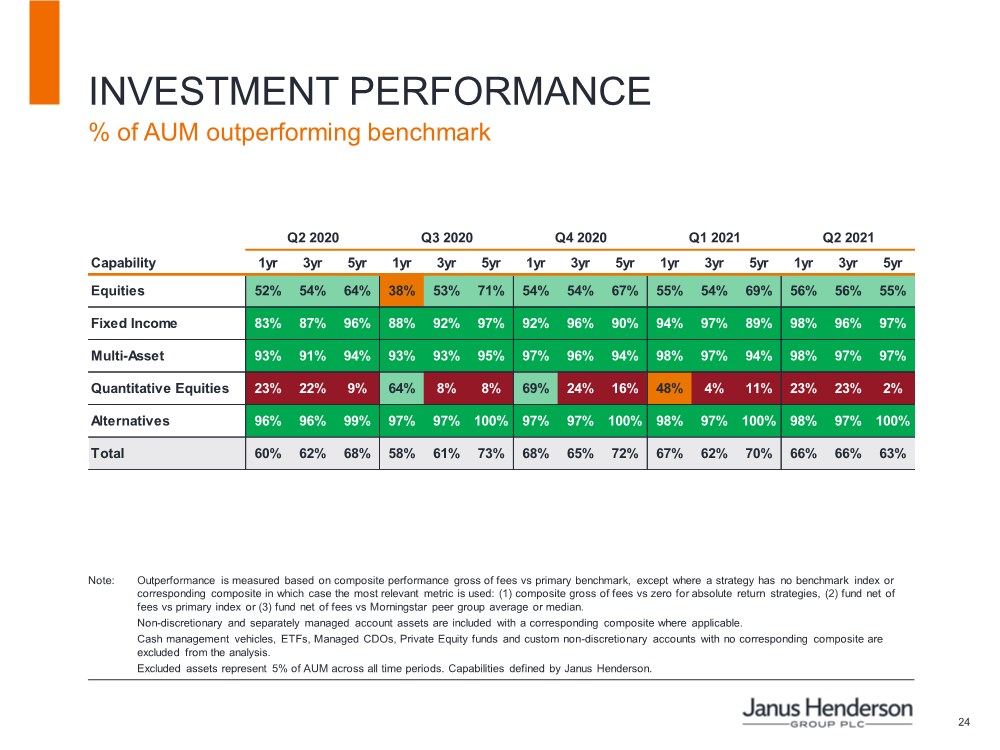
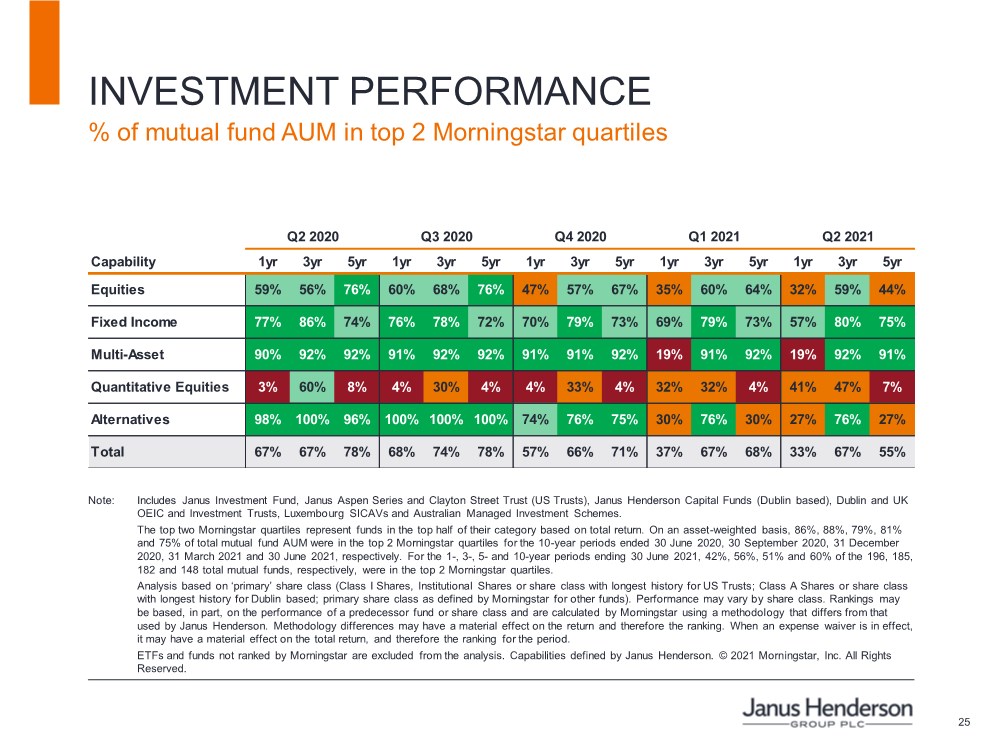
| 6 INVESTMENT PERFORMANCE Note: Full performance disclosures detailed in the appendix on slides 24 and 25. The top two Morningstar quartiles represent funds in the top half of their category based on total return. The top quartile represents those in the top 25%. Refer to slide 25 for the 10-year period, percent of funds in the top 2 quartiles for all periods, and description and quantity of funds included in the analysis; refer to slides 26 to 28 for distribution across first and second quartiles. Past performance is no guarantee of future results. Capability 1-year 3-year 5-year Equities Fixed Income Multi-Asset Quantitative Equities Alternatives Total Capability 1-year 3-year 5-year Equities Fixed Income Multi-Asset Quantitative Equities Alternatives Total % of mutual fund AUM in top 2 Morningstar quartiles As at 30 Jun 21 % of AUM outperforming benchmark As at 30 Jun 21 23% 23% 2% 63% 66% 66% 100% 97% 98% 97% 97% 98% 97% 96% 98% 55% 56% 56% 41% 47% 7% 55% 67% 33% 27% 76% 27% 91% 92% 19% 75% 80% 57% 44% 59% 32% ▪ 42% and 41% of mutual fund AUM is in the top Morningstar quartile on a 3- and 5-year basis, respectively, as at 30 June 2021 Long-term investment performance remains solid |
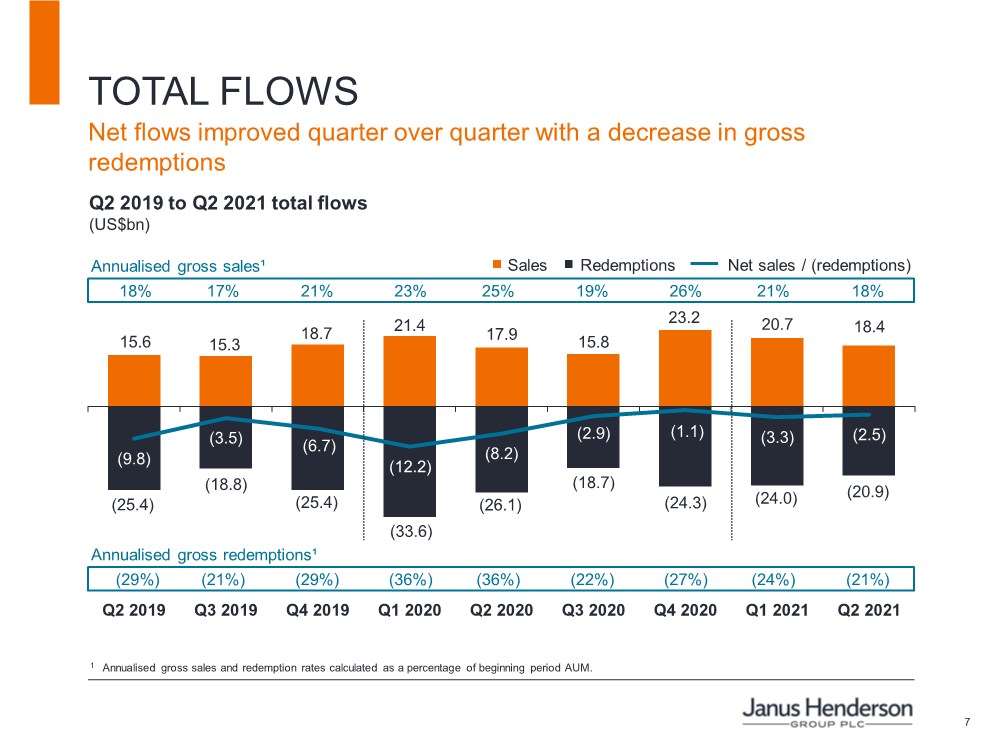
| 7 15.6 15.3 18.7 21.4 17.9 15.8 23.2 20.7 18.4 (25.4) (18.8) (25.4) (33.6) (26.1) (18.7) (24.3) (24.0) (20.9) (9.8) (3.5) (6.7) (12.2) (8.2) (2.9) (1.1) (3.3) (2.5) Q2 2019 Q3 2019 Q4 2019 Q1 2020 Q2 2020 Q3 2020 Q4 2020 Q1 2021 Q2 2021 Q2 2019 to Q2 2021 total flows (US$bn) Redemptions Sales Net sales / (redemptions) 18% 17% 21% 23% 25% 19% 26% 21% 18% Annualised gross sales¹ Annualised gross redemptions¹ 1 Annualised gross sales and redemption rates calculated as a percentage of beginning period AUM. TOTAL FLOWS Net flows improved quarter over quarter with a decrease in gross redemptions (29%) (21%) (29%) (36%) (36%) (22%) (27%) (24%) (21%) |
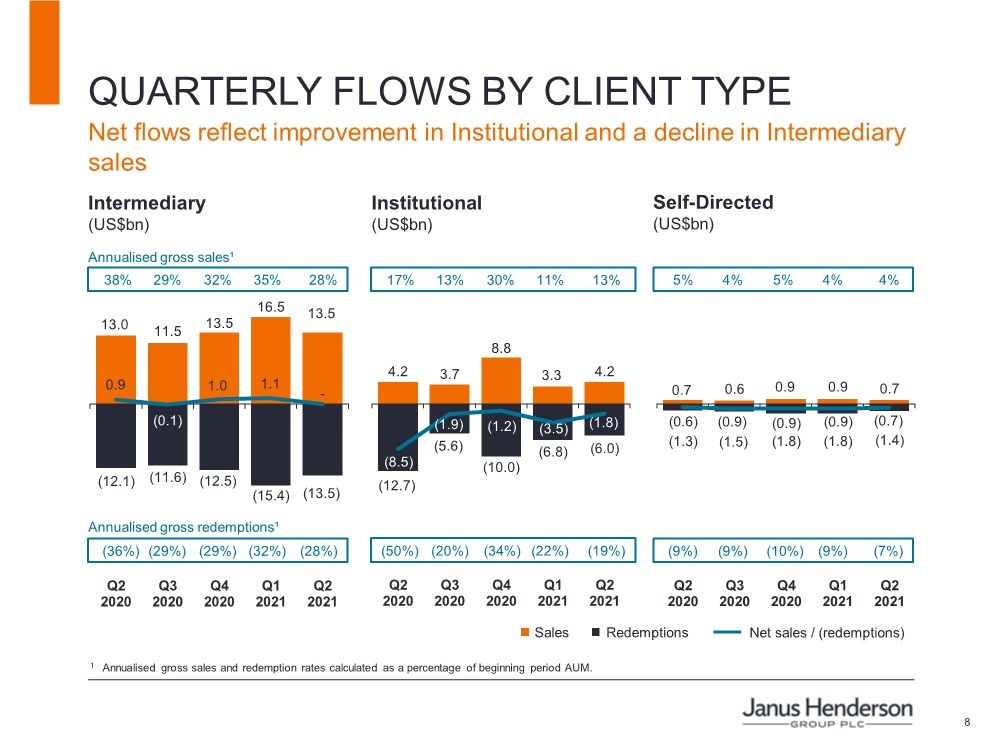
| 8 4.2 3.7 8.8 3.3 4.2 (12.7) (5.6) (10.0) (6.8) (6.0) (8.5) (1.9) (1.2) (3.5) (1.8) Q2 2020 Q3 2020 Q4 2020 Q1 2021 Q2 2021 13.0 11.5 13.5 16.5 13.5 (12.1) (11.6) (12.5) (15.4) (13.5) 0.9 (0.1) 1.0 1.1 - Q2 2020 Q3 2020 Q4 2020 Q1 2021 Q2 2021 0.7 0.6 0.9 0.9 0.7 (1.3) (1.5) (1.8) (1.8) (1.4) (0.6) (0.9) (0.9) (0.9) (0.7) Q2 2020 Q3 2020 Q4 2020 Q1 2021 Q2 2021 Intermediary (US$bn) 1 Annualised gross sales and redemption rates calculated as a percentage of beginning period AUM. QUARTERLY FLOWS BY CLIENT TYPE Redemptions Sales Net sales / (redemptions) Institutional (US$bn) 17% 13% 30% 11% 13% 38% 29% 32% 35% 28% 5% 4% 5% 4% 4% (50%) (20%) (34%) (22%) (19%) (36%) (29%) (29%) (32%) (28%) (9%) (9%) (10%) (9%) (7%) Annualised gross redemptions¹ Annualised gross sales¹ Self-Directed (US$bn) Net flows reflect improvement in Institutional and a decline in Intermediary sales |
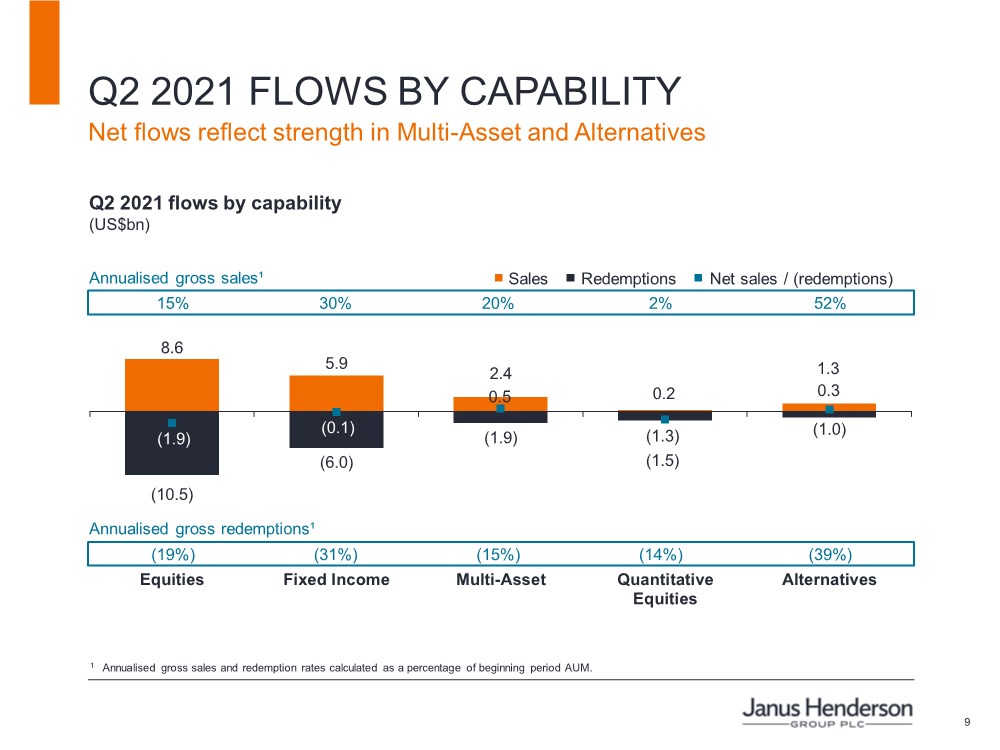
| 9 1 Annualised gross sales and redemption rates calculated as a percentage of beginning period AUM. Q2 2021 FLOWS BY CAPABILITY Net flows reflect strength in Multi-Asset and Alternatives 8.6 5.9 2.4 0.2 1.3 (10.5) (6.0) (1.9) (1.5) (1.0) (1.9) (0.1) 0.5 (1.3) 0.3 Equities Fixed Income Multi-Asset Quantitative Equities Alternatives Annualised gross sales¹ Redemptions Sales Net sales / (redemptions) 15% 30% 20% 2% 52% Annualised gross redemptions¹ (19%) (31%) (15%) (14%) (39%) Q2 2021 flows by capability (US$bn) |
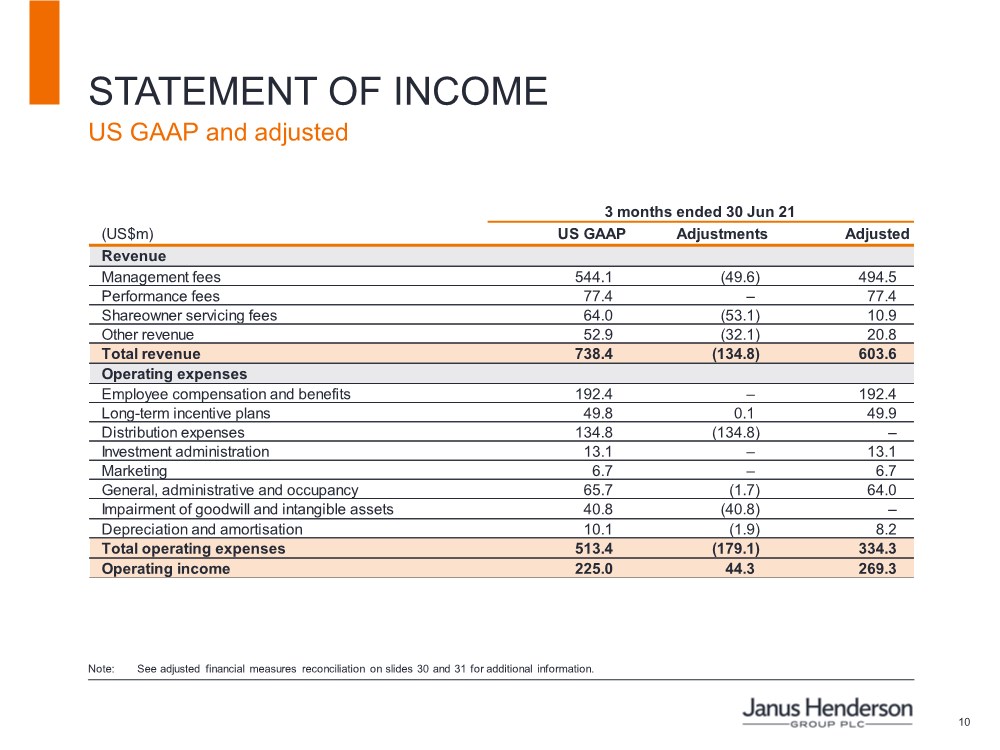
| 10 US GAAP Adjustments Adjusted Revenue Management fees 544.1 (49.6) 494.5 Performance fees 77.4 – 77.4 Shareowner servicing fees 64.0 (53.1) 10.9 Other revenue 52.9 (32.1) 20.8 Total revenue 738.4 (134.8) 603.6 Operating expenses Employee compensation and benefits 192.4 – 192.4 Long-term incentive plans 49.8 0.1 49.9 Distribution expenses 134.8 (134.8) – Investment administration 13.1 – 13.1 Marketing 6.7 – 6.7 General, administrative and occupancy 65.7 (1.7) 64.0 Impairment of goodwill and intangible assets 40.8 (40.8) – Depreciation and amortisation 10.1 (1.9) 8.2 Total operating expenses 513.4 (179.1) 334.3 Operating income 225.0 44.3 269.3 (US$m) 3 months ended 30 Jun 21 STATEMENT OF INCOME US GAAP and adjusted Note: See adjusted financial measures reconciliation on slides 30 and 31 for additional information. |
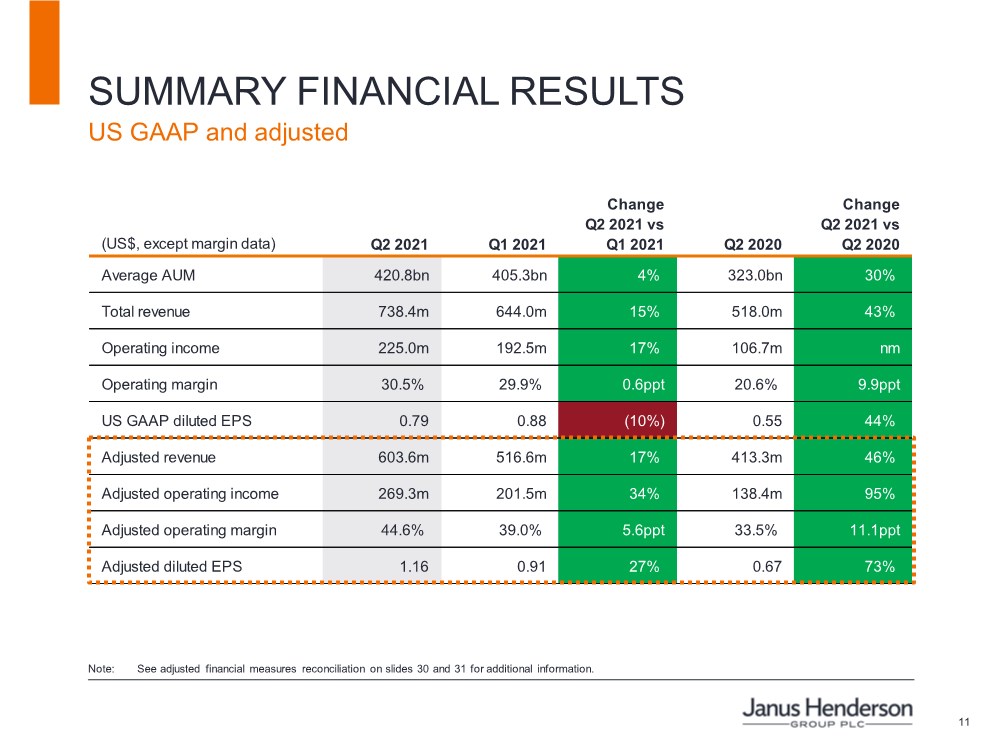
| 11 (US$, except margin data) Q2 2021 Q1 2021 Change Q2 2021 vs Q1 2021 Q2 2020 Change Q2 2021 vs Q2 2020 Average AUM 420.8bn 405.3bn 4% 323.0bn 30% Total revenue 738.4m 644.0m 15% 518.0m 43% Operating income 225.0m 192.5m 17% 106.7m nm Operating margin 30.5% 29.9% 0.6ppt 20.6% 9.9ppt US GAAP diluted EPS 0.79 0.88 (10%) 0.55 44% Adjusted revenue 603.6m 516.6m 17% 413.3m 46% Adjusted operating income 269.3m 201.5m 34% 138.4m 95% Adjusted operating margin 44.6% 39.0% 5.6ppt 33.5% 11.1ppt Adjusted diluted EPS 1.16 0.91 27% 0.67 73% SUMMARY FINANCIAL RESULTS US GAAP and adjusted Note: See adjusted financial measures reconciliation on slides 30 and 31 for additional information. |
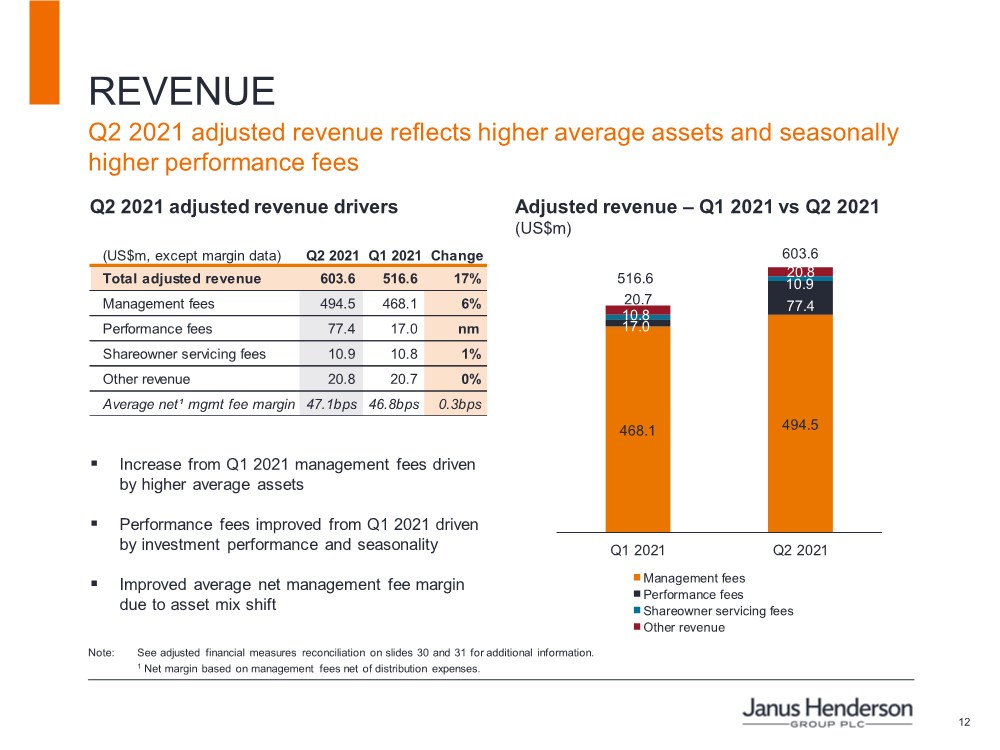
| 12 REVENUE Q2 2021 adjusted revenue reflects higher average assets and seasonally higher performance fees Note: See adjusted financial measures reconciliation on slides 30 and 31 for additional information. 1 Net margin based on management fees net of distribution expenses. Adjusted revenue – Q1 2021 vs Q2 2021 (US$m) Q2 2021 adjusted revenue drivers ▪ Increase from Q1 2021 management fees driven by higher average assets ▪ Performance fees improved from Q1 2021 driven by investment performance and seasonality ▪ Improved average net management fee margin due to asset mix shift 494.5 468.1 77.4 17.0 10.9 10.8 20.8 20.7 603.6 516.6 Q2 2021 Q1 2021 Management fees Performance fees Shareowner servicing fees Other revenue (US$m, except margin data) Q2 2021 Q1 2021 Change Total adjusted revenue 603.6 516.6 17% Management fees 494.5 468.1 6% Performance fees 77.4 17.0 nm Shareowner servicing fees 10.9 10.8 1% Other revenue 20.8 20.7 0% Average net¹ mgmt fee margin 47.1bps 46.8bps 0.3bps |
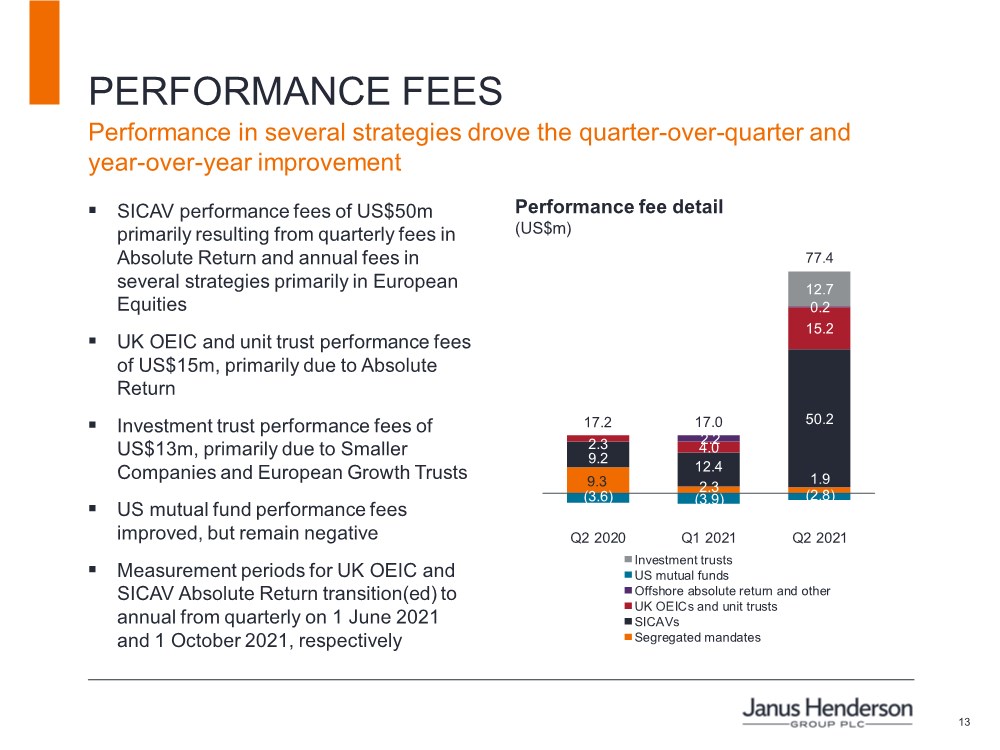
| 13 PERFORMANCE FEES Performance in several strategies drove the quarter-over-quarter and year-over-year improvement Performance fee detail (US$m) ▪ SICAV performance fees of US$50m primarily resulting from quarterly fees in Absolute Return and annual fees in several strategies primarily in European Equities ▪ UK OEIC and unit trust performance fees of US$15m, primarily due to Absolute Return ▪ Investment trust performance fees of US$13m, primarily due to Smaller Companies and European Growth Trusts ▪ US mutual fund performance fees improved, but remain negative ▪ Measurement periods for UK OEIC and SICAV Absolute Return transition(ed) to annual from quarterly on 1 June 2021 and 1 October 2021, respectively 9.3 2.3 1.9 9.2 12.4 50.2 2.3 4.0 15.2 2.2 0.2 (3.6) (3.9) (2.8) 12.7 17.2 17.0 77.4 Q2 2020 Q1 2021 Q2 2021 Investment trusts US mutual funds Offshore absolute return and other UK OEICs and unit trusts SICAVs Segregated mandates |
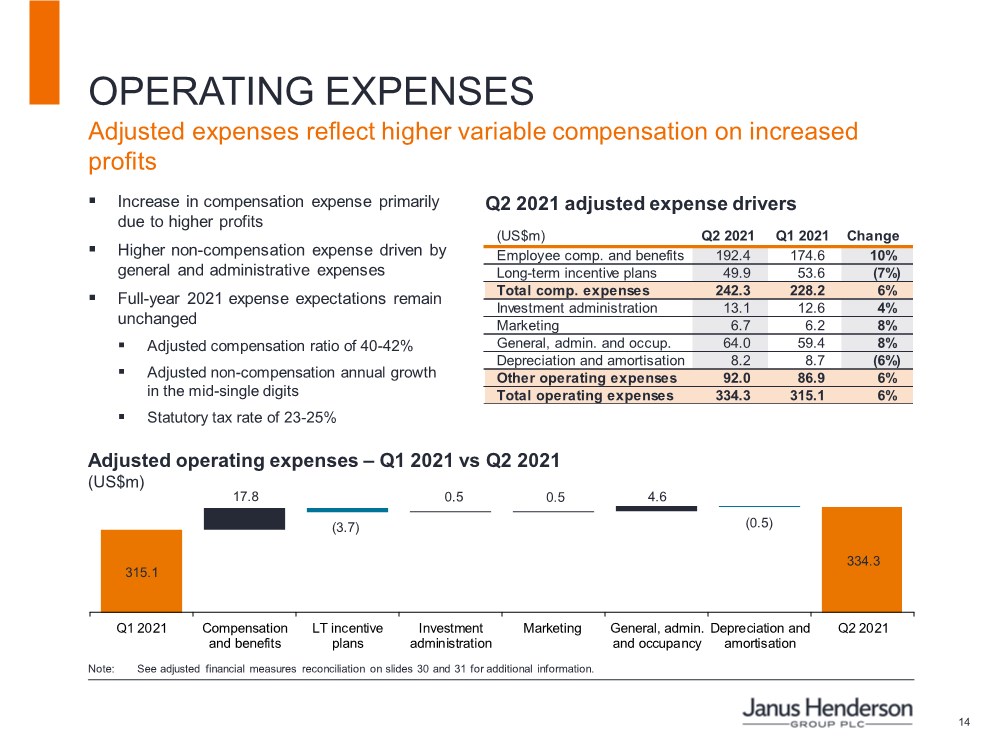
| 14 OPERATING EXPENSES Note: See adjusted financial measures reconciliation on slides 30 and 31 for additional information. Adjusted operating expenses – Q1 2021 vs Q2 2021 (US$m) 334.3 (3.7) (0.5) 315.1 17.8 0.5 0.5 4.6 Q1 2021 Compensation and benefits LT incentive plans Investment administration Marketing General, admin. and occupancy Depreciation and amortisation Q2 2021 ▪ Increase in compensation expense primarily due to higher profits ▪ Higher non-compensation expense driven by general and administrative expenses ▪ Full-year 2021 expense expectations remain unchanged ▪ Adjusted compensation ratio of 40-42% ▪ Adjusted non-compensation annual growth in the mid-single digits ▪ Statutory tax rate of 23-25% (US$m) Q2 2021 Q1 2021 Change Employee comp. and benefits 192.4 174.6 10% Long-term incentive plans 49.9 53.6 (7%) Total comp. expenses 242.3 228.2 6% Investment administration 13.1 12.6 4% Marketing 6.7 6.2 8% General, admin. and occup. 64.0 59.4 8% Depreciation and amortisation 8.2 8.7 (6%) Other operating expenses 92.0 86.9 6% Total operating expenses 334.3 315.1 6% Adjusted expenses reflect higher variable compensation on increased profits Q2 2021 adjusted expense drivers |
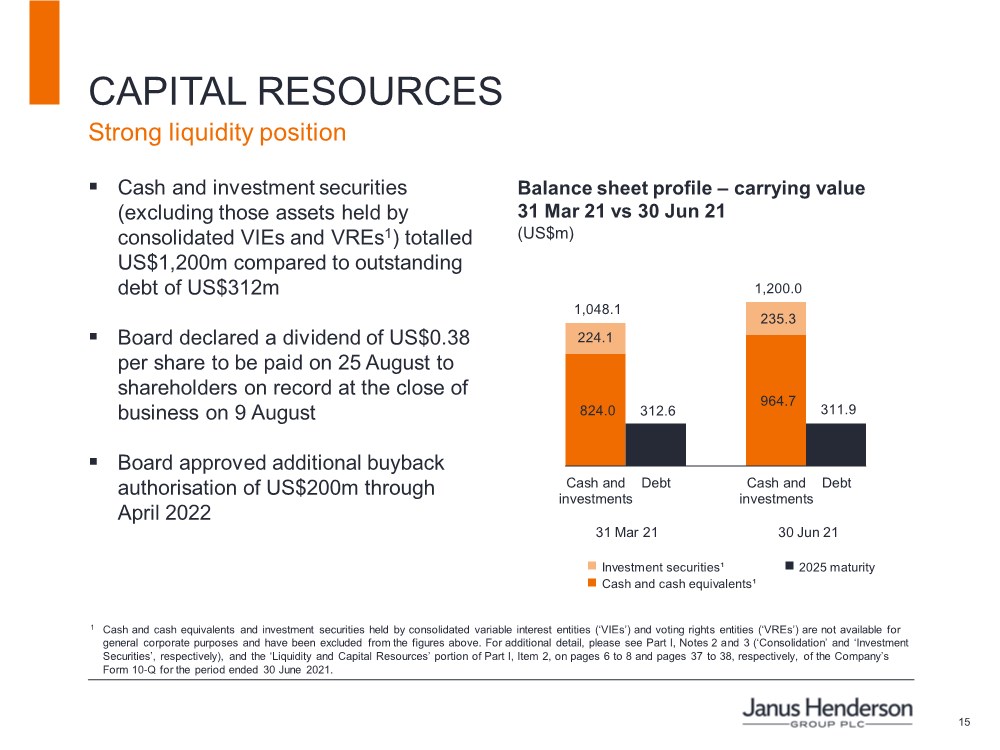
| 15 CAPITAL RESOURCES Strong liquidity position ▪ Cash and investment securities (excluding those assets held by consolidated VIEs and VREs1) totalled US$1,200m compared to outstanding debt of US$312m ▪ Board declared a dividend of US$0.38 per share to be paid on 25 August to shareholders on record at the close of business on 9 August ▪ Board approved additional buyback authorisation of US$200m through April 2022 824.0 964.7 224.1 235.3 1,048.1 1,200.0 312.6 311.9 Cash and investments Debt Cash and investments Debt Balance sheet profile – carrying value 31 Mar 21 vs 30 Jun 21 (US$m) Investment securities¹ Cash and cash equivalents¹ 2025 maturity 30 Jun 21 31 Mar 21 1 Cash and cash equivalents and investment securities held by consolidated variable interest entities (‘VIEs’) and voting rights entities (‘VREs’) are not available for general corporate purposes and have been excluded from the figures above. For additional detail, please see Part I, Notes 2 and 3 (‘Consolidation’ and ‘Investment Securities’, respectively), and the ‘Liquidity and Capital Resources’ portion of Part I, Item 2, on pages 6 to 8 and pages 37 to 38, respectively, of the Company’s Form 10‐Q for the period ended 30 June 2021. |
| Q&A |

| APPENDIX |
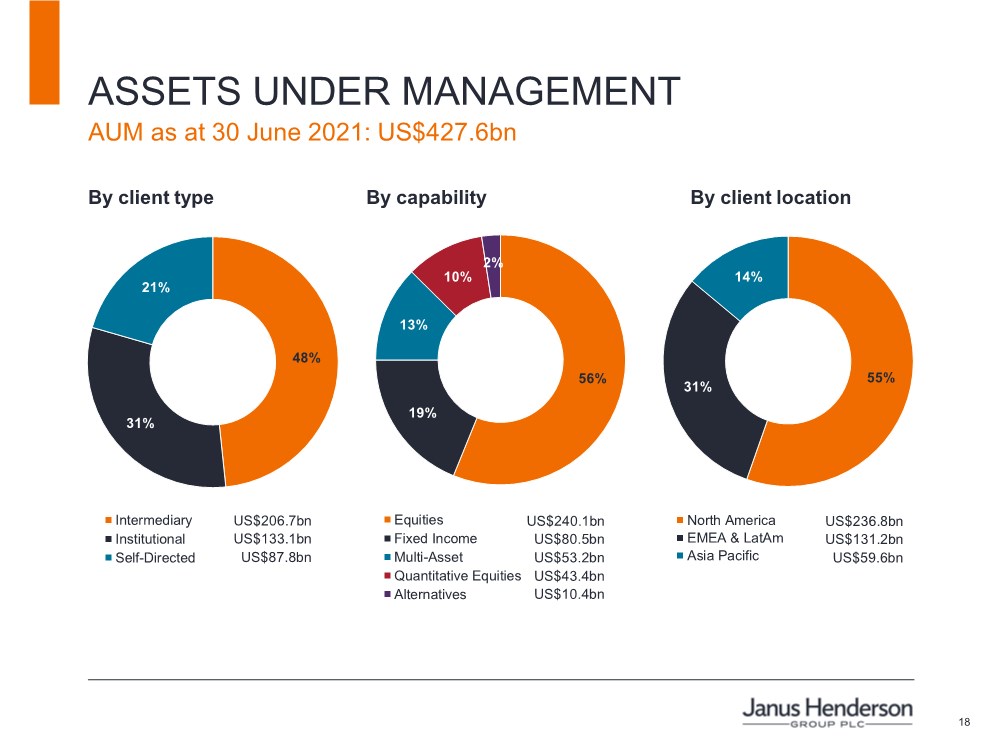
| 18 ASSETS UNDER MANAGEMENT AUM as at 30 June 2021: US$427.6bn 56% 19% 13% 10% 2% Equities Fixed Income Multi-Asset Quantitative Equities Alternatives 48% 31% 21% Intermediary Institutional Self-Directed 55% 31% 14% North America EMEA & LatAm Asia Pacific By client type By capability By client location US$240.1bn US$80.5bn US$53.2bn US$43.4bn US$10.4bn US$206.7bn US$133.1bn US$87.8bn US$236.8bn US$131.2bn US$59.6bn |
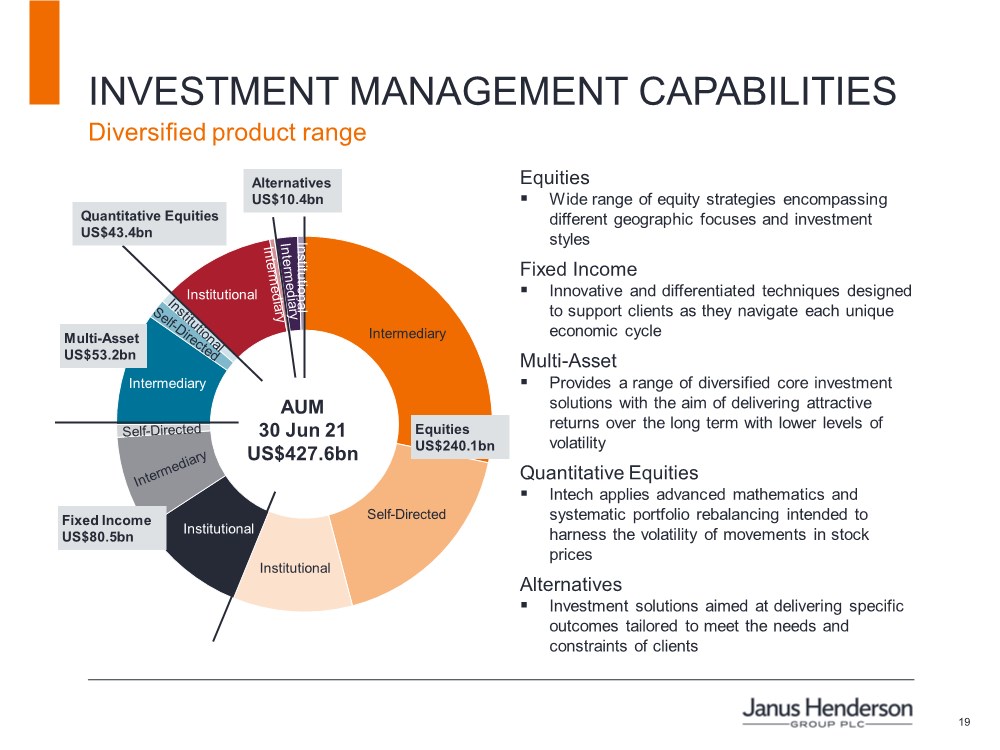
| 19 INVESTMENT MANAGEMENT CAPABILITIES Diversified product range Equities US$240.1bn AUM 30 Jun 21 US$427.6bn Fixed Income US$80.5bn Multi-Asset US$53.2bn Self-Directed Intermediary Institutional Institutional Institutional Quantitative Equities US$43.4bn Institutional Alternatives US$10.4bn Intermediary Equities ▪ Wide range of equity strategies encompassing different geographic focuses and investment styles Fixed Income ▪ Innovative and differentiated techniques designed to support clients as they navigate each unique economic cycle Multi-Asset ▪ Provides a range of diversified core investment solutions with the aim of delivering attractive returns over the long term with lower levels of volatility Quantitative Equities ▪ Intech applies advanced mathematics and systematic portfolio rebalancing intended to harness the volatility of movements in stock prices Alternatives ▪ Investment solutions aimed at delivering specific outcomes tailored to meet the needs and constraints of clients |
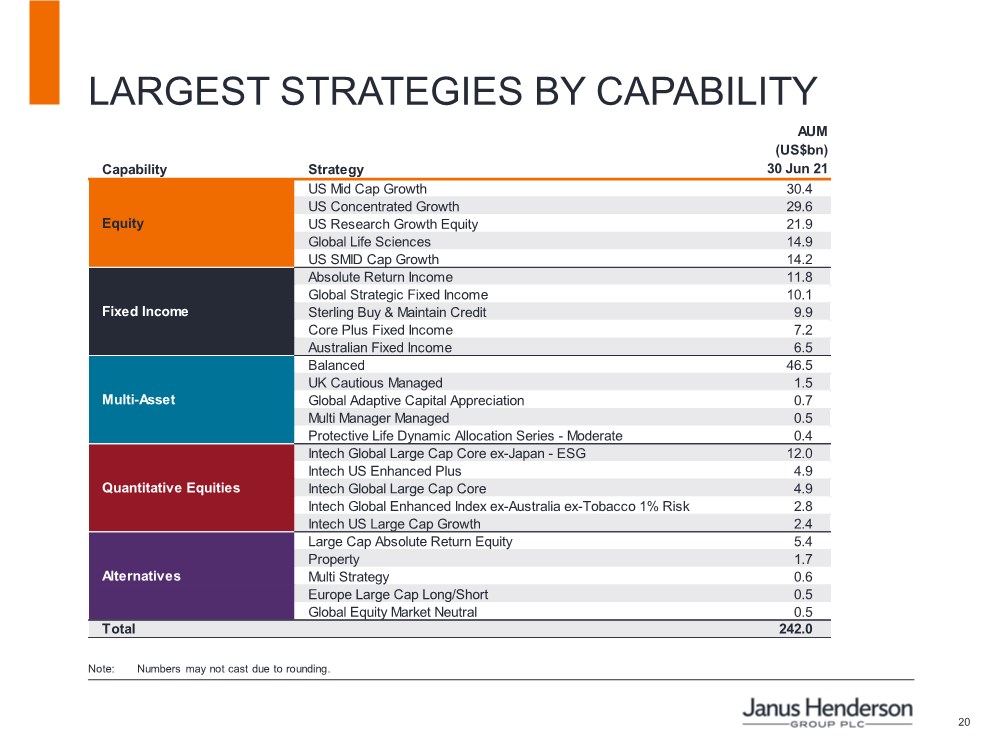
| 20 LARGEST STRATEGIES BY CAPABILITY Note: Numbers may not cast due to rounding. Capability Strategy AUM (US$bn) 30 Jun 21 US Mid Cap Growth 30.4 US Concentrated Growth 29.6 US Research Growth Equity 21.9 Global Life Sciences 14.9 US SMID Cap Growth 14.2 Absolute Return Income 11.8 Global Strategic Fixed Income 10.1 Sterling Buy & Maintain Credit 9.9 Core Plus Fixed Income 7.2 Australian Fixed Income 6.5 Balanced 46.5 UK Cautious Managed 1.5 Global Adaptive Capital Appreciation 0.7 Multi Manager Managed 0.5 Protective Life Dynamic Allocation Series - Moderate 0.4 Intech Global Large Cap Core ex-Japan - ESG 12.0 Intech US Enhanced Plus 4.9 Intech Global Large Cap Core 4.9 Intech Global Enhanced Index ex-Australia ex-Tobacco 1% Risk 2.8 Intech US Large Cap Growth 2.4 Large Cap Absolute Return Equity 5.4 Property 1.7 Multi Strategy 0.6 Europe Large Cap Long/Short 0.5 Global Equity Market Neutral 0.5 Total 242.0 Equity Fixed Income Multi-Asset Alternatives Quantitative Equities |
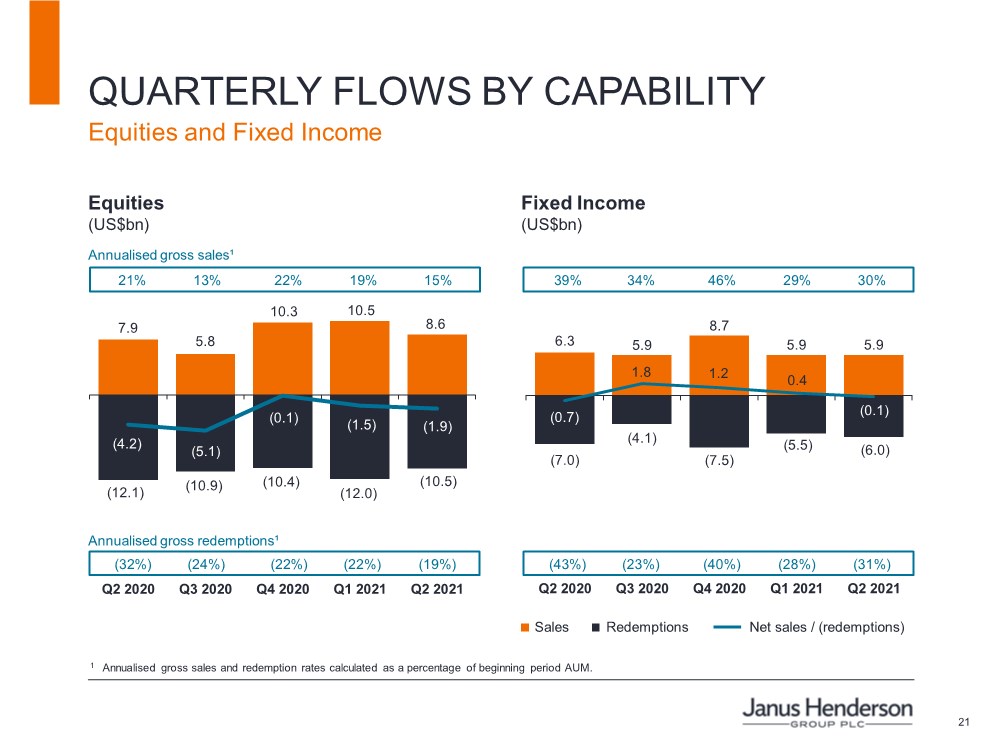
| 21 7.9 5.8 10.3 10.5 8.6 (12.1) (10.9) (10.4) (12.0) (10.5) (4.2) (5.1) (0.1) (1.5) (1.9) Q2 2020 Q3 2020 Q4 2020 Q1 2021 Q2 2021 Equities (US$bn) 1 Annualised gross sales and redemption rates calculated as a percentage of beginning period AUM. QUARTERLY FLOWS BY CAPABILITY Equities and Fixed Income 6.3 5.9 8.7 5.9 5.9 (7.0) (4.1) (7.5) (5.5) (6.0) (0.7) 1.8 1.2 0.4 (0.1) Q2 2020 Q3 2020 Q4 2020 Q1 2021 Q2 2021 (32%) (24%) (22%) (22%) (19%) Redemptions Sales Net sales / (redemptions) Annualised gross redemptions¹ 21% 13% 22% 19% 15% 39% 34% 46% 29% 30% (43%) (23%) (40%) (28%) (31%) Fixed Income (US$bn) Annualised gross sales¹ |
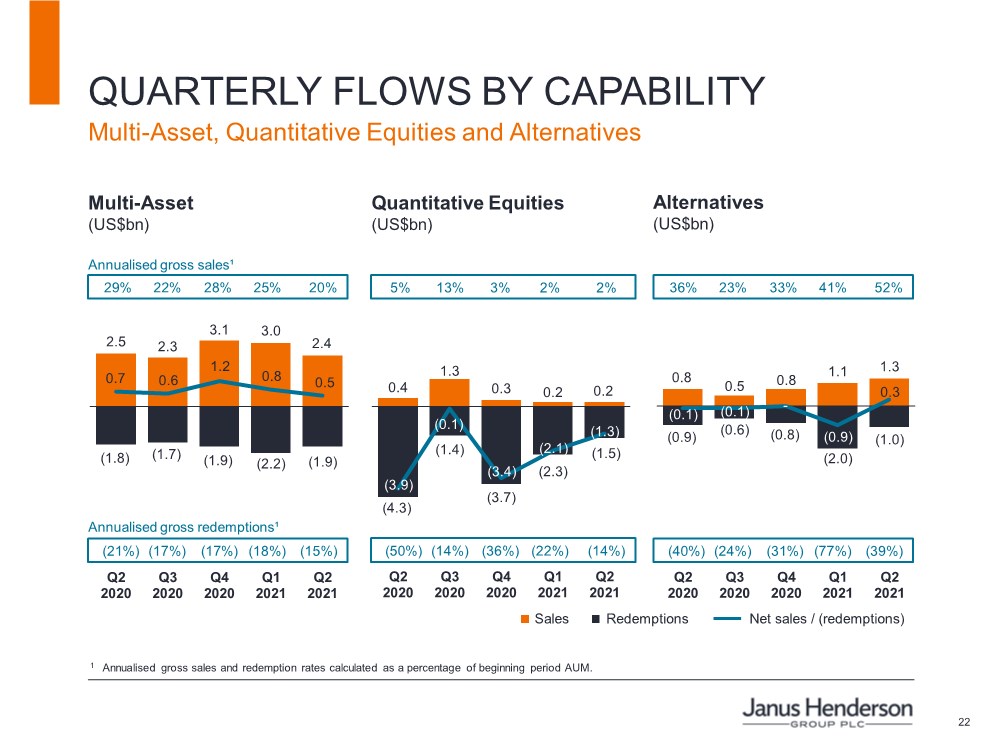
| 22 0.4 1.3 0.3 0.2 0.2 (4.3) (1.4) (3.7) (2.3) (1.5) (3.9) (0.1) (3.4) (2.1) (1.3) Q2 2020 Q3 2020 Q4 2020 Q1 2021 Q2 2021 2.5 2.3 3.1 3.0 2.4 (1.8) (1.7) (1.9) (2.2) (1.9) 0.7 0.6 1.2 0.8 0.5 Q2 2020 Q3 2020 Q4 2020 Q1 2021 Q2 2021 0.8 0.5 0.8 1.1 1.3 (0.9) (0.6) (0.8) (2.0) (1.0) (0.1) (0.1) - (0.9) 0.3 Q2 2020 Q3 2020 Q4 2020 Q1 2021 Q2 2021 Multi-Asset (US$bn) 1 Annualised gross sales and redemption rates calculated as a percentage of beginning period AUM. QUARTERLY FLOWS BY CAPABILITY Multi-Asset, Quantitative Equities and Alternatives Redemptions Sales Net sales / (redemptions) Quantitative Equities (US$bn) 5% 13% 3% 2% 2% 29% 22% 28% 25% 20% 36% 23% 33% 41% 52% (50%) (14%) (36%) (22%) (14%) (21%) (17%) (17%) (18%) (15%) (40%) (24%) (31%) (77%) (39%) Annualised gross redemptions¹ Annualised gross sales¹ Alternatives (US$bn) |
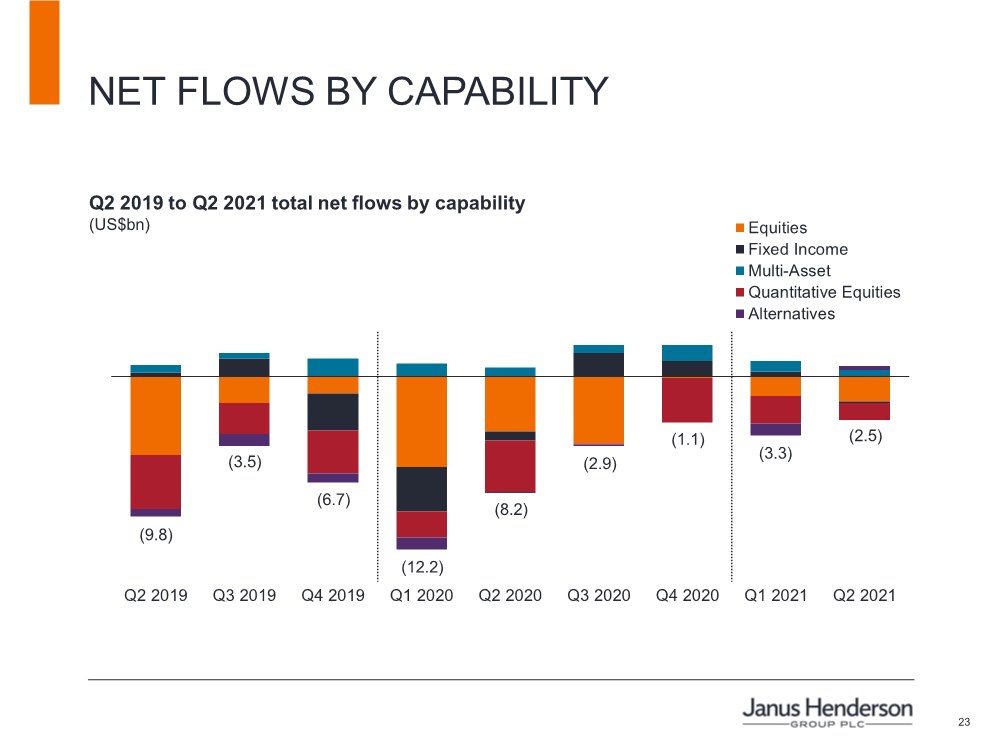
| 23 Q2 2019 Q3 2019 Q4 2019 Q1 2020 Q2 2020 Q3 2020 Q4 2020 Q1 2021 Q2 2021 Equities Fixed Income Multi-Asset Quantitative Equities Alternatives Q2 2019 to Q2 2021 total net flows by capability (US$bn) NET FLOWS BY CAPABILITY (12.2) (9.8) (3.5) (6.7) (8.2) (2.9) (1.1) (3.3) (2.5) |
| 24 Note: Outperformance is measured based on composite performance gross of fees vs primary benchmark, except where a strategy has no benchmark index or corresponding composite in which case the most relevant metric is used: (1) composite gross of fees vs zero for absolute return strategies, (2) fund net of fees vs primary index or (3) fund net of fees vs Morningstar peer group average or median. Non-discretionary and separately managed account assets are included with a corresponding composite where applicable. Cash management vehicles, ETFs, Managed CDOs, Private Equity funds and custom non-discretionary accounts with no corresponding composite are excluded from the analysis. Excluded assets represent 5% of AUM across all time periods. Capabilities defined by Janus Henderson. INVESTMENT PERFORMANCE % of AUM outperforming benchmark Capability 1yr 3yr 5yr 1yr 3yr 5yr 1yr 3yr 5yr 1yr 3yr 5yr 1yr 3yr 5yr Equities 52% 54% 64% 38% 53% 71% 54% 54% 67% 55% 54% 69% 56% 56% 55% Fixed Income 83% 87% 96% 88% 92% 97% 92% 96% 90% 94% 97% 89% 98% 96% 97% Multi-Asset 93% 91% 94% 93% 93% 95% 97% 96% 94% 98% 97% 94% 98% 97% 97% Quantitative Equities 23% 22% 9% 64% 8% 8% 69% 24% 16% 48% 4% 11% 23% 23% 2% Alternatives 96% 96% 99% 97% 97% 100% 97% 97% 100% 98% 97% 100% 98% 97% 100% Total 60% 62% 68% 58% 61% 73% 68% 65% 72% 67% 62% 70% 66% 66% 63% Q2 2020 Q3 2020 Q4 2020 Q1 2021 Q2 2021 |
| 25 INVESTMENT PERFORMANCE Note: Includes Janus Investment Fund, Janus Aspen Series and Clayton Street Trust (US Trusts), Janus Henderson Capital Funds (Dublin based), Dublin and UK OEIC and Investment Trusts, Luxembourg SICAVs and Australian Managed Investment Schemes. The top two Morningstar quartiles represent funds in the top half of their category based on total return. On an asset-weighted basis, 86%, 88%, 79%, 81% and 75% of total mutual fund AUM were in the top 2 Morningstar quartiles for the 10-year periods ended 30 June 2020, 30 September 2020, 31 December 2020, 31 March 2021 and 30 June 2021, respectively. For the 1-, 3-, 5- and 10-year periods ending 30 June 2021, 42%, 56%, 51% and 60% of the 196, 185, 182 and 148 total mutual funds, respectively, were in the top 2 Morningstar quartiles. Analysis based on ‘primary’ share class (Class I Shares, Institutional Shares or share class with longest history for US Trusts; Class A Shares or share class with longest history for Dublin based; primary share class as defined by Morningstar for other funds). Performance may vary by share class. Rankings may be based, in part, on the performance of a predecessor fund or share class and are calculated by Morningstar using a methodology that differs from that used by Janus Henderson. Methodology differences may have a material effect on the return and therefore the ranking. When an expense waiver is in effect, it may have a material effect on the total return, and therefore the ranking for the period. ETFs and funds not ranked by Morningstar are excluded from the analysis. Capabilities defined by Janus Henderson. © 2021 Morningstar, Inc. All Rights Reserved. % of mutual fund AUM in top 2 Morningstar quartiles Capability 1yr 3yr 5yr 1yr 3yr 5yr 1yr 3yr 5yr 1yr 3yr 5yr 1yr 3yr 5yr Equities 59% 56% 76% 60% 68% 76% 47% 57% 67% 35% 60% 64% 32% 59% 44% Fixed Income 77% 86% 74% 76% 78% 72% 70% 79% 73% 69% 79% 73% 57% 80% 75% Multi-Asset 90% 92% 92% 91% 92% 92% 91% 91% 92% 19% 91% 92% 19% 92% 91% Quantitative Equities 3% 60% 8% 4% 30% 4% 4% 33% 4% 32% 32% 4% 41% 47% 7% Alternatives 98% 100% 96% 100% 100% 100% 74% 76% 75% 30% 76% 30% 27% 76% 27% Total 67% 67% 78% 68% 74% 78% 57% 66% 71% 37% 67% 68% 33% 67% 55% Q2 2021 Q2 2020 Q3 2020 Q4 2020 Q1 2021 |
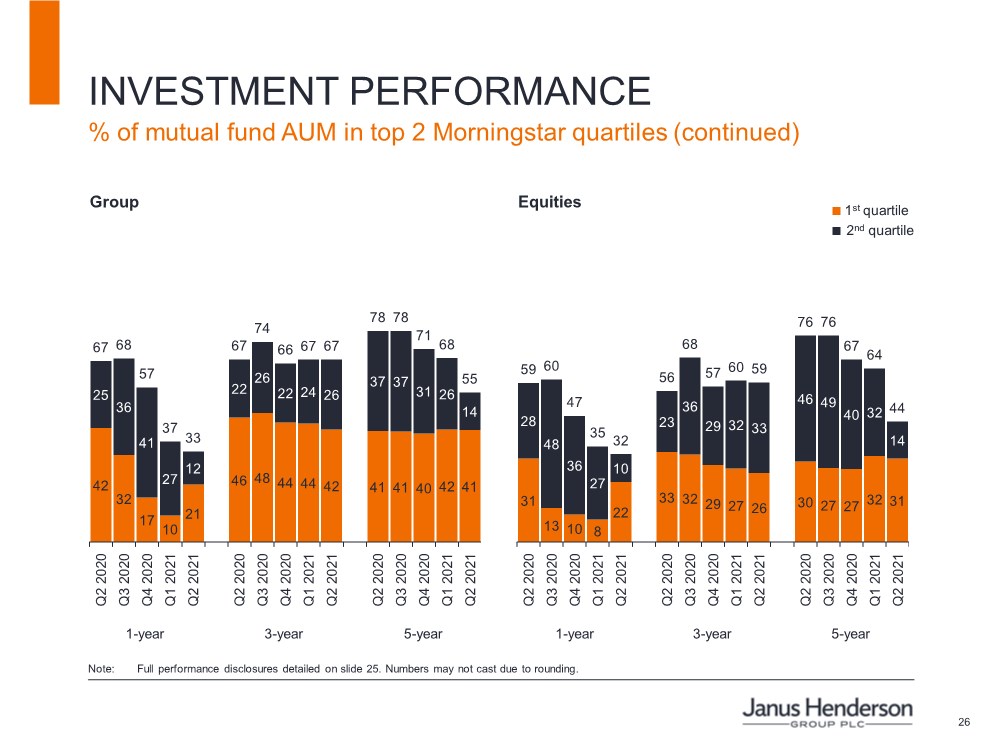
| 26 INVESTMENT PERFORMANCE % of mutual fund AUM in top 2 Morningstar quartiles (continued) Group 42 32 17 10 21 46 48 44 44 42 41 41 40 42 41 25 36 41 27 12 22 26 22 24 26 37 37 31 26 14 67 68 57 37 33 67 74 66 67 67 78 78 71 68 55 Q2 2020 Q3 2020 Q4 2020 Q1 2021 Q2 2021 Q2 2020 Q3 2020 Q4 2020 Q1 2021 Q2 2021 Q2 2020 Q3 2020 Q4 2020 Q1 2021 Q2 2021 Equities 31 13 10 8 22 33 32 29 27 26 30 27 27 32 31 28 48 36 27 10 23 36 29 32 33 46 49 40 32 14 59 60 47 35 32 56 68 57 60 59 76 76 67 64 44 Q2 2020 Q3 2020 Q4 2020 Q1 2021 Q2 2021 Q2 2020 Q3 2020 Q4 2020 Q1 2021 Q2 2021 Q2 2020 Q3 2020 Q4 2020 Q1 2021 Q2 2021 2nd quartile 1st quartile 1-year 3-year 5-year 1-year 3-year 5-year Note: Full performance disclosures detailed on slide 25. Numbers may not cast due to rounding. |
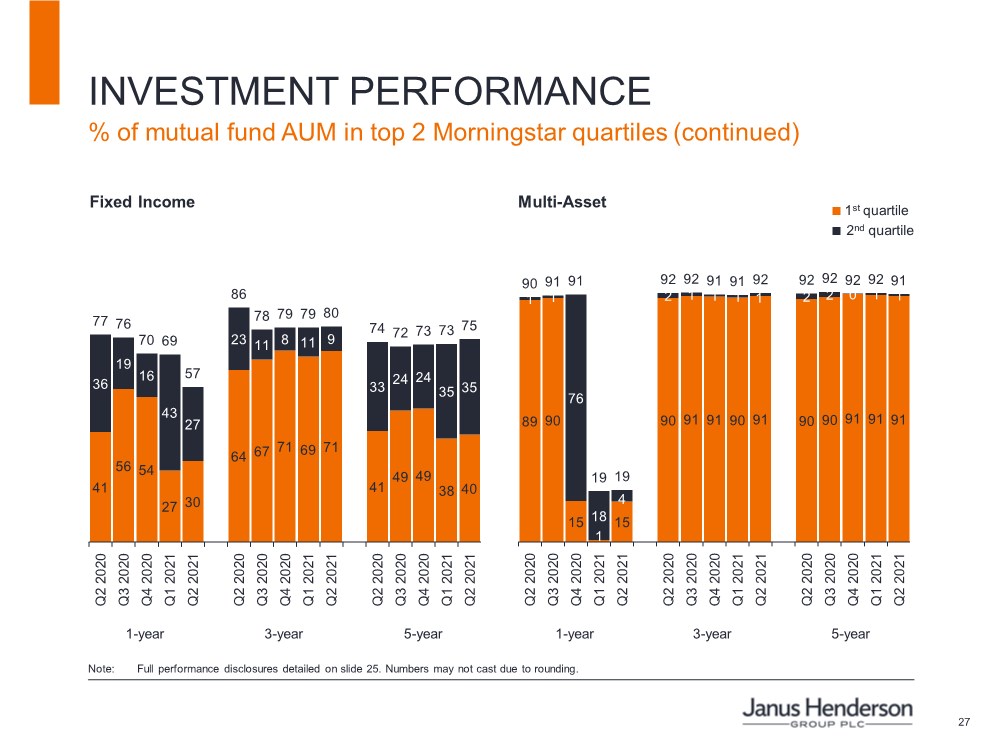
| 27 INVESTMENT PERFORMANCE % of mutual fund AUM in top 2 Morningstar quartiles (continued) 2nd quartile 1st quartile Fixed Income Multi-Asset 41 56 54 27 30 64 67 71 69 71 41 49 49 38 40 36 19 16 43 27 23 11 8 11 9 33 24 24 35 35 77 76 70 69 57 86 78 79 79 80 74 72 73 73 75 Q2 2020 Q3 2020 Q4 2020 Q1 2021 Q2 2021 Q2 2020 Q3 2020 Q4 2020 Q1 2021 Q2 2021 Q2 2020 Q3 2020 Q4 2020 Q1 2021 Q2 2021 89 90 15 1 15 90 91 91 90 91 90 90 91 91 91 1 1 76 18 4 2 1 1 1 1 2 2 0 1 1 90 91 91 19 19 92 92 91 91 92 92 92 92 92 91 Q2 2020 Q3 2020 Q4 2020 Q1 2021 Q2 2021 Q2 2020 Q3 2020 Q4 2020 Q1 2021 Q2 2021 Q2 2020 Q3 2020 Q4 2020 Q1 2021 Q2 2021 1-year 3-year 5-year 1-year 3-year 5-year Note: Full performance disclosures detailed on slide 25. Numbers may not cast due to rounding. |
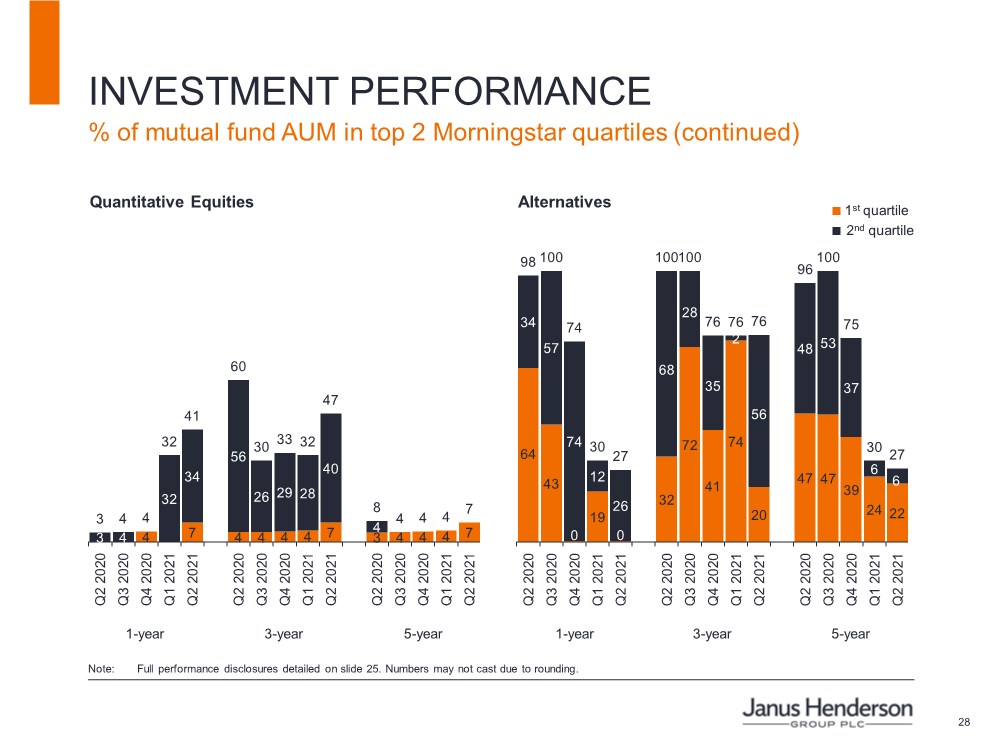
| 28 4 7 4 4 4 4 7 3 4 4 4 7 3 4 32 34 56 26 29 28 40 4 3 4 4 32 41 60 30 33 32 47 8 4 4 4 7 Q2 2020 Q3 2020 Q4 2020 Q1 2021 Q2 2021 Q2 2020 Q3 2020 Q4 2020 Q1 2021 Q2 2021 Q2 2020 Q3 2020 Q4 2020 Q1 2021 Q2 2021 64 43 0 19 0 32 72 41 74 20 47 47 39 24 22 34 57 74 12 26 68 28 35 2 56 48 53 37 6 6 98 100 74 30 27 100100 76 76 76 96 100 75 30 27 Q2 2020 Q3 2020 Q4 2020 Q1 2021 Q2 2021 Q2 2020 Q3 2020 Q4 2020 Q1 2021 Q2 2021 Q2 2020 Q3 2020 Q4 2020 Q1 2021 Q2 2021 INVESTMENT PERFORMANCE % of mutual fund AUM in top 2 Morningstar quartiles (continued) Quantitative Equities Alternatives 2nd quartile 1st quartile 1-year 3-year 5-year 1-year 3-year 5-year Note: Full performance disclosures detailed on slide 25. Numbers may not cast due to rounding. |
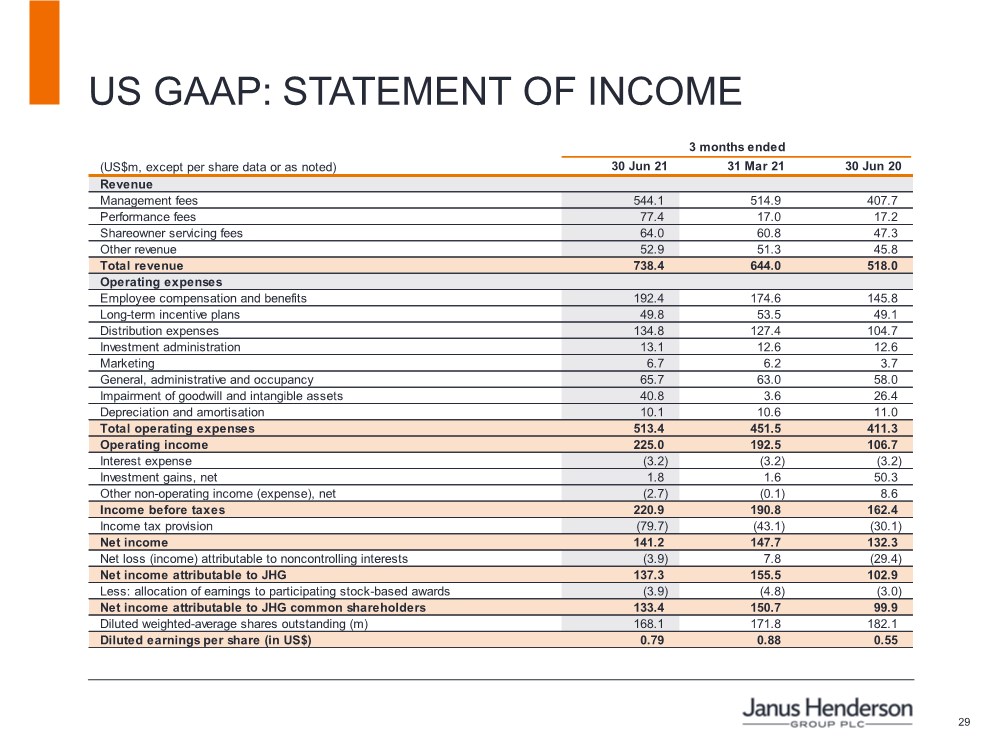
| 29 US GAAP: STATEMENT OF INCOME (US$m, except per share data or as noted) 30 Jun 21 31 Mar 21 30 Jun 20 Revenue Management fees 544.1 514.9 407.7 Performance fees 77.4 17.0 17.2 Shareowner servicing fees 64.0 60.8 47.3 Other revenue 52.9 51.3 45.8 Total revenue 738.4 644.0 518.0 Operating expenses Employee compensation and benefits 192.4 174.6 145.8 Long-term incentive plans 49.8 53.5 49.1 Distribution expenses 134.8 127.4 104.7 Investment administration 13.1 12.6 12.6 Marketing 6.7 6.2 3.7 General, administrative and occupancy 65.7 63.0 58.0 Impairment of goodwill and intangible assets 40.8 3.6 26.4 Depreciation and amortisation 10.1 10.6 11.0 Total operating expenses 513.4 451.5 411.3 Operating income 225.0 192.5 106.7 Interest expense (3.2) (3.2) (3.2) Investment gains, net 1.8 1.6 50.3 Other non-operating income (expense), net (2.7) (0.1) 8.6 Income before taxes 220.9 190.8 162.4 Income tax provision (79.7) (43.1) (30.1) Net income 141.2 147.7 132.3 Net loss (income) attributable to noncontrolling interests (3.9) 7.8 (29.4) Net income attributable to JHG 137.3 155.5 102.9 Less: allocation of earnings to participating stock-based awards (3.9) (4.8) (3.0) Net income attributable to JHG common shareholders 133.4 150.7 99.9 Diluted weighted-average shares outstanding (m) 168.1 171.8 182.1 Diluted earnings per share (in US$) 0.79 0.88 0.55 3 months ended |
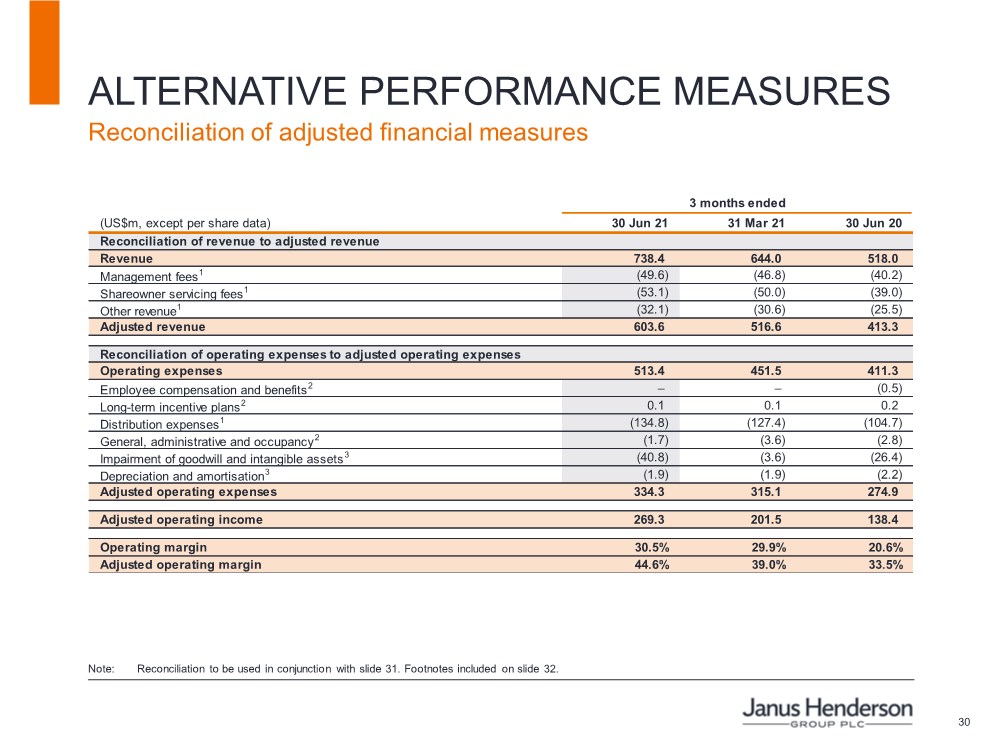
| 30 ALTERNATIVE PERFORMANCE MEASURES Note: Reconciliation to be used in conjunction with slide 31. Footnotes included on slide 32. Reconciliation of adjusted financial measures (US$m, except per share data) 30 Jun 21 31 Mar 21 30 Jun 20 Reconciliation of revenue to adjusted revenue Revenue 738.4 644.0 518.0 Management fees1 (49.6) (46.8) (40.2) Shareowner servicing fees1 (53.1) (50.0) (39.0) Other revenue1 (32.1) (30.6) (25.5) Adjusted revenue 603.6 516.6 413.3 Reconciliation of operating expenses to adjusted operating expenses Operating expenses 513.4 451.5 411.3 Employee compensation and benefits2 ––(0.5) Long-term incentive plans2 0.1 0.1 0.2 Distribution expenses1 (134.8) (127.4) (104.7) General, administrative and occupancy2 (1.7) (3.6) (2.8) Impairment of goodwill and intangible assets3 (40.8) (3.6) (26.4) Depreciation and amortisation3 (1.9) (1.9) (2.2) Adjusted operating expenses 334.3 315.1 274.9 Adjusted operating income 269.3 201.5 138.4 Operating margin 30.5% 29.9% 20.6% Adjusted operating margin 44.6% 39.0% 33.5% 3 months ended |
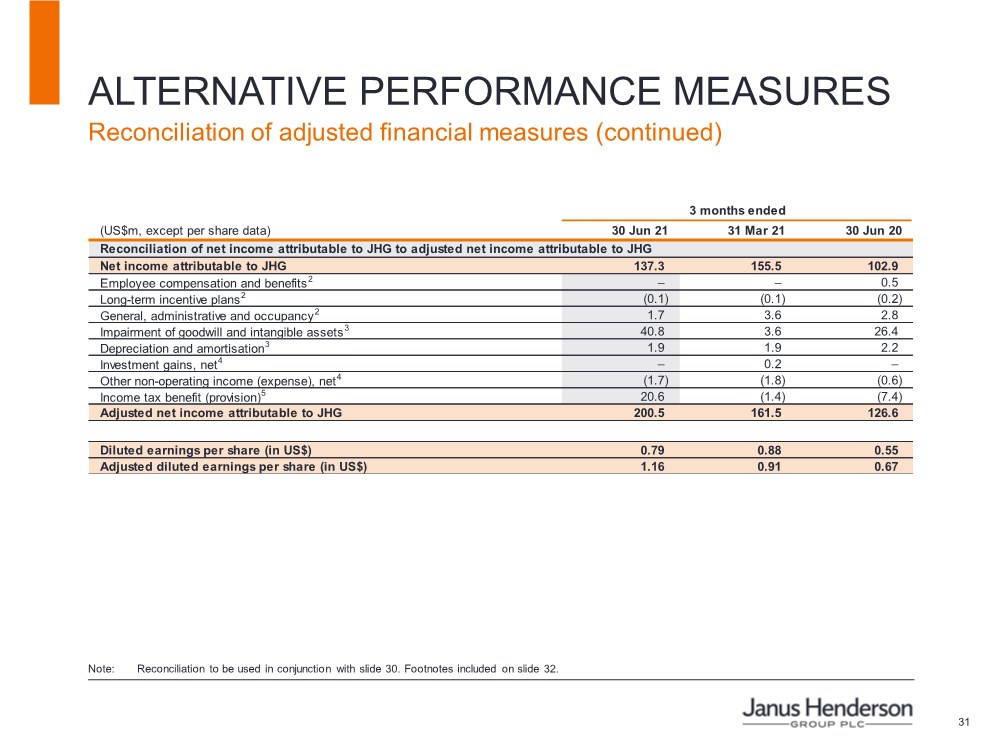
| 31 ALTERNATIVE PERFORMANCE MEASURES Reconciliation of adjusted financial measures (continued) (US$m, except per share data) 30 Jun 21 31 Mar 21 30 Jun 20 Reconciliation of net income attributable to JHG to adjusted net income attributable to JHG Net income attributable to JHG 137.3 155.5 102.9 Employee compensation and benefits2 –– 0.5 Long-term incentive plans2 (0.1) (0.1) (0.2) General, administrative and occupancy2 1.7 3.6 2.8 Impairment of goodwill and intangible assets3 40.8 3.6 26.4 Depreciation and amortisation3 1.9 1.9 2.2 Investment gains, net4 – 0.2 – Other non-operating income (expense), net4 (1.7) (1.8) (0.6) Income tax benefit (provision)5 20.6 (1.4) (7.4) Adjusted net income attributable to JHG 200.5 161.5 126.6 Diluted earnings per share (in US$) 0.79 0.88 0.55 Adjusted diluted earnings per share (in US$) 1.16 0.91 0.67 3 months ended Note: Reconciliation to be used in conjunction with slide 30. Footnotes included on slide 32. |
| 32 ALTERNATIVE PERFORMANCE MEASURES Footnotes to reconciliation of adjusted financial measures 1 JHG contracts with third-party intermediaries to distribute and service certain of its investment products. Fees for distribution and servicing related activities are either provided for separately in an investment product’s prospectus or are part of the management fee. Under both arrangements, the fees are collected by JHG and passed through to third-party intermediaries who are responsible for performing the applicable services. The majority of distribution and servicing fees collected by JHG are passed through to third-party intermediaries. JHG management believes that the deduction of distribution and service fees from revenue in the computation of adjusted revenue reflects the pass-through nature of these revenues. In certain arrangements, JHG performs the distribution and servicing activities and retains the applicable fees. Revenues for distribution and servicing activities performed by JHG are not deducted from GAAP revenue. 2 Adjustments primarily represent rent expense for subleased office space as well as administrative costs related to Dai-ichi Life’s secondary offering. JHG management believes these costs are not representative of the ongoing operations of the Group. 3 Investment management contracts have been identified as a separately identifiable intangible asset arising on the acquisition of subsidiaries and businesses. Such contracts are recognised at the net present value of the expected future cash flows arising from the contracts at the date of acquisition. For segregated mandate contracts, the intangible asset is amortised on a straight-line basis over the expected life of the contracts. Adjustments also include impairment charges of our goodwill and certain mutual fund investment management agreements, client relationships and trademarks. JHG management believes these non-cash and acquisition-related costs are not representative of the ongoing operations of the Group. 4 Adjustments primarily relate to contingent consideration adjustments associated with prior acquisitions. JHG management believes these costs are not representative of the ongoing operations of the Group. 5 The tax impact of the adjustments is calculated based on the applicable US or foreign statutory tax rate as it relates to each adjustment. Certain adjustments are either not taxable or not tax-deductible. Adjustments for the three months ended 30 June 2021 include a non-cash deferred tax expense of US$31.0 million due to the enactment of Finance Act 2021 during the second quarter 2021. |
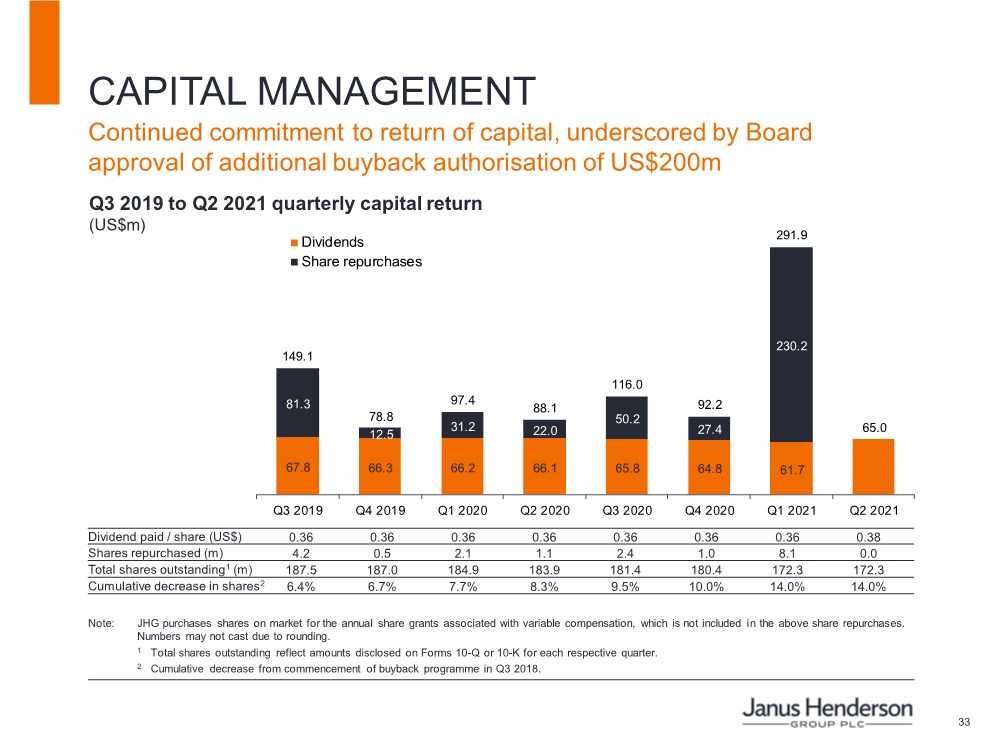
| 33 CAPITAL MANAGEMENT Note: JHG purchases shares on market for the annual share grants associated with variable compensation, which is not included in the above share repurchases. Numbers may not cast due to rounding. 1 Total shares outstanding reflect amounts disclosed on Forms 10-Q or 10-K for each respective quarter. 2 Cumulative decrease from commencement of buyback programme in Q3 2018. Continued commitment to return of capital, underscored by Board approval of additional buyback authorisation of US$200m Dividend paid / share (US$) 0.36 0.36 0.36 0.36 0.36 0.36 0.36 0.38 Shares repurchased (m) 4.2 0.5 2.1 1.1 2.4 1.0 8.1 0.0 Total shares outstanding1 (m) 187.5 187.0 184.9 183.9 181.4 180.4 172.3 172.3 Cumulative decrease in shares2 6.4% 6.7% 7.7% 8.3% 9.5% 10.0% 14.0% 14.0% Q3 2019 to Q2 2021 quarterly capital return (US$m) 67.8 66.3 66.2 66.1 65.8 64.8 61.7 81.3 12.5 31.2 22.0 50.2 27.4 230.2 – 149.1 78.8 97.4 88.1 116.0 92.2 291.9 65.0 Q3 2019 Q4 2019 Q1 2020 Q2 2020 Q3 2020 Q4 2020 Q1 2021 Q2 2021 Dividends Share repurchases |
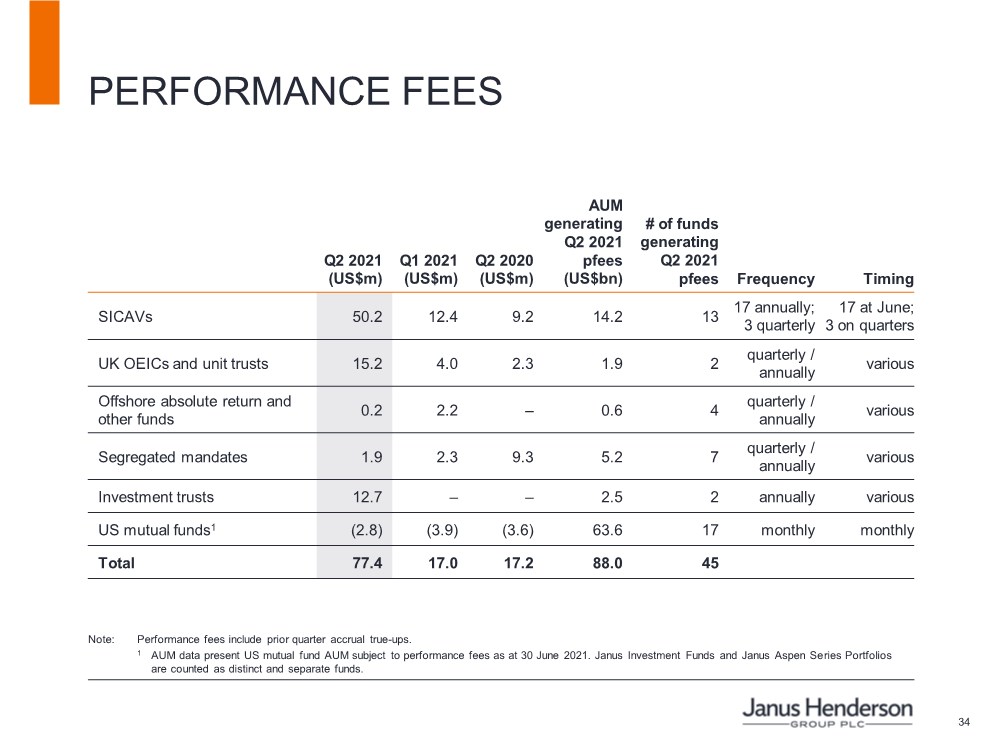
| 34 PERFORMANCE FEES Note: Performance fees include prior quarter accrual true-ups. 1 AUM data present US mutual fund AUM subject to performance fees as at 30 June 2021. Janus Investment Funds and Janus Aspen Series Portfolios are counted as distinct and separate funds. Q2 2021 (US$m) Q1 2021 (US$m) Q2 2020 (US$m) AUM generating Q2 2021 pfees (US$bn) # of funds generating Q2 2021 pfees Frequency Timing SICAVs 50.2 12.4 9.2 14.2 13 17 annually; 3 quarterly 17 at June; 3 on quarters UK OEICs and unit trusts 15.2 4.0 2.3 1.9 2 quarterly / annually various Offshore absolute return and other funds 0.2 2.2 – 0.6 4 quarterly / annually various Segregated mandates 1.9 2.3 9.3 5.2 7 quarterly / annually various Investment trusts 12.7 –– 2.5 2 annually various US mutual funds1 (2.8) (3.9) (3.6) 63.6 17 monthly monthly Total 77.4 17.0 17.2 88.0 45 |
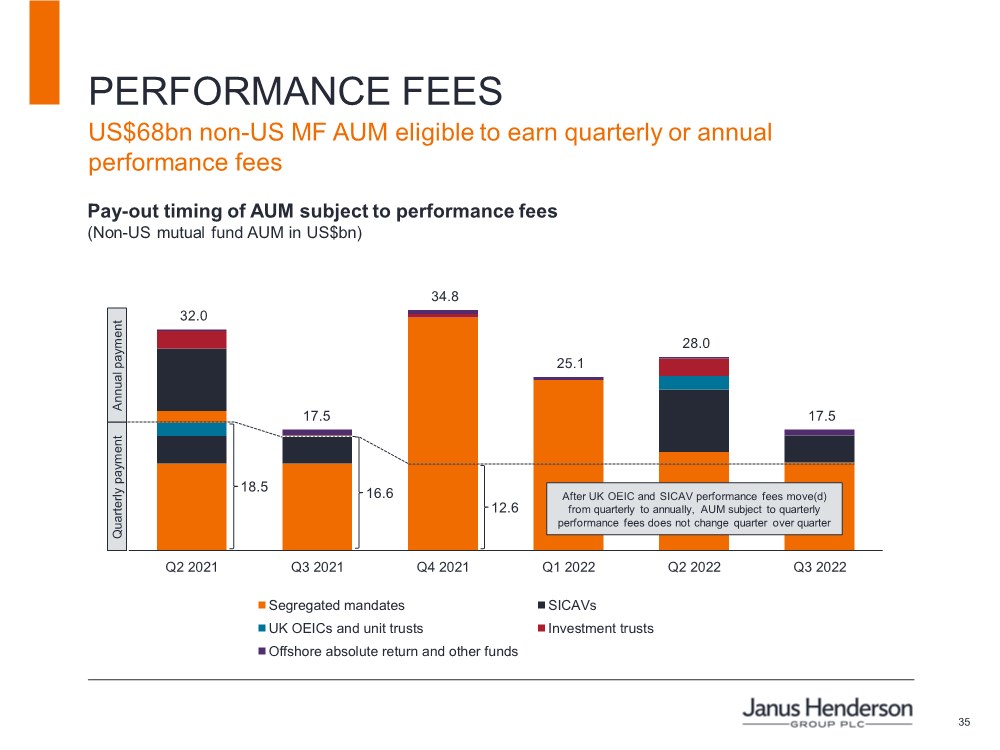
| 35 PERFORMANCE FEES 32.0 17.5 34.8 25.1 28.0 17.5 Q2 2021 Q3 2021 Q4 2021 Q1 2022 Q2 2022 Q3 2022 Segregated mandates SICAVs UK OEICs and unit trusts Investment trusts Offshore absolute return and other funds Quarterly payment Annual payment After UK OEIC and SICAV performance fees move(d) from quarterly to annually, AUM subject to quarterly performance fees does not change quarter over quarter Pay-out timing of AUM subject to performance fees (Non-US mutual fund AUM in US$bn) 18.5 16.6 12.6 US$68bn non-US MF AUM eligible to earn quarterly or annual performance fees |
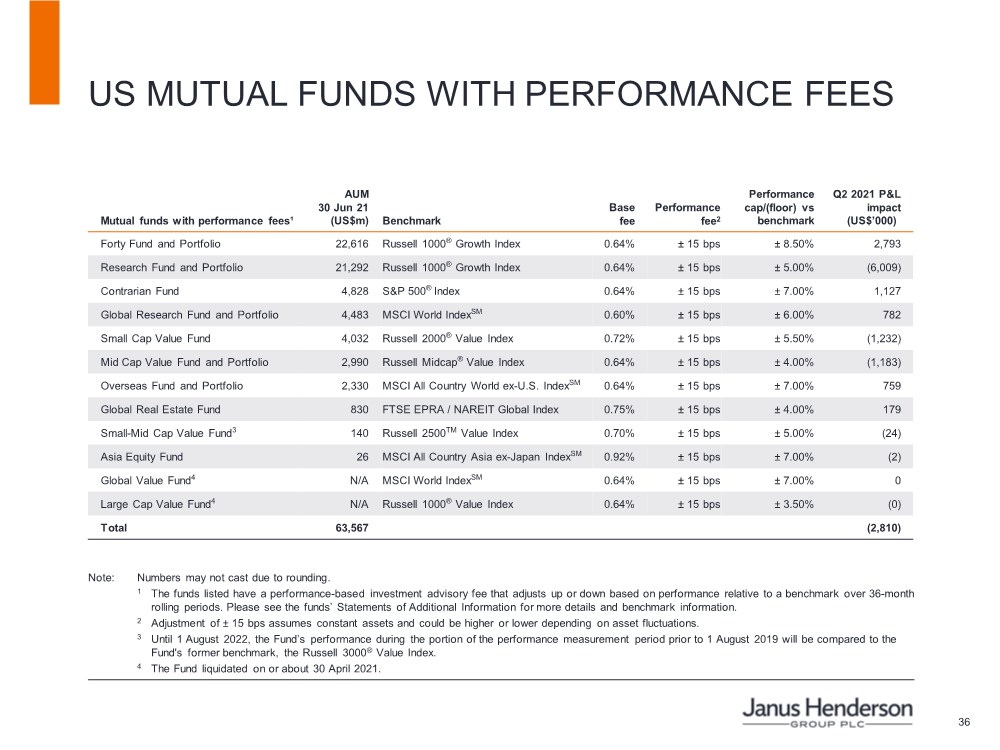
| 36 US MUTUAL FUNDS WITH PERFORMANCE FEES Note: Numbers may not cast due to rounding. 1 The funds listed have a performance-based investment advisory fee that adjusts up or down based on performance relative to a benchmark over 36-month rolling periods. Please see the funds’ Statements of Additional Information for more details and benchmark information. 2 Adjustment of ± 15 bps assumes constant assets and could be higher or lower depending on asset fluctuations. 3 Until 1 August 2022, the Fund’s performance during the portion of the performance measurement period prior to 1 August 2019 will be compared to the Fund's former benchmark, the Russell 3000® Value Index. 4 The Fund liquidated on or about 30 April 2021. Mutual funds with performance fees¹ AUM 30 Jun 21 (US$m) Benchmark Base fee Performance fee2 Performance cap/(floor) vs benchmark Q2 2021 P&L impact (US$’000) Forty Fund and Portfolio 22,616 Russell 1000® Growth Index 0.64% ± 15 bps ± 8.50% 2,793 Research Fund and Portfolio 21,292 Russell 1000® Growth Index 0.64% ± 15 bps ± 5.00% (6,009) Contrarian Fund 4,828 S&P 500® Index 0.64% ± 15 bps ± 7.00% 1,127 Global Research Fund and Portfolio 4,483 MSCI World IndexSM 0.60% ± 15 bps ± 6.00% 782 Small Cap Value Fund 4,032 Russell 2000® Value Index 0.72% ± 15 bps ± 5.50% (1,232) Mid Cap Value Fund and Portfolio 2,990 Russell Midcap® Value Index 0.64% ± 15 bps ± 4.00% (1,183) Overseas Fund and Portfolio 2,330 MSCI All Country World ex-U.S. IndexSM 0.64% ± 15 bps ± 7.00% 759 Global Real Estate Fund 830 FTSE EPRA / NAREIT Global Index 0.75% ± 15 bps ± 4.00% 179 Small-Mid Cap Value Fund3 140 Russell 2500TM Value Index 0.70% ± 15 bps ± 5.00% (24) Asia Equity Fund 26 MSCI All Country Asia ex-Japan IndexSM 0.92% ± 15 bps ± 7.00% (2) Global Value Fund4 N/A MSCI World IndexSM 0.64% ± 15 bps ± 7.00% 0 Large Cap Value Fund4 N/A Russell 1000® Value Index 0.64% ± 15 bps ± 3.50% (0) Total 63,567 (2,810) |
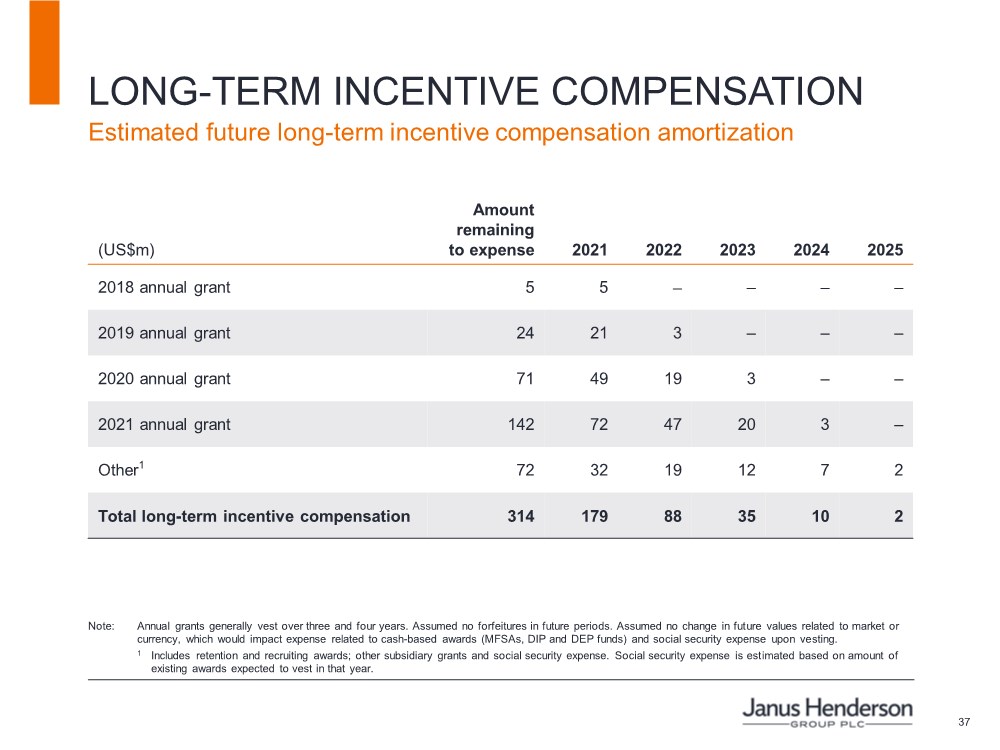
| 37 LONG-TERM INCENTIVE COMPENSATION Note: Annual grants generally vest over three and four years. Assumed no forfeitures in future periods. Assumed no change in future values related to market or currency, which would impact expense related to cash-based awards (MFSAs, DIP and DEP funds) and social security expense upon vesting. 1 Includes retention and recruiting awards; other subsidiary grants and social security expense. Social security expense is estimated based on amount of existing awards expected to vest in that year. Estimated future long-term incentive compensation amortization (US$m) Amount remaining to expense 2021 2022 2023 2024 2025 2018 annual grant 5 5 –––– 2019 annual grant 24 21 3 ––– 2020 annual grant 71 49 19 3 –– 2021 annual grant 142 72 47 20 3 – Other1 72 32 19 12 7 2 Total long-term incentive compensation 314 179 88 35 10 2 |
| 38 CONTACTS Investor enquiries Melanie Horton Co-Head Investor Relations (Non-US) +44 (0)20 7818 2905 melanie.horton@janushenderson.com Jim Kurtz Co-Head Investor Relations (US) +1 303 336 4529 jim.kurtz@janushenderson.com Investor Relations investor.relations@janushenderson.com Media enquiries Stephen Sobey +44 (0)20 7818 2523 stephen.sobey@janushenderson.com Sarah Johnson +1 720 364 0708 sarah.johnson@janushenderson.com United Kingdom: Edelman Smithfield Latika Shah +44 (0)7950 671 948 latika.shah@edelmansmithfield.com Andrew Wilde +44 (0)7786 022 022 andrew.wilde@edelmansmithfield.com Asia Pacific: Honner Craig Morris +61 2 8248 3757 craig@honner.com.au |

| 201 Bishopsgate London EC2M 3AE United Kingdom www.janushenderson.com Contact us Past performance is no guarantee of future results. Investing involves risk, including the possible loss of principal and fluctuation of value. Forward looking information This presentation includes statements concerning potential future events involving Janus Henderson Group plc that could differ materially from the events that actually occur. The differences could be caused by a number of factors including those factors identified in Janus Henderson Group’s Annual Report on Form 10-K for the fiscal year ended 31 December 2020 and the Company’s other filings and furnishings with the Securities and Exchange Commission (Commission file no. 001-38103), including those that appear under headings such as ‘Risk Factors’ and ‘Management’s Discussion and Analysis of Financial Condition and Results of Operations’. Many of these factors are beyond the control of the Company and its management. Any forward-looking statements contained in this presentation are as of the date on which such statements were made. The Company assumes no duty to update them, even if experience, unexpected events, or future changes make it clear that any projected results expressed or implied therein will not be realised. Annualised, pro forma, projected and estimated numbers are used for illustrative purposes only, are not forecasts and may not reflect actual results. No public offer The information, statements and opinions contained in this presentation do not constitute a public offer under any applicable legislation or an offer to sell or solicitation of any offer to buy any securities or financial instruments or any advice or recommendation with respect to such securities or other financial instruments. Not all products or services are available in all jurisdictions. Various account minimums or other eligibility qualifications apply depending on the investment strategy, vehicle or investor jurisdiction. Mutual funds in the US distributed by Janus Henderson Distributors. ETFs distributed by ALPS Distributors, Inc. ALPS is not affiliated with Janus Henderson or any of its subsidiaries. Please consider the charges, risks, expenses and investment objectives carefully before investing. For a US fund prospectus or, if available, a summary prospectus containing this and other information, please contact your investment professional or call 800.668.0434. Read it carefully before you invest or send money. For prospectuses prior to effectiveness: The information in each prospectus is not complete and may be changed. The securities may not be sold until each registration statement filed with the Securities and Exchange Commission is effective. Each prospectus is not an offer to sell securities and is not soliciting an offer to buy securities in any state where the offer is not permitted. Janus Henderson and Intech are trademarks of Janus Henderson Group plc or one of its subsidiaries. © Janus Henderson Group plc. |