Attached files
| file | filename |
|---|---|
| 8-K - 8-K - Finward Bancorp | d140694d8k.htm |
| EX-99.1 - EX-99.1 - Finward Bancorp | d140694dex991.htm |
| EX-10.1 - EX-10.1 - Finward Bancorp | d140694dex101.htm |
| EX-2.1 - EX-2.1 - Finward Bancorp | d140694dex21.htm |
Exhibit 99.2 Filed by Finward Bancorp pursuant to Rule 425 under the Securities Act of 1933 and deemed filed pursuant to Rule 14a-12 of the Securities Exchange Act of 1934 Subject Company: Finward Bancorp Commission File No. 000-26128 FOR FURTHER INFORMATION Contact Sarah Ricciardi (219) 853-7575 + Enhancing Chicagoland PresenceExhibit 99.2 Filed by Finward Bancorp pursuant to Rule 425 under the Securities Act of 1933 and deemed filed pursuant to Rule 14a-12 of the Securities Exchange Act of 1934 Subject Company: Finward Bancorp Commission File No. 000-26128 FOR FURTHER INFORMATION Contact Sarah Ricciardi (219) 853-7575 + Enhancing Chicagoland Presence

July 29, 2021 Disclosures Forward-Looking Statements This presentation may contain forward-looking statements regarding the financial performance, business prospects, growth and operating strategies of Finward Bancorp (“FNWD”). For these statements, FNWD claims the protections of the safe harbor for forward-looking statements contained in the Private Securities Litigation Reform Act of 1995. Statements in this communication should be considered in conjunction with the other information available about FNWD, including the information in the filings FNWD makes with the Securities and Exchange Commission (“SEC”). Forward-looking statements provide current expectations or forecasts of future events and are not guarantees of future performance. The forward- looking statements are based on management’s expectations and are subject to a number of risks and uncertainties. Forward-looking statements are typically identified by using words such as “anticipate,” “estimate,” “project,” “intend,” “plan,” “believe,” “will” and similar expressions in connection with any discussion of future operating or financial performance. Although management believes that the expectations reflected in such forward-looking statements are reasonable, actual results may differ materially from those expressed or implied in such statements. Risks and uncertainties that could cause actual results to differ materially include: the significant risks and uncertainties for our business, results of operations, and financial condition, as well as our regulatory capital and liquidity ratios and other regulatory requirements caused by the COVID-19 pandemic, which will depend on several factors, including the scope and duration of the pandemic, its influence on financial markets, the effectiveness of our remote work arrangements and staffing levels in branches and other operational facilities, and actions taken by governmental authorities and other third parties in response to the pandemic; changes in asset quality and credit risk; the inability to sustain revenue and earnings growth; changes in interest rates, market liquidity, and capital markets, as well as the magnitude of such changes, which may reduce net interest margins; inflation; customer acceptance of FNWD’s products and services; customer borrowing, repayment, investment, and deposit practices; customer disintermediation; the introduction, withdrawal, success, and timing of business initiatives; competitive conditions; the inability to realize cost savings or revenues or to implement integration plans and other consequences associated with mergers, acquisitions, and divestitures; economic conditions; and the impact, extent, and timing of technological changes, capital management activities, and other actions of the Federal Reserve Board and legislative and regulatory actions and reforms. In addition to the above factors, we also caution that the actual amounts and timing of any future common stock dividends or share repurchases will be subject to various factors, including our capital position, financial performance, capital impacts of strategic initiatives, market conditions, and regulatory and accounting considerations, as well as any other factors that our Board of Directors deems relevant in making such a determination. Therefore, there can be no assurance that we will repurchase shares or pay any dividends to holders of our common stock, or as to the amount of any such repurchases or dividends. Further, statements about the effects of the COVID-19 pandemic on our business, operations, financial performance, and prospects may constitute forward-looking statements and are subject to the risk that the actual impacts may differ, possibly materially, from what is reflected in those forward-looking statements due to factors and future developments that are uncertain, unpredictable, and in many cases beyond our control, including the scope and duration of the pandemic, actions taken by governmental authorities in response to the pandemic, and the direct and indirect impact of the pandemic on our customers, third parties, and us. Important Additional Information for Shareholders and Where to Find It In connection with the proposed merger, FNWD will file with the SEC a Registration Statement on Form S-4 that will include a Joint Proxy Statement of RYFL and FNWD, as well as a Prospectus of FNWD (the “Joint Proxy Statement/Prospectus”), as well as other relevant documents concerning the proposed transaction. SHAREHOLDERS AND INVESTORS ARE URGED TO READ THE REGISTRATION STATEMENT AND THE JOINT PROXY STATEMENT/ PROSPECTUS REGARDING THE MERGER WHEN IT BECOMES AVAILABLE AND ANY OTHER RELEVANT DOCUMENTS FILED WITH THE SEC, AS WELL AS ANY AMENDMENTS OR SUPPLEMENTS TO THOSE DOCUMENTS, BECAUSE THEY WILL CONTAIN IMPORTANT INFORMATION. The Joint Proxy Statement/Prospectus and other relevant materials (when they become available), and any other documents FNWD has filed with the SEC, may be obtained free of charge at the SEC’s website at www.sec.gov. In addition, investors and security holders may obtain copies of the documents FNWD has filed with the SEC, free of charge, from FNWD at www.ibankpeoples.com under the tab “Investor Relations – SEC Filings.” Alternatively, these documents, when available, can be obtained free of charge from FNWD upon written request to Finward Bancorp, Attn: Shareholder Services, 9204 Columbia Avenue, Munster, Indiana 46321, or by calling (219) 836-4400, and from RYFL upon written request to Royal Financial, Inc., Attn: Corporate Secretary, 9226 Commercial Avenue, Chicago, Illinois 60617, or by calling (773) 768-4800. The information available through FNWD’s website is not and shall not be deemed part of this presentation or incorporated by reference into other filings FNWD makes with the SEC. FNWD, RYFL, and certain of their respective directors and executive officers may be deemed to be participants in the solicitation of proxies from the stockholders of FNWD and RYFL in connection with the proposed merger. Information about the directors and executive officers of FNWD is set forth in FNWD’s Annual Report on Form 10-K filed with the SEC on March 22, 2021, and in the proxy statement for FNWD’s 2021 annual meeting of shareholders, as filed with the SEC on Schedule 14A on March 31, 2021. Additional information regarding the interests of these participants and any other persons who may be deemed participants in the transaction may be obtained by reading the Joint Proxy Statement/Prospectus regarding the proposed merger when it becomes available. Free copies of this document may be obtained as described in the preceding paragraph. This presentation does not constitute an offer to sell or the solicitation of an offer to buy any securities or a solicitation of any vote or approval. 2July 29, 2021 Disclosures Forward-Looking Statements This presentation may contain forward-looking statements regarding the financial performance, business prospects, growth and operating strategies of Finward Bancorp (“FNWD”). For these statements, FNWD claims the protections of the safe harbor for forward-looking statements contained in the Private Securities Litigation Reform Act of 1995. Statements in this communication should be considered in conjunction with the other information available about FNWD, including the information in the filings FNWD makes with the Securities and Exchange Commission (“SEC”). Forward-looking statements provide current expectations or forecasts of future events and are not guarantees of future performance. The forward- looking statements are based on management’s expectations and are subject to a number of risks and uncertainties. Forward-looking statements are typically identified by using words such as “anticipate,” “estimate,” “project,” “intend,” “plan,” “believe,” “will” and similar expressions in connection with any discussion of future operating or financial performance. Although management believes that the expectations reflected in such forward-looking statements are reasonable, actual results may differ materially from those expressed or implied in such statements. Risks and uncertainties that could cause actual results to differ materially include: the significant risks and uncertainties for our business, results of operations, and financial condition, as well as our regulatory capital and liquidity ratios and other regulatory requirements caused by the COVID-19 pandemic, which will depend on several factors, including the scope and duration of the pandemic, its influence on financial markets, the effectiveness of our remote work arrangements and staffing levels in branches and other operational facilities, and actions taken by governmental authorities and other third parties in response to the pandemic; changes in asset quality and credit risk; the inability to sustain revenue and earnings growth; changes in interest rates, market liquidity, and capital markets, as well as the magnitude of such changes, which may reduce net interest margins; inflation; customer acceptance of FNWD’s products and services; customer borrowing, repayment, investment, and deposit practices; customer disintermediation; the introduction, withdrawal, success, and timing of business initiatives; competitive conditions; the inability to realize cost savings or revenues or to implement integration plans and other consequences associated with mergers, acquisitions, and divestitures; economic conditions; and the impact, extent, and timing of technological changes, capital management activities, and other actions of the Federal Reserve Board and legislative and regulatory actions and reforms. In addition to the above factors, we also caution that the actual amounts and timing of any future common stock dividends or share repurchases will be subject to various factors, including our capital position, financial performance, capital impacts of strategic initiatives, market conditions, and regulatory and accounting considerations, as well as any other factors that our Board of Directors deems relevant in making such a determination. Therefore, there can be no assurance that we will repurchase shares or pay any dividends to holders of our common stock, or as to the amount of any such repurchases or dividends. Further, statements about the effects of the COVID-19 pandemic on our business, operations, financial performance, and prospects may constitute forward-looking statements and are subject to the risk that the actual impacts may differ, possibly materially, from what is reflected in those forward-looking statements due to factors and future developments that are uncertain, unpredictable, and in many cases beyond our control, including the scope and duration of the pandemic, actions taken by governmental authorities in response to the pandemic, and the direct and indirect impact of the pandemic on our customers, third parties, and us. Important Additional Information for Shareholders and Where to Find It In connection with the proposed merger, FNWD will file with the SEC a Registration Statement on Form S-4 that will include a Joint Proxy Statement of RYFL and FNWD, as well as a Prospectus of FNWD (the “Joint Proxy Statement/Prospectus”), as well as other relevant documents concerning the proposed transaction. SHAREHOLDERS AND INVESTORS ARE URGED TO READ THE REGISTRATION STATEMENT AND THE JOINT PROXY STATEMENT/ PROSPECTUS REGARDING THE MERGER WHEN IT BECOMES AVAILABLE AND ANY OTHER RELEVANT DOCUMENTS FILED WITH THE SEC, AS WELL AS ANY AMENDMENTS OR SUPPLEMENTS TO THOSE DOCUMENTS, BECAUSE THEY WILL CONTAIN IMPORTANT INFORMATION. The Joint Proxy Statement/Prospectus and other relevant materials (when they become available), and any other documents FNWD has filed with the SEC, may be obtained free of charge at the SEC’s website at www.sec.gov. In addition, investors and security holders may obtain copies of the documents FNWD has filed with the SEC, free of charge, from FNWD at www.ibankpeoples.com under the tab “Investor Relations – SEC Filings.” Alternatively, these documents, when available, can be obtained free of charge from FNWD upon written request to Finward Bancorp, Attn: Shareholder Services, 9204 Columbia Avenue, Munster, Indiana 46321, or by calling (219) 836-4400, and from RYFL upon written request to Royal Financial, Inc., Attn: Corporate Secretary, 9226 Commercial Avenue, Chicago, Illinois 60617, or by calling (773) 768-4800. The information available through FNWD’s website is not and shall not be deemed part of this presentation or incorporated by reference into other filings FNWD makes with the SEC. FNWD, RYFL, and certain of their respective directors and executive officers may be deemed to be participants in the solicitation of proxies from the stockholders of FNWD and RYFL in connection with the proposed merger. Information about the directors and executive officers of FNWD is set forth in FNWD’s Annual Report on Form 10-K filed with the SEC on March 22, 2021, and in the proxy statement for FNWD’s 2021 annual meeting of shareholders, as filed with the SEC on Schedule 14A on March 31, 2021. Additional information regarding the interests of these participants and any other persons who may be deemed participants in the transaction may be obtained by reading the Joint Proxy Statement/Prospectus regarding the proposed merger when it becomes available. Free copies of this document may be obtained as described in the preceding paragraph. This presentation does not constitute an offer to sell or the solicitation of an offer to buy any securities or a solicitation of any vote or approval. 2

July 29, 2021 Overview of Royal Financial, Inc. (RYFL) Company Overview Branch Map § Royal Financial, Inc. has provided banking and financial services in the Chicagoland area since 1887 through its wholly-owned subsidiary Royal Savings Bank § Headquartered in Chicago, IL and operates nine full-services branch locations throughout Chicago with lending centers in Homewood and St. Charles, IL § Consistently profitable with net income of $5.2 million for the twelve months ended 6/30/2021, resulting in a LTM ROAA of 1.01% and ROATCE of 11.9% (1) (1) § 4.18% yield on loans and 0.33% cost of total deposits for the most recent quarter ended 6/30/2021 Footprint Highlights Financial Highlights Balance Sheet ($M) Capital § Operating markets provide attractive demographics and business dynamics Assets $533 TCE / TA 8.6% aligned with operating model Net Loans (incl. HFS) $460 § Royal Financial, Inc. serves over 2.3 million households located throughout Deposits $466 Cook County and DuPage County (3) Profitability (LTM) Asset Quality NIM 3.42% NPAs/Assets 0.44% (2) § $42.0 million average deposits per location ROAA 1.01% LLR/Loans 0.83% Source: S&P Global Market Intelligence, 2020 FDIC Summary of Deposits & Company Documents. ROATCE 11.9% LLR/NPLs 175.1% (1) Loan yield based on bank-level regulatory data and deposit cost based on BHC-GAAP data. (2) Based on 2020 FDIC Summary of Deposits. Efficiency Ratio 57.1% LTM NCOs/Avg. Loans (0.05%) (3) Asset quality data based on bank-level regulatory data. 3July 29, 2021 Overview of Royal Financial, Inc. (RYFL) Company Overview Branch Map § Royal Financial, Inc. has provided banking and financial services in the Chicagoland area since 1887 through its wholly-owned subsidiary Royal Savings Bank § Headquartered in Chicago, IL and operates nine full-services branch locations throughout Chicago with lending centers in Homewood and St. Charles, IL § Consistently profitable with net income of $5.2 million for the twelve months ended 6/30/2021, resulting in a LTM ROAA of 1.01% and ROATCE of 11.9% (1) (1) § 4.18% yield on loans and 0.33% cost of total deposits for the most recent quarter ended 6/30/2021 Footprint Highlights Financial Highlights Balance Sheet ($M) Capital § Operating markets provide attractive demographics and business dynamics Assets $533 TCE / TA 8.6% aligned with operating model Net Loans (incl. HFS) $460 § Royal Financial, Inc. serves over 2.3 million households located throughout Deposits $466 Cook County and DuPage County (3) Profitability (LTM) Asset Quality NIM 3.42% NPAs/Assets 0.44% (2) § $42.0 million average deposits per location ROAA 1.01% LLR/Loans 0.83% Source: S&P Global Market Intelligence, 2020 FDIC Summary of Deposits & Company Documents. ROATCE 11.9% LLR/NPLs 175.1% (1) Loan yield based on bank-level regulatory data and deposit cost based on BHC-GAAP data. (2) Based on 2020 FDIC Summary of Deposits. Efficiency Ratio 57.1% LTM NCOs/Avg. Loans (0.05%) (3) Asset quality data based on bank-level regulatory data. 3
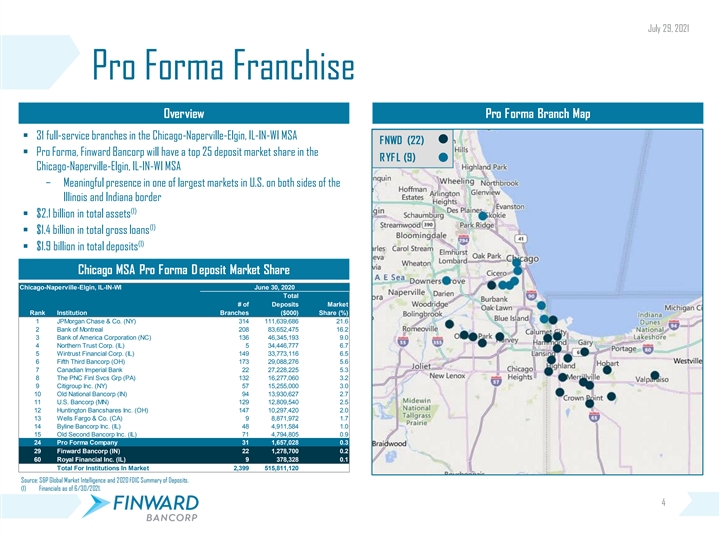
July 29, 2021 Pro Forma Franchise Overview Pro Forma Branch Map § 31 full-service branches in the Chicago-Naperville-Elgin, IL-IN-WI MSA FNWD (22) § Pro Forma, Finward Bancorp will have a top 25 deposit market share in the RYF L (9) Chicago-Naperville-Elgin, IL-IN-WI MSA − Meaningful presence in one of largest markets in U.S. on both sides of the Illinois and Indiana border (1) § $2.1 billion in total assets (1) § $1.4 billion in total gross loans (1) § $1.9 billion in total deposits Chicago MSA Pro Forma D eposit Market Share Chicago-Naperville-Elgin, IL-IN-WI June 30, 2020 Total # of Deposits Market Rank Institution Branches ($000) Share (%) 1 JPMorgan Chase & Co. (NY) 314 111,639,686 21.6 2 Bank of Montreal 208 83,652,475 16.2 3 Bank of America Corporation (NC) 136 46,345,193 9.0 4 Northern Trust Corp. (IL) 5 34,446,777 6.7 5 Wintrust Financial Corp. (IL) 149 33,773,116 6.5 6 Fifth Third Bancorp (OH) 173 29,088,276 5.6 7 Canadian Imperial Bank 22 27,228,225 5.3 8 The PNC Finl Svcs Grp (PA) 132 16,277,060 3.2 9 Citigroup Inc. (NY) 57 15,255,000 3.0 10 Old National Bancorp (IN) 94 13,930,627 2.7 11 U.S. Bancorp (MN) 129 12,809,540 2.5 12 Huntington Bancshares Inc. (OH) 147 10,297,420 2.0 13 Wells Fargo & Co. (CA) 9 8,871,972 1.7 14 Byline Bancorp Inc. (IL) 48 4,911,584 1.0 15 Old Second Bancorp Inc. (IL) 71 4,794,805 0.9 24 Pro Forma Company 31 1,657,028 0.3 29 Finward Bancorp (IN) 22 1,278,700 0.2 60 Royal Financial Inc. (IL) 9 378,328 0.1 Total For Institutions In Market 2,399 515,811,120 Source: S&P Global Market Intelligence and 2020 FDIC Summary of Deposits. (1) Financials as of 6/30/2021. 4July 29, 2021 Pro Forma Franchise Overview Pro Forma Branch Map § 31 full-service branches in the Chicago-Naperville-Elgin, IL-IN-WI MSA FNWD (22) § Pro Forma, Finward Bancorp will have a top 25 deposit market share in the RYF L (9) Chicago-Naperville-Elgin, IL-IN-WI MSA − Meaningful presence in one of largest markets in U.S. on both sides of the Illinois and Indiana border (1) § $2.1 billion in total assets (1) § $1.4 billion in total gross loans (1) § $1.9 billion in total deposits Chicago MSA Pro Forma D eposit Market Share Chicago-Naperville-Elgin, IL-IN-WI June 30, 2020 Total # of Deposits Market Rank Institution Branches ($000) Share (%) 1 JPMorgan Chase & Co. (NY) 314 111,639,686 21.6 2 Bank of Montreal 208 83,652,475 16.2 3 Bank of America Corporation (NC) 136 46,345,193 9.0 4 Northern Trust Corp. (IL) 5 34,446,777 6.7 5 Wintrust Financial Corp. (IL) 149 33,773,116 6.5 6 Fifth Third Bancorp (OH) 173 29,088,276 5.6 7 Canadian Imperial Bank 22 27,228,225 5.3 8 The PNC Finl Svcs Grp (PA) 132 16,277,060 3.2 9 Citigroup Inc. (NY) 57 15,255,000 3.0 10 Old National Bancorp (IN) 94 13,930,627 2.7 11 U.S. Bancorp (MN) 129 12,809,540 2.5 12 Huntington Bancshares Inc. (OH) 147 10,297,420 2.0 13 Wells Fargo & Co. (CA) 9 8,871,972 1.7 14 Byline Bancorp Inc. (IL) 48 4,911,584 1.0 15 Old Second Bancorp Inc. (IL) 71 4,794,805 0.9 24 Pro Forma Company 31 1,657,028 0.3 29 Finward Bancorp (IN) 22 1,278,700 0.2 60 Royal Financial Inc. (IL) 9 378,328 0.1 Total For Institutions In Market 2,399 515,811,120 Source: S&P Global Market Intelligence and 2020 FDIC Summary of Deposits. (1) Financials as of 6/30/2021. 4

July 29, 2021 Transaction Rationale (1) § Strengthens presence in attractive Chicago market, with pro forma deposits of approximately $1.9 billion and top 25 deposit market share in the Chicago-Naperville-Elgin, IL-IN-WI MSA § Meaningful acceleration of Illinois market expansion and leverages existing team of experienced bankers and in-market resources Strategically Compelling § Market overlap allows for operating efficiencies § Excellent historical credit performance (5-year averages: 0.07% NCOs/Avg. Loans and 0.44% NPAs/Assets) § Loans/Deposits ratio of 99.5% (inclusive of PPP loans and any associated deposits) § Strong EPS accretion of ~25% in the first year of fully realized cost savings § Mid single-digits tangible book value dilution with an earn back of approximately 2.3 years using the cross-over method Financially Attractive § Bolsters performance metrics and helps realize economies of scale § Internal rate of return ~29% exceeds company cost of capital hurdles § Royal Financial’s footprint lies within the demographically attractive cities of Niles and Westmont as well as the city of Chicago D ynamic § Pro forma company positioned to benefit from the growth potential of leveraging its present business model within those new Geographic Footprint and existing markets, while benefiting from a higher legal lending limit and additional products on the Finward platform § Comprehensive due diligence process and thorough loan review completed Comprehensive § Over the past decade, conservative risk management culture historically D ue § Royal Financial has an experienced management team with strong connectivity in the communities it serves to assist in post- D iligence merger operations, integration and market expansion (1) As of 6/30/2021. 5July 29, 2021 Transaction Rationale (1) § Strengthens presence in attractive Chicago market, with pro forma deposits of approximately $1.9 billion and top 25 deposit market share in the Chicago-Naperville-Elgin, IL-IN-WI MSA § Meaningful acceleration of Illinois market expansion and leverages existing team of experienced bankers and in-market resources Strategically Compelling § Market overlap allows for operating efficiencies § Excellent historical credit performance (5-year averages: 0.07% NCOs/Avg. Loans and 0.44% NPAs/Assets) § Loans/Deposits ratio of 99.5% (inclusive of PPP loans and any associated deposits) § Strong EPS accretion of ~25% in the first year of fully realized cost savings § Mid single-digits tangible book value dilution with an earn back of approximately 2.3 years using the cross-over method Financially Attractive § Bolsters performance metrics and helps realize economies of scale § Internal rate of return ~29% exceeds company cost of capital hurdles § Royal Financial’s footprint lies within the demographically attractive cities of Niles and Westmont as well as the city of Chicago D ynamic § Pro forma company positioned to benefit from the growth potential of leveraging its present business model within those new Geographic Footprint and existing markets, while benefiting from a higher legal lending limit and additional products on the Finward platform § Comprehensive due diligence process and thorough loan review completed Comprehensive § Over the past decade, conservative risk management culture historically D ue § Royal Financial has an experienced management team with strong connectivity in the communities it serves to assist in post- D iligence merger operations, integration and market expansion (1) As of 6/30/2021. 5

July 29, 2021 Continuing Our Growth Story $2,139 Merger with Royal Financial is a capstone of a multi-year transformation that has enhanced our platform for organic growth $533 (1) Acquired Assets $1,329 Total Organic Assets $1,096 $179 $1,606 $146 $865 $775 $1,498 $57 $38 $1,150 $927 $950 $914 $808 $737 $693 2013 2014 2015 2016 2017 2018 2019 2020 Q2 2021 § Management § Completed § Ben Bochnowski § Ben Bochnowski § Todd Scheub § Completed § Completed § Announced key § Applied to transition began acquisition of named added CEO title named EVP & acquisition of acquisition of executive NASDAQ for First Federal President Chief Banking First Personal, AJS Bancorp, changes direct listing § Ben Bochnowski § David A. Savings & Loan Officer extending branch solidifying the positioning our named COO§ Completed Bochnowski § Integrating footprint into Illinois footprint team for future § Ben Bochnowski acquisition of named Executive § Company Salesforce § Danette Garza Illinois growth named a Liberty Savings Chairman repositioning § Partnered with across platform named a Director Bank balance sheet § Celebrated LPL Financial to § Bank subsidiary Director§ Robert E. § Change name to and focused on crossing the $1.0 provide certain converted from a § Celebrated 30 Johnson named a Finward Bancorp, regulatory and billion in total wealth solutions savings bank to years of being a Director reflecting growth compliance work assets mark an Indiana- publicly traded § Incentive based and evolution of § Wealth chartered company§ Launched new compensation the Company management commercial bank treasury programs leadership § Leadership management implemented transition enhancements suite of services (CCO and CPO) § Announced acquisition of Management Team Building Acquisitions Key Moments Royal Financial, Inc., expanding Note: Total assets as of December 31 for each period and June 30 for Q2 2021. Illinois footprint (1) Based on reported acquired assets per Company’s Audits and 10-K filings. 6July 29, 2021 Continuing Our Growth Story $2,139 Merger with Royal Financial is a capstone of a multi-year transformation that has enhanced our platform for organic growth $533 (1) Acquired Assets $1,329 Total Organic Assets $1,096 $179 $1,606 $146 $865 $775 $1,498 $57 $38 $1,150 $927 $950 $914 $808 $737 $693 2013 2014 2015 2016 2017 2018 2019 2020 Q2 2021 § Management § Completed § Ben Bochnowski § Ben Bochnowski § Todd Scheub § Completed § Completed § Announced key § Applied to transition began acquisition of named added CEO title named EVP & acquisition of acquisition of executive NASDAQ for First Federal President Chief Banking First Personal, AJS Bancorp, changes direct listing § Ben Bochnowski § David A. Savings & Loan Officer extending branch solidifying the positioning our named COO§ Completed Bochnowski § Integrating footprint into Illinois footprint team for future § Ben Bochnowski acquisition of named Executive § Company Salesforce § Danette Garza Illinois growth named a Liberty Savings Chairman repositioning § Partnered with across platform named a Director Bank balance sheet § Celebrated LPL Financial to § Bank subsidiary Director§ Robert E. § Change name to and focused on crossing the $1.0 provide certain converted from a § Celebrated 30 Johnson named a Finward Bancorp, regulatory and billion in total wealth solutions savings bank to years of being a Director reflecting growth compliance work assets mark an Indiana- publicly traded § Incentive based and evolution of § Wealth chartered company§ Launched new compensation the Company management commercial bank treasury programs leadership § Leadership management implemented transition enhancements suite of services (CCO and CPO) § Announced acquisition of Management Team Building Acquisitions Key Moments Royal Financial, Inc., expanding Note: Total assets as of December 31 for each period and June 30 for Q2 2021. Illinois footprint (1) Based on reported acquired assets per Company’s Audits and 10-K filings. 6

July 29, 2021 Transaction Terms (1) Aggregate D eal Value§ $52.9 million § Each share of RYFL may elect to receive either 0.4609 shares of FNWD stock or $20.14 in cash Consideration Structure § Elections subject to proration such that 65% of RYFL shares will receive FNWD stock and 35% will receive cash (1) Consideration Mix§ Approximately 65% stock / 35% cash § Termination fee of $2.0 million, equal to 3.8% of the transaction value, will be paid to FNWD by RYFL under certain Termination Fee circumstances as set forth in the definitive merger agreement § Price / TBV: 1.15x (2) § Price / LTM EPS: 10.2x Pricing Ratios § Price / 2022 EPS + 100% Cost Savings: 5.6x § Core Deposit Premium: 2.3% § Royal Financial requires shareholder and regulatory approval Required Approvals § Finward Bancorp requires shareholder and regulatory approval § One current director or executive officer of Royal Financial, Inc. mutually agreed upon, shall be appointed to Finward Board Representation Bancorp’s Board of Directors Anticipated Closing§ Q1’22 (1) Based on FNWD’s closing price of $44.00 on 7/28/2021. (2) Based on reported net income for the LTM period ended 6/30/2021. 7July 29, 2021 Transaction Terms (1) Aggregate D eal Value§ $52.9 million § Each share of RYFL may elect to receive either 0.4609 shares of FNWD stock or $20.14 in cash Consideration Structure § Elections subject to proration such that 65% of RYFL shares will receive FNWD stock and 35% will receive cash (1) Consideration Mix§ Approximately 65% stock / 35% cash § Termination fee of $2.0 million, equal to 3.8% of the transaction value, will be paid to FNWD by RYFL under certain Termination Fee circumstances as set forth in the definitive merger agreement § Price / TBV: 1.15x (2) § Price / LTM EPS: 10.2x Pricing Ratios § Price / 2022 EPS + 100% Cost Savings: 5.6x § Core Deposit Premium: 2.3% § Royal Financial requires shareholder and regulatory approval Required Approvals § Finward Bancorp requires shareholder and regulatory approval § One current director or executive officer of Royal Financial, Inc. mutually agreed upon, shall be appointed to Finward Board Representation Bancorp’s Board of Directors Anticipated Closing§ Q1’22 (1) Based on FNWD’s closing price of $44.00 on 7/28/2021. (2) Based on reported net income for the LTM period ended 6/30/2021. 7

July 29, 2021 Transaction Details Earnings Estimates§ FNWD and RYFL earnings assumptions based on management projections § 42% of RYFL’s non-interest expense base with 75% realized in 2022 and 100% realized thereafter Cost Savings ‒ Validated through comprehensive due diligence § 0.97% of RYFL’s non-time deposits amortized over a 6.0 year period using the sum of years digits method Core D eposit Intangible § Pre-tax deal related charges of $7.7 million or 14.6% of aggregate deal value One-Time Charges (1) § Gross loan credit mark of $5.1 million or 1.10% of RYFL’s loan portfolio (equal to 133% of RYFL’s current reserves and 217% of non-performing assets) ‒ 40% of outstanding commercial loan balances and 75% of criticized and classified loans were reviewed Purchase Accounting § Loan interest rate mark of $0.7 million accreted straight-line over a 4.0 year period Adjustments § AOCI after-tax gain of $0.8 million amortized using the straight-line method over 3.5 years § $0.9 million interest rate mark on time deposits accreted over a 1.8 year period using the straight-line method § $2.0 million fixed asset mark § TCE/TA: 8.6% § Tier 1 Leverage Ratio: 8.3% Pro Forma Capital Ratios at Closing § CET1 Capital Ratio: 12.2% § Total Risk Based Capital Ratio: 13.0% (1) RYFL’s loan portfolio includes $6.6 million of Paycheck Protection Program loans. 8July 29, 2021 Transaction Details Earnings Estimates§ FNWD and RYFL earnings assumptions based on management projections § 42% of RYFL’s non-interest expense base with 75% realized in 2022 and 100% realized thereafter Cost Savings ‒ Validated through comprehensive due diligence § 0.97% of RYFL’s non-time deposits amortized over a 6.0 year period using the sum of years digits method Core D eposit Intangible § Pre-tax deal related charges of $7.7 million or 14.6% of aggregate deal value One-Time Charges (1) § Gross loan credit mark of $5.1 million or 1.10% of RYFL’s loan portfolio (equal to 133% of RYFL’s current reserves and 217% of non-performing assets) ‒ 40% of outstanding commercial loan balances and 75% of criticized and classified loans were reviewed Purchase Accounting § Loan interest rate mark of $0.7 million accreted straight-line over a 4.0 year period Adjustments § AOCI after-tax gain of $0.8 million amortized using the straight-line method over 3.5 years § $0.9 million interest rate mark on time deposits accreted over a 1.8 year period using the straight-line method § $2.0 million fixed asset mark § TCE/TA: 8.6% § Tier 1 Leverage Ratio: 8.3% Pro Forma Capital Ratios at Closing § CET1 Capital Ratio: 12.2% § Total Risk Based Capital Ratio: 13.0% (1) RYFL’s loan portfolio includes $6.6 million of Paycheck Protection Program loans. 8

July 29, 2021 Disciplined and Experienced Acquiror First Federal Savings Liberty Savings & Loan Association of Bank, FSB Hammond Transaction Closed Closed Closed Closed Announced April 2014 July 2015 January 2019 July 2021 July 2018 D ate Transaction (1) (1) $16M $34M $53M Value (2) $38M $57M $146M $179M $533M Assets ($M) 5% 7% 15% 16% 33% As a % of FNWD Assets Loans $29M $28M $95M $88M $464M (2) ($M) D eposits $37M $56M $125M $144M $466M (2) ($M) # of 2 3 3 3 9 Branches Source: S&P Global Market Intelligence. (1) First Federal Savings & Loan Association of Hammond and Liberty Savings Bank, FSB transactions were voluntary supervisory conversions; FNWD did not pay any consideration as part of the transactions. (2) Based on reported acquired amounts per Company’s Audits and 10-K filings. 9July 29, 2021 Disciplined and Experienced Acquiror First Federal Savings Liberty Savings & Loan Association of Bank, FSB Hammond Transaction Closed Closed Closed Closed Announced April 2014 July 2015 January 2019 July 2021 July 2018 D ate Transaction (1) (1) $16M $34M $53M Value (2) $38M $57M $146M $179M $533M Assets ($M) 5% 7% 15% 16% 33% As a % of FNWD Assets Loans $29M $28M $95M $88M $464M (2) ($M) D eposits $37M $56M $125M $144M $466M (2) ($M) # of 2 3 3 3 9 Branches Source: S&P Global Market Intelligence. (1) First Federal Savings & Loan Association of Hammond and Liberty Savings Bank, FSB transactions were voluntary supervisory conversions; FNWD did not pay any consideration as part of the transactions. (2) Based on reported acquired amounts per Company’s Audits and 10-K filings. 9

July 29, 2021 Pro Forma Loan & Deposit Portfolio FNWD RYFL Pro Forma FNWD RYF L Pro Forma 8.6% 0.2% 10.7% 10.0% 3.2% 4.7% 1.9% 10.9% 15.2% 29.4% 27.7% 31.9% 40.6% 13.3% $971M $464M $1,435M 5.5% 3.8% 19.1% 17.0% 2.6% 12.4% 13.3% 0.3% 11.1% 6.5% Construction & Land Residential Mortgage Construction & Land Residential Mortgage Construction & Land Residential Mortgage Home Equity Owner-Occupied CRE Home Equity Owner-Occupied CRE Home Equity Owner-Occupied CRE Nonowner-Occupied CRE Multifamily Nonowner-Occupied CRE Multifamily Nonowner-Occupied CRE Multifamily C & I Consumer, Farm & Other C & I Consumer, Farm & Other C & I Consumer, Farm & Other MRQ Yield: 4.21% MRQ Yield: 4.18% MRQ Yield: 4.20% FNWD RYFL Pro Forma FNWD RYF L Pro Forma 19.4% 19.8% 18.4% 11.0% 16.6% 33.6% 9.1% $1,395M $466M $1,861M 9.0% 39.5% 54.9% 60.1% 8.5% Noninterest-bearing Deposits Noninterest-bearing Deposits Noninterest-bearing Deposits IB Demand, Savings & MMDA IB Demand, Savings & MMDA IB Demand, Savings & MMDA Retail Time Deposits Retail Time Deposits Retail Time Deposits Jumbo Time Deposits Jumbo Time Deposits Jumbo Time Deposits MRQ Cost: 0.16% MRQ Cost: 0.33% MRQ Cost: 0.20% Source: S&P Global Market Intelligence. Note: FNWD and RYFL loan data based on bank-level regulatory data and deposit data based on BHC-GAAP data as of 6/30/2021. 10 D eposits LoansJuly 29, 2021 Pro Forma Loan & Deposit Portfolio FNWD RYFL Pro Forma FNWD RYF L Pro Forma 8.6% 0.2% 10.7% 10.0% 3.2% 4.7% 1.9% 10.9% 15.2% 29.4% 27.7% 31.9% 40.6% 13.3% $971M $464M $1,435M 5.5% 3.8% 19.1% 17.0% 2.6% 12.4% 13.3% 0.3% 11.1% 6.5% Construction & Land Residential Mortgage Construction & Land Residential Mortgage Construction & Land Residential Mortgage Home Equity Owner-Occupied CRE Home Equity Owner-Occupied CRE Home Equity Owner-Occupied CRE Nonowner-Occupied CRE Multifamily Nonowner-Occupied CRE Multifamily Nonowner-Occupied CRE Multifamily C & I Consumer, Farm & Other C & I Consumer, Farm & Other C & I Consumer, Farm & Other MRQ Yield: 4.21% MRQ Yield: 4.18% MRQ Yield: 4.20% FNWD RYFL Pro Forma FNWD RYF L Pro Forma 19.4% 19.8% 18.4% 11.0% 16.6% 33.6% 9.1% $1,395M $466M $1,861M 9.0% 39.5% 54.9% 60.1% 8.5% Noninterest-bearing Deposits Noninterest-bearing Deposits Noninterest-bearing Deposits IB Demand, Savings & MMDA IB Demand, Savings & MMDA IB Demand, Savings & MMDA Retail Time Deposits Retail Time Deposits Retail Time Deposits Jumbo Time Deposits Jumbo Time Deposits Jumbo Time Deposits MRQ Cost: 0.16% MRQ Cost: 0.33% MRQ Cost: 0.20% Source: S&P Global Market Intelligence. Note: FNWD and RYFL loan data based on bank-level regulatory data and deposit data based on BHC-GAAP data as of 6/30/2021. 10 D eposits Loans