Attached files
| file | filename |
|---|---|
| 8-K - 8-K - Custom Truck One Source, Inc. | nsco-20210729.htm |
| EX-99.1 - EX-99.1 - Custom Truck One Source, Inc. | customtrucklp-03312021repo.htm |
1 Custom Truck One Source Investor Presentation Q1 2021 Financial Summary July 2021 CONFIDENTIAL DRAFT
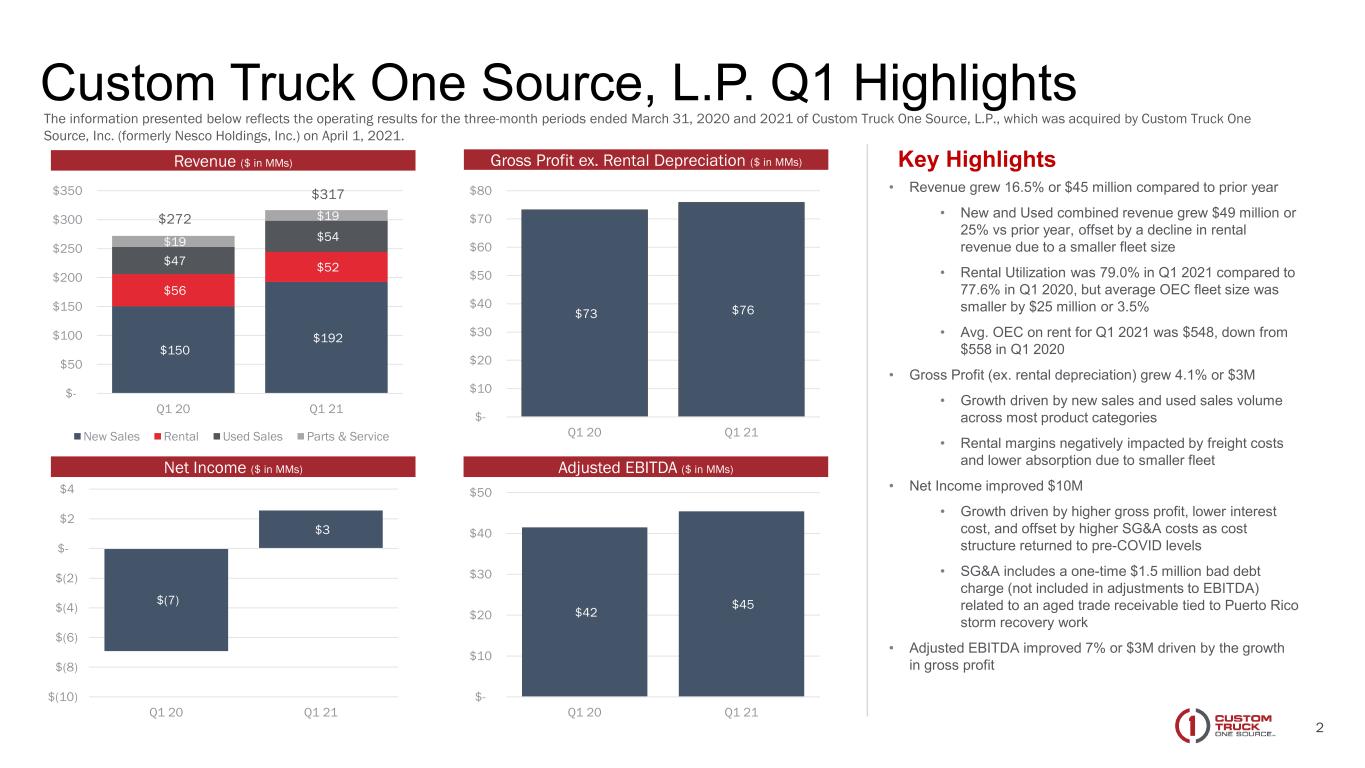
2 Custom Truck One Source, L.P. Q1 Highlights Key Highlights • Revenue grew 16.5% or $45 million compared to prior year • New and Used combined revenue grew $49 million or 25% vs prior year, offset by a decline in rental revenue due to a smaller fleet size • Rental Utilization was 79.0% in Q1 2021 compared to 77.6% in Q1 2020, but average OEC fleet size was smaller by $25 million or 3.5% • Avg. OEC on rent for Q1 2021 was $548, down from $558 in Q1 2020 • Gross Profit (ex. rental depreciation) grew 4.1% or $3M • Growth driven by new sales and used sales volume across most product categories • Rental margins negatively impacted by freight costs and lower absorption due to smaller fleet • Net Income improved $10M • Growth driven by higher gross profit, lower interest cost, and offset by higher SG&A costs as cost structure returned to pre-COVID levels • SG&A includes a one-time $1.5 million bad debt charge (not included in adjustments to EBITDA) related to an aged trade receivable tied to Puerto Rico storm recovery work • Adjusted EBITDA improved 7% or $3M driven by the growth in gross profit $150 $192 $56 $52 $47 $54 $19 $19 $- $50 $100 $150 $200 $250 $300 $350 Q1 20 Q1 21 New Sales Rental Used Sales Parts & Service $73 $76 $- $10 $20 $30 $40 $50 $60 $70 $80 Q1 20 Q1 21 $42 $45 $- $10 $20 $30 $40 $50 Q1 20 Q1 21 $272 $317 $(7) $3 $(10) $(8) $(6) $(4) $(2) $- $2 $4 Q1 20 Q1 21 Revenue ($ in MMs) Gross Profit ex. Rental Depreciation ($ in MMs) Net Income ($ in MMs) Adjusted EBITDA ($ in MMs) The information presented below reflects the operating results for the three-month periods ended March 31, 2020 and 2021 of Custom Truck One Source, L.P., which was acquired by Custom Truck One Source, Inc. (formerly Nesco Holdings, Inc.) on April 1, 2021.
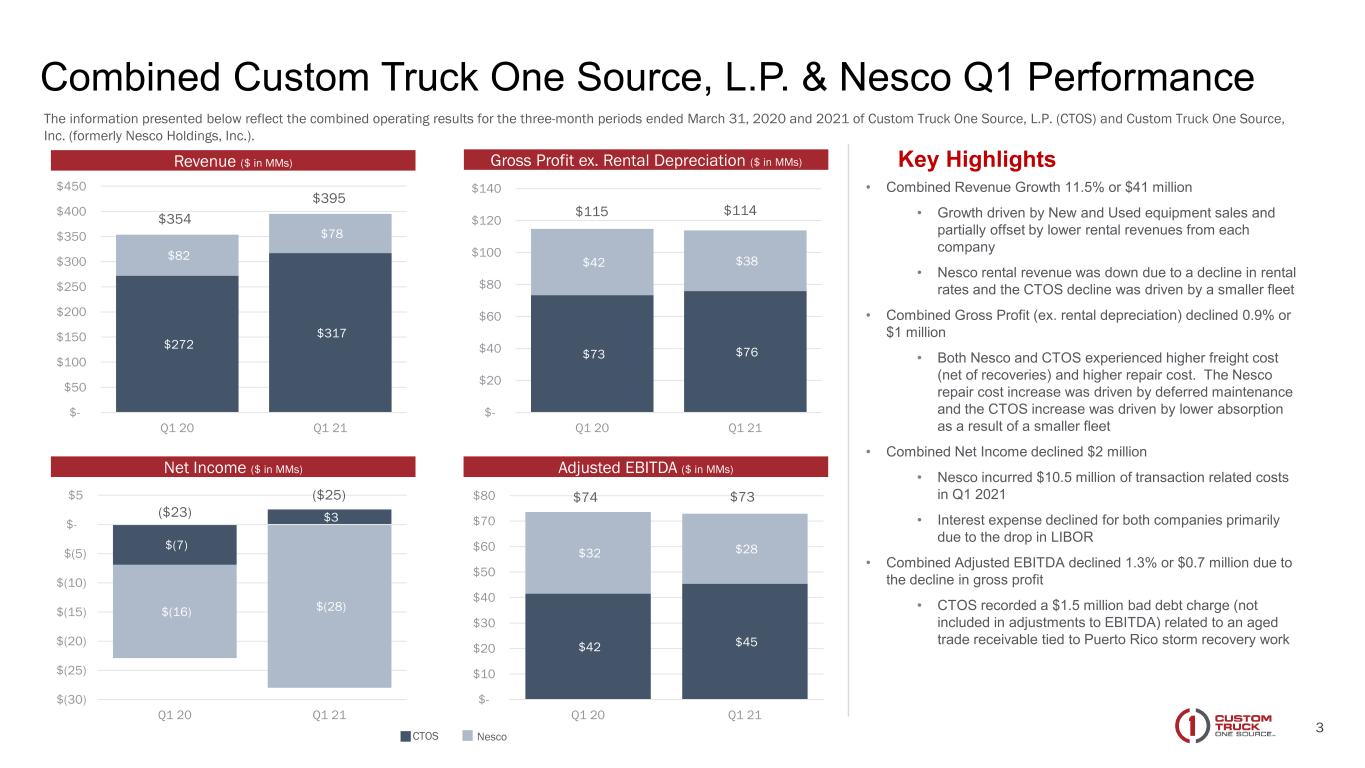
3 Combined Custom Truck One Source, L.P. & Nesco Q1 Performance Key Highlights • Combined Revenue Growth 11.5% or $41 million • Growth driven by New and Used equipment sales and partially offset by lower rental revenues from each company • Nesco rental revenue was down due to a decline in rental rates and the CTOS decline was driven by a smaller fleet • Combined Gross Profit (ex. rental depreciation) declined 0.9% or $1 million • Both Nesco and CTOS experienced higher freight cost (net of recoveries) and higher repair cost. The Nesco repair cost increase was driven by deferred maintenance and the CTOS increase was driven by lower absorption as a result of a smaller fleet • Combined Net Income declined $2 million • Nesco incurred $10.5 million of transaction related costs in Q1 2021 • Interest expense declined for both companies primarily due to the drop in LIBOR • Combined Adjusted EBITDA declined 1.3% or $0.7 million due to the decline in gross profit • CTOS recorded a $1.5 million bad debt charge (not included in adjustments to EBITDA) related to an aged trade receivable tied to Puerto Rico storm recovery work Revenue ($ in MMs) Gross Profit ex. Rental Depreciation ($ in MMs) Net Income ($ in MMs) Adjusted EBITDA ($ in MMs) $272 $317 $82 $78 $- $50 $100 $150 $200 $250 $300 $350 $400 $450 Q1 20 Q1 21 $42 $45 $32 $28 $- $10 $20 $30 $40 $50 $60 $70 $80 Q1 20 Q1 21 $(7) $3 $(16) $(28) $(30) $(25) $(20) $(15) $(10) $(5) $- $5 Q1 20 Q1 21 $73 $76 $42 $38 $- $20 $40 $60 $80 $100 $120 $140 Q1 20 Q1 21 NescoCTOS $354 $395 $115 $114 ($23) ($25) $74 $73 The information presented below reflect the combined operating results for the three-month periods ended March 31, 2020 and 2021 of Custom Truck One Source, L.P. (CTOS) and Custom Truck One Source, Inc. (formerly Nesco Holdings, Inc.).
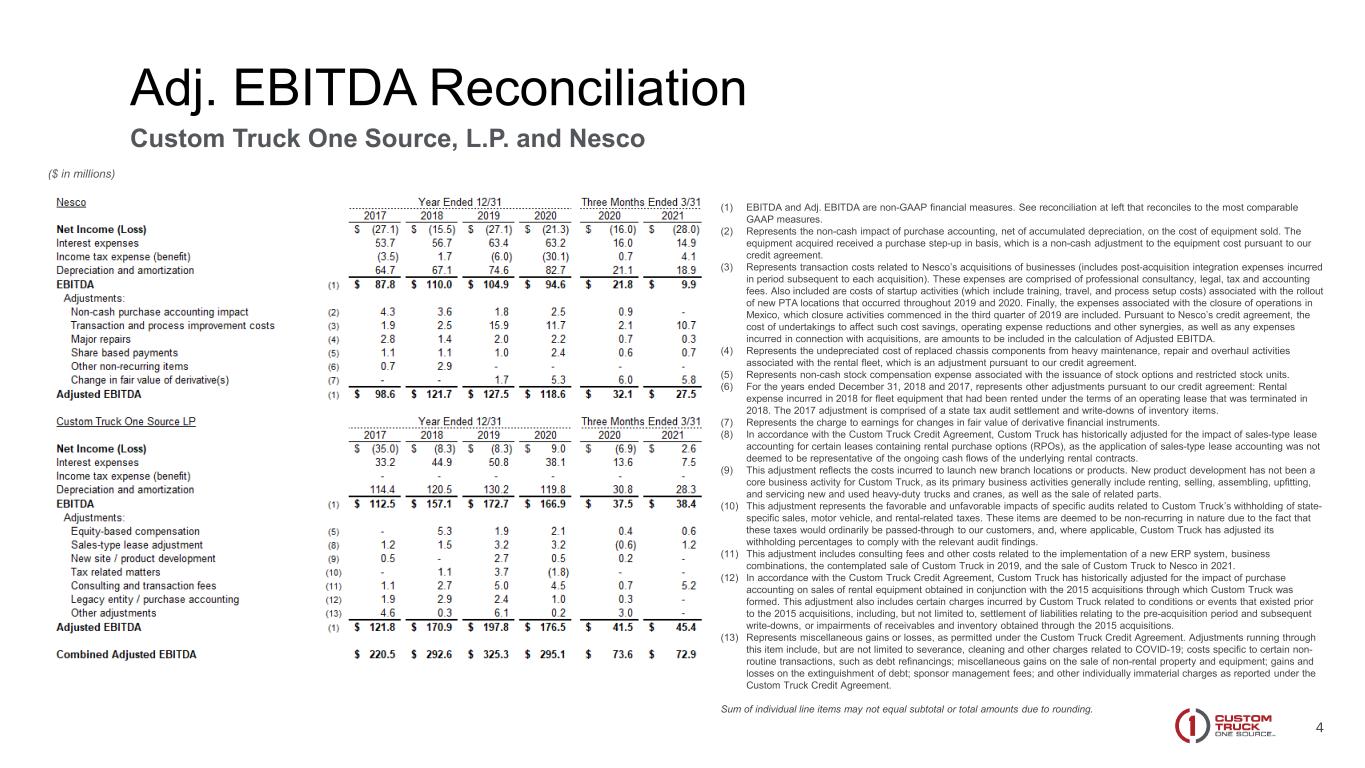
4 Adj. EBITDA Reconciliation Custom Truck One Source, L.P. and Nesco (1) EBITDA and Adj. EBITDA are non-GAAP financial measures. See reconciliation at left that reconciles to the most comparable GAAP measures. (2) Represents the non-cash impact of purchase accounting, net of accumulated depreciation, on the cost of equipment sold. The equipment acquired received a purchase step-up in basis, which is a non-cash adjustment to the equipment cost pursuant to our credit agreement. (3) Represents transaction costs related to Nesco’s acquisitions of businesses (includes post-acquisition integration expenses incurred in period subsequent to each acquisition). These expenses are comprised of professional consultancy, legal, tax and accounting fees. Also included are costs of startup activities (which include training, travel, and process setup costs) associated with the rollout of new PTA locations that occurred throughout 2019 and 2020. Finally, the expenses associated with the closure of operations in Mexico, which closure activities commenced in the third quarter of 2019 are included. Pursuant to Nesco’s credit agreement, the cost of undertakings to affect such cost savings, operating expense reductions and other synergies, as well as any expenses incurred in connection with acquisitions, are amounts to be included in the calculation of Adjusted EBITDA. (4) Represents the undepreciated cost of replaced chassis components from heavy maintenance, repair and overhaul activities associated with the rental fleet, which is an adjustment pursuant to our credit agreement. (5) Represents non-cash stock compensation expense associated with the issuance of stock options and restricted stock units. (6) For the years ended December 31, 2018 and 2017, represents other adjustments pursuant to our credit agreement: Rental expense incurred in 2018 for fleet equipment that had been rented under the terms of an operating lease that was terminated in 2018. The 2017 adjustment is comprised of a state tax audit settlement and write-downs of inventory items. (7) Represents the charge to earnings for changes in fair value of derivative financial instruments. (8) In accordance with the Custom Truck Credit Agreement, Custom Truck has historically adjusted for the impact of sales-type lease accounting for certain leases containing rental purchase options (RPOs), as the application of sales-type lease accounting was not deemed to be representative of the ongoing cash flows of the underlying rental contracts. (9) This adjustment reflects the costs incurred to launch new branch locations or products. New product development has not been a core business activity for Custom Truck, as its primary business activities generally include renting, selling, assembling, upfitting, and servicing new and used heavy-duty trucks and cranes, as well as the sale of related parts. (10) This adjustment represents the favorable and unfavorable impacts of specific audits related to Custom Truck’s withholding of state- specific sales, motor vehicle, and rental-related taxes. These items are deemed to be non-recurring in nature due to the fact that these taxes would ordinarily be passed-through to our customers, and, where applicable, Custom Truck has adjusted its withholding percentages to comply with the relevant audit findings. (11) This adjustment includes consulting fees and other costs related to the implementation of a new ERP system, business combinations, the contemplated sale of Custom Truck in 2019, and the sale of Custom Truck to Nesco in 2021. (12) In accordance with the Custom Truck Credit Agreement, Custom Truck has historically adjusted for the impact of purchase accounting on sales of rental equipment obtained in conjunction with the 2015 acquisitions through which Custom Truck was formed. This adjustment also includes certain charges incurred by Custom Truck related to conditions or events that existed prior to the 2015 acquisitions, including, but not limited to, settlement of liabilities relating to the pre-acquisition period and subsequent write-downs, or impairments of receivables and inventory obtained through the 2015 acquisitions. (13) Represents miscellaneous gains or losses, as permitted under the Custom Truck Credit Agreement. Adjustments running through this item include, but are not limited to severance, cleaning and other charges related to COVID-19; costs specific to certain non- routine transactions, such as debt refinancings; miscellaneous gains on the sale of non-rental property and equipment; gains and losses on the extinguishment of debt; sponsor management fees; and other individually immaterial charges as reported under the Custom Truck Credit Agreement. Sum of individual line items may not equal subtotal or total amounts due to rounding. ($ in millions)
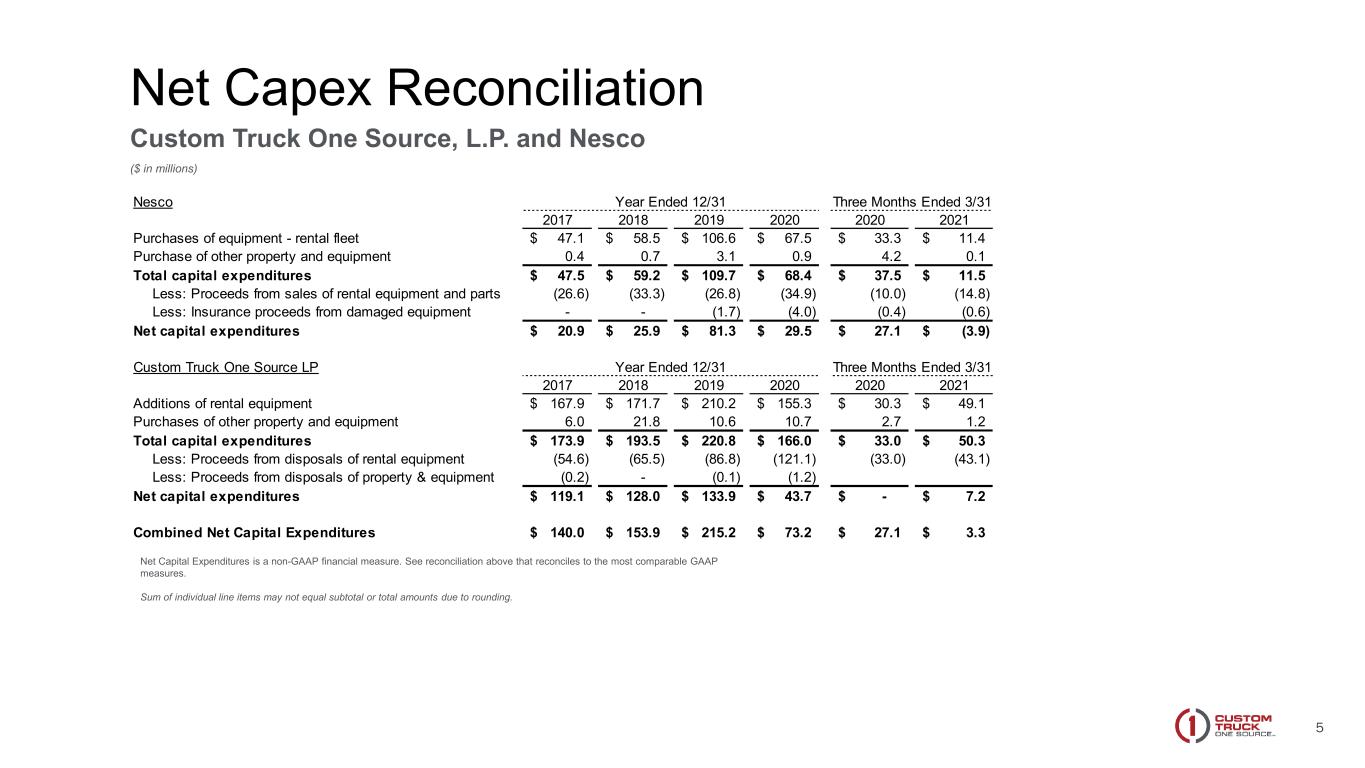
5 Net Capex Reconciliation Custom Truck One Source, L.P. and Nesco ($ in millions) Net Capital Expenditures is a non-GAAP financial measure. See reconciliation above that reconciles to the most comparable GAAP measures. Sum of individual line items may not equal subtotal or total amounts due to rounding. Nesco Year Ended 12/31 Three Months Ended 3/31 2017 2018 2019 2020 2020 2021 Purchases of equipment - rental fleet 47.1$ 58.5$ 106.6$ 67.5$ 33.3$ 11.4$ Purchase of other property and equipment 0.4 0.7 3.1 0.9 4.2 0.1 Total capital expenditures 47.5$ 59.2$ 109.7$ 68.4$ 37.5$ 11.5$ Less: Proceeds from sales of rental equipment and parts (26.6) (33.3) (26.8) (34.9) (10.0) (14.8) Less: Insurance proceeds from damaged equipment - - (1.7) (4.0) (0.4) (0.6) Net capital expenditures 20.9$ 25.9$ 81.3$ 29.5$ 27.1$ (3.9)$ Custom Truck One Source LP Year Ended 12/31 Three Months Ended 3/31 2017 2018 2019 2020 2020 2021 Additions of rental equipment 167.9$ 171.7$ 210.2$ 155.3$ 30.3$ 49.1$ Purchases of other property and equipment 6.0 21.8 10.6 10.7 2.7 1.2 Total capital expenditures 173.9$ 193.5$ 220.8$ 166.0$ 33.0$ 50.3$ Less: Proceeds from disposals of rental equipment (54.6) (65.5) (86.8) (121.1) (33.0) (43.1) Less: Proceeds from disposals of property & equipment (0.2) - (0.1) (1.2) Net capital expenditures 119.1$ 128.0$ 133.9$ 43.7$ -$ 7.2$ Combined Net Capital Expenditures 140.0$ 153.9$ 215.2$ 73.2$ 27.1$ 3.3$
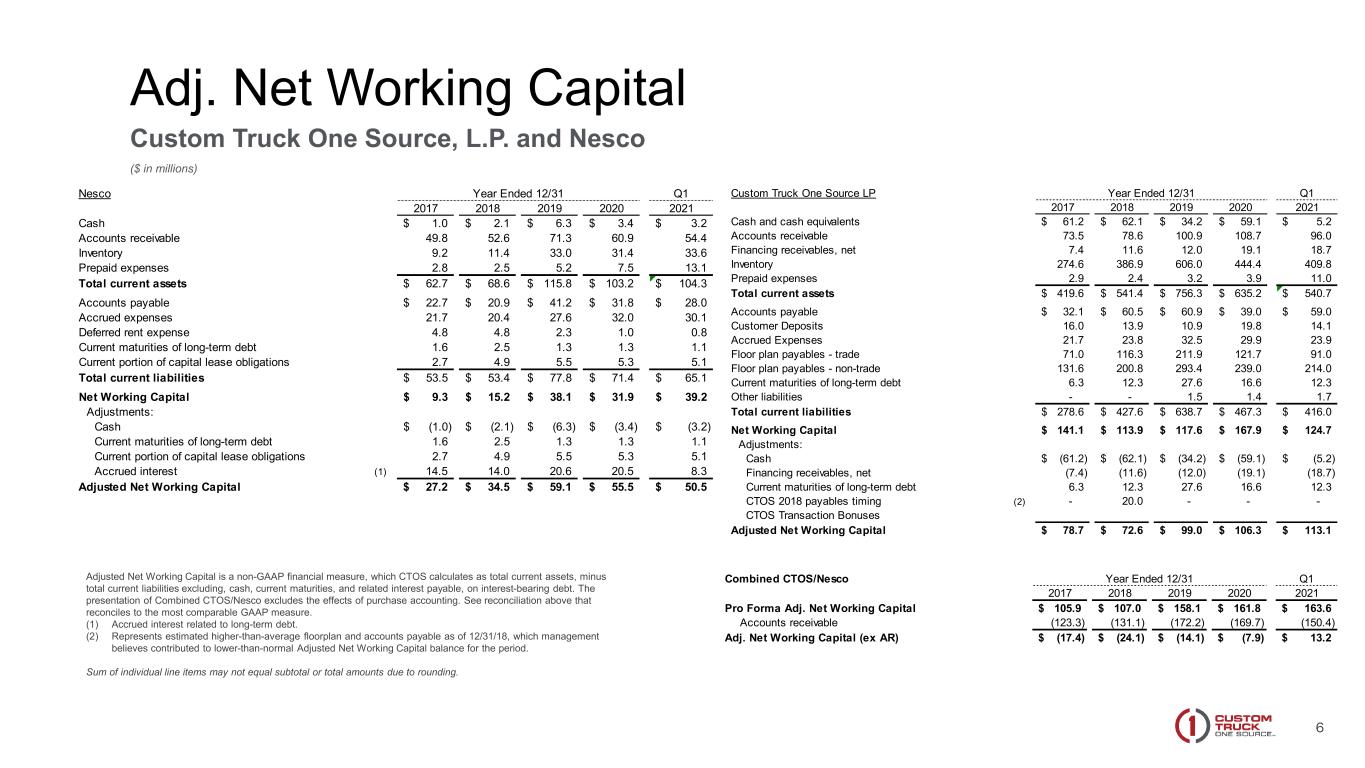
6 Adj. Net Working Capital Custom Truck One Source, L.P. and Nesco ($ in millions) Adjusted Net Working Capital is a non-GAAP financial measure, which CTOS calculates as total current assets, minus total current liabilities excluding, cash, current maturities, and related interest payable, on interest-bearing debt. The presentation of Combined CTOS/Nesco excludes the effects of purchase accounting. See reconciliation above that reconciles to the most comparable GAAP measure. (1) Accrued interest related to long-term debt. (2) Represents estimated higher-than-average floorplan and accounts payable as of 12/31/18, which management believes contributed to lower-than-normal Adjusted Net Working Capital balance for the period. Sum of individual line items may not equal subtotal or total amounts due to rounding. Nesco Year Ended 12/31 Q1 2017 2018 2019 2020 2021 Cash 1.0$ 2.1$ 6.3$ 3.4$ 3.2$ Accounts receivable 49.8 52.6 71.3 60.9 54.4 Inventory 9.2 11.4 33.0 31.4 33.6 Prepaid expenses 2.8 2.5 5.2 7.5 13.1 Total current assets 62.7$ 68.6$ 115.8$ 103.2$ 104.3$ Accounts payable 22.7$ 20.9$ 41.2$ 31.8$ 28.0$ Accrued expenses 21.7 20.4 27.6 32.0 30.1 Deferred rent expense 4.8 4.8 2.3 1.0 0.8 Current maturities of long-term debt 1.6 2.5 1.3 1.3 1.1 Current portion of capital lease obligations 2.7 4.9 5.5 5.3 5.1 Total current liabilities 53.5$ 53.4$ 77.8$ 71.4$ 65.1$ Net Working Capital 9.3$ 15.2$ 38.1$ 31.9$ 39.2$ Adjustments: Cash (1.0)$ (2.1)$ (6.3)$ (3.4)$ (3.2)$ Current maturities of long-term debt 1.6 2.5 1.3 1.3 1.1 Current portion of capital lease obligations 2.7 4.9 5.5 5.3 5.1 Accrued interest (1) 14.5 14.0 20.6 20.5 8.3 Adjusted Net Working Capital 27.2$ 34.5$ 59.1$ 55.5$ 50.5$ Custom Truck One Source LP Year Ended 12/31 Q1 2017 2018 2019 2020 2021 Cash and cash equivalents 61.2$ 62.1$ 34.2$ 59.1$ 5.2$ Accounts receivable 73.5 78.6 100.9 108.7 96.0 Financing receivables, net 7.4 11.6 12.0 19.1 18.7 Inventory 274.6 386.9 606.0 444.4 409.8 Prepaid expenses 2.9 2.4 3.2 3.9 11.0 Total current assets 419.6$ 541.4$ 756.3$ 635.2$ 540.7$ Accounts payable 32.1$ 60.5$ 60.9$ 39.0$ 59.0$ Customer Deposits 16.0 13.9 10.9 19.8 14.1 Accrued Expenses 21.7 23.8 32.5 29.9 23.9 Floor plan payables - trade 71.0 116.3 211.9 121.7 91.0 Floor plan payables - non-trade 131.6 200.8 293.4 239.0 214.0 Current maturities of long-term debt 6.3 12.3 27.6 16.6 12.3 Other liabilities - - 1.5 1.4 1.7 Total current liabilities 278.6$ 427.6$ 638.7$ 467.3$ 416.0$ Net Working Capital 141.1$ 113.9$ 117.6$ 167.9$ 124.7$ Adjustments: Cash (61.2)$ (62.1)$ (34.2)$ (59.1)$ (5.2)$ Financing receivables, net (7.4) (11.6) (12.0) (19.1) (18.7) Current maturities of long-term debt 6.3 12.3 27.6 16.6 12.3 CTOS 2018 payables timing (2) - 20.0 - - - CTOS Transaction Bonuses Adjusted Net Working Capital 78.7$ 72.6$ 99.0$ 106.3$ 113.1$ Combined CTOS/Nesco Year Ended 12/31 Q1 2017 2018 2019 2020 2021 Pro Forma Adj. Net Working Capital 105.9$ 107.0$ 158.1$ 161.8$ 163.6$ Accounts receivable (123.3) (131.1) (172.2) (169.7) (150.4) Adj. Net Working Capital (ex AR) (17.4)$ (24.1)$ (14.1)$ (7.9)$ 13.2$
