Attached files
| file | filename |
|---|---|
| 8-K - 8-K - CITRIX SYSTEMS INC | d108726d8k.htm |
Exhibit 99.1
2021 | Q2 Financials July 29, 2021 To Our Stakeholders Our second quarter results reflect continued positive momentum in our business model transition with accelerating SaaS ARR, strong growth in Citrix Cloud Paid Subscribers1 and a higher-than-expected mix of SaaS bookings as a percentage of total subscription bookings2. Reported revenue, however, reflects the challenge associated with transitioning the business to SaaS and the need to evolve our sales strategy to deliver more predictable results. Key takeaways include: SaaS ARR of more than $1B, up 74% year-over-year. Excluding Wrike, second quarter SaaS ARR accelerated for the third consecutive quarter to $868 million, up 47% year-over-year. The number of Citrix Cloud Paid Subscribers increased 52% year-over-year, to 11.4 million with growth accelerating from 34% year-over-year in Q1 2021. Total ARR3, which captures the value of all subscription sources as well as perpetual license maintenance contracts, was more than $3B and grew 19% year-over-year, and 13% year-over-year excluding Wrike, in line with expectations provided during Q1 2021 earnings. SaaS mix of subscription bookings was 63%, compared to guidance of 50-55%. Significant changes to be made to our sales organization, processes, and our go-to-market priorities—to enhance customers moving to SaaS at a faster pace, while delivering more consistent results. Reported revenue, including Wrike, was $812 million. GAAP diluted EPS was $0.50, and non-GAAP diluted EPS4 was $1.24. Board of Directors declared a quarterly dividend of $0.37 per share to be paid on September 24, 2021, to shareholders of record on September 10, 2021. 1 For definition of Citrix Cloud Paid Subscribers, see footnote 5 below. 2 SaaS bookings as a percentage of subscription bookings is an operating metric that Is calculated by dividing the SaaS bookings annualized contract value (“ACV”) by total subscription bookings ACV. We define ACV as the total value of a contract divided by the term of the contract (in days), multiplied by 365. A booking is defined as the full monetary value sold to a customer for product or services in a given period. If the term of the contract is less than a year, then the booking is equal to the total contract value. 3 For definitions of Total ARR, Subscription ARR, Maintenance ARR and SaaS ARR, see footnote 6 below. 4 A reconciliation of GAAP to non-GAAP measures has been provided in the financial statement tables included in this letter. An explanation of these measures is also included below under the heading “Reconciliation of Non-GAAP Financial Measures to Comparable U.S. GAAP Measures.” 2021 Q2 Financials 1
Looking ahead, we believe that the operational and organizational changes we are making in the business will enable us to increasingly capitalize on the secular trends of distributed teams and the heightened importance of securely delivering a unified work experience. Over time, we believe that transitioning our customers to SaaS will result in greater predictability in and faster growth of our reported results. Context for Second Quarter Results and 2021 Outlook While I am pleased with our strong SaaS metrics and the positive indicators of our business model transition, our overall performance in the second quarter was mixed. After a slower-than-expected pace of transitioning our installed base to the cloud during the onset of the Customer Highlight: Simplifying pandemic, the transition has since gained momentum and is now M&A integration with Citrix progressing well. A faster pace of moving to the cloud is a net positive for the long-term success of Citrix; however, we have not delivered on Phoenix Group is the UK’s largest our overall expected recognized revenue this year. I want to explain long-term savings and retirement the challenges we identified in reviewing the quarter and how we are business, managing over $300 responding. billion in assets. With the help of Citrix solutions, Phoenix Group As context, the three primary goals of the company’s transformation accelerated their migration to are to: Citrix desktop service on Azure while simplifying the integration 1. Build the most complete and integrated cloud-based Workspace of newly acquired businesses. platform to support customers deploying secure, distributed work; Citrix Workspace with Analytics 2. Migrate our installed base to Citrix Cloud services, making it easier for Security and Performance for customers to adopt additional Workspace technologies—powered by Citrix Cloud services creating additional customer value while modernizing their IT enabled Phoenix Group to easily infrastructure; and and securely deliver hybrid work to their expanding workforce. 3. Transition new business bookings from on-premises licenses to SaaS subscriptions. First, we have made significant improvements in our products, leveraging our market leading Workspace and Application Delivery and Security solutions. We have over a dozen active SaaS services, supporting more than 11 million subscribers. Importantly, this has given us a platform to build distinct go-to-market motions with cloud partners that share a common vision for the future of work. There is still work to be done, but we are encouraged with the progress to date. Second, the migration of our Workspace installed base has meaningfully accelerated over the last nine months. Year-to-date, we have migrated users at a pace more than 2x that of the first half of 2020. Customers are accessing new innovations while realizing lower costs on their cloud infrastructure by leveraging Citrix along with the cloud platform of their choice. Looking forward, we expect the pace of migration to remain substantial and we are designing an updated sales strategy to support customers as they shift to the cloud. However, on the third goal, we have not delivered new SaaS subscription bookings at the rate or predictability we had anticipated. We believe our recent performance primarily is the result of three factors. First, unexpected sales process complexity in effectively supporting multiple, simultaneous selling motions for Workspace cloud and on-premises solutions, created bookings mix uncertainty. Second, we are behind our capacity plan for direct quota carriers, limiting capacity. Last, given our direct selling motions, we have lacked focus in driving transactional volume through the channel. 2021 Q2 Financials 2
Following the quarter, we started taking several significant and immediate actions to address these challenges while also embracing the faster pace at which customers are transitioning to the cloud: Reorganizing sales team: We are reorganizing our sales leadership, realigning our customer-facing organization, and enhancing our focus on indirect channels, new product adoption and SaaS migration Increasing direct quota carriers: We will focus on reallocating resources and efforts to increase our capacity of quota carrying sales representatives to better support our longer-term growth Channel leverage: We are re-aligning channel incentives to focus on landing and growing new business activities Prioritizing SaaS: While our hybrid and on-premise technologies will continue to be an important differentiator for our product strategy, we are embracing the faster pace of cloud adoption and sales strategies to support this move We believe that the actions we are taking today will address the key challenges that have impacted our ability to consistently deliver on our expected growth. However, these actions are significant and may cause short-term disruption before yielding tangible results. Prior to a percentage of subscription these changes, we guided SaaS as Customer Highlight: Post bookings to be between 50-60% for this year. We now expect this pandemic work strategy powered range to increase to 60-70%, further impacting revenue as more is by Citrix recognized ratably vs. up-front. InfoCision Management Corporation is a direct marketing Given the above changes combined with our first half results, we are solutions provider, focused on updating our full year 2021 guidance and plan to reset our longer-term leveraging contact center agents model. More details are provided in the Guidance section of this to market through strong earnings letter and we expect to share additional granularity regarding audience, high quality calls, and a our long-term model, our go-to-market changes and other key strong employee experience. strategic and operational initiatives when we conduct our Financial With a rapidly growing customer Analyst Meeting this October. base and a shortage of local talent, InfoCision had to ARR – Measuring the Transition and Underlying Health of reimagine their business the Business structure. The management capabilities of Citrix Cloud As we progress through this transition, we continue to believe that Services coupled with Citrix SaaS ARR is the best way to measure the progress we are making in Virtual Apps and Desktops transitioning our business to the cloud. With year-over-year growth enabled InfoCision to quickly accelerating for the third consecutive quarter, both inclusive and shift their employees to working remotely – expanding their talent exclusive of Wrike since the close of the acquisition, strong SaaS ARR pool nationwide while growth demonstrates our focus on transitioning our installed base. significantly reducing real estate Looking ahead, we are further prioritizing SaaS ARR growth and de-costs. emphasizing subscription ARR, consistent with our plans to reduce the distraction and execution challenges associated with Workspace on-premises term subscriptions. We believe Total ARR is the most inclusive way to measure the underlying health of the business. Wrike Update We are pleased to report that the integration is progressing well, and the business continues to perform with accelerating growth, as expected. In the second quarter, which was the first full quarter of contributions since the closing of the transaction on February 26, 2021, Wrike contributed $27 million to revenue, after purchase accounting adjustments, and $160 million to SaaS ARR. We continue to believe Wrike, and our other work solutions, expands our strategic opportunities and will further accelerate our sustainable growth by supporting the needs of increasingly distributed teams. 2021 Q2 Financials 3
Financial Analyst Meeting In conjunction with our third quarter 2021 earnings report, we will provide a more comprehensive discussion of our strategy, business model transition and longer-term model. We look forward to providing more insight into our product strategy, go-to-market alignment, value to customers, and our financial and operational goals and paths to achieving our longer-term objectives. David Henshall President & CEO 2021 Q2 Financials 4
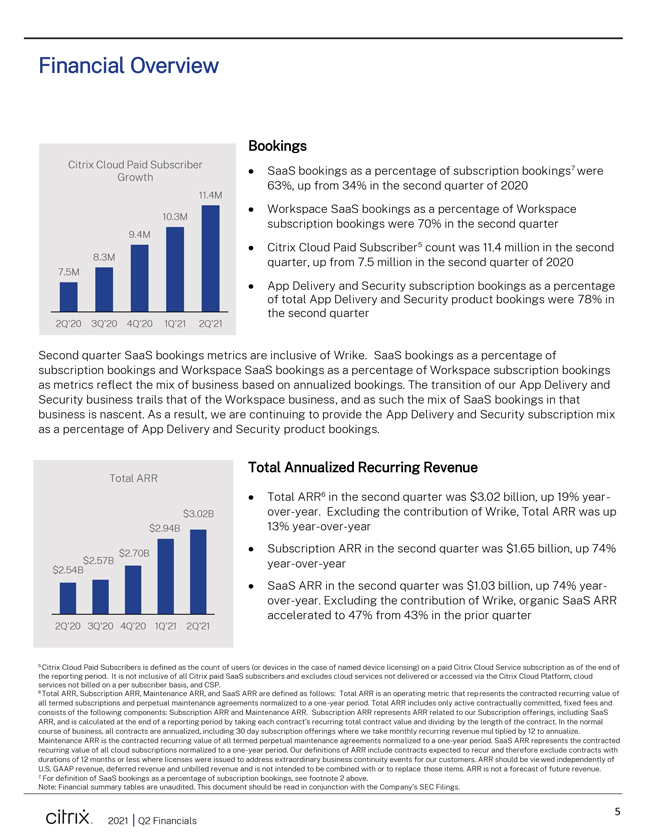
Financial Overview Bookings Citrix Cloud Paid Subscriber ï,· 7 SaaS bookings as a percentage of subscription bookings were Growth 11.4M 63%, up from 34% in the second quarter of 2020 ï,· Workspace SaaS bookings as a percentage of Workspace 10.3M subscription bookings were 70% in the second quarter 9.4M ï,· Citrix Cloud Paid Subscriber5 count was 11.4 million in the second 8.3M quarter, up from 7.5 million in the second quarter of 2020 7.5M ï,· App Delivery and Security subscription bookings as a percentage of total App Delivery and Security product bookings were 78% in the second quarter 2Q’20 3Q’20 4Q’20 1Q’21 2Q’21 Second quarter SaaS bookings metrics are inclusive of Wrike. SaaS bookings as a percentage of subscription bookings and Workspace SaaS bookings as a percentage of Workspace subscription bookings as metrics reflect the mix of business based on annualized bookings. The transition of our App Delivery and Security business trails that of the Workspace business, and as such the mix of SaaS bookings in that business is nascent. As a result, we are continuing to provide the App Delivery and Security subscription mix as a percentage of App Delivery and Security product bookings. Total Annualized Recurring Revenue Total ARR ï,· Total ARR6 in the second quarter was $3.02 billion, up 19% year$3.02B over-year. Excluding the contribution of Wrike, Total ARR was up $2.94B 13% year-over-year $2.70Bï,· Subscription ARR in the second quarter was $1.65 billion, up 74% $2.57B year-over-year $2.54B ï,· SaaS ARR in the second quarter was $1.03 billion, up 74% year-over-year. Excluding the contribution of Wrike, organic SaaS ARR accelerated to 47% from 43% in the prior quarter 2Q’20 3Q’20 4Q’20 1Q’21 2Q’21 5 Citrix Cloud Paid Subscribers is defined as the count of users (or devices in the case of named device licensing) on a paid Citrix Cloud Service subscription as of the end of the reporting period. It is not inclusive of all Citrix paid SaaS subscribers and excludes cloud services not delivered or accessed via the Citrix Cloud Platform, cloud services not billed on a per subscriber basis, and CSP. 6 Total ARR, Subscription ARR, Maintenance ARR, and SaaS ARR are defined as follows: Total ARR is an operating metric that represents the contracted recurring value of all termed subscriptions and perpetual maintenance agreements normalized to a one-year period. Total ARR includes only active contractually committed, fixed fees and consists of the following components: Subscription ARR and Maintenance ARR. Subscription ARR represents ARR related to our Subscription offerings, including SaaS ARR, and is calculated at the end of a reporting period by taking each contract’s recurring total contract value and dividing by the length of the contract. In the normal course of business, all contracts are annualized, including 30 day subscription offerings where we take monthly recurring revenue multiplied by 12 to annualize. Maintenance ARR is the contracted recurring value of all termed perpetual maintenance agreements normalized to a one-year period. SaaS ARR represents the contracted recurring value of all cloud subscriptions normalized to a one-year period. Our definitions of ARR include contracts expected to recur and therefore exclude contracts with durations of 12 months or less where licenses were issued to address extraordinary business continuity events for our customers. ARR should be vie wed independently of U.S. GAAP revenue, deferred revenue and unbilled revenue and is not intended to be combined with or to replace those items. ARR is not a forecast of future revenue. 7 For definition of SaaS bookings as a percentage of subscription bookings, see footnote 2 above. Note: Financial summary tables are unaudited. This document should be read in conjunction with the Company’s SEC Filings. 2021 Q2 Financials 5
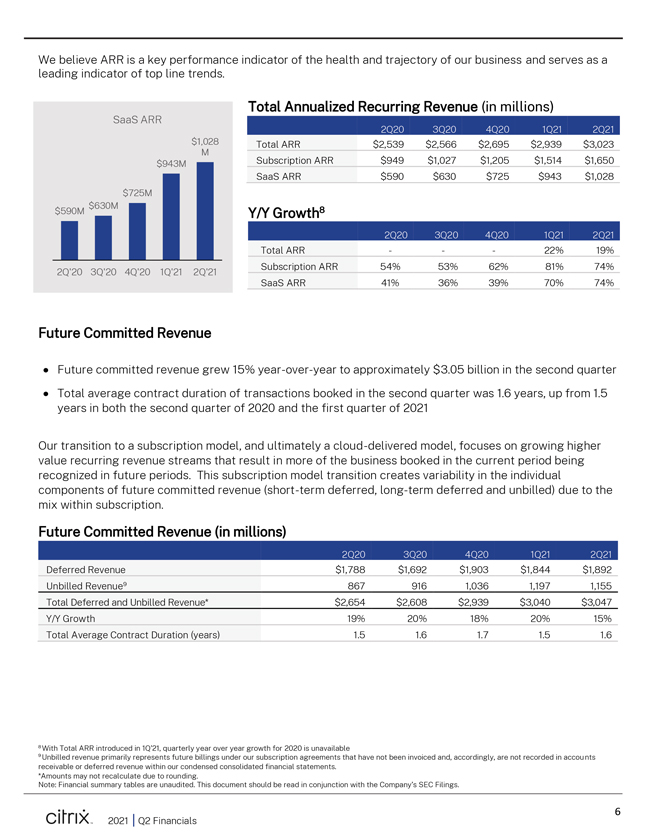
We believe ARR is a key performance indicator of the health and trajectory of our business and serves as a leading indicator of top line trends. Total Annualized Recurring Revenue (in millions) SaaS ARR 2Q20 3Q20 4Q20 1Q21 2Q21 $1,028 Total ARR $2,539 $2,566 $2,695 $2,939 $3,023 M $943M Subscription ARR $949 $1,027 $1,205 $1,514 $1,650 SaaS ARR $590 $630 $725 $943 $1,028 $725M $630M $590M Y/Y Growth8 2Q20 3Q20 4Q20 1Q21 2Q21 Total ARR ——22% 19% Subscription ARR 54% 53% 62% 81% 74% 2Q’20 3Q’20 4Q’20 1Q’21 2Q’21 SaaS ARR 41% 36% 39% 70% 74% Future Committed Revenue ï,· Future committed revenue grew 15% year-over-year to approximately $3.05 billion in the second quarter ï,· Total average contract duration of transactions booked in the second quarter was 1.6 years, up from 1.5 years in both the second quarter of 2020 and the first quarter of 2021 Our transition to a subscription model, and ultimately a cloud-delivered model, focuses on growing higher value recurring revenue streams that result in more of the business booked in the current period being recognized in future periods. This subscription model transition creates variability in the individual components of future committed revenue (short-term deferred, long-term deferred and unbilled) due to the mix within subscription. Future Committed Revenue (in millions) 2Q20 3Q20 4Q20 1Q21 2Q21 Deferred Revenue $1,788 $1,692 $1,903 $1,844 $1,892 Unbilled Revenue9 867 916 1,036 1,197 1,155 Total Deferred and Unbilled Revenue* $2,654 $2,608 $2,939 $3,040 $3,047 Y/Y Growth 19% 20% 18% 20% 15% Total Average Contract Duration (years) 1.5 1.6 1.7 1.5 1.6 8 With Total ARR introduced in 1Q’21, quarterly year over year growth for 2020 is unavailable 9 Unbilled revenue primarily represents future billings under our subscription agreements that have not been invoiced and, accordingly, are not recorded in accounts receivable or deferred revenue within our condensed consolidated financial statements. *Amounts may not recalculate due to rounding. Note: Financial summary tables are unaudited. This document should be read in conjunction with the Company’s SEC Filings. 2021 Q2 Financials 6
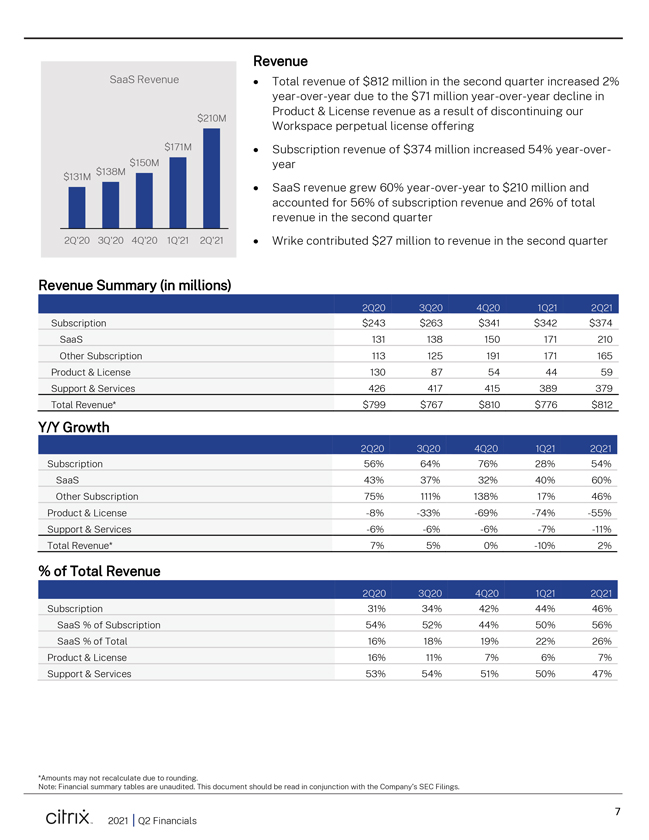
Revenue SaaS Revenueï,· Total revenue of $812 million in the second quarter increased 2% year-over-year due to the $71 million year-over-year decline in Product & License revenue as a result of discontinuing our $210M Workspace perpetual license offering $171Mï,· Subscription revenue of $374 million increased 54% year-over- $138M $150M year $131M ï,· SaaS revenue grew 60% year-over-year to $210 million and accounted for 56% of subscription revenue and 26% of total revenue in the second quarter 2Q’20 3Q’20 4Q’20 1Q’21 2Q’21ï,· Wrike contributed $27 million to revenue in the second quarter Revenue Summary (in millions) 2Q20 3Q20 4Q20 1Q21 2Q21 Subscription $243 $263 $341 $342 $374 SaaS 131 138 150 171 210 Other Subscription 113 125 191 171 165 Product & License 130 87 54 44 59 Support & Services 426 417 415 389 379 Total Revenue* $799 $767 $810 $776 $812 Y/Y Growth 2Q20 3Q20 4Q20 1Q21 2Q21 Subscription 56% 64% 76% 28% 54% SaaS 43% 37% 32% 40% 60% Other Subscription 75% 111% 138% 17% 46% Product & License -8% -33% -69% -74% -55% Support & Services -6% -6% -6% -7% -11% Total Revenue* 7% 5% 0% -10% 2% % of Total Revenue 2Q20 3Q20 4Q20 1Q21 2Q21 Subscription 31% 34% 42% 44% 46% SaaS % of Subscription 54% 52% 44% 50% 56% SaaS % of Total 16% 18% 19% 22% 26% Product & License 16% 11% 7% 6% 7% Support & Services 53% 54% 51% 50% 47% *Amounts may not recalculate due to rounding. Note: Financial summary tables are unaudited. This document should be read in conjunction with the Company’s SEC Filings. 2021 Q2 Financials 7
Revenue by Product Group Workspace ï,· Workspace revenue of $599 million in the second quarter increased 2% year-over-year ï,· Workspace subscription revenue in the second quarter accounted for 51% of total Workspace revenue, up from 34% a year ago ï,· Workspace revenue accounted for 74% of total revenue in the second quarter ï,· Wrike is included in Workspace revenue App Delivery and Security ï,· App Delivery and Security revenue of $186 million in the second quarter was flat year-over-year ï,· App Delivery and Security subscription revenue in the second quarter increased 66% year-over-year with App Delivery and Security software revenue accounting for 47% of total App Delivery and Security revenue ï,· App Delivery and Security revenue accounted for 23% of total revenue in the second quarter Over time, we expect the mix shift within App Delivery and Security away from hardware towards software-based solutions will create pressure on reported App Delivery and Security revenue as emerging architectures require fewer specialized hardware appliances. Professional services revenue is expected to continue to decline over time as more of the business moves towards subscription solutions. Revenue by Product Group (in millions) 2Q20 3Q20 4Q20 1Q21 2Q21 Workspace $585 $573 $591 $581 $599 App Delivery and Security 186 166 189 170 186 Professional Services 28 28 30 25 27 Total Revenue* $799 $767 $810 $776 $812 Y/Y Growth 2Q20 3Q20 4Q20 1Q21 2Q21 Workspace 9% 12% 5% -11% 2% App Delivery and Security 4% -12% -11% -6% 0% Professional Services -21% -13% -7% -9% -5% Total Revenue* 7% 5% 0% -10% 2% % of Total Revenue 2Q20 3Q20 4Q20 1Q21 2Q21 Workspace 73% 75% 73% 75% 74% App Delivery and Security 23% 22% 23% 22% 23% Professional Services 4% 4% 4% 3% 3% *Amounts may not recalculate due to rounding. Note: Financial summary tables are unaudited. This document should be read in conjunction with the Company’s SEC Filings. 2021 Q2 Financials 8
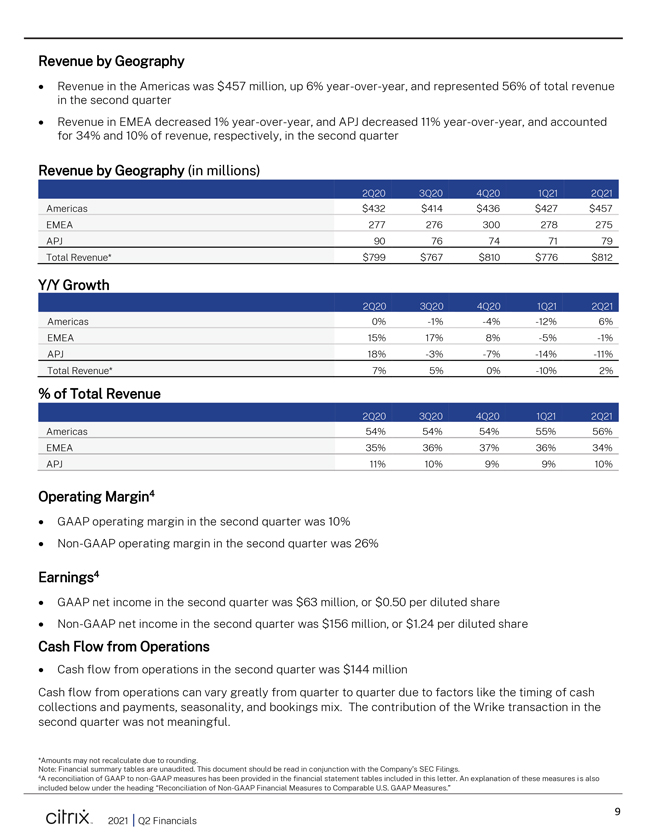
Revenue by Geography ï,· Revenue in the Americas was $457 million, up 6% year-over-year, and represented 56% of total revenue in the second quarter ï,· Revenue in EMEA decreased 1% year-over-year, and APJ decreased 11% year-over-year, and accounted for 34% and 10% of revenue, respectively, in the second quarter Revenue by Geography (in millions) 2Q20 3Q20 4Q20 1Q21 2Q21 Americas $432 $414 $436 $427 $457 EMEA 277 276 300 278 275 APJ 90 76 74 71 79 Total Revenue* $799 $767 $810 $776 $812 Y/Y Growth 2Q20 3Q20 4Q20 1Q21 2Q21 Americas 0% -1% -4% -12% 6% EMEA 15% 17% 8% -5% -1% APJ 18% -3% -7% -14% -11% Total Revenue* 7% 5% 0% -10% 2% % of Total Revenue 2Q20 3Q20 4Q20 1Q21 2Q21 Americas 54% 54% 54% 55% 56% EMEA 35% 36% 37% 36% 34% APJ 11% 10% 9% 9% 10% Operating Margin4 ï,· GAAP operating margin in the second quarter was 10% ï,· Non-GAAP operating margin in the second quarter was 26% Earnings4 ï,· GAAP net income in the second quarter was $63 million, or $0.50 per diluted share ï,· Non-GAAP net income in the second quarter was $156 million, or $1.24 per diluted share Cash Flow from Operations ï,· Cash flow from operations in the second quarter was $144 million Cash flow from operations can vary greatly from quarter to quarter due to factors like the timing of cash collections and payments, seasonality, and bookings mix. The contribution of the Wrike transaction in the second quarter was not meaningful. *Amounts may not recalculate due to rounding. Note: Financial summary tables are unaudited. This document should be read in conjunction with the Company’s SEC Filings. 4A reconciliation of GAAP to non-GAAP measures has been provided in the financial statement tables included in this letter. An explanation of these measures is also included below under the heading “Reconciliation of Non-GAAP Financial Measures to Comparable U.S. GAAP Measures.” 2021 Q2 Financials 9
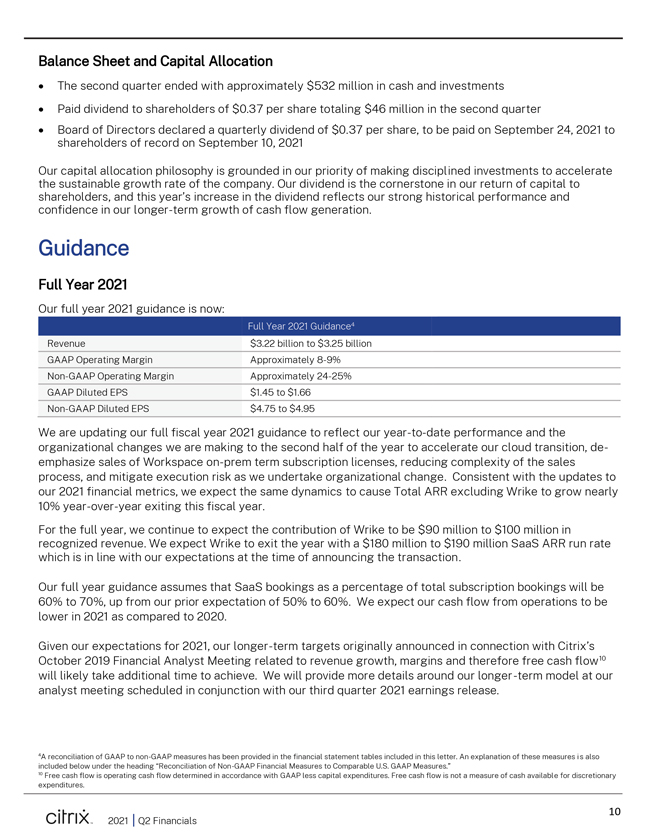
Balance Sheet and Capital Allocation ï,· The second quarter ended with approximately $532 million in cash and investments ï,· Paid dividend to shareholders of $0.37 per share totaling $46 million in the second quarter ï,· Board of Directors declared a quarterly dividend of $0.37 per share, to be paid on September 24, 2021 to shareholders of record on September 10, 2021 Our capital allocation philosophy is grounded in our priority of making disciplined investments to accelerate the sustainable growth rate of the company. Our dividend is the cornerstone in our return of capital to shareholders, and this year’s increase in the dividend reflects our strong historical performance and confidence in our longer-term growth of cash flow generation. Guidance Full Year 2021 Our full year 2021 guidance is now: Full Year 2021 Guidance4 Revenue $3.22 billion to $3.25 billion GAAP Operating Margin Approximately 8-9% Non-GAAP Operating Margin Approximately 24-25% GAAP Diluted EPS $1.45 to $1.66 Non-GAAP Diluted EPS $4.75 to $4.95 We are updating our full fiscal year 2021 guidance to reflect our year-to-date performance and the organizational changes we are making to the second half of the year to accelerate our cloud transition, deemphasize sales of Workspace on-prem term subscription licenses, reducing complexity of the sales process, and mitigate execution risk as we undertake organizational change. Consistent with the updates to our 2021 financial metrics, we expect the same dynamics to cause Total ARR excluding Wrike to grow nearly 10% year-over-year exiting this fiscal year. For the full year, we continue to expect the contribution of Wrike to be $90 million to $100 million in recognized revenue. We expect Wrike to exit the year with a $180 million to $190 million SaaS ARR run rate which is in line with our expectations at the time of announcing the transaction. Our full year guidance assumes that SaaS bookings as a percentage of total subscription bookings will be 60% to 70%, up from our prior expectation of 50% to 60%. We expect our cash flow from operations to be lower in 2021 as compared to 2020. Given our expectations for 2021, our longer-term targets originally announced in connection with Citrix’s October 2019 Financial Analyst Meeting related to revenue growth, margins and therefore free cash flow10 will likely take additional time to achieve. We will provide more details around our longer-term model at our analyst meeting scheduled in conjunction with our third quarter 2021 earnings release. 4A reconciliation of GAAP to non-GAAP measures has been provided in the financial statement tables included in this letter. An explanation of these measures is also included below under the heading “Reconciliation of Non-GAAP Financial Measures to Comparable U.S. GAAP Measures.” 10 Free cash flow is operating cash flow determined in accordance with GAAP less capital expenditures. Free cash flow is not a measure of cash available for discretionary expenditures. 2021 Q2 Financials 10
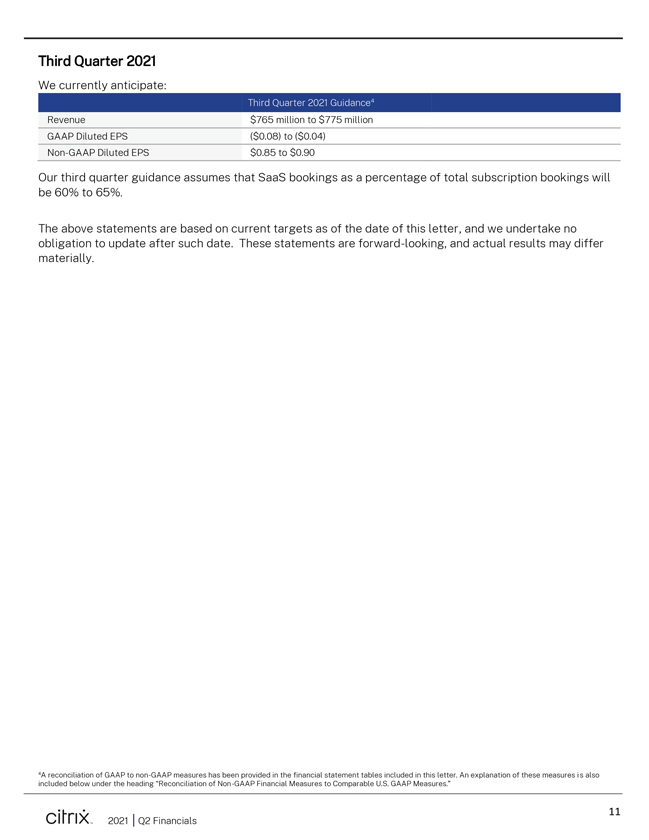
Third Quarter 2021 We currently anticipate: Third Quarter 2021 Guidance4 Revenue $765 million to $775 million GAAP Diluted EPS ($0.08) to ($0.04) Non-GAAP Diluted EPS $0.85 to $0.90 Our third quarter guidance assumes that SaaS bookings as a percentage of total subscription bookings will be 60% to 65%. The above statements are based on current targets as of the date of this letter, and we undertake no obligation to update after such date. These statements are forward-looking, and actual results may differ materially. 4A reconciliation of GAAP to non-GAAP measures has been provided in the financial statement tables included in this letter. An explanation of these measures is also included below under the heading “Reconciliation of Non-GAAP Financial Measures to Comparable U.S. GAAP Measures.” 2021 Q2 Financials 11
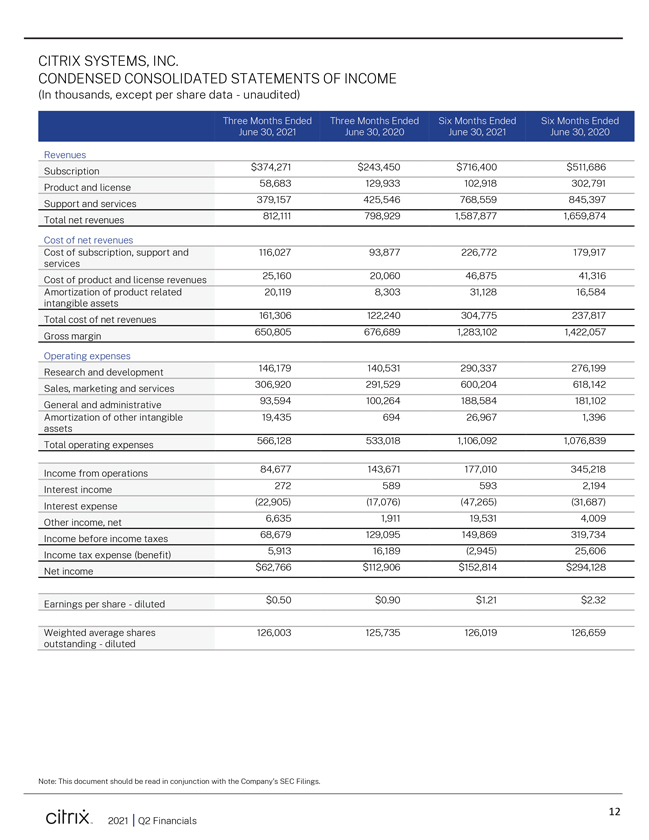
CITRIX SYSTEMS, INC. CONDENSED CONSOLIDATED STATEMENTS OF INCOME (In thousands, except per share data—unaudited) Three Months Ended Three Months Ended Six Months Ended Six Months Ended June 30, 2021 June 30, 2020 June 30, 2021 June 30, 2020 Revenues Subscription $374,271 $243,450 $716,400 $511,686 Product and license 58,683 129,933 102,918 302,791 Support and services 379,157 425,546 768,559 845,397 Total net revenues 812,111 798,929 1,587,877 1,659,874 Cost of net revenues Cost of subscription, support and 116,027 93,877 226,772 179,917 services Cost of product and license revenues 25,160 20,060 46,875 41,316 Amortization of product related 20,119 8,303 31,128 16,584 intangible assets Total cost of net revenues 161,306 122,240 304,775 237,817 Gross margin 650,805 676,689 1,283,102 1,422,057 Operating expenses Research and development 146,179 140,531 290,337 276,199 Sales, marketing and services 306,920 291,529 600,204 618,142 General and administrative 93,594 100,264 188,584 181,102 Amortization of other intangible 19,435 694 26,967 1,396 assets Total operating expenses 566,128 533,018 1,106,092 1,076,839 Income from operations 84,677 143,671 177,010 345,218 Interest income 272 589 593 2,194 Interest expense (22,905) (17,076) (47,265) (31,687) Other income, net 6,635 1,911 19,531 4,009 Income before income taxes 68,679 129,095 149,869 319,734 Income tax expense (benefit) 5,913 16,189 (2,945) 25,606 Net income $62,766 $112,906 $152,814 $294,128 Earnings per share—diluted $0.50 $0.90 $1.21 $2.32 Weighted average shares 126,003 125,735 126,019 126,659 outstanding—diluted Note: This document should be read in conjunction with the Company’s SEC Filings. 2021 Q2 Financials 12
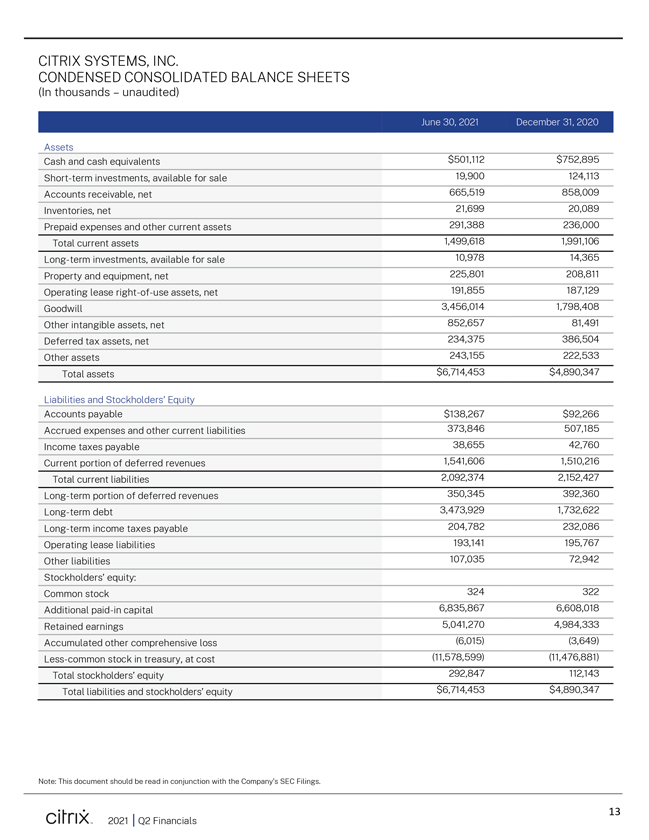
CITRIX SYSTEMS, INC. CONDENSED CONSOLIDATED BALANCE SHEETS (In thousands – unaudited) June 30, 2021 December 31, 2020 Assets Cash and cash equivalents $501,112 $752,895 Short-term investments, available for sale 19,900 124,113 Accounts receivable, net 665,519 858,009 Inventories, net 21,699 20,089 Prepaid expenses and other current assets 291,388 236,000 Total current assets 1,499,618 1,991,106 Long-term investments, available for sale 10,978 14,365 Property and equipment, net 225,801 208,811 Operating lease right-of-use assets, net 191,855 187,129 Goodwill 3,456,014 1,798,408 Other intangible assets, net 852,657 81,491 Deferred tax assets, net 234,375 386,504 Other assets 243,155 222,533 Total assets $6,714,453 $4,890,347 Liabilities and Stockholders’ Equity Accounts payable $138,267 $92,266 Accrued expenses and other current liabilities 373,846 507,185 Income taxes payable 38,655 42,760 Current portion of deferred revenues 1,541,606 1,510,216 Total current liabilities 2,092,374 2,152,427 Long-term portion of deferred revenues 350,345 392,360 Long-term debt 3,473,929 1,732,622 Long-term income taxes payable 204,782 232,086 Operating lease liabilities 193,141 195,767 Other liabilities 107,035 72,942 Stockholders’ equity: Common stock 324 322 Additional paid-in capital 6,835,867 6,608,018 Retained earnings 5,041,270 4,984,333 Accumulated other comprehensive loss (6,015) (3,649) Less-common stock in treasury, at cost (11,578,599) (11,476,881) Total stockholders’ equity 292,847 112,143 Total liabilities and stockholders’ equity $6,714,453 $4,890,347 Note: This document should be read in conjunction with the Company’s SEC Filings. 2021 Q2 Financials 13
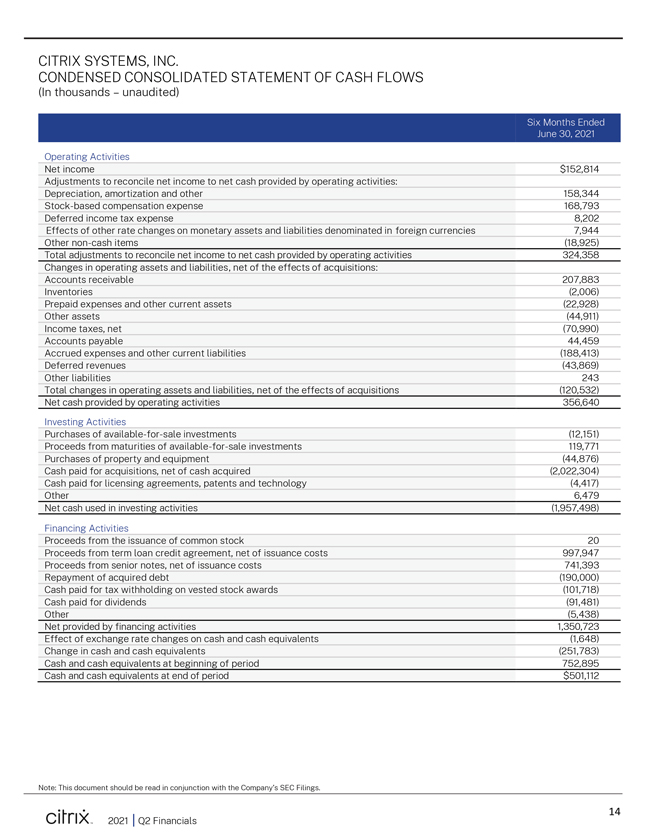
CITRIX SYSTEMS, INC. CONDENSED CONSOLIDATED STATEMENT OF CASH FLOWS (In thousands – unaudited) Six Months Ended June 30, 2021 Operating Activities Net income $152,814 Adjustments to reconcile net income to net cash provided by operating activities: Depreciation, amortization and other 158,344 Stock-based compensation expense 168,793 Deferred income tax expense 8,202 Effects of other rate changes on monetary assets and liabilities denominated in foreign currencies 7,944 Other non-cash items (18,925) Total adjustments to reconcile net income to net cash provided by operating activities 324,358 Changes in operating assets and liabilities, net of the effects of acquisitions: Accounts receivable 207,883 Inventories (2,006) Prepaid expenses and other current assets (22,928) Other assets (44,911) Income taxes, net (70,990) Accounts payable 44,459 Accrued expenses and other current liabilities (188,413) Deferred revenues (43,869) Other liabilities 243 Total changes in operating assets and liabilities, net of the effects of acquisitions (120,532) Net cash provided by operating activities 356,640 Investing Activities Purchases of available-for-sale investments (12,151) Proceeds from maturities of available-for-sale investments 119,771 Purchases of property and equipment (44,876) Cash paid for acquisitions, net of cash acquired (2,022,304) Cash paid for licensing agreements, patents and technology (4,417) Other 6,479 Net cash used in investing activities (1,957,498) Financing Activities Proceeds from the issuance of common stock 20 Proceeds from term loan credit agreement, net of issuance costs 997,947 Proceeds from senior notes, net of issuance costs 741,393 Repayment of acquired debt (190,000) Cash paid for tax withholding on vested stock awards (101,718) Cash paid for dividends (91,481) Other (5,438) Net provided by financing activities 1,350,723 Effect of exchange rate changes on cash and cash equivalents (1,648) Change in cash and cash equivalents (251,783) Cash and cash equivalents at beginning of period 752,895 Cash and cash equivalents at end of period $501,112 Note: This document should be read in conjunction with the Company’s SEC Filings. 2021 Q2 Financials 14
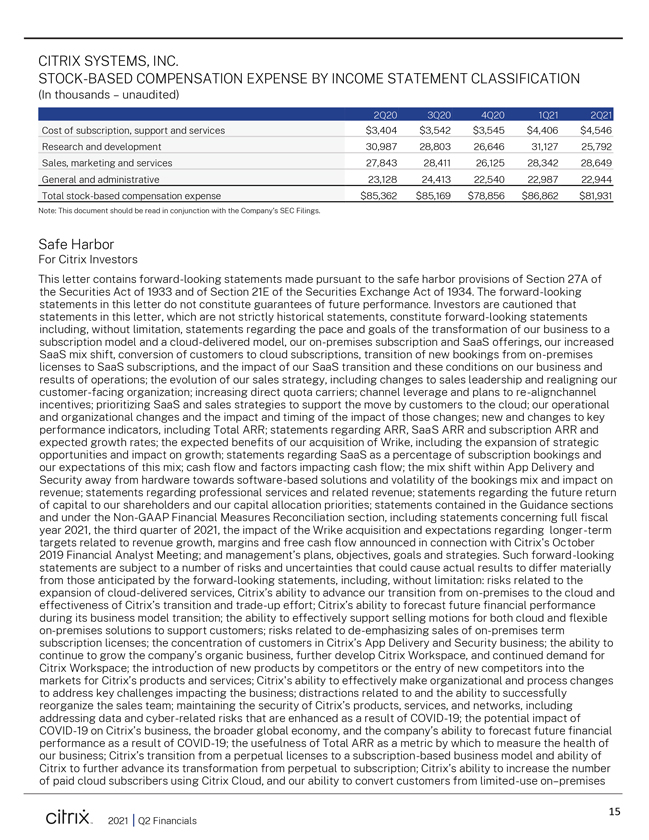
CITRIX SYSTEMS, INC. STOCK-BASED COMPENSATION EXPENSE BY INCOME STATEMENT CLASSIFICATION (In thousands – unaudited) 2Q20 3Q20 4Q20 1Q21 2Q21 Cost of subscription, support and services $3,404 $3,542 $3,545 $4,406 $4,546 Research and development 30,987 28,803 26,646 31,127 25,792 Sales, marketing and services 27,843 28,411 26,125 28,342 28,649 General and administrative 23,128 24,413 22,540 22,987 22,944 Total stock-based compensation expense $85,362 $85,169 $78,856 $86,862 $81,931 Note: This document should be read in conjunction with the Company’s SEC Filings. Safe Harbor For Citrix Investors This letter contains forward-looking statements made pursuant to the safe harbor provisions of Section 27A of the Securities Act of 1933 and of Section 21E of the Securities Exchange Act of 1934. The forward-looking statements in this letter do not constitute guarantees of future performance. Investors are cautioned that statements in this letter, which are not strictly historical statements, constitute forward-looking statements including, without limitation, statements regarding the pace and goals of the transformation of our business to a subscription model and a cloud-delivered model, our on-premises subscription and SaaS offerings, our increased SaaS mix shift, conversion of customers to cloud subscriptions, transition of new bookings from on-premises licenses to SaaS subscriptions, and the impact of our SaaS transition and these conditions on our business and results of operations; the evolution of our sales strategy, including changes to sales leadership and realigning our customer-facing organization; increasing direct quota carriers; channel leverage and plans to re-alignchannel incentives; prioritizing SaaS and sales strategies to support the move by customers to the cloud; our operational and organizational changes and the impact and timing of the impact of those changes; new and changes to key performance indicators, including Total ARR; statements regarding ARR, SaaS ARR and subscription ARR and expected growth rates; the expected benefits of our acquisition of Wrike, including the expansion of strategic opportunities and impact on growth; statements regarding SaaS as a percentage of subscription bookings and our expectations of this mix; cash flow and factors impacting cash flow; the mix shift within App Delivery and Security away from hardware towards software-based solutions and volatility of the bookings mix and impact on revenue; statements regarding professional services and related revenue; statements regarding the future return of capital to our shareholders and our capital allocation priorities; statements contained in the Guidance sections and under the Non-GAAP Financial Measures Reconciliation section, including statements concerning full fiscal year 2021, the third quarter of 2021, the impact of the Wrike acquisition and expectations regarding longer-term targets related to revenue growth, margins and free cash flow announced in connection with Citrix’s October 2019 Financial Analyst Meeting; and management’s plans, objectives, goals and strategies. Such forward-looking statements are subject to a number of risks and uncertainties that could cause actual results to differ materially from those anticipated by the forward-looking statements, including, without limitation: risks related to the expansion of cloud-delivered services, Citrix’s ability to advance our transition from on-premises to the cloud and effectiveness of Citrix’s transition and trade-up effort; Citrix’s ability to forecast future financial performance during its business model transition; the ability to effectively support selling motions for both cloud and flexible on-premises solutions to support customers; risks related to de-emphasizing sales of on-premises term subscription licenses; the concentration of customers in Citrix’s App Delivery and Security business; the ability to continue to grow the company’s organic business, further develop Citrix Workspace, and continued demand for Citrix Workspace; the introduction of new products by competitors or the entry of new competitors into the markets for Citrix’s products and services; Citrix’s ability to effectively make organizational and process changes to address key challenges impacting the business; distractions related to and the ability to successfully reorganize the sales team; maintaining the security of Citrix’s products, services, and networks, including addressing data and cyber-related risks that are enhanced as a result of COVID-19; the potential impact of COVID-19 on Citrix’s business, the broader global economy, and the company’s ability to forecast future financial performance as a result of COVID-19; the usefulness of Total ARR as a metric by which to measure the health of our business; Citrix’s transition from a perpetual licenses to a subscription-based business model and ability of Citrix to further advance its transformation from perpetual to subscription; Citrix’s ability to increase the number of paid cloud subscribers using Citrix Cloud, and our ability to convert customers from limited-use on–premises 2021 Q2 Financials 15
licenses issued at the onset of the pandemic to longer-term subscription or SaaS arrangements; conditions affecting the IT market, including uncertainty in IT spending, including as a result of COVID-19 and changes in the markets for Citrix’s products, including the Workspace market; regulation of privacy and data security; changes in Citrix’s pricing and licensing models, including promotional programs and product mix, all of which may impact Citrix’s revenue recognition; unpredictability of sales cycles and seasonal fluctuations in Citrix’s business; timing of cash collections and payments; changes in bookings mix; reliance on indirect distribution channels and major distributors; failure to drive volume through the channel or appropriately incentivize our channel partners; failure to successfully partner with key distributors, resellers, system integrators, service providers and strategic and technology partners; the ability to attract and retain key and other highly-skilled employees and qualified direct quota carrying sales personnel; transitions in key personnel and succession risk; reliance on third party hardware providers; impact of disruptions in the supply chain and delays in shipments; the impact of the global economic and political environment on Citrix’s business, volatility in global stock markets and foreign exchange rate volatility; Citrix’s ability to expand our customer base and attract more users within our customer base; Citrix’s ability to protect innovations and intellectual property, including in higher-risk markets; the company’s ability to innovate and develop new products and services; changes in revenue mix towards products and services with lower gross margins; changes in customer demand and average contract duration; the ability of Citrix to make suitable acquisitions on favorable terms in the future; Citrix’s acquisitions and divestitures, including failure to further develop and successfully market the technology and products of acquired companies, failure to achieve or maintain anticipated revenues and operating performance contributions from acquisitions, which could dilute earnings, and risks related to financing necessary to complete acquisitions; the ability of Citrix to realize the expected benefits of the acquisition of Wrike; potential disruptions to Citrix’s and Wrike’s operations, distractions of management and other risks related to Citrix’s integration of Wrike’s business, team and technology; the ability of Citrix’s sales professionals and distribution partners to sell Wrike’s product and service offerings and retain key customers; risks related to Citrix’s additional debt incurred in connection with the Wrike acquisition; bankruptcies, insolvencies or other economic conditions that limit Citrix’s customers’ ability to pay for our services or limit the ability for us to collect payments, including unbilled revenue, which may be enhanced as a result of the COVID-19 pandemic; ability to effectively manage our capital structure and the impact of related changes on our operating results and financial condition; the effect of new accounting pronouncements on revenue and expense recognition; failure to comply with federal, state and international regulations; risks related to Citrix’s international presence; litigation and disputes, including challenges to intellectual property rights or allegations of infringement of the intellectual property rights of others; the ability to maintain and protect Citrix’s collection of brands; risks related to use of open source software; risks related to access to third-party licenses; charges in the event of a write-off or impairment of acquired assets, underperforming businesses, investments or licenses; risks related to servicing debt; tax rates fluctuation and uncertainty; political uncertainty and social turmoil, natural disasters and pandemics, including COVID-19; and other risks detailed in Citrix’s filings with the Securities and Exchange Commission. Citrix assumes no obligation to update any forward-looking information contained in this letter or with respect to the announcements described herein. Reconciliation of Non-GAAP Financial Measures to Comparable U.S. GAAP Measures (Unaudited) Pursuant to the requirements of Regulation G, the Company has provided a reconciliation of each non-GAAP financial measure used in this letter and related conference call or webcast to the most directly comparable GAAP financial measure. These measures differ from GAAP in that they exclude amortization primarily related to acquired intangible assets, stock-based compensation expenses, acquisition-related costs and the related tax effect of those items. The income tax effect on non-GAAP items is calculated based upon the tax laws and statutory income tax rates applicable in the tax jurisdiction(s) of the underlying non-GAAP adjustment. The Company’s basis for these adjustments is described below. Management uses these non-GAAP measures for internal reporting and forecasting purposes, when publicly providing its business outlook, to evaluate the Company’s performance and to evaluate and compensate the Company’s executives. The Company has provided these non-GAAP financial measures in addition to GAAP financial results because it believes that these non-GAAP financial measures provide useful information to certain investors and financial analysts for comparison across accounting periods not influenced by certain non-cash items or cash charges that are the result of discrete activities that are not used by management when evaluating the Company’s historical and prospective financial performance. In addition, the Company has historically provided this or similar information and understands that some investors and financial analysts find this information helpful in analyzing the Company’s operating margins, operating expenses and net income and 2021 Q2 Financials 16
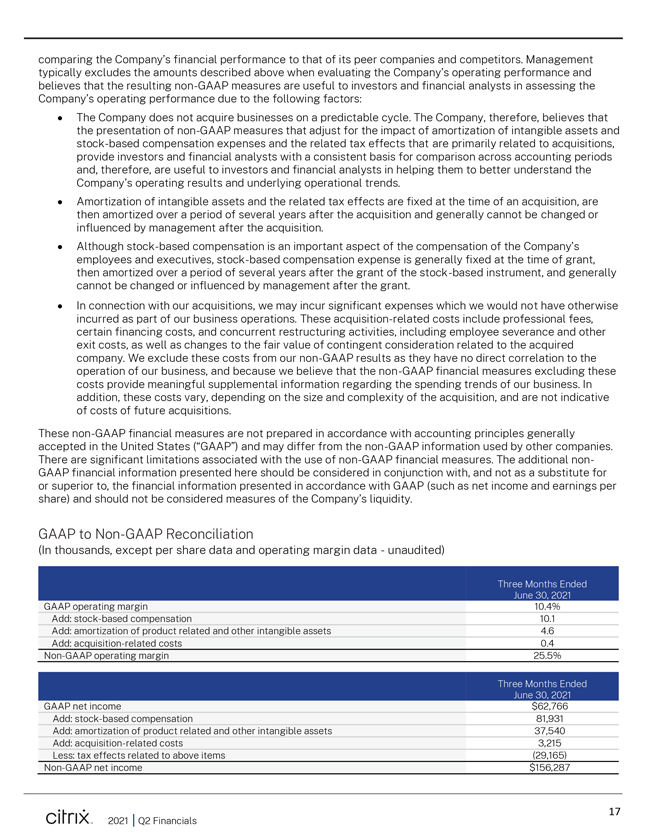
comparing the Company’s financial performance to that of its peer companies and competitors. Management typically excludes the amounts described above when evaluating the Company’s operating performance and believes that the resulting non-GAAP measures are useful to investors and financial analysts in assessing the Company’s operating performance due to the following factors: ï,· The Company does not acquire businesses on a predictable cycle. The Company, therefore, believes that the presentation of non-GAAP measures that adjust for the impact of amortization of intangible assets and stock-based compensation expenses and the related tax effects that are primarily related to acquisitions, provide investors and financial analysts with a consistent basis for comparison across accounting periods and, therefore, are useful to investors and financial analysts in helping them to better understand the Company’s operating results and underlying operational trends. ï,· Amortization of intangible assets and the related tax effects are fixed at the time of an acquisition, are then amortized over a period of several years after the acquisition and generally cannot be changed or influenced by management after the acquisition. ï,· Although stock-based compensation is an important aspect of the compensation of the Company’s employees and executives, stock-based compensation expense is generally fixed at the time of grant, then amortized over a period of several years after the grant of the stock-based instrument, and generally cannot be changed or influenced by management after the grant. ï,· In connection with our acquisitions, we may incur significant expenses which we would not have otherwise incurred as part of our business operations. These acquisition-related costs include professional fees, certain financing costs, and concurrent restructuring activities, including employee severance and other exit costs, as well as changes to the fair value of contingent consideration related to the acquired company. We exclude these costs from our non-GAAP results as they have no direct correlation to the operation of our business, and because we believe that the non-GAAP financial measures excluding these costs provide meaningful supplemental information regarding the spending trends of our business. In addition, these costs vary, depending on the size and complexity of the acquisition, and are not indicative of costs of future acquisitions. These non-GAAP financial measures are not prepared in accordance with accounting principles generally accepted in the United States (“GAAP”) and may differ from the non-GAAP information used by other companies. There are significant limitations associated with the use of non-GAAP financial measures. The additional non-GAAP financial information presented here should be considered in conjunction with, and not as a substitute for or superior to, the financial information presented in accordance with GAAP (such as net income and earnings per share) and should not be considered measures of the Company’s liquidity. GAAP to Non-GAAP Reconciliation (In thousands, except per share data and operating margin data—unaudited) Three Months Ended June 30, 2021 GAAP operating margin 10.4% Add: stock-based compensation 10.1 Add: amortization of product related and other intangible assets 4.6 Add: acquisition-related costs 0.4 Non-GAAP operating margin 25.5% Three Months Ended June 30, 2021 GAAP net income $62,766 Add: stock-based compensation 81,931 Add: amortization of product related and other intangible assets 37,540 Add: acquisition-related costs 3,215 Less: tax effects related to above items (29,165) Non-GAAP net income $156,287 2021 Q2 Financials 17
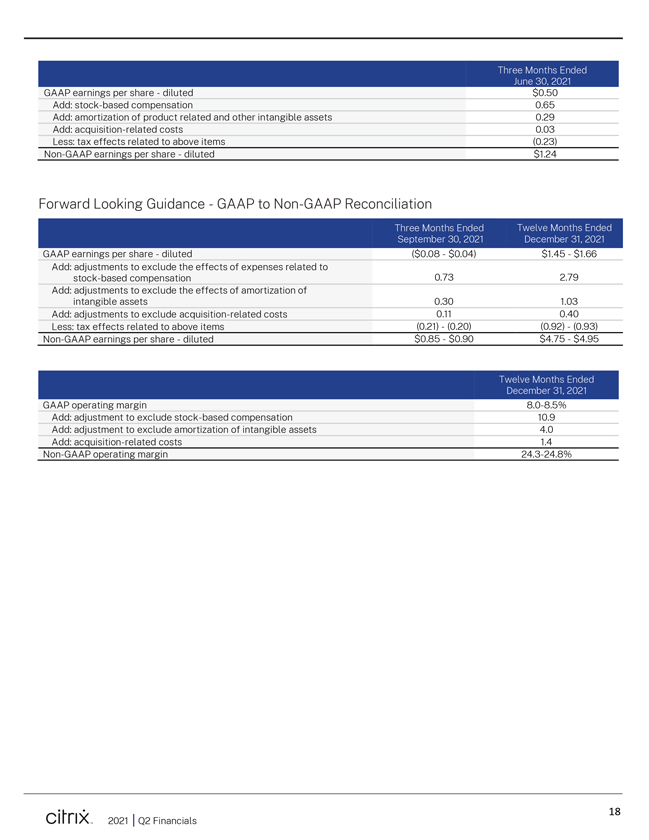
Three Months Ended June 30, 2021 GAAP earnings per share—diluted $0.50 Add: stock-based compensation 0.65 Add: amortization of product related and other intangible assets 0.29 Add: acquisition-related costs 0.03 Less: tax effects related to above items (0.23) Non-GAAP earnings per share—diluted $1.24 Forward Looking Guidance—GAAP to Non-GAAP Reconciliation Three Months Ended Twelve Months Ended September 30, 2021 December 31, 2021 GAAP earnings per share—diluted ($0.08—$0.04) $1.45—$1.66 Add: adjustments to exclude the effects of expenses related to stock-based compensation 0.73 2.79 Add: adjustments to exclude the effects of amortization of intangible assets 0.30 1.03 Add: adjustments to exclude acquisition-related costs 0.11 0.40 Less: tax effects related to above items (0.21)—(0.20) (0.92)—(0.93) Non-GAAP earnings per share—diluted $0.85—$0.90 $4.75—$4.95 Twelve Months Ended December 31, 2021 GAAP operating margin 8.0-8.5% Add: adjustment to exclude stock-based compensation 10.9 Add: adjustment to exclude amortization of intangible assets 4.0 Add: acquisition-related costs 1.4 Non-GAAP operating margin 24.3-24.8% 2021 Q2 Financials 18