Attached files
| file | filename |
|---|---|
| 8-K - 8-K - Apartment Income REIT Corp. | airc-20210729.htm |


AIR Reports Second Quarter 2021 Results – Full Year FFO Guidance Increased by 5%; Quarterly Dividend Raised by 2%
Denver, Colorado, July 29, 2021 – Apartment Income REIT Corp. (“AIR”) (NYSE: AIRC) announced today second quarter results for 2021 and an increase to full year Same Store Revenue, NOI and FFO guidance.
Chief Executive Officer Terry Considine comments: “Business is good! Strong consumer demand is driving higher occupancy and higher rents. The efficiency of the AIR business model is confirmed with peer-best operating margins, low corporate G&A, driving a 5% increase in full year FFO guidance.”
“Asking rents have now surpassed the pre-COVID peak and are at or above their long-term trend. Improving consumer demand and strong execution led to signed new rates up 2.7% in the second quarter… and up 9.5% month-to-date in July.”
"We are on track to meet leverage goals. In April, we issued $342 million of equity and used the proceeds to reduce debt. We expect similar proceeds from 3Q activity to sell our New York and Chicago properties, and a like amount from 4Q activities to sell properties outright or to joint ventures, with all proceeds applied to debt reduction.”
“We upgraded our portfolio with the $223 million purchase of City Center on 7th, a 700-apartment home community located in Pembroke Pines, Florida. We will increase 4Q property sales so that this purchase is funded on a leverage neutral basis.”
"We are well positioned for an excellent second half of 2021 and an even better 2022; our current loss to lease of 10% suggests double-digit revenue growth."
Chief Financial Officer Paul Beldin adds: “Second quarter FFO per share of $0.52 was $0.02 above the high-end of our guidance range due to better than anticipated property operations and lower than anticipated offsite costs.”
“With 80% of 2021 anticipated leasing activity completed, we now expect full year Same Store NOI growth between (0.50%) and 1.00%, with Same Store property operations contributing an incremental $0.08 to FFO per share at the midpoint. Our full year FFO expectations, at the mid-point, are now 7% above our beginning of year expectations.”
Financial Results: Second Quarter Pro Forma FFO Per Share
|
|
2021 |
|||||||||||
(all items per common share - diluted) |
|
SECOND QUARTER |
|
|
FIRST QUARTER |
|
|
YEAR-TO-DATE |
|
|
|||
Net income (loss) |
|
$ |
(0.12 |
) |
|
$ |
0.56 |
|
|
$ |
0.43 |
|
|
NAREIT Funds From Operations (FFO) |
|
$ |
0.28 |
|
|
$ |
0.48 |
|
|
$ |
0.75 |
|
|
Pro forma adjustments |
|
$ |
0.24 |
|
|
$ |
0.02 |
|
|
$ |
0.27 |
|
|
Pro forma Funds From Operations (Pro forma FFO) |
|
$ |
0.52 |
|
|
$ |
0.50 |
|
|
$ |
1.02 |
|
|
2
AIR Operating Results: Second Quarter Same Store Revenue Up 0.8% Sequentially
The table below includes the operating results of the 92 properties of AIR that meet our Same Store definition. These properties comprise approximately 99% of AIR’s GAAP revenue.
|
SECOND QUARTER |
YEAR-TO-DATE |
||||||
|
Year-over-Year |
Sequential |
Year-over-Year |
|||||
($ in millions) |
2021 |
2020 |
Variance |
1st Qtr. |
Variance |
2021 |
2020 |
Variance |
Revenue, before utility reimbursements |
$154.2 |
$157.1 |
(1.9%) |
$153.0 |
0.8% |
$307.1 |
$320.0 |
(4.0%) |
Expenses, net of utility reimbursements |
45.1 |
43.0 |
5.0% |
44.0 |
2.7% |
89.1 |
85.7 |
4.0% |
Net operating income (NOI) |
$109.0 |
$114.1 |
(4.5%) |
$109.0 |
—% |
$218.0 |
$234.3 |
(6.9%) |
Components of Same Store Revenue Growth – Second quarter year-over-year Same Store revenue growth was impacted by lower residential rental rates and increased bad debt expense, offset partially by higher average daily occupancy, increased late fees, and a recovery in commercial rents. The table below summarizes the change in the components of our Same Store revenue growth.
|
|
SECOND QUARTER |
YEAR-TO-DATE |
||||||||||
Same Store Revenue Components |
|
Year-over-Year |
Sequential |
Year-over-Year |
|||||||||
Residential Rents |
|
|
(2.3 |
%) |
|
|
0.2 |
% |
|
|
(2.1 |
%) |
|
Average Daily Occupancy |
|
|
0.3 |
% |
|
|
(0.1 |
%) |
|
|
(0.6 |
%) |
|
Residential Net Rental Income |
|
|
(2.0 |
%) |
|
|
0.1 |
% |
|
|
(2.7 |
%) |
|
Bad Debt |
|
|
(0.6 |
%) |
|
|
(0.1 |
%) |
|
|
(1.1 |
%) |
|
Late Fees and Other |
|
|
0.5 |
% |
|
|
0.4 |
% |
|
|
— |
% |
|
Residential Revenue |
|
|
(2.1 |
%) |
|
|
0.4 |
% |
|
|
(3.8 |
%) |
|
Commercial Revenue |
|
|
0.2 |
% |
|
|
0.4 |
% |
|
|
(0.2 |
%) |
|
Same Store Revenue Growth |
|
|
(1.9 |
%) |
|
|
0.8 |
% |
|
|
(4.0 |
%) |
|
Same Store Rental Rates – We measure changes in rental rates by comparing, on a lease-by-lease basis, the effective rate on a newly executed lease to the effective rate on the expiring lease for that same apartment. A newly executed lease is classified either as a new lease, where a vacant apartment is leased to a new customer, or as a renewal.
The table below details changes in lease rates, as well as the weighted-average (blended) lease rates for leases executed in the respective period. Transacted leases are those that became effective during a reporting period and are therefore the best measure of immediate effect on current revenues. Signed leases are those executed during a reporting period and are therefore the best measure of current activity.
|
SECOND QUARTER |
|
YEAR-TO-DATE |
|
2021 |
|
||||||||||||||||||||||||
|
2021 |
|
2020 |
|
Variance |
|
2021 |
|
2020 |
|
Variance |
|
April |
|
May |
|
June |
|
July* |
|
||||||||||
Transacted Leases |
|
|
|
|
|
|
|
|
|
|
|
|
|
|
|
|
|
|
|
|
||||||||||
Renewal rent changes |
|
3.2 |
% |
|
5.0 |
% |
|
(1.8 |
%) |
|
2.8 |
% |
|
5.2 |
% |
|
(2.4 |
%) |
|
2.0 |
% |
|
3.0 |
% |
|
3.9 |
% |
|
5.7 |
% |
New lease rent changes |
|
(0.9 |
%) |
|
(2.8 |
%) |
|
1.9 |
% |
|
(3.5 |
%) |
|
(1.0 |
%) |
|
(2.5 |
%) |
|
(3.6 |
%) |
|
(2.3 |
%) |
|
1.7 |
% |
|
5.9 |
% |
Weighted-average rent changes |
|
1.1 |
% |
|
1.5 |
% |
|
(0.4 |
%) |
|
(0.7 |
%) |
|
2.3 |
% |
|
(3.0 |
%) |
|
(0.8 |
%) |
|
0.1 |
% |
|
2.8 |
% |
|
5.8 |
% |
|
|
|
|
|
|
|
|
|
|
|
|
|
|
|
|
|
|
|
|
|
||||||||||
Signed Leases |
|
|
|
|
|
|
|
|
|
|
|
|
|
|
|
|
|
|
|
|
||||||||||
Renewal rent changes |
|
4.6 |
% |
|
3.8 |
% |
|
0.8 |
% |
|
4.1 |
% |
|
4.6 |
% |
|
(0.5 |
%) |
|
3.9 |
% |
|
4.5 |
% |
|
5.2 |
% |
|
5.9 |
% |
New lease rent changes |
|
2.7 |
% |
|
(4.0 |
%) |
|
6.7 |
% |
|
(0.3 |
%) |
|
(1.6 |
%) |
|
1.3 |
% |
|
(0.2 |
%) |
|
1.6 |
% |
|
5.9 |
% |
|
9.5 |
% |
Weighted-average rent changes |
|
3.8 |
% |
|
0.5 |
% |
|
3.3 |
% |
|
2.2 |
% |
|
2.2 |
% |
|
— |
% |
|
2.1 |
% |
|
3.1 |
% |
|
5.5 |
% |
|
7.5 |
% |
|
|
|
|
|
|
|
|
|
|
|
|
|
|
|
|
|
|
|
|
|
||||||||||
Average Daily Occupancy |
|
95.4 |
% |
|
95.1 |
% |
|
0.3 |
% |
|
95.5 |
% |
|
96.1 |
% |
|
(0.6 |
%) |
|
95.4 |
% |
|
95.3 |
% |
|
95.5 |
% |
|
95.8 |
% |
*July leasing results are preliminary and as of July 27, 2021.
3
Same Store Markets – Market conditions and leasing results in the second quarter exceeded our expectations at the beginning of the year. We continue to emphasize margin and long-tern NOI growth over short-term revenue growth. This approach contributed to sequential revenue growth of 80 basis points from the first to second quarter, and more importantly positioned the business for continued acceleration through the second half of the year and into 2022.
Weighted-average signed lease changes have now trended upwards for 10 consecutive months with July new lease rates up 9.5% through July 27, 2021.
Year-to-date, we have transacted 11,700 leases with a weighted-average rate increase of 70 basis points compared to the prior lease. We have signed an additional 4,000 leases with average rate increases of 8.6%. These 15,700 leases represent approximately 80% of our anticipated full year leasing activity and have weighted-average rent increases of 2.7%. We anticipate another 3,700 leases to be signed with blended rent changes in the range of 6%-8%, and a full year blended rate increase of approximately 3%.
The following chart details changes in Same Store asking rents from December 2018 and what we expect through December 2022. Today, asking rents are 6% above our pre-COVID peak:
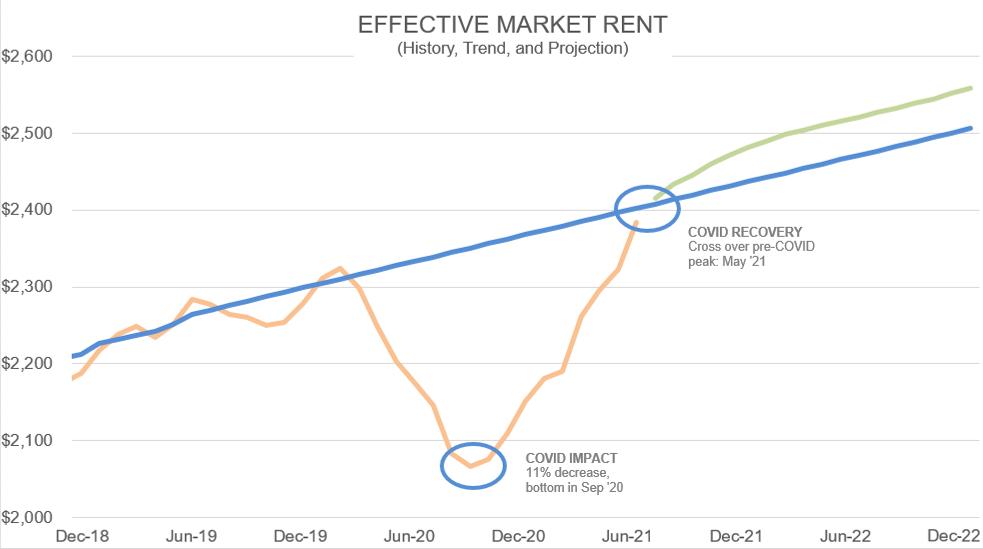
In addition to accelerating market rents as shown above, leasing pace has also exceeded expectations, with second quarter leasing volume 65% ahead of 2020 and 10% above our previous high in the second quarter of 2019. Average Daily Occupancy remained stable in the second quarter despite significant increases in frictional vacancy due to the number of lease expirations in peak season. While occupancy remained stable, our leased percent, which is the percent of total apartment homes currently leased, improved from 90.7% to 93.1% during the second quarter. As of July 27, 2021, our leased percentage is now 95%; 800 basis points ahead of the same day last year and 400 basis points ahead of 2019.
4
Rent Collection Update
We measure residential rent collection as the amount of payments received as a percentage of all residential amounts owed. In the second quarter, we recognized 97.9% of all residential revenue owed during the quarter, treating the balance of 2.1% as bad debt. Of the 97.9% of residential revenue recognized, as of quarter-end, we collected in cash all but 120 basis points, with 96.7% of the residential rents collected. Year-to-date we have recognized 97.9% of all residential revenue and collected 97.6% of billed rents.
As of June 30, 2021, our proportionate share of gross residential accounts receivable was $12.7 million. After consideration of tenant security deposits and reserves for uncollectible amounts, our net exposure is $1.1 million. Most of this balance is expected to be collected during the third quarter of 2021. Of our uncollected accounts receivable, 73% relate to California residents.
The state of California has recently expanded the SB-91 rent relief program, to allow for 100% of past due rents to be paid by state funding (vs. 80% previously). As of June 30, 2021, we had received $0.7 million in payments under these programs. We remain cautiously optimistic that this program will allow us to recover rent that was uncollected in 2020 or 2021. We expect bad debt expense to decline as emergency ordinances are lifted that suspended legal action to collect past due rents.
Commercial rental income comprised 2.7% of second quarter revenue. In the second half of 2021, we expect an increased contribution from commercial tenants as their businesses re-open and rent payments resume.
Portfolio Management
Our portfolio of apartment communities is diversified across “A,” “B,” and “C+” price points, averaging “B/B+” in quality, and is also diversified across several of the largest markets in the United States. The table below relates to the AIR portfolio, excludes the properties retained by Aimco in the separation from AIR, and excludes the properties leased to Aimco for development or redevelopment.
|
SECOND QUARTER |
||
|
2021 |
2020 |
Variance |
Apartment Communities |
96 |
99 |
(3) |
Apartment Homes |
26,422 |
26,592 |
(170) |
Average Revenue per Apartment Home |
$2,215 |
$2,294 |
(3%) |
Percentage A (2Q 2021 Average Revenue per Apartment Home $2,832) |
44% |
43% |
1% |
Percentage B (2Q 2021 Average Revenue per Apartment Home $1,982) |
34% |
36% |
(2%) |
Percentage C+ (2Q 2021 Average Revenue per Apartment Home $1,760) |
22% |
21% |
1% |
NOI Margin |
70% |
71% |
(1%) |
Free Cash Flow Margin |
66% |
66% |
—% |
Acquisitions and Dispositions – In the second quarter, we acquired City Center on 7th, a 700-apartment home community located in Pembroke Pines, Florida for $223 million. The acquisition was temporarily funded through borrowings on our revolving credit facility pending the completion of paired trade transactions later in 2021.
We expect an NOI cap rate of 4.2% during our first year of ownership. An additional 160 basis points of growth is expected as we invest approximately $10 million in capital enhancements and implement fully our best-in-class operating platform. Since acquisition 45 days ago, we've signed 27 new leases with rate increases averaging 21.5%, while increasing occupancy by 70 basis points to 97.1%.
Dispositions – We had no dispositions in the second quarter.
5
Balance Sheet
We seek to increase financial returns by using leverage with appropriate caution. We limit risk through our balance sheet structure, employing low leverage, primarily long-dated debt; and we build financial flexibility by maintaining ample unused and available credit; holding properties with substantial value unencumbered by property debt; maintaining an investment grade rating; and using partners’ capital when it enhances financial returns or reduces investment risk.
Components of Leverage
Our leverage includes our share of long-term, non-recourse property debt encumbering our apartment communities, together with outstanding borrowings under our revolving credit facility, our term loans, and our preferred equity.
|
|
AS OF JUNE 30, 2021 |
|
|||||||||
($ in millions) |
|
Amount |
|
|
% of Total |
|
|
Weighted-Avg. |
|
|||
AIR share of long-term, non-recourse property debt |
|
$ |
2,601 |
|
|
|
68 |
% |
|
|
8.9 |
|
Term loans |
|
|
800 |
|
|
|
21 |
% |
|
|
4.5 |
|
Outstanding borrowings on revolving credit facility |
|
|
347 |
|
|
|
9 |
% |
|
|
4.8 |
|
Preferred equity* |
|
|
81 |
|
|
|
2 |
% |
|
|
9.9 |
|
Total Leverage |
|
$ |
3,830 |
|
|
|
100 |
% |
|
|
7.6 |
|
Cash and restricted cash |
|
|
(67 |
) |
|
|
|
|
|
|
||
Notes receivable from Aimco** |
|
|
(534 |
) |
|
|
|
|
|
|
||
Net Leverage |
|
$ |
3,229 |
|
|
|
|
|
|
|
||
* AIR’s Preferred equity is perpetual in nature; however, for illustrative purposes, we have computed the weighted-average maturity of our preferred OP Units assuming a 10-year maturity and preferred stock assuming it is called at the expiration of the no-call period.
** We have notes receivable from Aimco with an aggregate principal amount of $534 million. The notes will mature on January 31, 2024, and are secured by a pool of properties owned by Aimco. We consider the notes a reduction of leverage as we expect proceeds to be used to repay current amounts outstanding.
We entered 2021 with approximately $3.2 billion of net leverage. We anticipate ending 2021 with net leverage of approximately $2.5 billion. The April equity offering and 2021 property sales are expected to reduce leverage by $920 million. This decline is somewhat offset by borrowing to fund capital projects and the City Center acquisition at a loan to value of approximately 25%.
Equity Issuance & Financing Activity
As previously announced in April, we sold 7.825 million shares of our Class A Common Stock in a private placement to a large global real estate-focused investment firm for a cash purchase price of $342 million. Proceeds raised were used to repay $318.4 million of property debt with a weighted-average interest rate of 4.6%, which resulted in a ~0.9x reduction in Net Leverage to Adjusted EBITDAre. Prepayment penalties incurred in connection with the debt repayment totaled $33.8 million. The economic cost of these prepayment penalties is expected to be substantially recovered through lower future interest expense.
On July 15, 2021, we closed on a new $350 million term loan. The loan matures on January 14, 2023, inclusive of a six month extension option, and bears interest at a LIBOR spread of 95 basis points. We used the proceeds to repay borrowings on our revolving credit facility, whose $600 million capacity is fully available.
6
Leverage Reduction – On Track
We target Net Leverage to Adjusted EBITDAre below 6.0x, with a current target of 5.5x by year-end.
At June 30, 2021, Net Leverage to Adjusted EBITDAre was 7.3x, a 0.5x reduction from March 31, 2021.
Liquidity
We use our revolving credit facility for working capital and other short-term purposes and to secure letters of credit. At June 30, 2021, our share of cash and restricted cash was $67 million and we had the capacity to borrow up to $249 million, under our revolving credit facility, bringing total liquidity to $316 million. Pro-forma for the closing of the July term loan, our liquidity increased to $666 million.
We manage our financial flexibility by maintaining an investment grade rating and holding communities that are unencumbered by property debt. AIR has been rated BBB by Standard & Poor’s. As of June 30, 2021, we held unencumbered communities with property debt with an estimated fair market value of approximately $4.2 billion; an increase of 50% from December 31, 2020. We anticipate seeking an investment grade credit rating from Moody’s. In assigning ratings, Moody’s places significant emphasis on the amount of non-recourse property debt as percentage of the undepreciated book value of a company’s assets. To achieve Moody’s required thresholds, we estimate that a Moody’s investment grade rating will require property debt to approximate $1.8 billion. At June 30, 2021 our share of property debt is $2.6 billion.
Dividend
On July 27, 2021, our Board of Directors increased our quarterly cash dividend from $0.43 to $0.44 per share of AIR Common Stock. This amount is payable on August 27, 2021, to stockholders of record on August 13, 2021.
7
2021 Outlook
At the midpoint, we expect FFO per share to be $2.12, up $0.11 from our previous expectations due primarily to increased Same Store NOI.
Our guidance ranges are based on the following components:
|
|
YEAR-TO-DATE JUNE 30, 2021 |
|
FULL YEAR 2021 |
|
PREVIOUS |
($ Amounts represent AIR Share) |
|
|
|
|
|
|
Net Income (loss) per share (1) |
|
$0.43 |
|
$(0.13) to $0.00 |
|
$0.01 to $0.14 |
Pro forma FFO per share |
|
$1.02 |
|
$2.09 to $2.15 |
|
$1.96 to $2.06 |
Pro forma FFO per share at the mid-point |
|
$1.02 |
|
$2.12 |
|
$2.01 |
|
|
|
|
|
|
|
Same Store Operating Components of NAREIT FFO |
|
|
|
|
|
|
Revenue change compared to prior year |
|
(4.0%) |
|
0.50% to 1.50% |
|
(1.50%) to 0.50% |
Expense change compared to prior year |
|
4.0% |
|
3.00% to 2.50% |
|
3.20% to 2.80% |
NOI change compared to prior year |
|
(6.9%) |
|
(0.50%) to 1.00% |
|
(3.40%) to (0.40%) |
|
|
|
|
|
|
|
Offsite Costs |
|
|
|
|
|
|
Property management expenses |
|
$12M |
|
~$23M |
|
~$24M |
General and administrative expenses, net of asset management income (2) |
|
$8M |
|
~$15M |
|
~$16M |
|
|
|
|
|
|
|
Other Earnings |
|
|
|
|
|
|
Lease income (3) |
|
$13M |
|
~$27M |
|
~$27M |
Tax expense (3) |
|
($0.8M) |
|
~($1M) |
|
~($1M) |
Proceeds from dispositions of real estate, net |
|
— |
|
~$800M |
|
~$580M |
|
|
|
|
|
|
|
AIR Share of Capital Investments |
|
|
|
|
|
|
Capital Enhancements |
|
$35M |
|
$65M to $75M |
|
$45M to $55M |
In the third quarter, AIR anticipates Pro forma FFO between $0.51 and $0.55 per share.
8
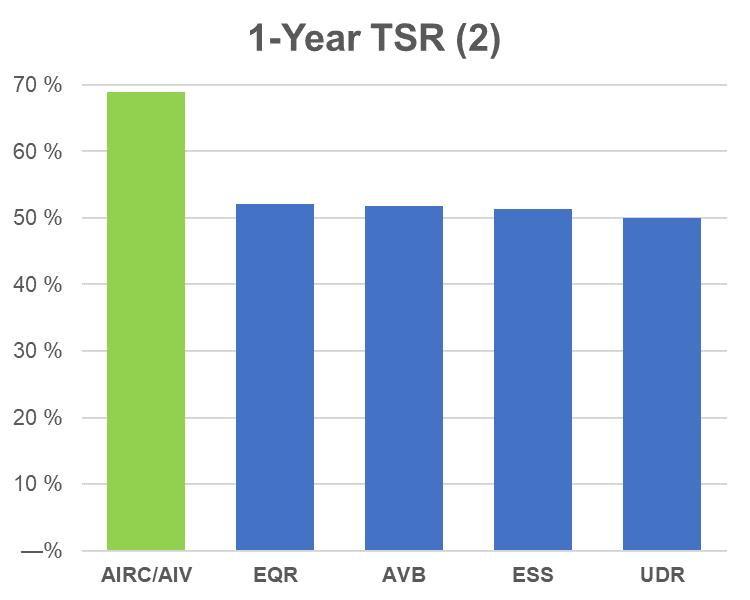
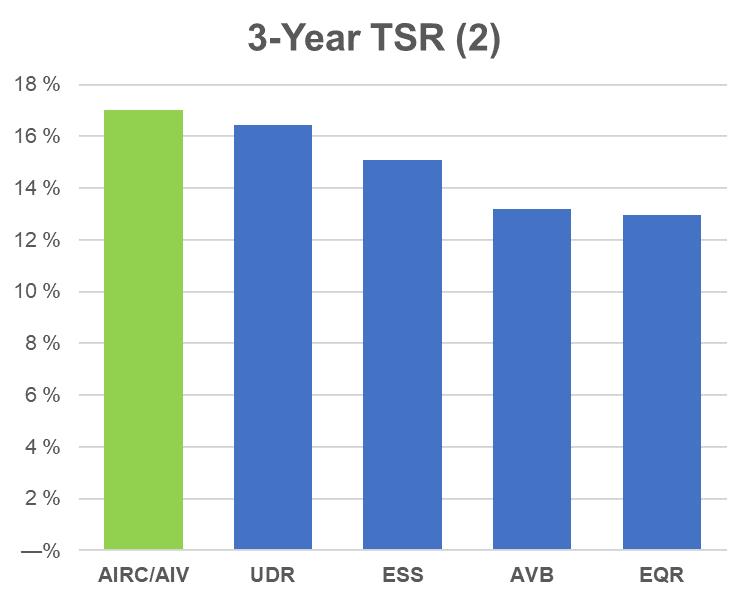
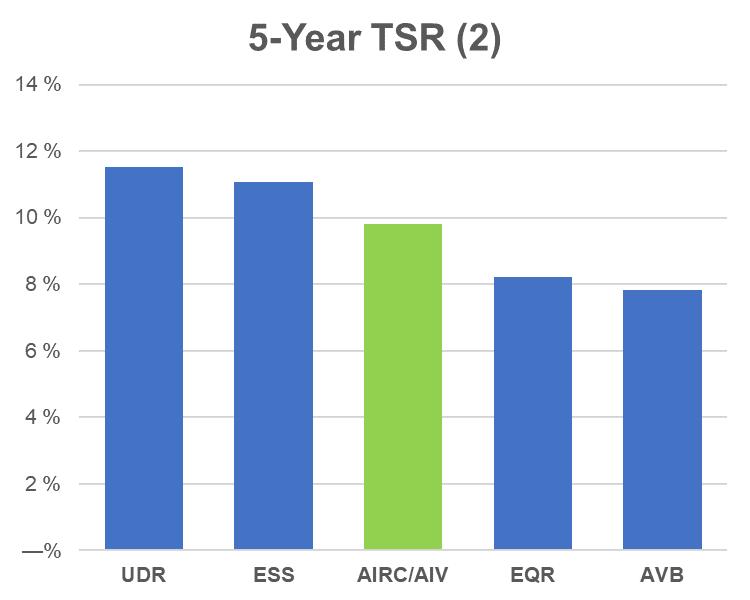
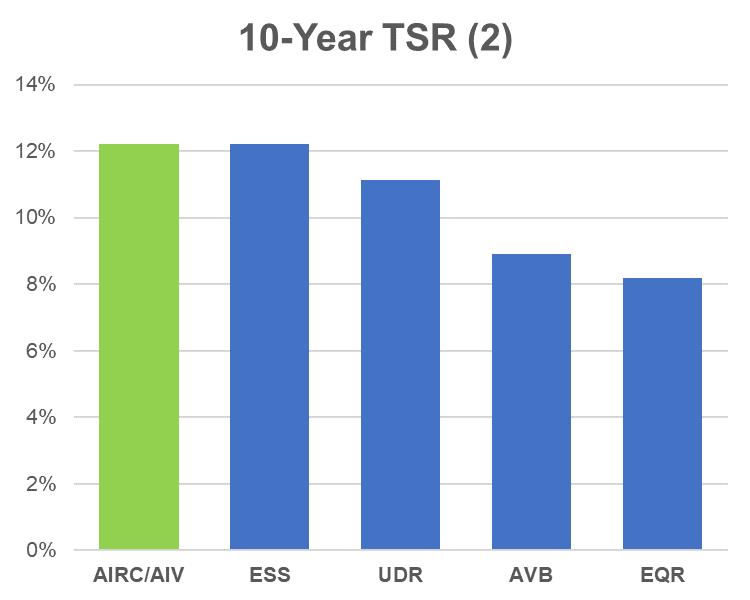
Total Shareholder Return
The separation of AIR from Aimco created significant value for shareholders. The combined outperformance since the announcement of the separation translates to ~$1.3 billion of incremental shareholder value creation, or approximately $8.00 per share.
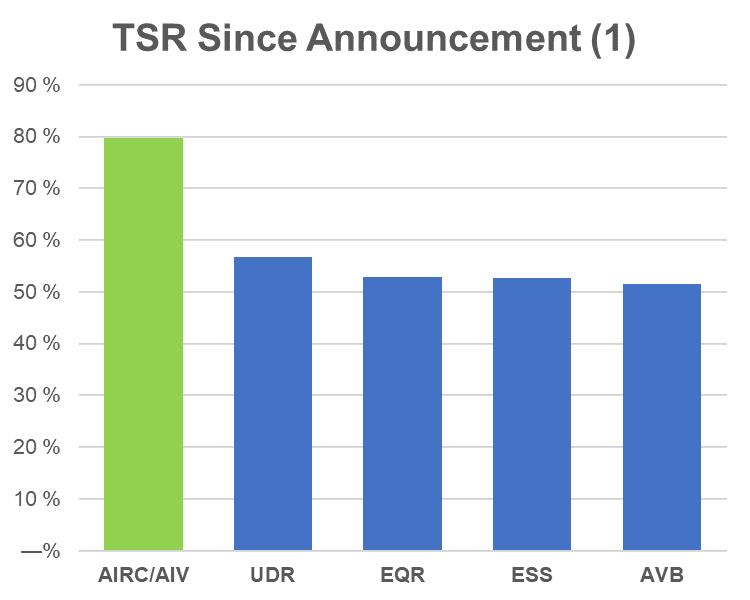
This accretive capital allocation decision, builds on a long-track record of delivering strong returns to shareholders:
9
AIR Strategic Objectives
We created AIR to be an efficient way to invest in U.S. multi-family real estate, due to its simplified business model and diversified portfolio of stabilized apartment communities. Upon AIR’s separation from Aimco, we identified 10 strategic objectives. The following table outlines our progress against these objectives.
|
Objective |
Progress |
|
Simple business model without complex investments or development/lease-up risk |
Done |
|
|
|
|
High quality and diversified portfolio of stabilized multi-family properties |
Done |
|
|
|
|
Best-in-class property operations |
Done |
|
|
|
|
Efficient cost structure with the lowest G&A as a % of total assets |
Done |
|
|
|
|
Predictable and diversified cash flow to support dividend payout ratio |
Done |
|
|
|
|
Refreshed tax basis reduces tax friction on transactions driving more efficient capital allocation |
Done |
|
|
|
|
Committed focus on ESG |
Done |
|
|
|
|
Strong growth from economic expansion, portfolio management, and accretive acquisitions of properties with upside from AIR operations |
Done |
|
|
|
|
Strong, flexible balance sheet with low cost of leverage |
Done |
|
|
|
|
Reduce net leverage to EBITDA to 5.5:1 |
Ahead of Plan |
|
|
|
10
Earnings Conference Call Information
Live Conference Call: |
Conference Call Replay: |
Friday, July 30, 2021 at 12:00 p.m. ET |
Replay available until October 30, 2021 |
Domestic Dial-In Number: 1-888-317-6003 |
Domestic Dial-In Number: 1-877-344-7529 |
International Dial-In Number: 1-412-317-6061 |
International Dial-In Number: 1-412-317-0088 |
Passcode: 9955051 |
Passcode: 10158457 |
Live webcast and replay: |
|
investors.aircommunities.com |
|
Supplemental Information
The full text of this Earnings Release and the Supplemental Information referenced in this release is available on AIR’s website at investors.aircommunities.com.
Glossary & Reconciliations of Non-GAAP Financial and Operating Measures
Financial and operating measures found in this Earnings Release and the Supplemental Information include certain financial measures used by AIR management that are measures not defined under accounting principles generally accepted in the United States (“GAAP”). Certain AIR terms and Non-GAAP measures are defined in the Glossary in the Supplemental Information and Non-GAAP measures reconciled to the most comparable GAAP measures.
About AIR
AIR is a real estate investment trust focused on the ownership and management of quality apartment communities located in the largest markets in the United States. AIR is one of the country’s largest owners and operators of apartments, with 96 communities in 12 states and the District of Columbia. AIR common shares are traded on the New York Stock Exchange under the ticker symbol AIRC, and are included in the S&P 400. For more information about AIR, please visit our website at www.aircommunities.com.
Contact
Beth Hagan
(303) 757-8101
investors@aircommunities.com
11
Forward-looking Statements
This Earnings Release and Supplemental Information contain forward-looking statements within the meaning of the federal securities laws, including, without limitation, statements regarding projected results and specifically forecasts of 2021 results, including but not limited to: NAREIT FFO, Pro forma FFO and selected components thereof; expectations regarding consumer demand, growth in revenue and strength of other performance metrics and models; expectations regarding sales of AIR apartment communities and the use of proceeds thereof; and AIR liquidity and leverage metrics. We caution investors not to place undue reliance on any such forward-looking statements.
These forward-looking statements are based on management’s judgment as of this date, which is subject to risks and uncertainties. Risks and uncertainties that could cause actual results to differ materially from our expectations include, but are not limited to: the effects of the coronavirus pandemic on AIR’s business and on the global and U.S. economies generally, and the ongoing, dynamic and uncertain nature and duration of the pandemic, all of which heightens the impact of the other risks and factors described herein, and the impact on entities in which AIR holds a partial interest, and the impact of governmental lockdowns on AIR’s residents, commercial tenants, and operations; real estate and operating risks, including fluctuations in real estate values and the general economic climate in the markets in which we operate and competition for residents in such markets; national and local economic conditions, including the pace of job growth and the level of unemployment; the amount, location and quality of competitive new housing supply; the timing and effects of acquisitions and dispositions; changes in operating costs, including energy costs; negative economic conditions in our geographies of operation; loss of key personnel; AIR’s ability to maintain current or meet projected occupancy, rental rate and property operating results; expectations regarding sales of apartment communities and the use of proceeds thereof; insurance risks, including the cost of insurance, and natural disasters and severe weather such as hurricanes; financing risks, including the availability and cost of financing; the risk that cash flows from operations may be insufficient to meet required payments of principal and interest; the risk that earnings may not be sufficient to maintain compliance with debt covenants, including financial coverage ratios; legal and regulatory risks, including costs associated with prosecuting or defending claims and any adverse outcomes; the terms of laws and governmental regulations that affect us and interpretations of those laws and regulations; possible environmental liabilities, including costs, fines or penalties that may be incurred due to necessary remediation of contamination of apartment communities presently or previously owned by AIR; Aimco’s and AIR’s relationship with each other after the business separation; the ability and willingness of Aimco and AIR and their subsidiaries to meet and/or perform their obligations under any contractual arrangements that were entered into among the parties in connection with the business separation and any of their obligations to indemnify, defend and hold the other party harmless from and against various claims, litigation and liabilities; and the ability to achieve some or all the benefits that we expect to achieve from the business separation; and such other risks and uncertainties described from time to time in filings by AIR with the Securities and Exchange Commission (“SEC”).
In addition, AIR’s current and continuing qualification as a real estate investment trust involves the application of highly technical and complex provisions of the Internal Revenue Code, as amended (the “Code”), and depends on AIR’s ability to meet the various requirements imposed by the Code, through actual operating results, distribution levels and diversity of stock ownership.
Readers should carefully review AIRs financial statements and the notes thereto, as well as the section entitled “Risk Factors” in Item 1A of AIR’s Annual Report on Form 10-K for the year ended December 31, 2020, and subsequent documents AIR files from time to time with the SEC. Readers should also carefully review the “Risk Factors” section of the registration statements relating to the business separation, that have been filed with the Securities and Exchange Commission. These filings identify and address other important risks and uncertainties that could cause actual events and results to differ materially from those contained in the forward-looking statements.
These forward-looking statements reflect management’s judgment as of this date, and AIR assumes no obligation to revise or update them to reflect future events or circumstances. This earnings release does not constitute an offer of securities for sale.
12
Consolidated Statements of Operations (Page 1 of 2)
(in thousands, except per share data) (unaudited)
The separation resulted in Aimco being presented as the predecessor for AIR’s financial statements. This presentation is in accordance with GAAP and is due primarily to the relative significance of AIR’s business as compared to Aimco before the separation. The financial results prior to the separation on December 15, 2020, include the financial results of AIR’s predecessor, and the financial results attributable to the apartment communities retained by Aimco in the separation are presented as discontinued operations.
|
|
Three Months Ended |
|
|
Six Months Ended |
|
||||||||||
|
|
June 30, |
|
|
June 30, |
|
||||||||||
|
|
2021 |
|
|
2020 |
|
|
2021 |
|
|
2020 |
|
||||
REVENUES |
|
|
|
|
|
|
|
|
|
|
|
|
||||
Rental and other property revenues (1) |
|
$ |
176,721 |
|
|
$ |
181,643 |
|
|
$ |
351,451 |
|
|
$ |
367,686 |
|
Other revenues |
|
|
1,612 |
|
|
|
— |
|
|
|
3,295 |
|
|
|
— |
|
Total revenues |
|
|
178,333 |
|
|
|
181,643 |
|
|
|
354,746 |
|
|
|
367,686 |
|
|
|
|
|
|
|
|
|
|
|
|
|
|
||||
OPERATING EXPENSES |
|
|
|
|
|
|
|
|
|
|
|
|
||||
Property operating expenses (1) |
|
|
64,758 |
|
|
|
63,959 |
|
|
|
129,375 |
|
|
|
129,921 |
|
Depreciation and amortization |
|
|
75,791 |
|
|
|
78,949 |
|
|
|
151,071 |
|
|
|
160,395 |
|
General and administrative expenses (2) |
|
|
5,221 |
|
|
|
7,566 |
|
|
|
9,635 |
|
|
|
15,055 |
|
Other expenses, net |
|
|
2,515 |
|
|
|
4,156 |
|
|
|
5,391 |
|
|
|
5,647 |
|
Total operating expenses |
|
|
148,285 |
|
|
|
154,630 |
|
|
|
295,472 |
|
|
|
311,018 |
|
Interest income (3) |
|
|
15,684 |
|
|
|
2,303 |
|
|
|
31,656 |
|
|
|
6,292 |
|
Interest expense, including prepayment penalties (4) |
|
|
(70,807 |
) |
|
|
(44,239 |
) |
|
|
(107,842 |
) |
|
|
(81,045 |
) |
Gain on derecognition of leased properties and dispositions |
|
|
3,353 |
|
|
|
47,282 |
|
|
|
87,385 |
|
|
|
47,295 |
|
Mezzanine investment income, net (5) |
|
|
— |
|
|
|
6,936 |
|
|
|
— |
|
|
|
13,683 |
|
Income (loss) from continuing operations before income tax (expense) |
|
|
(21,722 |
) |
|
|
39,295 |
|
|
|
70,473 |
|
|
|
42,893 |
|
Income tax (expense) benefit |
|
|
2,035 |
|
|
|
783 |
|
|
|
(1,045 |
) |
|
|
2,097 |
|
Income (loss) from continuing operations |
|
|
(19,687 |
) |
|
|
40,078 |
|
|
|
69,428 |
|
|
|
44,990 |
|
Income (loss) from discontinued operations, net of tax |
|
|
— |
|
|
|
3,126 |
|
|
|
— |
|
|
|
7,191 |
|
Net income (loss) |
|
|
(19,687 |
) |
|
|
43,204 |
|
|
|
69,428 |
|
|
|
52,181 |
|
Noncontrolling interests: |
|
|
|
|
|
|
|
|
|
|
|
|
||||
Net (income) loss attributable to noncontrolling interests in consolidated real estate partnerships |
|
|
2,397 |
|
|
|
17 |
|
|
|
2,632 |
|
|
|
(1 |
) |
Net income attributable to preferred noncontrolling interests in AIR OP |
|
|
(1,603 |
) |
|
|
(1,859 |
) |
|
|
(3,207 |
) |
|
|
(3,728 |
) |
Net (income) loss attributable to common noncontrolling interests in AIR OP |
|
|
945 |
|
|
|
(2,107 |
) |
|
|
(3,491 |
) |
|
|
(2,475 |
) |
Net (income) loss attributable to noncontrolling interests |
|
|
1,739 |
|
|
|
(3,949 |
) |
|
|
(4,066 |
) |
|
|
(6,204 |
) |
Net income (loss) attributable to AIR |
|
|
(17,948 |
) |
|
|
39,255 |
|
|
|
65,362 |
|
|
|
45,977 |
|
Net income attributable to AIR preferred stockholders |
|
|
(43 |
) |
|
|
— |
|
|
|
(93 |
) |
|
|
— |
|
Net income attributable to participating securities |
|
|
(39 |
) |
|
|
(43 |
) |
|
|
(103 |
) |
|
|
(86 |
) |
Net income (loss) attributable to AIR common stockholders |
|
$ |
(18,030 |
) |
|
$ |
39,212 |
|
|
$ |
65,166 |
|
|
$ |
45,891 |
|
|
|
|
|
|
|
|
|
|
|
|
|
|
||||
Earnings (loss) per common share – basic and diluted: |
|
|
|
|
|
|
|
|
|
|
|
|
||||
Income (loss) from continuing operations attributable to AIR per common share |
|
$ |
(0.12 |
) |
|
$ |
0.30 |
|
|
$ |
0.43 |
|
|
$ |
0.32 |
|
Income from discontinued operations attributable to AIR per common share |
|
|
— |
|
|
|
0.03 |
|
|
|
— |
|
|
|
0.06 |
|
Net income (loss) attributable to AIR common stockholders per share – basic and diluted |
|
$ |
(0.12 |
) |
|
$ |
0.33 |
|
|
$ |
0.43 |
|
|
$ |
0.38 |
|
|
|
|
|
|
|
|
|
|
|
|
|
|
||||
Weighted-average common shares outstanding – basic (6) |
|
|
154,608 |
|
|
|
119,959 |
|
|
|
151,609 |
|
|
|
119,953 |
|
Weighted-average common shares outstanding – diluted (6) |
|
|
154,608 |
|
|
|
119,974 |
|
|
|
152,083 |
|
|
|
120,068 |
|
Please see the following page for footnote descriptions.
13
Consolidated Statements of Operations (continued) (Page 2 of 2)
14
Consolidated Balance Sheets
(in thousands) (unaudited)
|
|
June 30, |
|
|
December 31, |
|
||
|
|
2021 |
|
|
2020 |
|
||
Assets |
|
|
|
|
|
|
||
Real estate |
|
$ |
7,258,778 |
|
|
$ |
7,468,864 |
|
Accumulated depreciation |
|
|
(2,510,690 |
) |
|
|
(2,455,505 |
) |
Net real estate |
|
|
4,748,088 |
|
|
|
5,013,359 |
|
Cash and cash equivalents |
|
|
59,401 |
|
|
|
44,214 |
|
Restricted cash |
|
|
21,300 |
|
|
|
29,266 |
|
Notes receivable from Aimco |
|
|
534,127 |
|
|
|
534,127 |
|
Leased real estate assets |
|
|
479,441 |
|
|
|
— |
|
Goodwill |
|
|
32,286 |
|
|
|
32,286 |
|
Other assets (1) |
|
|
555,189 |
|
|
|
576,026 |
|
Total Assets |
|
$ |
6,429,832 |
|
|
$ |
6,229,278 |
|
|
|
|
|
|
|
|
||
Liabilities and Equity |
|
|
|
|
|
|
||
Non-recourse property debt |
|
$ |
3,079,576 |
|
|
$ |
3,646,093 |
|
Debt issue costs |
|
|
(14,773 |
) |
|
|
(17,857 |
) |
Non-recourse property debt, net |
|
|
3,064,803 |
|
|
|
3,628,236 |
|
Term loans, net |
|
|
796,658 |
|
|
|
349,164 |
|
Revolving credit facility borrowings |
|
|
347,200 |
|
|
|
265,600 |
|
Accrued liabilities and other (1) |
|
|
570,040 |
|
|
|
598,736 |
|
Total Liabilities |
|
|
4,778,701 |
|
|
|
4,841,736 |
|
|
|
|
|
|
|
|
||
Preferred noncontrolling interests in AIR OP |
|
|
79,375 |
|
|
|
79,449 |
|
|
|
|
|
|
|
|
||
Equity: |
|
|
|
|
|
|
||
Perpetual preferred stock |
|
|
2,000 |
|
|
|
2,000 |
|
Class A Common Stock |
|
|
1,569 |
|
|
|
1,489 |
|
Additional paid-in capital |
|
|
3,773,173 |
|
|
|
3,432,121 |
|
Accumulated other comprehensive income |
|
|
— |
|
|
|
3,039 |
|
Distributions in excess of earnings |
|
|
(2,197,843 |
) |
|
|
(2,131,798 |
) |
Total AIR equity |
|
|
1,578,899 |
|
|
|
1,306,851 |
|
Noncontrolling interests in consolidated real estate partnerships |
|
|
(67,531 |
) |
|
|
(61,943 |
) |
Common noncontrolling interests in AIR OP |
|
|
60,388 |
|
|
|
63,185 |
|
Total Equity |
|
|
1,571,756 |
|
|
|
1,308,093 |
|
Total Liabilities and Equity |
|
$ |
6,429,832 |
|
|
$ |
6,229,278 |
|
15
Supplemental Schedule 1
Funds From Operations Reconciliation |
|
Three and Six Months Ended June 30, 2021
(in thousands, except per share data) (unaudited)
|
|
Three Months Ended |
|
|
Six Months Ended |
|
||
|
|
2021 |
|
|
2021 |
|
||
Net income (loss) attributable to AIR common stockholders |
|
$ |
(18,030 |
) |
|
$ |
65,166 |
|
Adjustments: |
|
|
|
|
|
|
||
Real estate depreciation and amortization, net of noncontrolling partners’ interest |
|
|
69,588 |
|
|
|
139,083 |
|
Gain on dispositions and derecognition of leased properties (1) |
|
|
(3,353 |
) |
|
|
(87,385 |
) |
Income tax adjustments related to gain on dispositions and other |
|
|
(1,528 |
) |
|
|
272 |
|
Common noncontrolling interests in AIR OP’s share of above adjustments |
|
|
(3,217 |
) |
|
|
(2,573 |
) |
Amounts allocable to participating securities |
|
|
(7 |
) |
|
|
— |
|
NAREIT FFO attributable to AIR common stockholders |
|
$ |
43,453 |
|
|
$ |
114,563 |
|
Adjustments, all net of common noncontrolling interests in AIR OP and participating securities: |
|
|
|
|
|
|
||
Separation costs (2) |
|
|
285 |
|
|
|
2,342 |
|
Prepayment penalties (3) |
|
|
36,047 |
|
|
|
36,990 |
|
Non-cash straight-line rent (4) |
|
|
635 |
|
|
|
1,270 |
|
Incremental cash received from leased properties (1) |
|
|
140 |
|
|
|
294 |
|
Pro Forma FFO |
|
$ |
80,560 |
|
|
$ |
155,459 |
|
|
|
|
|
|
|
|
||
Weighted-average common shares outstanding – basic |
|
|
154,608 |
|
|
|
151,609 |
|
Dilutive common share equivalents |
|
|
504 |
|
|
|
474 |
|
Total shares and dilutive share equivalents |
|
|
155,112 |
|
|
|
152,083 |
|
|
|
|
|
|
|
|
||
Net income (loss) attributable to AIR per common share – basic and diluted |
|
$ |
(0.12 |
) |
|
$ |
0.43 |
|
NAREIT FFO per share – diluted |
|
$ |
0.28 |
|
|
$ |
0.75 |
|
Pro forma FFO per share – diluted |
|
$ |
0.52 |
|
|
$ |
1.02 |
|
16
Supplemental Schedule 2(a)
Funds From Operations Information |
|
Three and Six Months Ended June 30, 2021
(consolidated amounts, in thousands) (unaudited)
|
|
Three Months Ended June 30, 2021 |
|
|
Six Months Ended June 30, 2021 |
|
||
Revenues, before utility reimbursements |
|
|
|
|
|
|
||
Same Store |
|
$ |
167,287 |
|
|
$ |
333,404 |
|
Other Real Estate (1) |
|
|
2,395 |
|
|
|
4,106 |
|
Total revenues, before utility reimbursements |
|
|
169,682 |
|
|
|
337,510 |
|
Expenses, net of utility reimbursements |
|
|
|
|
|
|
||
Same Store |
|
|
48,916 |
|
|
|
96,526 |
|
Other Real Estate (1) |
|
|
1,355 |
|
|
|
2,570 |
|
Total expenses, net of utility reimbursements |
|
|
50,271 |
|
|
|
99,096 |
|
Net operating income |
|
|
119,411 |
|
|
|
238,414 |
|
Lease income |
|
|
6,457 |
|
|
|
12,898 |
|
Property management expenses, net |
|
|
(5,250 |
) |
|
|
(11,588 |
) |
Property income |
|
|
120,618 |
|
|
|
239,724 |
|
|
|
|
|
|
|
|
||
General and administrative expenses (2) |
|
|
(3,142 |
) |
|
|
(7,556 |
) |
|
|
|
|
|
|
|
||
Interest expense, including prepayment penalties |
|
|
(70,807 |
) |
|
|
(107,842 |
) |
Preferred dividends |
|
|
(1,646 |
) |
|
|
(3,300 |
) |
Interest income from note receivable from Aimco |
|
|
6,944 |
|
|
|
13,889 |
|
Interest income |
|
|
2,283 |
|
|
|
4,869 |
|
Total cost of capital |
|
|
(63,226 |
) |
|
|
(92,384 |
) |
|
|
|
|
|
|
|
||
Casualties |
|
|
(585 |
) |
|
|
(1,457 |
) |
Depreciation and amortization related to non-real estate assets |
|
|
(869 |
) |
|
|
(1,385 |
) |
Land leases |
|
|
(1,321 |
) |
|
|
(2,634 |
) |
Other expenses, net |
|
|
(1,194 |
) |
|
|
(2,757 |
) |
Tax (expense) benefit, net |
|
|
505 |
|
|
|
(770 |
) |
Total other |
|
|
(3,464 |
) |
|
|
(9,003 |
) |
|
|
|
|
|
|
|
||
Common noncontrolling interests in AIR OP |
|
|
(2,318 |
) |
|
|
(6,167 |
) |
Proportionate adjustments |
|
|
(5,015 |
) |
|
|
(10,051 |
) |
|
|
|
|
|
|
|
||
NAREIT FFO attributable to AIR common stockholders |
|
$ |
43,453 |
|
|
$ |
114,563 |
|
Total pro forma adjustments, net of common noncontrolling interests in |
|
|
37,107 |
|
|
|
40,896 |
|
Pro forma FFO attributable to AIR common stockholders |
|
$ |
80,560 |
|
|
$ |
155,459 |
|
17
Supplemental Schedule 2(b)
Partially Owned Entities
Three and Six Months Ended June 30, 2021 Compared to Three and Six Months Ended June 30, 2020
(proportionate amounts, in thousands) (unaudited)
|
|
Noncontrolling Interests (1) |
|
|||||||||||||
|
|
Three Months Ended |
|
|
Six Months Ended |
|
||||||||||
|
|
2021 |
|
|
2020 |
|
|
2021 |
|
|
2020 |
|
||||
Revenues, before utility reimbursements |
|
$ |
13,133 |
|
|
$ |
650 |
|
|
$ |
26,253 |
|
|
$ |
1,328 |
|
Expenses, net of utility reimbursements |
|
|
3,783 |
|
|
|
178 |
|
|
|
7,444 |
|
|
|
359 |
|
Net operating income |
|
|
9,350 |
|
|
|
472 |
|
|
|
18,809 |
|
|
|
969 |
|
|
|
|
|
|
|
|
|
|
|
|
|
|
||||
Property management expenses, net |
|
|
(409 |
) |
|
|
(29 |
) |
|
|
(817 |
) |
|
|
(60 |
) |
Casualties |
|
|
(13 |
) |
|
|
— |
|
|
|
(70 |
) |
|
|
(2 |
) |
Other expense, net |
|
|
(23 |
) |
|
|
(2 |
) |
|
|
(29 |
) |
|
|
(5 |
) |
Interest expense on non-recourse property debt |
|
|
(3,828 |
) |
|
|
(146 |
) |
|
|
(7,711 |
) |
|
|
(292 |
) |
Contribution from real estate operations |
|
|
5,077 |
|
|
|
295 |
|
|
|
10,182 |
|
|
|
610 |
|
|
|
|
|
|
|
|
|
|
|
|
|
|
||||
Other non-property expenses, net |
|
|
(62 |
) |
|
|
(17 |
) |
|
|
(131 |
) |
|
|
(31 |
) |
FFO from real estate operations |
|
$ |
5,015 |
|
|
$ |
278 |
|
|
$ |
10,051 |
|
|
$ |
579 |
|
|
|
|
|
|
|
|
|
|
|
|
|
|
||||
Total apartment communities |
|
|
16 |
|
|
|
4 |
|
|
|
|
|
|
|
||
Total apartment homes |
|
|
5,369 |
|
|
|
2,016 |
|
|
|
|
|
|
|
||
Noncontrolling interests’ share of consolidated apartment homes |
|
|
1,721 |
|
|
|
142 |
|
|
|
|
|
|
|
||
18
Supplemental Schedule 3
Property Net Operating Income
Trailing Five Quarters
(consolidated amounts, in thousands) (unaudited)
The table below presents the operating results of AIR’s 96 property portfolio in consolidated amounts not adjusted for noncontrolling interest.
|
|
Three Months Ended |
|
|||||||||||||||||
|
|
June 30, 2021 |
|
|
March 31, 2021 |
|
|
December 31, 2020 |
|
|
September 30, 2020 |
|
|
June 30, 2020 |
|
|||||
Revenues, before utility reimbursements |
|
|
|
|
|
|
|
|
|
|
|
|
|
|
|
|||||
|
|
|
|
|
|
|
|
|
|
|
|
|
|
|
|
|||||
Same Store |
|
$ |
167,287 |
|
|
$ |
166,117 |
|
|
$ |
163,585 |
|
|
$ |
166,822 |
|
|
$ |
171,042 |
|
|
|
|
|
|
|
|
|
|
|
|
|
|
|
|
|
|||||
Other Real Estate (1) |
|
|
2,395 |
|
|
|
1,711 |
|
|
|
2,710 |
|
|
|
2,012 |
|
|
|
1,638 |
|
|
|
|
|
|
|
|
|
|
|
|
|
|
|
|
|
|||||
Total revenues, before utility reimbursements |
|
|
169,682 |
|
|
|
167,828 |
|
|
|
166,295 |
|
|
|
168,834 |
|
|
|
172,680 |
|
|
|
|
|
|
|
|
|
|
|
|
|
|
|
|
|
|||||
Expenses, net of utility reimbursements |
|
|
|
|
|
|
|
|
|
|
|
|
|
|
|
|||||
|
|
|
|
|
|
|
|
|
|
|
|
|
|
|
|
|||||
Same Store |
|
|
48,916 |
|
|
|
47,610 |
|
|
|
48,160 |
|
|
|
48,836 |
|
|
|
46,577 |
|
|
|
|
|
|
|
|
|
|
|
|
|
|
|
|
|
|||||
Other Real Estate (1) |
|
|
1,355 |
|
|
|
1,215 |
|
|
|
2,161 |
|
|
|
1,985 |
|
|
|
1,853 |
|
|
|
|
|
|
|
|
|
|
|
|
|
|
|
|
|
|||||
Total expenses, net of utility reimbursements |
|
|
50,271 |
|
|
|
48,825 |
|
|
|
50,321 |
|
|
|
50,821 |
|
|
|
48,430 |
|
|
|
|
|
|
|
|
|
|
|
|
|
|
|
|
|
|||||
Property Net Operating Income |
|
|
|
|
|
|
|
|
|
|
|
|
|
|
|
|||||
|
|
|
|
|
|
|
|
|
|
|
|
|
|
|
|
|||||
Same Store |
|
|
118,371 |
|
|
|
118,507 |
|
|
|
115,425 |
|
|
|
117,986 |
|
|
|
124,465 |
|
|
|
|
|
|
|
|
|
|
|
|
|
|
|
|
|
|||||
Other Real Estate (1) |
|
|
1,040 |
|
|
|
496 |
|
|
|
549 |
|
|
|
27 |
|
|
|
(215 |
) |
|
|
|
|
|
|
|
|
|
|
|
|
|
|
|
|
|||||
Total Property Net Operating Income |
|
$ |
119,411 |
|
|
$ |
119,003 |
|
|
$ |
115,974 |
|
|
$ |
118,013 |
|
|
$ |
124,250 |
|
19
Supplemental Schedule 4
Apartment Home Summary
As of June 30, 2021
(unaudited)
|
|
Number of Apartment Communities |
|
|
Number of Apartment Homes |
|
|
AIR Share of Apartment Homes |
|
|||
|
|
|
|
|
|
|
|
|
|
|||
Same Store |
|
|
92 |
|
|
|
25,427 |
|
|
|
23,706 |
|
Other Real Estate |
|
|
4 |
|
|
|
995 |
|
|
|
995 |
|
Total Portfolio |
|
|
96 |
|
|
|
26,422 |
|
|
|
24,701 |
|
|
|
|
|
|
|
|
|
|
|
|||
Properties Currently Leased to Aimco (1) |
|
|
4 |
|
|
|
865 |
|
|
|
865 |
|
20
Supplemental Schedule 5(a)
Capitalization and Financial Metrics
As of June 30, 2021
(dollars in thousands) (unaudited)
Leverage Balances and Characteristics
Debt |
|
Consolidated |
|
|
Noncontrolling |
|
|
Total |
|
|
Weighted- |
|
|
Weighted- |
|
|||||
Fixed rate loans payable |
|
$ |
3,065,071 |
|
|
$ |
(478,231 |
) |
|
$ |
2,586,840 |
|
|
|
8.9 |
|
|
|
3.5 |
% |
Floating rate tax-exempt bonds |
|
|
14,505 |
|
|
|
(1 |
) |
|
|
14,504 |
|
|
|
12.0 |
|
|
|
1.0 |
% |
Total non-recourse property debt |
|
$ |
3,079,576 |
|
|
$ |
(478,232 |
) |
|
$ |
2,601,344 |
|
|
|
8.9 |
|
|
|
3.5 |
% |
|
|
|
|
|
|
|
|
|
|
|
|
|
|
|
|
|||||
Term Loans |
|
|
800,000 |
|
|
|
— |
|
|
|
800,000 |
|
|
|
4.5 |
|
(1) |
|
1.6 |
% |
Revolving credit facility borrowings |
|
|
347,200 |
|
|
|
— |
|
|
|
347,200 |
|
|
|
4.8 |
|
(1) |
|
1.1 |
% |
Preferred equity |
|
|
81,375 |
|
|
|
— |
|
|
|
81,375 |
|
|
|
9.9 |
|
(2) |
|
8.1 |
% |
Total leverage |
|
$ |
4,308,151 |
|
|
$ |
(478,232 |
) |
|
$ |
3,829,919 |
|
|
|
7.6 |
|
|
|
2.9 |
% |
|
|
|
|
|
|
|
|
|
|
|
|
|
|
|
|
|||||
Cash and restricted cash (3) |
|
|
(70,878 |
) |
|
|
4,305 |
|
|
|
(66,573 |
) |
|
|
|
|
n/a |
|
||
Notes receivable from Aimco (4) |
|
|
(534,127 |
) |
|
|
— |
|
|
|
(534,127 |
) |
|
|
|
|
|
5.2 |
% |
|
Net leverage |
|
$ |
3,703,146 |
|
|
$ |
(473,927 |
) |
|
$ |
3,229,219 |
|
|
|
|
|
|
2.6 |
% |
|
Leverage Ratios Second Quarter 2021 (5)
|
|
Annualized Current Quarter |
Proportionate Debt to Adjusted EBITDAre |
|
7.1x |
Net Leverage to Adjusted EBITDAre |
|
7.3x |
|
|
|
|
|
Unsecured Credit Facility Covenants |
|
June 30, 2021 |
|
Covenant |
Fixed Charge Coverage Ratio |
|
2.00x |
|
1.50x |
Leverage Ratio |
|
46.2% |
|
≤ 60.0% |
Secured Indebtedness Ratio (6) |
|
31.8% |
|
≤ 45.0% |
Unsecured Leverage Ratio |
|
40.1% |
|
≤ 60.0% |
21
Supplemental Schedule 5(b)
Capitalization and Financial Metrics
As of June 30, 2021
(dollar amounts in thousands) (unaudited)
AIR Share of Non-Recourse Property Debt and Term Loans
|
|
Amortization |
|
|
Maturities |
|
|
Sub-Total Non-Recourse Property Debt |
|
|
Term Loans |
|
|
Total |
|
|
Maturities as a |
|
|
Average Rate on |
|
|||||||
2021 Q3 |
|
$ |
11,511 |
|
|
$ |
— |
|
|
$ |
11,511 |
|
|
$ |
— |
|
|
$ |
11,511 |
|
|
|
— |
% |
|
|
— |
% |
2021 Q4 |
|
|
12,136 |
|
|
|
— |
|
|
|
12,136 |
|
|
|
— |
|
|
|
12,136 |
|
|
|
— |
% |
|
|
— |
% |
Total 2021 |
|
|
23,647 |
|
|
|
— |
|
|
|
23,647 |
|
|
|
— |
|
|
|
23,647 |
|
|
|
— |
% |
|
|
— |
% |
|
|
|
|
|
|
|
|
|
|
|
|
|
|
|
|
|
|
|
|
|
|
|||||||
2022 Q1 |
|
|
12,252 |
|
|
|
— |
|
|
|
12,252 |
|
|
|
— |
|
|
|
12,252 |
|
|
|
— |
% |
|
|
— |
% |
2022 Q2 |
|
|
12,337 |
|
|
|
— |
|
|
|
12,337 |
|
|
|
— |
|
|
|
12,337 |
|
|
|
— |
% |
|
|
— |
% |
2022 Q3 |
|
|
12,445 |
|
|
|
— |
|
|
|
12,445 |
|
|
|
— |
|
|
|
12,445 |
|
|
|
— |
% |
|
|
— |
% |
2022 Q4 |
|
|
12,290 |
|
|
|
110,434 |
|
|
|
122,724 |
|
|
|
— |
|
|
|
122,724 |
|
|
|
3.25 |
% |
|
|
4.4 |
% |
Total 2022 |
|
|
49,324 |
|
|
|
110,434 |
|
|
|
159,758 |
|
|
|
— |
|
|
|
159,758 |
|
|
|
3.25 |
% |
|
|
4.4 |
% |
|
|
|
|
|
|
|
|
|
|
|
|
|
|
|
|
|
|
|
|
|
|
|||||||
2023 |
|
|
47,865 |
|
|
|
49,860 |
|
|
|
97,725 |
|
|
|
— |
|
|
|
97,725 |
|
|
|
1.47 |
% |
|
|
3.9 |
% |
2024 |
|
|
48,898 |
|
|
|
— |
|
|
|
48,898 |
|
|
|
— |
|
|
|
48,898 |
|
|
|
— |
% |
|
|
— |
% |
2025 |
|
|
48,827 |
|
|
|
269,411 |
|
|
|
318,238 |
|
|
|
600,000 |
|
(1) |
|
918,238 |
|
|
|
25.56 |
% |
|
|
2.1 |
% |
2026 |
|
|
42,478 |
|
|
|
198,205 |
|
|
|
240,683 |
|
|
|
200,000 |
|
|
|
440,683 |
|
|
|
11.71 |
% |
|
|
2.6 |
% |
2027 |
|
|
35,425 |
|
|
|
225,249 |
|
|
|
260,674 |
|
|
|
— |
|
|
|
260,674 |
|
|
|
6.62 |
% |
|
|
3.5 |
% |
2028 |
|
|
32,312 |
|
|
|
210,778 |
|
|
|
243,090 |
|
|
|
— |
|
|
|
243,090 |
|
|
|
6.20 |
% |
|
|
3.8 |
% |
2029 |
|
|
22,897 |
|
|
|
236,239 |
|
|
|
259,136 |
|
|
|
— |
|
|
|
259,136 |
|
|
|
6.95 |
% |
|
|
4.3 |
% |
2030 |
|
|
20,338 |
|
|
|
328,920 |
|
|
|
349,258 |
|
|
|
— |
|
|
|
349,258 |
|
|
|
9.67 |
% |
|
|
3.1 |
% |
Thereafter |
|
|
149,913 |
|
|
|
450,324 |
|
|
|
600,237 |
|
|
|
— |
|
|
|
600,237 |
|
|
|
13.24 |
% |
|
|
3.1 |
% |
Total |
|
$ |
521,924 |
|
|
$ |
2,079,420 |
|
|
$ |
2,601,344 |
|
|
$ |
800,000 |
|
|
$ |
3,401,344 |
|
|
|
84.66 |
% |
|
|
3.0 |
% |
(1) Amount shown is assuming exercise of extension options.
Preferred Equity
|
|
Amount Outstanding |
|
|
Date First Available for Redemption by AIR |
|
Coupon |
|
|
Amount |
|
|||
Class A Perpetual Preferred Stock |
|
|
20 |
|
|
December 2025 |
|
|
8.50 |
% |
|
$ |
2,000 |
|
Preferred Partnership Units |
|
|
2,935,920 |
|
|
n/a |
|
|
8.08 |
% |
|
|
79,375 |
|
Total Preferred Equity |
|
|
|
|
|
|
|
8.09 |
% |
|
$ |
81,375 |
|
|
Common Stock, Partnership Units and Equivalents (shares and units in thousands)
|
|
June 30, |
|
|
Class A Common Stock outstanding |
|
|
156,534 |
|
Participating unvested restricted stock |
|
|
115 |
|
Dilutive options, share equivalents and non-participating unvested restricted stock |
|
|
602 |
|
Total shares and dilutive share equivalents |
|
|
157,251 |
|
Common Partnership Units and equivalents outstanding |
|
|
8,065 |
|
Total shares, units, and dilutive share equivalents |
|
|
165,316 |
|
22
Supplemental Schedule 6(a)
Same Store Operating Results
Three Months Ended June 30, 2021 Compared to Three Months Ended June 30, 2020
(proportionate amounts, in thousands, except community, home, and per home data) (unaudited)
The table below presents AIR’s Same Store portfolio as of June 30, 2021.
|
|
|
|
|
|
|
|
Revenues, Before Utility |
|
|
Expenses, Net of Utility |
|
|
Net Operating Income |
|
|
|
Net Operating |
|
Average Daily |
|
Average |
|
|||||||||||||||||||||||||||||
|
Apartment |
|
Apartment |
|
AIR Share |
|
|
2Q |
|
2Q |
|
Growth |
|
|
2Q |
|
2Q |
|
Growth |
|
|
2Q |
|
2Q |
|
Growth |
|
|
|
2Q |
|
2Q |
2Q |
|
2Q |
|
2Q |
|
||||||||||||||
|
|
|
|
|
|
|
|
|
|
|
|
|
|
|
|
|
|
|
|
|
|
|
|
|
|
|
|
|
|
|
|
|
|
|
|
|
|
|
||||||||||||||
Bay Area |
|
9 |
|
|
2,212 |
|
|
1,657 |
|
|
$ |
13,883 |
|
$ |
15,115 |
|
|
(8.2 |
%) |
|
$ |
3,744 |
|
$ |
3,511 |
|
|
6.6 |
% |
|
$ |
10,139 |
|
$ |
11,604 |
|
|
(12.6 |
%) |
|
|
73.0% |
|
94.6% |
95.7% |
|
$ |
2,952 |
|
$ |
3,176 |
|
|
|
|
|
|
|
|
|
|
|
|
|
|
|
|
|
|
|
|
|
|
|
|
|
|
|
|
|
|
|
|
|
|
|
|
|
|
|
|
||||||||||||||
Boston |
|
11 |
|
|
2,462 |
|
|
2,462 |
|
|
|
16,745 |
|
|
17,146 |
|
|
(2.3 |
%) |
|
|
5,132 |
|
|
5,063 |
|
|
1.4 |
% |
|
|
11,613 |
|
|
12,083 |
|
|
(3.9 |
%) |
|
|
69.4% |
|
95.7% |
95.5% |
|
|
2,369 |
|
|
2,431 |
|
|
|
|
|
|
|
|
|
|
|
|
|
|
|
|
|
|
|
|
|
|
|
|
|
|
|
|
|
|
|
|
|
|
|
|
|
|
|
|
||||||||||||||
Denver |
|
7 |
|
|
2,026 |
|
|
1,987 |
|
|
|
10,445 |
|
|
9,500 |
|
|
9.9 |
% |
|
|
3,056 |
|
|
2,583 |
|
|
18.3 |
% |
|
|
7,389 |
|
|
6,917 |
|
|
6.8 |
% |
|
|
70.7% |
|
95.4% |
90.7% |
|
|
1,837 |
|
|
1,756 |
|
|
|
|
|
|
|
|
|
|
|
|
|
|
|
|
|
|
|
|
|
|
|
|
|
|
|
|
|
|
|
|
|
|
|
|
|
|
|
|
||||||||||||||
Greater Washington, DC |
|
11 |
|
|
5,238 |
|
|
5,215 |
|
|
|
24,919 |
|
|
25,099 |
|
|
(0.7 |
%) |
|
|
7,037 |
|
|
6,773 |
|
|
3.9 |
% |
|
|
17,882 |
|
|
18,326 |
|
|
(2.4 |
%) |
|
|
71.8% |
|
95.7% |
96.6% |
|
|
1,664 |
|
|
1,661 |
|
|
|
|
|
|
|
|
|
|
|
|
|
|
|
|
|
|
|
|
|
|
|
|
|
|
|
|
|
|
|
|
|
|
|
|
|
|
|
|
||||||||||||||
Los Angeles |
|
13 |
|
|
4,347 |
|
|
3,498 |
|
|
|
28,293 |
|
|
30,409 |
|
|
(7.0 |
%) |
|
|
7,096 |
|
|
6,712 |
|
|
5.7 |
% |
|
|
21,197 |
|
|
23,697 |
|
|
(10.5 |
%) |
|
|
74.9% |
|
96.5% |
94.7% |
|
|
2,794 |
|
|
3,060 |
|
|
|
|
|
|
|
|
|
|
|
|
|
|
|
|
|
|
|
|
|
|
|
|
|
|
|
|
|
|
|
|
|
|
|
|
|
|
|
|
||||||||||||||
Miami |
|
5 |
|
|
1,725 |
|
|
1,725 |
|
|
|
11,585 |
|
|
10,646 |
|
|
8.8 |
% |
|
|
4,002 |
|
|
3,906 |
|
|
2.5 |
% |
|
|
7,583 |
|
|
6,740 |
|
|
12.5 |
% |
|
|
65.5% |
|
97.5% |
94.4% |
|
|
2,297 |
|
|
2,180 |
|
|
|
|
|
|
|
|
|
|
|
|
|
|
|
|
|
|
|
|
|
|
|
|
|
|
|
|
|
|
|
|
|
|
|
|
|
|
|
|
||||||||||||||
Philadelphia |
|
9 |
|
|
2,748 |
|
|
2,669 |
|
|
|
19,251 |
|
|
20,436 |
|
|
(5.8 |
%) |
|
|
6,082 |
|
|
5,611 |
|
|
8.4 |
% |
|
|
13,169 |
|
|
14,825 |
|
|
(11.2 |
%) |
|
|
68.4% |
|
91.3% |
95.3% |
|
|
2,633 |
|
|
2,677 |
|
|
|
|
|
|
|
|
|
|
|
|
|
|
|
|
|
|
|
|
|
|
|
|
|
|
|
|
|
|
|
|
|
|
|
|
|
|
|
|
||||||||||||||
San Diego |
|
9 |
|
|
3,051 |
|
|
2,875 |
|
|
|
18,132 |
|
|
17,545 |
|
|
3.3 |
% |
|
|
4,012 |
|
|
3,974 |
|
|
1.0 |
% |
|
|
14,120 |
|
|
13,571 |
|
|
4.0 |
% |
|
|
77.9% |
|
97.2% |
96.0% |
|
|
2,163 |
|
|
2,119 |
|
|
|
|
|
|
|
|
|
|
|
|
|
|
|
|
|
|
|
|
|
|
|
|
|
|
|
|
|
|
|
|
|
|
|
|
|
|
|
|
||||||||||||||
Other Markets |
|
18 |
|
|
1,618 |
|
|
1,618 |
|
|
|
10,901 |
|
|
11,236 |
|
|
(3.0 |
%) |
|
|
4,982 |
|
|
4,864 |
|
|
2.4 |
% |
|
|
5,919 |
|
|
6,372 |
|
|
(7.1 |
%) |
|
|
54.3% |
|
93.6% |
94.6% |
|
|
2,400 |
|
|
2,446 |
|
|
|
|
|
|
|
|
|
|
|
|
|
|
|
|
|
|
|
|
|
|
|
|
|
|
|
|
|
|
|
|
|
|
|
|
|
|
|
|
||||||||||||||
Total |
|
92 |
|
|
25,427 |
|
|
23,706 |
|
|
$ |
154,154 |
|
$ |
157,132 |
|
|
(1.9 |
%) |
|
$ |
45,143 |
|
$ |
42,997 |
|
|
5.0 |
% |
|
$ |
109,011 |
|
$ |
114,135 |
|
|
(4.5 |
%) |
|
|
70.7% |
|
95.4% |
95.1% |
|
$ |
2,272 |
|
$ |
2,322 |
|
23
Supplemental Schedule 6(b)
Same Store Operating Results
Three Months Ended June 30, 2021 Compared to Three Months Ended March 31, 2021
(proportionate amounts, in thousands, except community, home, and per home data) (unaudited)
The table below presents AIR’s Same Store portfolio as of June 30, 2021.
|
|
|
|
|
|
|
|
Revenues, Before Utility |
|
|
Expenses, Net of Utility |
|
|
Net Operating Income |
|
|
|
Net Operating |
|
Average Daily |
|
Average |
|
|||||||||||||||||||||||||||||
|
Apartment |
|
Apartment |
|
AIR Share |
|
|
2Q |
|
1Q |
|
Growth |
|
|
2Q |
|
1Q |
|
Growth |
|
|
2Q |
|
1Q |
|
Growth |
|
|
|
2Q |
|
2Q |
1Q |
|
2Q |
|
1Q |
|
||||||||||||||
|
|
|
|
|
|
|
|
|
|
|
|
|
|
|
|
|
|
|
|
|
|
|
|
|
|
|
|
|
|
|
|
|
|
|
|
|
|
|
||||||||||||||
Bay Area |
|
9 |
|
|
2,212 |
|
|
1,657 |
|
|
$ |
13,883 |
|
$ |
13,929 |
|
|
(0.3 |
%) |
|
$ |
3,744 |
|
$ |
3,680 |
|
|
1.7 |
% |
|
$ |
10,139 |
|
$ |
10,249 |
|
|
(1.1 |
%) |
|
|
73.0% |
|
94.6% |
92.4% |
|
$ |
2,952 |
|
$ |
3,033 |
|
|
|
|
|
|
|
|
|
|
|
|
|
|
|
|
|
|
|
|
|
|
|
|
|
|
|
|
|
|
|
|
|
|
|
|
|
|
|
|
||||||||||||||
Boston |
|
11 |
|
|
2,462 |
|
|
2,462 |
|
|
|
16,745 |
|
|
16,697 |
|
|
0.3 |
% |
|
|
5,132 |
|
|
5,340 |
|
|
(3.9 |
%) |
|
|
11,613 |
|
|
11,357 |
|
|
2.3 |
% |
|
|
69.4% |
|
95.7% |
96.6% |
|
|
2,369 |
|
|
2,339 |
|
|
|
|
|
|
|
|
|
|
|
|
|
|
|
|
|
|
|
|
|
|
|
|
|
|
|
|
|
|
|
|
|
|
|
|
|
|
|
|
||||||||||||||
Denver |
|
7 |
|
|
2,026 |
|
|
1,987 |
|
|
|
10,445 |
|
|
10,206 |
|
|
2.3 |
% |
|
|
3,056 |
|
|
2,708 |
|
|
12.9 |
% |
|
|
7,389 |
|
|
7,498 |
|
|
(1.5 |
%) |
|
|
70.7% |
|
95.4% |
96.0% |
|
|
1,837 |
|
|
1,784 |
|
|
|
|
|
|
|
|
|
|
|
|
|
|
|
|
|
|
|
|
|
|
|
|
|
|
|
|
|
|
|
|
|
|
|
|
|
|
|
|
||||||||||||||
Greater Washington, DC |
|
11 |
|
|
5,238 |
|
|
5,215 |
|
|
|
24,919 |
|
|
24,954 |
|
|
(0.1 |
%) |
|
|
7,037 |
|
|
6,676 |
|
|
5.4 |
% |
|
|
17,882 |
|
|
18,278 |
|
|
(2.2 |
%) |
|
|
71.8% |
|
95.7% |
96.6% |
|
|
1,664 |
|
|
1,651 |
|
|
|
|
|
|
|
|
|
|
|
|
|
|
|
|
|
|
|
|
|
|
|
|
|
|
|
|
|
|
|
|
|
|
|
|
|
|
|
|
||||||||||||||
Los Angeles |
|
13 |
|
|
4,347 |
|
|
3,498 |
|
|
|
28,293 |
|
|
28,445 |
|
|
(0.5 |
%) |
|
|
7,096 |
|
|
6,911 |
|
|
2.7 |
% |
|
|
21,197 |
|
|
21,534 |
|
|
(1.6 |
%) |
|
|
74.9% |
|
96.5% |
96.7% |
|
|
2,794 |
|
|
2,803 |
|
|
|
|
|
|
|
|
|
|
|
|
|
|
|
|
|
|
|
|
|
|
|
|
|
|
|
|
|
|
|
|
|
|
|
|
|
|
|
|
||||||||||||||
Miami |
|
5 |
|
|
1,725 |
|
|
1,725 |
|
|
|
11,585 |
|
|
11,206 |
|
|
3.4 |
% |
|
|
4,002 |
|
|
3,806 |
|
|
5.1 |
% |
|
|
7,583 |
|
|
7,400 |
|
|
2.5 |
% |
|
|
65.5% |
|
97.5% |
97.9% |
|
|
2,297 |
|
|
2,212 |
|
|
|
|
|
|
|
|
|
|
|
|
|
|
|
|
|
|
|
|
|
|
|
|
|
|
|
|
|
|
|
|
|
|
|
|
|
|
|
|
||||||||||||||
Philadelphia |
|
9 |
|
|
2,748 |
|
|
2,669 |
|
|
|
19,251 |
|
|
19,133 |
|
|
0.6 |
% |
|
|
6,082 |
|
|
5,819 |
|
|
4.5 |
% |
|
|
13,169 |
|
|
13,314 |
|
|
(1.1 |
%) |
|
|
68.4% |
|
91.3% |
90.4% |
|
|
2,633 |
|
|
2,644 |
|
|
|
|
|
|
|
|
|
|
|
|
|
|
|
|
|
|
|
|
|
|
|
|
|
|
|
|
|
|
|
|
|
|
|
|
|
|
|
|
||||||||||||||
San Diego |
|
9 |
|
|
3,051 |
|
|
2,875 |
|
|
|
18,132 |
|
|
17,815 |
|
|
1.8 |
% |
|
|
4,012 |
|
|
3,994 |
|
|
0.5 |
% |
|
|
14,120 |
|
|
13,821 |
|
|
2.2 |
% |
|
|
77.9% |
|
97.2% |
98.1% |
|
|
2,163 |
|
|
2,107 |
|
|
|
|
|
|
|
|
|
|
|
|
|
|
|
|
|
|
|
|
|
|
|
|
|
|
|
|
|
|
|
|
|
|
|
|
|
|
|
|
||||||||||||||
Other Markets |
|
18 |
|
|
1,618 |
|
|
1,618 |
|
|
|
10,901 |
|
|
10,608 |
|
|
2.8 |
% |
|
|
4,982 |
|
|
5,026 |
|
|
(0.9 |
%) |
|
|
5,919 |
|
|
5,582 |
|
|
6.0 |
% |
|
|
54.3% |
|
93.6% |
92.0% |
|
|
2,400 |
|
|
2,376 |
|
|
|
|
|
|
|
|
|
|
|
|
|
|
|
|
|
|
|
|
|
|
|
|
|
|
|
|
|
|
|
|
|
|
|
|
|
|
|
|
||||||||||||||
Total |
|
92 |
|
|
25,427 |
|
|
23,706 |
|
|
$ |
154,154 |
|
$ |
152,993 |
|
|
0.8 |
% |
|
$ |
45,143 |
|
$ |
43,960 |
|
|
2.7 |
% |
|
$ |
109,011 |
|
$ |
109,033 |
|
|
— |
% |
|
|
70.7% |
|
95.4% |
95.5% |
|
$ |
2,272 |
|
$ |
2,252 |
|
24
Supplemental Schedule 6(c)
Same Store Operating Results
Six Months Ended June 30, 2021 Compared to Six Months Ended June 30, 2020
(proportionate amounts, in thousands, except community, home, and per home data) (unaudited)
The table below presents AIR’s Same Store portfolio as of June 30, 2021.
|
|
|
|
|
|
|
|
Revenues, Before Utility |
|
|
Expenses, Net of Utility |
|
|
Net Operating Income |
|
|
|
Net Operating |
|
Average Daily |
|
Average |
|
|||||||||||||||||||||||||||||
|
Apartment |
|
Apartment |
|
AIR Share |
|
|
YTD |
|
YTD |
|
Growth |
|
|
YTD |
|
YTD |
|
Growth |
|
|
YTD |
|
YTD |
|
Growth |
|
|
|
YTD |
|
YTD |
YTD |
|
YTD |
|
YTD |
|
||||||||||||||
|
|
|
|
|
|
|
|
|
|
|
|
|
|
|
|
|
|
|
|
|
|
|
|
|
|
|
|
|
|
|
|
|
|
|
|
|
|
|
||||||||||||||
Bay Area |
|
9 |
|
|
2,212 |
|
|
1,657 |
|
|
$ |
27,812 |
|
$ |
30,450 |
|
|
(8.7 |
%) |
|
$ |
7,424 |
|
$ |
6,921 |
|
|
7.3 |
% |
|
$ |
20,388 |
|
$ |
23,529 |
|
|
(13.3 |
%) |
|
|
73.3% |
|
93.5% |
96.4% |
|
$ |
2,992 |
|
$ |
3,177 |
|
|
|
|
|
|
|
|
|
|
|
|
|
|
|
|
|
|
|
|
|
|
|
|
|
|
|
|
|
|
|
|
|
|
|
|
|
|
|
|
||||||||||||||
Boston |
|
11 |
|
|
2,462 |
|
|
2,462 |
|
|
|
33,442 |
|
|
35,093 |
|
|
(4.7 |
%) |
|
|
10,472 |
|
|
10,161 |
|
|
3.1 |
% |
|
|
22,970 |
|
|
24,932 |
|
|
(7.9 |
%) |
|
|
68.7% |
|
96.2% |
96.9% |
|
$ |
2,354 |
|
$ |
2,452 |
|
|
|
|
|
|
|
|
|
|
|
|
|
|
|
|
|
|
|
|
|
|
|
|
|
|
|
|
|
|
|
|
|
|
|
|
|
|
|
|
||||||||||||||
Denver |
|
7 |
|
|
2,026 |
|
|
1,987 |
|
|
|
20,651 |
|
|
19,143 |
|
|
7.9 |
% |
|
|
5,764 |
|
|
5,084 |
|
|
13.4 |
% |
|
|
14,887 |
|
|
14,059 |
|
|
5.9 |
% |
|
|
72.1% |
|
95.7% |
91.2% |
|
$ |
1,810 |
|
$ |
1,759 |
|
|
|
|
|
|
|
|
|
|
|
|
|
|
|
|
|
|
|
|
|
|
|
|
|
|
|
|
|
|
|
|
|
|
|
|
|
|
|
|
||||||||||||||
Greater Washington, DC |
|
11 |
|
|
5,238 |
|
|
5,215 |
|
|
|
49,873 |
|
|
50,536 |
|
|
(1.3 |
%) |
|
|
13,713 |
|
|
13,467 |
|
|
1.8 |
% |
|
|
36,160 |
|
|
37,069 |
|
|
(2.5 |
%) |
|
|
72.5% |
|
96.2% |
97.4% |
|
$ |
1,658 |
|
$ |
1,658 |
|
|
|
|
|
|
|
|
|
|
|
|
|
|
|
|
|
|
|
|
|
|
|
|
|
|
|
|
|
|
|
|
|
|
|
|
|
|
|
|
||||||||||||||
Los Angeles |
|
13 |
|
|
4,347 |
|
|
3,498 |
|
|
|
56,738 |
|
|
62,212 |
|
|
(8.8 |
%) |
|
|
14,007 |
|
|
13,367 |
|
|
4.8 |
% |
|
|
42,731 |
|
|
48,845 |
|
|
(12.5 |
%) |
|
|
75.3% |
|
96.6% |
96.0% |
|
$ |
2,799 |
|
$ |
3,088 |
|
|
|
|
|
|
|
|
|
|
|
|
|
|
|
|
|
|
|
|
|
|
|
|
|
|
|
|
|
|
|
|
|
|
|
|
|
|
|
|
||||||||||||||
Miami |
|
5 |
|
|
1,725 |
|
|
1,725 |
|
|
|
22,791 |
|
|
21,929 |
|
|
3.9 |
% |
|
|
7,808 |
|
|
7,724 |
|
|
1.1 |
% |
|
|
14,983 |
|
|
14,205 |
|
|
5.5 |
% |
|
|
65.7% |
|
97.7% |
95.4% |
|
$ |
2,254 |
|
$ |
2,221 |
|
|
|
|
|
|
|
|
|
|
|
|
|
|
|
|
|
|
|
|
|
|
|
|
|
|
|
|
|
|
|
|
|
|
|
|
|
|
|
|
||||||||||||||
Philadelphia |
|
9 |
|
|
2,748 |
|
|
2,669 |
|
|
|
38,384 |
|
|
41,445 |
|
|
(7.4 |
%) |
|
|
11,901 |
|
|
11,087 |
|
|
7.3 |
% |
|
|
26,483 |
|
|
30,358 |
|
|
(12.8 |
%) |
|
|
69.0% |
|
90.8% |
96.7% |
|
$ |
2,639 |
|
$ |
2,677 |
|
|
|
|
|
|
|
|
|
|
|
|
|
|
|
|
|
|
|
|
|
|
|
|
|
|
|
|
|
|
|
|
|
|
|
|
|
|
|
|
||||||||||||||
San Diego |
|
9 |
|
|
3,051 |
|
|
2,875 |
|
|
|
35,947 |
|
|
35,385 |
|
|
1.6 |
% |
|
|
8,006 |
|
|
7,824 |
|
|
2.3 |
% |
|
|
27,941 |
|
|
27,561 |
|
|
1.4 |
% |
|
|
77.7% |
|
97.6% |
96.8% |
|
$ |
2,135 |
|
$ |
2,120 |
|
|
|
|
|
|
|
|
|
|
|
|
|
|
|
|
|
|
|
|
|
|
|
|
|
|
|
|
|
|
|
|
|
|
|
|
|
|
|
|
||||||||||||||
Other Markets |
|
18 |
|
|
1,618 |
|
|
1,618 |
|
|
|
21,509 |
|
|
23,824 |
|
|
(9.7 |
%) |
|
|
10,008 |
|
|
10,055 |
|
|
(0.5 |
%) |
|
|
11,501 |
|
|
13,769 |
|
|
(16.5 |
%) |
|
|
53.5% |
|
92.8% |
95.9% |
|
$ |
2,388 |
|
$ |
2,558 |
|
|
|
|
|
|
|
|
|
|
|
|
|
|
|
|
|
|
|
|
|
|
|
|
|
|
|
|
|
|
|
|
|
|
|
|
|
|
|
|
||||||||||||||
Total |
|
92 |
|
|
25,427 |
|
|
23,706 |
|
|
$ |
307,147 |
|
$ |
320,017 |
|
|
(4.0 |
%) |
|
$ |
89,103 |
|
$ |
85,690 |
|
|
4.0 |
% |
|
$ |
218,044 |
|
$ |
234,327 |
|
|
(6.9 |
%) |
|
|
71.0% |
|
95.5% |
96.1% |
|
$ |
2,262 |
|
$ |
2,340 |
|
25
Supplemental Schedule 6(d)
Same Store Operating Expense Detail
(proportionate amounts, in thousands) (unaudited)
Quarterly Comparison
|
|
2Q 2021 |
|
|
% of Total |
|
|
2Q 2020 |
|
|
$ Change |
|
|
% Change |
|
|||||
Operating expenses (1) |
|
$ |
21,952 |
|
|
|
48.6 |
% |
|
$ |
21,348 |
|
|
$ |
604 |
|
|
|
2.8 |
% |
Utility expense, net of reimbursement |
|
|
2,436 |
|
|
|
5.4 |
% |
|
|
2,318 |
|
|
|
118 |
|
|
|
5.1 |
% |
Real estate taxes |
|
|
18,121 |
|
|
|
40.1 |
% |
|
|
17,305 |
|
|
|
816 |
|
|
|
4.7 |
% |
Insurance |
|
|
2,634 |
|
|
|
5.9 |
% |
|
|
2,026 |
|
|
|
608 |
|
|
|
30.0 |
% |
Total |
|
$ |
45,143 |
|
|
|
100.0 |
% |
|
$ |
42,997 |
|
|
$ |
2,146 |
|
|
|
5.0 |
% |
Sequential Comparison
|
|
2Q 2021 |
|
|
% of Total |
|
|
1Q 2021 |
|
|
$ Change |
|
|
% Change |
|
|||||
Operating expenses (1) |
|
$ |
21,952 |
|
|
|
48.6 |
% |
|
$ |
20,295 |
|
|
$ |
1,657 |
|
|
|
8.2 |
% |
Utility expense, net of reimbursement |
|
|
2,436 |
|
|
|
5.4 |
% |
|
|
2,830 |
|
|
|
(394 |
) |
|
|
(13.9 |
%) |
Real estate taxes |
|
|
18,121 |
|
|
|
40.1 |
% |
|
|
18,435 |
|
|
|
(314 |
) |
|
|
(1.7 |
%) |
Insurance |
|
|
2,634 |
|
|
|
5.9 |
% |
|
|
2,400 |
|
|
|
234 |
|
|
|
9.8 |
% |
Total |
|
$ |
45,143 |
|
|
|
100.0 |
% |
|
$ |
43,960 |
|
|
$ |
1,183 |
|
|
|
2.7 |
% |
Year-To-Date Comparison
|
|
YTD 2Q 2021 |
|
|
% of Total |
|
|
YTD 2Q 2020 |
|
|
$ Change |
|
|
% Change |
|
|||||
Operating expenses (1) |
|
$ |
42,247 |
|
|
|
47.4 |
% |
|
$ |
41,520 |
|
|
$ |
727 |
|
|
|
1.8 |
% |
Utility expense, net of reimbursement |
|
|
5,266 |
|
|
|
5.9 |
% |
|
|
5,202 |
|
|
|
64 |
|
|
|
1.2 |
% |
Real estate taxes |
|
|
36,556 |
|
|
|
41.0 |
% |
|
|
34,878 |
|
|
|
1,678 |
|
|
|
4.8 |
% |
Insurance |
|
|
5,034 |
|
|
|
5.7 |
% |
|
|
4,090 |
|
|
|
944 |
|
|
|
23.1 |
% |
Total |
|
$ |
89,103 |
|
|
|
100.0 |
% |
|
$ |
85,690 |
|
|
$ |
3,413 |
|
|
|
4.0 |
% |
26
Supplemental Schedule 7
Portfolio Data by Market
Second Quarter 2021 Compared to Second Quarter 2020
(unaudited)
|
|
Quarter Ended June 30, 2021 |
|
|
Quarter Ended June 30, 2020 |
|
||||||||||||||||||||||||||||||||||
|
|
Apartment |
|
|
Apartment |
|
|
AIR Share of |
|
|
% AIR |
|
|
Average |
|
|
Apartment |
|
|
Apartment |
|
|
AIR Share of |
|
|
% AIR |
|
|
Average |
|
||||||||||
|
|
|
|
|
|
|
|
|
|
|
|
|
|
|
|
|
|
|
|
|
|
|
|
|
|
|
|
|
|
|
||||||||||
Bay Area |
|
|
9 |
|
|
|
2,212 |
|
|
|
1,657 |
|
|
|
9.3 |
% |
|
$ |
2,952 |
|
|
|
10 |
|
|
|
2,322 |
|
|
|
2,322 |
|
|
|
12.6 |
% |
|
$ |
3,212 |
|
|
|
|
|
|
|
|
|
|
|
|
|
|
|
|
|
|
|
|
|
|
|
|
|
|
|
|
|
|
|
|
||||||||||
Boston |
|
|
11 |
|
|
|
2,462 |
|
|
|
2,462 |
|
|
|
10.6 |
% |
|
|
2,369 |
|
|
|
12 |
|
|
|
2,598 |
|
|
|
2,462 |
|
|
|
9.9 |
% |
|
|
2,431 |
|
|
|
|
|
|
|
|
|
|
|
|
|
|
|
|
|
|
|
|
|
|
|
|
|
|
|
|
|
|
|
|
||||||||||
Denver |
|
|
7 |
|
|
|
2,026 |
|
|
|
1,987 |
|
|
|
6.7 |
% |
|
|
1,837 |
|
|
|
8 |
|
|
|
2,279 |
|
|
|
2,240 |
|
|
|
5.5 |
% |
|
|
1,757 |
|
|
|
|
|
|
|
|
|
|
|
|
|
|
|
|
|
|
|
|
|
|
|
|
|
|
|
|
|
|
|
|
||||||||||
Greater Washington, DC |
|
|
11 |
|
|
|
5,238 |
|
|
|
5,215 |
|
|
|
16.4 |
% |
|
|
1,664 |
|
|
|
11 |
|
|
|
5,238 |
|
|
|
5,215 |
|
|
|
15.0 |
% |
|
|
1,661 |
|
|
|
|
|
|
|
|
|
|
|
|
|
|
|
|
|
|
|
|
|
|
|
|
|
|
|
|
|
|
|
|
||||||||||
Los Angeles |
|
|
13 |
|
|
|
4,347 |
|
|
|
3,498 |
|
|
|
19.5 |
% |
|
|
2,794 |
|
|
|
13 |
|
|
|
4,347 |
|
|
|
4,347 |
|
|
|
22.9 |
% |
|
|
2,958 |
|
|
|
|
|
|
|
|
|
|
|
|
|
|
|
|
|
|
|
|
|
|
|
|
|
|
|
|
|
|
|
|
||||||||||
Miami |
|
|
6 |
|
|
|
2,425 |
|
|
|
2,425 |
|
|
|
7.5 |
% |
|
|
1,897 |
|
|
|
6 |
|
|
|
2,091 |
|
|
|
2,091 |
|
|
|
5.6 |
% |
|
|
1,796 |
|
|
|
|
|
|
|
|
|
|
|
|
|
|
|
|
|
|
|
|
|
|
|
|
|
|
|
|
|
|
|
|
||||||||||
Philadelphia |
|
|
9 |
|
|
|
2,748 |
|
|
|
2,669 |
|
|
|
11.1 |
% |
|
|
2,462 |
|
|
|
9 |
|
|
|
2,748 |
|
|
|
2,669 |
|
|
|
11.2 |
% |
|
|
2,511 |
|
|
|
|
|
|
|
|
|
|
|
|
|
|
|
|
|
|
|
|
|
|
|
|
|
|
|
|
|
|
|
|
||||||||||
San Diego |
|
|
9 |
|
|
|
3,051 |
|
|
|
2,875 |
|
|
|
12.9 |
% |
|
|
2,163 |
|
|
|
9 |
|
|
|
3,051 |
|
|
|
3,051 |
|
|
|
11.7 |
% |
|
|
2,105 |
|
|
|
|
|
|
|
|
|
|
|
|
|
|
|
|
|
|
|
|
|
|
|
|
|
|
|
|
|
|
|
|
||||||||||
Other Markets |
|
|
21 |
|
|
|
1,913 |
|
|
|
1,913 |
|
|
|
6.0 |
% |
|
|
2,388 |
|
|
|
21 |
|
|
|
1,918 |
|
|
|
1,918 |
|
|
|
5.6 |
% |
|
|
2,380 |
|
|
|
|
|
|
|
|
|
|
|
|
|
|
|
|
|
|
|
|
|
|
|
|
|
|
|
|
|
|
|
|
||||||||||
Total |
|
|
96 |
|
|
|
26,422 |
|
|
|
24,701 |
|
|
|
100.0 |
% |
|
$ |
2,215 |
|
|
|
99 |
|
|
|
26,592 |
|
|
|
26,315 |
|
|
|
100.0 |
% |
|
$ |
2,294 |
|
27
Supplemental Schedule 8
Apartment Community Disposition and Acquisition Activity
(dollars in millions, except average revenue per home) (unaudited)
Disposition and Acquisition Activity |
|
|
|
|
|
|
|
|
|
|
|
|
|
|
|
|
|
|
|
|
|
|
|
|
||||||||||||||||||||||||||||
|
|
|
|
|
|
|
|
|
|
|
|
|
|
|
|
|
|
|
|
|
|
|
|
|
|
|
|
|
||||||||||||||||||||||||
We did not dispose of any apartment communities during 2021.
Full Year 2021 Acquisitions |
|
|
|
|
|
|
|
|
|
|
|
|
||||
|
|
|
|
|
|
|
|
|
|
|
|
|
|
|
||
Apartment Community Name |
|
Location |
|
Month |
|
Apartment |
|
Purchase |
|
|
Average Rent per Apartment Home (1) |
|
||||
|
|
|
|
|
|
|
|
|
|
|
|
|
|
|
||
City Center on 7th |
|
|
|
Pembroke Pines, FL |
|
June |
|
700 |
|
$ |
222.7 |
|
|
$ |
1,892 |
|
28
Supplemental Schedule 9
Apartment Community Capital Additions Information
Three and Six Months Ended June 30, 2021
(consolidated amounts in thousands, except per apartment home data) (unaudited)
We classify capital additions as Capital Replacements (“CR”), Capital Improvements (“CI”), Capital Enhancements (“CE”), or Other Capital Expenditures. Recurring capital additions are apportioned between CR and CI based on the useful life of the item under consideration and the period over which we have owned the item. Under this method of classification, CR represents the portion of the item consumed during our ownership of the item, while CI represents the portion of the item consumed prior to our period of ownership.
The table below includes our capital spend in consolidated amounts, not adjusted for noncontrolling interest, excluding activities related to properties leased to Aimco.
|
|
Three Months Ended June 30, 2021 |
|
|
Six Months Ended June 30, 2021 |
|
||
Capital Additions (1) |
|
|
|
|
|
|
||
Capital Replacements |
|
|
|
|
|
|
||
Buildings and grounds |
|
$ |
5,056 |
|
|
$ |
13,277 |
|
Turnover capital additions |
|
|
896 |
|
|
|
896 |
|
Capitalized site payroll and indirect costs |
|
|
1,472 |
|
|
|
1,472 |
|
Capital Replacements |
|
|
7,424 |
|
|
|
15,645 |
|
Capital Improvements |
|
|
2,336 |
|
|
|
3,904 |
|
Capital Enhancements |
|
|
27,707 |
|
|
|
37,641 |
|
Other Capital Expenditures |
|
|
2,631 |
|
|
|
4,457 |
|
Total |
|
$ |
40,098 |
|
|
$ |
61,647 |
|
|
|
|
|
|
|
|
||
Total apartment homes |
|
|
26,422 |
|
|
|
26,422 |
|
|
|
|
|
|
|
|
||
Capital Replacements per apartment home |
|
$ |
281 |
|
|
$ |
592 |
|
29
GLOSSARY AND RECONCILIATIONS OF NON-GAAP FINANCIAL AND OPERATING MEASURES
This Earnings Release and Supplemental Information include certain financial and operating measures used by AIR management that are not calculated in accordance with accounting principles generally accepted in the United States (“GAAP”). Our definitions and calculations of these non-GAAP financial and operating measures and other terms may differ from the definitions and methodologies used by other REITs and, accordingly, may not be comparable. These non-GAAP financial and operating measures should not be considered an alternative to GAAP net income or any other GAAP measurement of performance and should not be considered an alternative measure of liquidity.
AIR Operating Partnership: Apartment Income REIT, L.P., formerly Aimco Properties, L.P., a Delaware limited partnership, is the operating partnership in AIR’s UPREIT structure. AIR owns approximately 93.2% of the legal interest in the common partnership units of the AIR Operating Partnership and 95.0% of the economic interest in the common partnership units of the AIR Operating Partnership.
AIR PROPORTIONATE FINANCIAL INFORMATION: Within this Earnings Release and Supplemental Information, we provide certain financial information necessary to calculate our share of financial information. This information is not, nor is it intended to be, a presentation in accordance with GAAP. Our proportionate share of financial information includes our share of unconsolidated real estate partnerships and excludes the noncontrolling interest partners’ share of consolidated real estate partnerships.
We do not control the unconsolidated real estate partnerships and the calculation of our share of the assets and liabilities and revenues and expenses does not represent a legal claim to a proportionate share of such items. The amount of cash distributions partners in such partnerships may receive is based upon specific provisions in the partnership agreements and may vary based on whether such distributions are generated from operations, capital events or liquidation.
Proportionate information benefits the users of our financial information by providing the amount of revenues, expenses, assets, liabilities, and other items attributable to our stockholders. Other companies may calculate their proportionate information differently than we do, limiting the usefulness as a comparative measure. Because of these limitations, the non-GAAP AIR proportionate financial information should not be considered in isolation or as a substitute for information included in our financial statements as reported under GAAP.
AVERAGE REVENUE PER APARTMENT HOME: Represents our proportionate average monthly rental and other property revenues, excluding utility cost reimbursements, divided by the number of occupied apartment homes as of the end of the period.
CAPITAL ADDITIONS DEFINITIONS
CAPITAL IMPROVEMENTS (CI): CI represent capital additions made to replace the portion of acquired apartment communities consumed prior to our period of ownership and not contemplated in our underwriting of an acquisition.
CAPITAL REPLACEMENTS (CR): Unlike CI, CR does not increase the useful life of an asset from its original purchase condition. CR represent capital additions made to replace the portion of acquired capital assets consumed during our period of ownership.
CAPITAL ENHANCEMENTS (CE): CE may include kitchen and bath remodeling; energy conservation projects; and investments in longer-lived materials designed to reduce costs. CE does not significantly disrupt property operations.
30
OTHER CAPITAL EXPENDITURES: May include capital expenditures: (i) contemplated in the underwriting of our recently acquired communities; and (ii) capitalized costs incurred in connection with the restoration of an apartment community after a casualty event. We expect these amounts to be significantly reduced under our business model. After the separation, certain properties are leased to Aimco for development and redevelopment.
FREE CASH FLOW: Free Cash Flow, as calculated for our retained portfolio, represents an apartment community’s property net operating income, less spending for Capital Replacements. Capital Replacement spending is a measure of the cost of capital asset used during the period. We believe that Free Cash Flow is useful to investors as a supplemental measure of apartment community performance because it takes into consideration costs incurred during the period to replace capital assets that have been consumed during our ownership.
FREE CASH FLOW CAP RATE: Free Cash Flow Cap Rate represents the NOI Cap Rate, adjusted for assumed Capital Replacements spending of $1,200 per apartment home.
FREE CASH FLOW MARGIN: Free Cash Flow Margin represents an apartment community’s property net operating income less $1,200 per apartment home of assumed annual Capital Replacement spending, as a percentage of the apartment community’s rental and other property revenues.
LEVERAGE RATIO DEFINITIONS
We target Net Leverage to Adjusted EBITDAre below 6.0x. We also focus on Proportionate Debt to Adjusted EBITDAre. We believe these ratios, which are based in part on non-GAAP financial information, are commonly used by investors and analysts to assess the relative financial risk associated with balance sheets of companies within the same industry, and they are believed to be similar to measures used by rating agencies to assess entity credit quality. EBITDAre and Adjusted EBITDAre should not be considered alternatives to net income (loss) as determined in accordance with GAAP as indicators of performance. There can be no assurance that our method of calculating EBITDAre and Adjusted EBITDAre is comparable with that of other real estate investment trusts.
Our net leverage includes our share of long-term, non-recourse property debt, outstanding borrowings on our revolving credit facility, term loans, and preferred equity, reduced by cash and restricted cash on-hand, excluding tenant security deposits, and our notes receivable from Aimco. We reconcile consolidated balances to our net leverage on Supplemental Schedule 5(a).
We calculate Adjusted EBITDAre used in our leverage ratios based on annualized current quarter amounts.
EBITDAre AND ADJUSTED EBITDAre
EARNINGS BEFORE INTEREST, TAXES, DEPRECIATION, AND AMORTIZATION FOR REAL ESTATE (“EBITDAre”): NAREIT defines EBITDAre as net income computed in accordance with GAAP, before interest expense, income taxes, depreciation and amortization expense, further adjusted for:
We believe that EBITDAre is useful to investors, creditors and rating agencies as a supplemental measure of our ability to incur and service debt because it is a recognized measure of performance by the real estate industry and facilitates comparison of credit strength between AIR and other companies.
31
ADJUSTED EBITDAre: Adjusted EBITDAre is defined as EBITDAre adjusted to exclude the effect of the following items for the reasons set forth below:
A reconciliation of net income (loss) to EBITDAre and Adjusted EBITDAre for our portfolio for the quarter ended June 30, 2021, is as follows (in thousands, unaudited):
|
|
Quarter Ended |
|
|
|
|
June 30, 2021 |
|
|
Net loss |
|
$ |
(19,687 |
) |
Adjustments: |
|
|
|
|
Interest expense |
|
|
70,807 |
|
Income tax benefit |
|
|
(2,035 |
) |
Depreciation and amortization |
|
|
75,791 |
|
Gain on derecognition of leased properties and dispositions of real estate |
|
|
(3,353 |
) |
EBITDAre |
|
$ |
121,523 |
|
Net loss from continuing operations attributable to noncontrolling interests |
|
|
2,397 |
|
EBITDAre adjustments attributable to noncontrolling interests |
|
|
(9,200 |
) |
Interest income on securitization investment and notes receivable |
|
|
(9,215 |
) |
Pro forma FFO adjustments, net (1) |
|
|
4,822 |
|
Adjusted EBITDAre |
|
$ |
110,327 |
|
Annualized Adjusted EBITDAre |
|
$ |
441,308 |
|
FIXED CHARGE COVERAGE RATIO: As defined by our credit agreement, the ratio of (a) EBITDA to (b) fixed charges, which represent the sum of (i) our proportionate share of interest expense (excluding prepayment penalties and amortization of debt issuance costs), (ii) debt amortization, and (iii) Preferred Dividends, for the four fiscal quarters preceding the date of calculation. The calculation of certain of these measures as defined by our Credit Agreement may differ from those used in the calculations of our Leverage Ratios.
PREFERRED DIVIDENDS: Preferred Dividends include dividends paid with respect to AIR’s Preferred Stock and the AIR OP’s Preferred Partnership Units, exclusive of preferred equity redemption related amounts.
PREFERRED EQUITY: Preferred equity represents the redemption amounts for AIR’s Preferred Stock and the AIR OP’s Preferred Partnership Units and may be found in AIR’s consolidated balance sheets and on Supplemental Schedule 5(b).
OTHER LEVERAGE: Other Leverage includes Preferred OP Units and redeemable noncontrolling interests.
PREFERRED OP UNITS: Preferred OP Units represent the redemption amounts for the AIR OP’s Preferred Partnership Units and may be found in our consolidated balance sheets and on Supplemental Schedule 5(b).
32
PROPORTIONATE DEBT TO ADJUSTED EBITDAre RATIO: The ratio of (a) our share of net leverage as calculated on Supplemental Schedule 5(a), excluding Preferred Equity, to (b) Annualized Adjusted EBITDAre.
NET LEVERAGE TO ADJUSTED EBITDAre RATIO: The ratio of (a) our share of net leverage as calculated on Supplemental Schedule 5(a), to (b) Annualized Adjusted EBITDAre.
NAREIT FUNDS FROM OPERATIONS (NAREIT FFO): NAREIT FFO is a commonly used measure of REIT performance, which the National Association of Real Estate Investment Trusts (NAREIT) defines as net income computed in accordance with GAAP, excluding: (i) depreciation and amortization related to real estate; (ii) gains and losses from sales or impairment of depreciable assets and land used in the primary business of the REIT; (iii) and income taxes directly associated with a gain or loss on sale of real estate; and including (iv) our share of NAREIT FFO of unconsolidated partnerships and joint ventures. We compute NAREIT FFO for all periods presented in accordance with the guidance set forth by NAREIT.
In addition to NAREIT FFO, we use PRO FORMA FUNDS FROM OPERATIONS (Pro forma FFO) to measure short-term performance. Pro forma FFO represents NAREIT FFO as defined above, excluding certain amounts that are unique or occur infrequently. Our pro forma adjustments are defined in further detail in the footnotes to Supplemental Schedule 1.
NAREIT FFO and Pro forma FFO are non-GAAP measures that we believe are helpful to investors in understanding our short-term performance because they capture features particular to real estate performance by recognizing that real estate assets generally appreciate over time or maintain residual value to a much greater extent than other capital assets such as machinery, computers or other personal property. NAREIT FFO and Pro forma FFO should not be considered alternatives to net income as determined in accordance with GAAP, as indicators of performance. There can be no assurance that our method of computing NAREIT FFO and Pro forma FFO is comparable with that of other real estate investment trusts.
NET OPERATING INCOME (NOI) CAP RATE: NOI Cap Rate is calculated based on our share of the proportionate property NOI for the trailing twelve months prior to sale, less a 3% management fee, divided by gross proceeds.
NET OPERATING INCOME (NOI) MARGIN: Represents an apartment community’s net operating income as a percentage of the apartment community’s rental and other property revenues.
OTHER EXPENSES, NET: Other expenses, net, allocated to contribution from real estate operations on Supplemental Schedule 2 generally includes franchise taxes, expenses specifically related to our administration of our real estate partnerships (for example, services such as audit, tax, and legal), ground lease rent expense, and risk management activities related to certain other corporate expenses.
PROPERTY NET OPERATING INCOME (NOI) and PROPORTIONATE PROPERTY NOI: NOI is defined as total property rental and other property revenues less direct property operating expenses, including real estate taxes. NOI does not include: property management revenues, primarily from affiliates; casualties; property management expenses; depreciation; or interest expense. NOI is helpful because it helps both investors and management to understand the operating performance of real estate excluding costs associated with decisions about acquisition pricing, overhead allocations, and financing arrangements. NOI is also considered by many in the real estate industry to be a useful measure for determining the value of real estate. Reconciliations of NOI as presented in this Earnings Release and Supplemental Information to our consolidated GAAP amounts are provided below.
Due to the diversity of our economic ownership interests in our apartment communities in the periods presented, we evaluate the performance of the apartment communities in our segments using Proportionate Property NOI, which represents our share of the NOI for the apartment communities that we consolidate and manage, but excludes apartment communities that we do not consolidate. Proportionate Property NOI is defined as our share of rental and other property revenue less our share of property operating expenses. In our evaluation of community results, we exclude utility cost reimbursement from rental and other property revenues and reflect such amount as a reduction of the related utility expense within property operating expenses. The following table
33
presents the reconciliation of GAAP rental and other property revenue to the proportionate revenues before utility reimbursements and GAAP property operating expenses to proportionate expenses, net of utility reimbursements. The table also presents the reconciliation of consolidated Same Store revenue before utility reimbursements and expenses, net of utility reimbursements as presented on Supplemental Schedule 2(a) to the proportionate amounts presented on Supplemental Schedule 6.
Segment NOI Reconciliation |
|
|||||||||||||||
(in thousands) (unaudited) |
|
Three Months Ended |
|
|
Six Months Ended |
|
||||||||||
|
|
June 30, 2021 |
|
|
June 30, 2021 |
|
||||||||||
|
|
Revenues, |
|
|
Expenses, |
|
|
Revenues, |
|
|
Expenses, |
|
||||
Total Real Estate Operations |
|
|
|
|
|
|
|
|
|
|
|
|
||||
Total (per consolidated statements of operations) |
|
$ |
178,333 |
|
|
$ |
64,758 |
|
|
$ |
354,746 |
|
|
$ |
129,375 |
|
Adjustment: Utilities reimbursement (1) |
|
|
(7,039 |
) |
|
|
(7,039 |
) |
|
|
(13,937 |
) |
|
|
(13,937 |
) |
Adjustment: Sold properties and other |
|
|
(1,612 |
) |
|
|
(7,448 |
) |
|
|
(3,299 |
) |
|
|
(16,342 |
) |
Total (per Supplemental Schedule 2) |
|
|
169,682 |
|
|
|
50,271 |
|
|
|
337,510 |
|
|
|
99,096 |
|
Proportionate adjustment (3) |
|
|
(13,133 |
) |
|
|
(3,783 |
) |
|
|
(26,253 |
) |
|
|
(7,444 |
) |
Proportionate property net operating income |
|
$ |
156,549 |
|
|
$ |
46,488 |
|
|
$ |
311,257 |
|
|
$ |
91,652 |
|
|
|
|
|
|
|
|
|
|
|
|
|
|
||||
Total Same Store Operations |
|
|
|
|
|
|
|
|
|
|
|
|
||||
Same Store amounts (per Supplemental |
|
$ |
167,287 |
|
|
$ |
48,916 |
|
|
$ |
333,404 |
|
|
$ |
96,526 |
|
Proportionate adjustment (3) |
|
|
(13,133 |
) |
|
|
(3,773 |
) |
|
|
(26,257 |
) |
|
|
(7,423 |
) |
Same Store amounts, adjusted |
|
$ |
154,154 |
|
|
$ |
45,143 |
|
|
$ |
307,147 |
|
|
$ |
89,103 |
|
|
|
|
|
|
|
|
|
|
|
|
|
|
||||
PORTFOLIO QUALITY RATINGS: We measure the quality of apartment communities in our portfolio based on average rents of our apartment homes compared to local market average rents as reported by a third-party provider of commercial real estate performance and analysis. Under this rating system, we classify as “A” quality apartment communities those earning rents greater than 125% of local market average; as “B” quality apartment communities those earning rents between 90% and 125% of local market average; “C+” quality apartment communities those earning rents greater than $1,100 per month, but lower than 90% of local market average; and “C” quality apartment communities those earning rents less than $1,100 per month and lower than 90% of local market average.
REAL ESTATE CLASSIFICATIONS: Our portfolio of apartment communities is diversified by both price point and geography. Our portfolio is classified into two segments, as follows:
SAME STORE: Same Store apartment communities are apartment communities that (a) are owned and managed by AIR, and (b) had reached a stabilized level of operations.
OTHER REAL ESTATE: Includes communities that do not meet the criteria to be classified as Same Store.
SOLD AND HELD FOR SALE APARTMENT COMMUNITIES: Apartment communities either sold since January 1, 2020 or classified as held for sale at the end of the period. For purposes of highlighting results of operations related to our retained portfolio, results for Sold and Held For Sale Apartment Communities are excluded from property net operating income and presented separately on a net basis on Supplemental Schedule 2.
34
TURNOVER and RETENTION: Turnover represents the percentage of residents who have moved out in the trailing twelve months. It is calculated by dividing the number of move outs in the trailing twelve months, exclusive of intra-community transfers, by the daily average number of occupied apartment homes during the trailing twelve months. For the twelve months ended June 30, 2021, Turnover was 43.3%, 330 basis points higher than the twelve months ended June 30, 2020. Inclusive of intra-community transfers, Turnover was 48.8% for the trailing twelve months ended June 30, 2021.
Retention represents the inverse of Turnover, as defined above.
35