Attached files
| file | filename |
|---|---|
| 8-K - 8-K - Allegiance Bancshares, Inc. | abtx-8k_20210729.htm |
| EX-99.1 - EX-99.1 - Allegiance Bancshares, Inc. | abtx-ex991_26.htm |

Fixed Income Investor Presentation September 2019 Fixed Income Investor Presentation [Month] [Day], 2019 Second Quarter 2021 Investor Presentation cshares, Inc. Exhibit 99.2
“Safe Harbor” Statement under the Private Securities Litigation Reform Act of 1995: This presentation contains forward-looking statements within the meaning of the securities laws that are derived utilizing assumptions, present expectations, estimates and projections about Allegiance. These statements preceded by, followed by or that otherwise include the words “believes,” “expects,” “continues”, “anticipates,” “intends,” “projects,” “estimates,” “potential”, “plans” and similar expressions or future or conditional verbs such as “will,” “should,” “would,” “may” and “could” are generally forward-looking in nature and not historical facts, although not all forward looking statements include the foregoing. Forward-looking statements include information concerning Allegiance’s expected future financial performance, business and growth strategy, projected plans and objectives, as well as projections of macroeconomic and industry trends, which are inherently unreliable due to the multiple factors that impact economic trends, and any such variations may be material. Such forward-looking statements are not guarantees of future performance and are subject to risks and uncertainties, many of which are outside of Allegiance’s control, which may cause actual results to differ materially from those expressed or implied by the forward-looking statements. These risks and uncertainties include but are not limited to whether Allegiance can: continue to develop and maintain new and existing customer and community relationships; successfully implement its growth strategy, including identifying suitable acquisition targets and integrating the businesses of acquired companies and banks; sustain its current internal growth rate; provide quality and competitive products and services that appeal to its customers; continue to have access to debt and equity capital markets; and achieve its performance objectives. Additionally, the impact of the COVID-19 pandemic continues to evolve and its future effects on Allegiance are difficult to predict. These and various other factors are discussed in Allegiance's Annual Report on Form 10-K for the fiscal year ended December 31, 2020 and Quarterly Report on Form 10-Q for the quarter ended March 31, 2020 and in other reports and statements Allegiance has filed with the Securities and Exchange Commission. Copies of such filings are available for download free of charge from the Investor Relations section of Allegiance's website at www.allegiancebank.com, under Financial Information, SEC Filings. Any forward-looking statement made by Allegiance in this presentation speaks only as of the date on which it is made. Factors or events that could cause Allegiance’s actual results to differ may emerge from time to time, and it is not possible for Allegiance to predict all of them. Because of these uncertainties, readers should not place undue reliance on any forward-looking statement. Allegiance disclaims any obligation to publicly update any forward-looking statement, whether as a result of new information, future developments or otherwise, except as may be required by law. GAAP Reconciliation of Non-GAAP Financial Measures We use certain non-GAAP financial measures to evaluate our performance. We believe that these non-GAAP financial measures provide meaningful supplemental information regarding our performance and that management and investors benefit from referring to these non-GAAP financial measures in assessing our performance and when planning, forecasting, analyzing and comparing past, present and future periods. Specifically, we review return on average tangible common equity, the ratio of tangible equity to tangible assets and adjusted net interest margin on a tax equivalent basis for internal planning and forecasting purposes. We have included in this presentation information relating to these non-GAAP financial measures for the applicable periods presented. These non-GAAP measures should not be considered in isolation or as a substitute for the most directly comparable or other financial measures calculated in accordance with GAAP. Moreover, the manner in which we calculate these non-GAAP financial measures may differ from that of other companies reporting measures with similar names. A reconciliation of the non-GAAP financial measures is in the appendix. Safe Harbor Statement and Non-GAAP Financial Measures
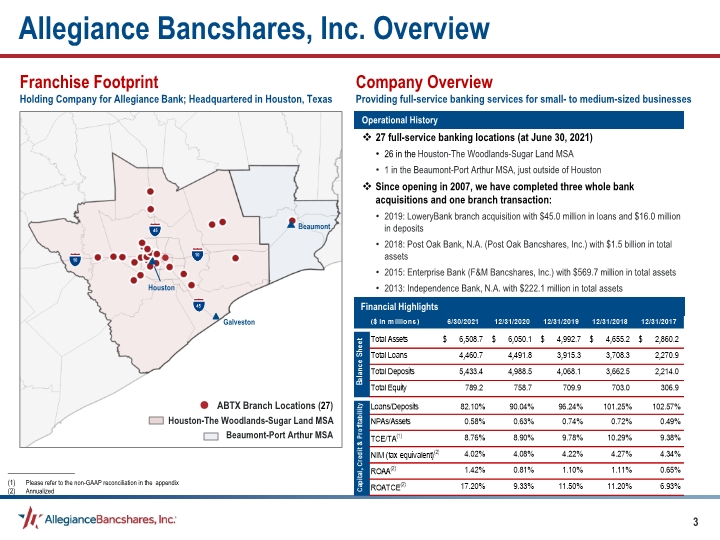
Allegiance Bancshares, Inc. Overview Franchise Footprint Holding Company for Allegiance Bank; Headquartered in Houston, Texas Company Overview Providing full-service banking services for small- to medium-sized businesses Operational History 27 full-service banking locations (at June 30, 2021) 26 in the Houston-The Woodlands-Sugar Land MSA 1 in the Beaumont-Port Arthur MSA, just outside of Houston Since opening in 2007, we have completed three whole bank acquisitions and one branch transaction: 2019: LoweryBank branch acquisition with $45.0 million in loans and $16.0 million in deposits 2018: Post Oak Bank, N.A. (Post Oak Bancshares, Inc.) with $1.5 billion in total assets 2015: Enterprise Bank (F&M Bancshares, Inc.) with $569.7 million in total assets 2013: Independence Bank, N.A. with $222.1 million in total assets Financial Highlights ABTX Branch Locations (27) Galveston Houston Houston-The Woodlands-Sugar Land MSA Beaumont-Port Arthur MSA 10 10 45 45 Beaumont _____________________ Please refer to the non-GAAP reconciliation in the appendix Annualized
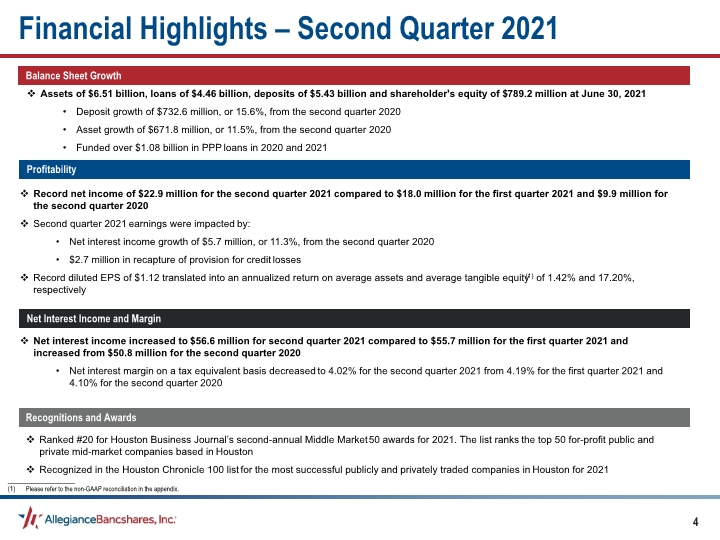
Financial Highlights – Second Quarter 2021 Assets of $6.51 billion, loans of $4.46 billion, deposits of $5.43 billion and shareholder's equity of $789.2 million at June 30, 2021 Deposit growth of $732.6 million, or 15.6%, from the second quarter 2020 Asset growth of $671.8 million, or 11.5%, from the second quarter 2020 Funded over $1.08 billion in PPP loans in 2020 and 2021 Balance Sheet Growth Record net income of $22.9 million for the second quarter 2021 compared to $18.0 million for the first quarter 2021 and $9.9 million for the second quarter 2020 Second quarter 2021 earnings were impacted by: Net interest income growth of $5.7 million, or 11.3%, from the second quarter 2020 $2.7 million in recapture of provision for credit losses Record diluted EPS of $1.12 translated into an annualized return on average assets and average tangible equity(1) of 1.42% and 17.20%, respectively Profitability Net Interest Income and Margin Net interest income increased to $56.6 million for second quarter 2021 compared to $55.7 million for the first quarter 2021 and increased from $50.8 million for the second quarter 2020 Net interest margin on a tax equivalent basis decreased to 4.02% for the second quarter 2021 from 4.19% for the first quarter 2021 and 4.10% for the second quarter 2020 Recognitions and Awards Ranked #20 for Houston Business Journal’s second-annual Middle Market 50 awards for 2021. The list ranks the top 50 for-profit public and private mid-market companies based in Houston Recognized in the Houston Chronicle 100 list for the most successful publicly and privately traded companies in Houston for 2021 _____________________ Please refer to the non-GAAP reconciliation in the appendix.
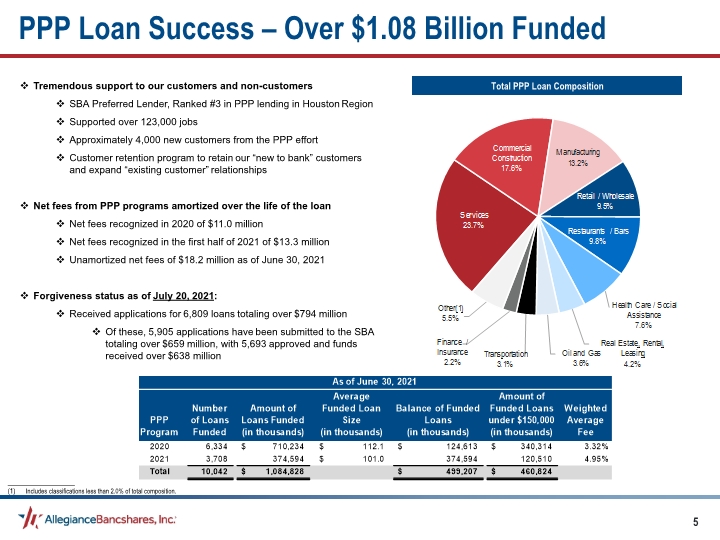
Total PPP Loan Composition _____________________ Includes classifications less than 2.0% of total composition. PPP Loan Success – Over $1.08 Billion Funded Tremendous support to our customers and non-customers SBA Preferred Lender, Ranked #3 in PPP lending in Houston Region Supported over 123,000 jobs Approximately 4,000 new customers from the PPP effort Customer retention program to retain our “new to bank” customers and expand “existing customer” relationships Net fees from PPP programs amortized over the life of the loan Net fees recognized in 2020 of $11.0 million Net fees recognized in the first half of 2021 of $13.3 million Unamortized net fees of $18.2 million as of June 30, 2021 Forgiveness status as of July 20, 2021: Received applications for 6,809 loans totaling over $794 million Of these, 5,905 applications have been submitted to the SBA totaling over $659 million, with 5,693 approved and funds received over $638 million
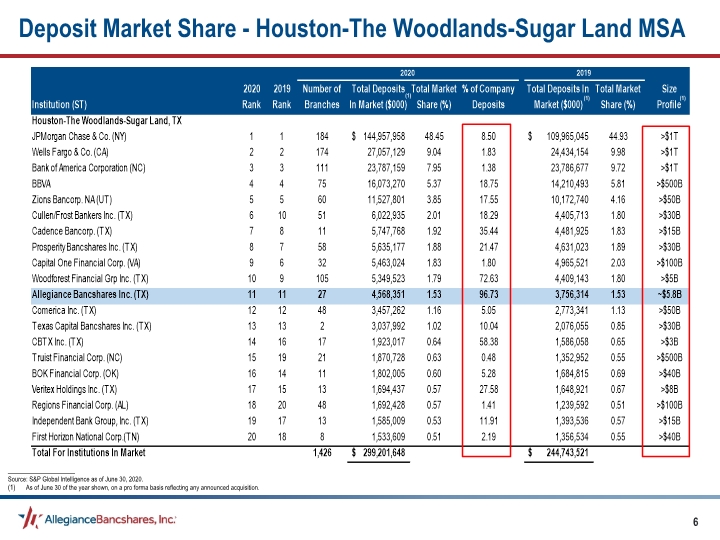
Deposit Market Share - Houston-The Woodlands-Sugar Land MSA _____________________ Source: S&P Global Intelligence as of June 30, 2020. As of June 30 of the year shown, on a pro forma basis reflecting any announced acquisition. (1) (1) (1)
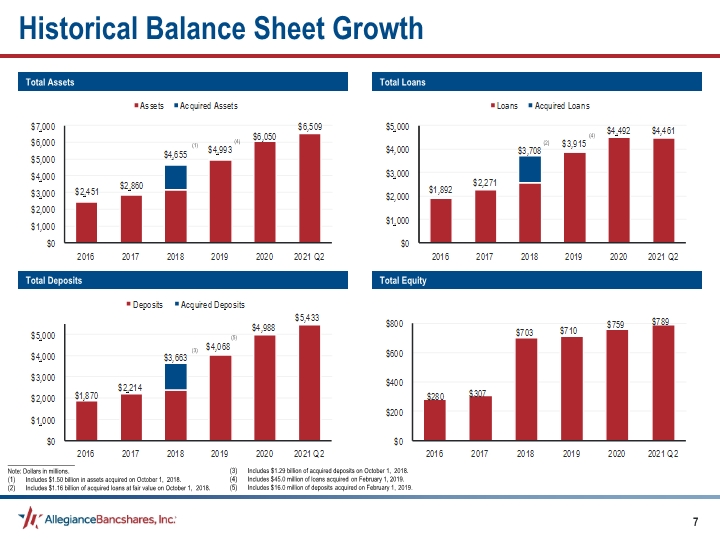
Historical Balance Sheet Growth Total Loans Total Assets Total Equity Total Deposits (1) _____________________ Note: Dollars in millions. Includes $1.50 billion in assets acquired on October 1, 2018. Includes $1.16 billion of acquired loans at fair value on October 1, 2018. (4) (2) (4) (3) (5) Includes $1.29 billion of acquired deposits on October 1, 2018. Includes $45.0 million of loans acquired on February 1, 2019. Includes $16.0 million of deposits acquired on February 1, 2019.
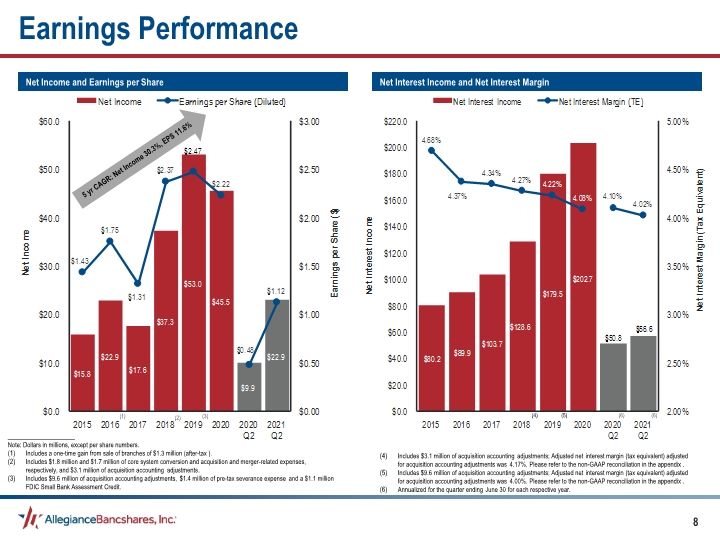
Earnings Performance Net Interest Income and Net Interest Margin Net Income and Earnings per Share _____________________ Note: Dollars in millions, except per share numbers. Includes a one-time gain from sale of branches of $1.3 million (after-tax). Includes $1.8 million and $1.7 million of core system conversion and acquisition and merger-related expenses, respectively, and $3.1 million of acquisition accounting adjustments. Includes $9.6 million of acquisition accounting adjustments, $1.4 million of pre-tax severance expense and a $1.1 million FDIC Small Bank Assessment Credit. (1) (2) (3) Includes $3.1 million of acquisition accounting adjustments; Adjusted net interest margin (tax equivalent) adjusted for acquisition accounting adjustments was 4.17%. Please refer to the non-GAAP reconciliation in the appendix. Includes $9.6 million of acquisition accounting adjustments; Adjusted net interest margin (tax equivalent) adjusted for acquisition accounting adjustments was 4.00%. Please refer to the non-GAAP reconciliation in the appendix. Annualized for the quarter ending June 30 for each respective year. (4) (5) 5 yr CAGR: Net Income 30.3%, EPS 11.6% (6) (6)
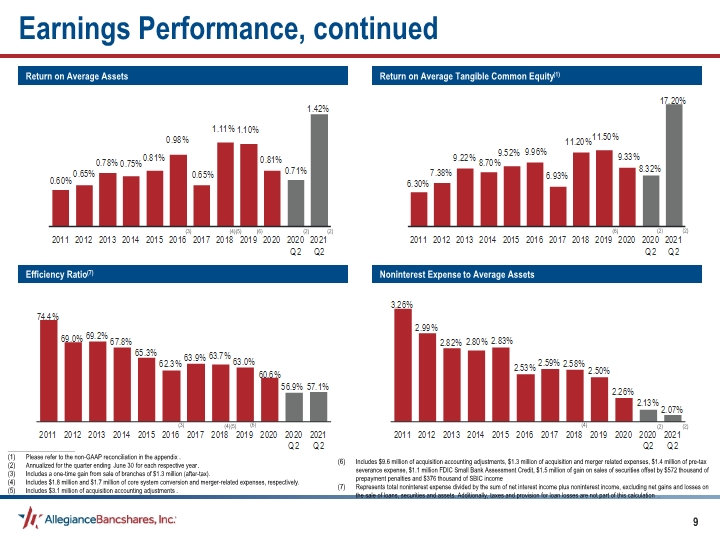
Return on Average Tangible Common Equity(1) Return on Average Assets Noninterest Expense to Average Assets Efficiency Ratio(7) _____________________ Please refer to the non-GAAP reconciliation in the appendix. Annualized for the quarter ending June 30 for each respective year. Includes a one-time gain from sale of branches of $1.3 million (after-tax). Includes $1.8 million and $1.7 million of core system conversion and merger-related expenses, respectively. Includes $3.1 million of acquisition accounting adjustments. Includes $9.6 million of acquisition accounting adjustments, $1.3 million of acquisition and merger related expenses, $1.4 million of pre-tax severance expense, $1.1 million FDIC Small Bank Assessment Credit, $1.5 million of gain on sales of securities offset by $572 thousand of prepayment penalties and $376 thousand of SBIC income Includes $9.6 million of acquisition accounting adjustments, $1.3 million of acquisition and merger related expenses, $1.4 million of pre-tax severance expense, $1.1 million FDIC Small Bank Assessment Credit, $1.5 million of gain on sales of securities offset by $572 thousand of prepayment penalties and $376 thousand of SBIC income Includes $9.6 million of acquisition accounting adjustments, $1.3 million of acquisition and merger related expenses, $1.4 million of pre-tax severance expense, $1.1 million FDIC Small Bank Assessment Credit, $1.5 million of gain on sales of securities offset by $572 thousand of prepayment penalties and $376 thousand of SBIC income Includes $9.6 million of acquisition accounting adjustments, $1.3 million of acquisition and merger related expenses, $1.4 million of pre-tax severance expense, $1.1 million FDIC Small Bank Assessment Credit, $1.5 million of gain on sales of securities offset by $572 thousand of prepayment penalties and $376 thousand of SBIC income Includes $9.6 million of acquisition accounting adjustments, $1.3 million of acquisition and merger related expenses, $1.4 million of pre-tax severance expense, $1.1 million FDIC Small Bank Assessment Credit, $1.5 million of gain on sales of securities offset by $572 thousand of prepayment penalties and $376 thousand of SBIC income Includes $9.6 million of acquisition accounting adjustments, $1.3 million of acquisition and merger related expenses, $1.4 million of pre-tax severance expense, $1.1 million FDIC Small Bank Assessment Credit, $1.5 million of gain on sales of securities offset by $572 thousand of prepayment penalties and $376 thousand of SBIC income Represents total noninterest expense divided by the sum of net interest income plus noninterest income, excluding net gains and losses on the sale of loans, securities and assets. Additionally, taxes and provision for loan losses are not part of this calculation. (3) (4)(5) (6) (6) (6) (4)(5) (4) (3) Earnings Performance, continued (2) (2) (2) (2) (2) (2)
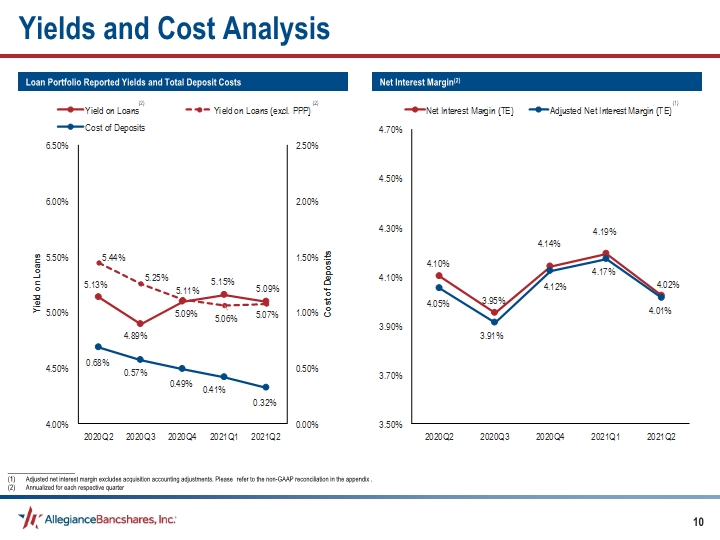
Yields and Cost Analysis Net Interest Margin(2) Loan Portfolio Reported Yields and Total Deposit Costs _____________________ Adjusted net interest margin excludes acquisition accounting adjustments. Please refer to the non-GAAP reconciliation in the appendix. Annualized for each respective quarter (1) (2) (2)
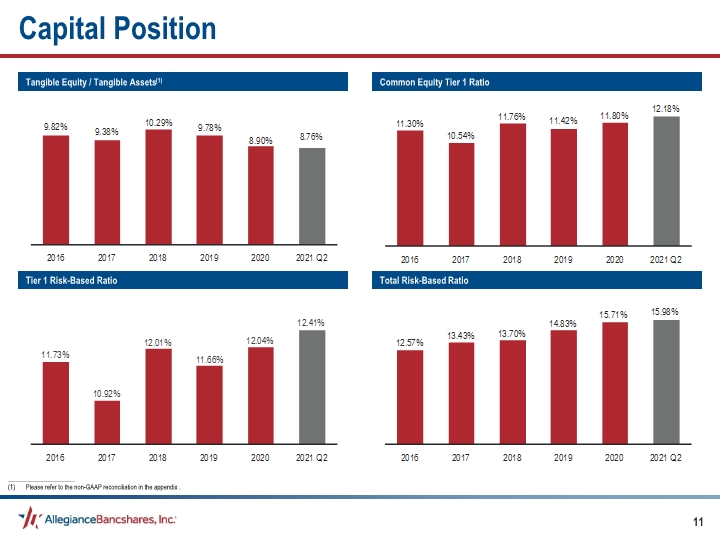
Common Equity Tier 1 Ratio Tangible Equity / Tangible Assets(1) Total Risk-Based Ratio Tier 1 Risk-Based Ratio Capital Position _____________________ Please refer to the non-GAAP reconciliation in the appendix.
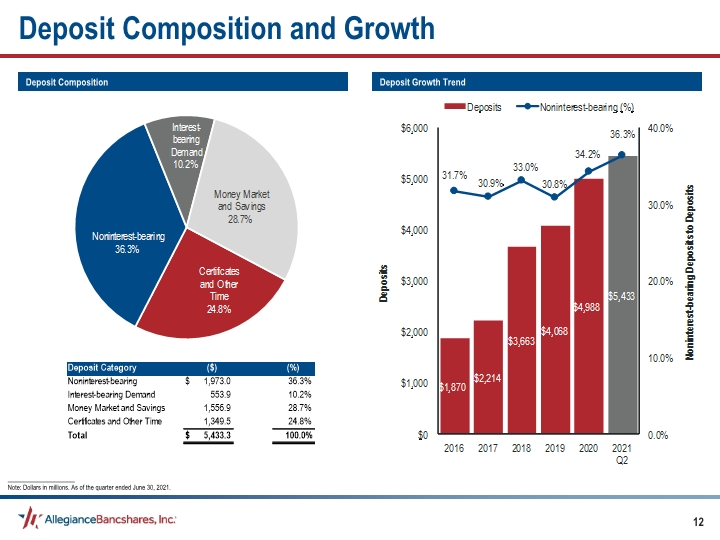
Deposit Composition and Growth Deposit Growth Trend Deposit Composition _____________________ Note: Dollars in millions. As of the quarter ended June 30, 2021.
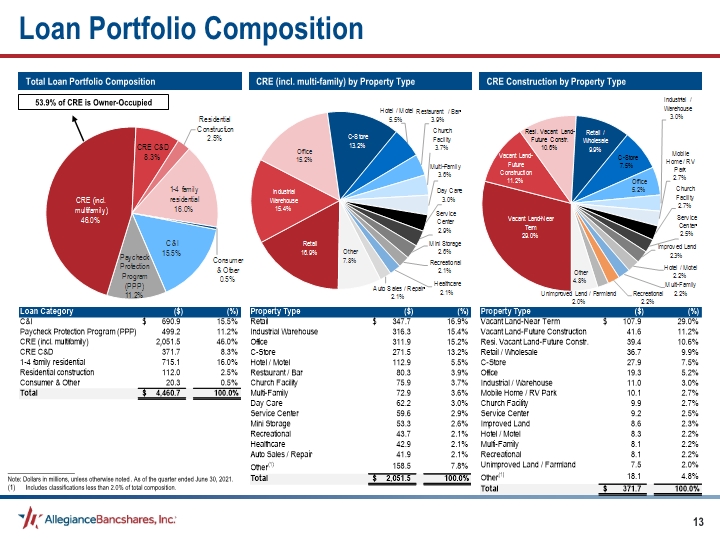
Total Loan Portfolio Composition 53.9% of CRE is Owner-Occupied CRE (incl. multi-family) by Property Type CRE Construction by Property Type _____________________ Note: Dollars in millions, unless otherwise noted. As of the quarter ended June 30, 2021. Includes classifications less than 2.0% of total composition. Loan Portfolio Composition
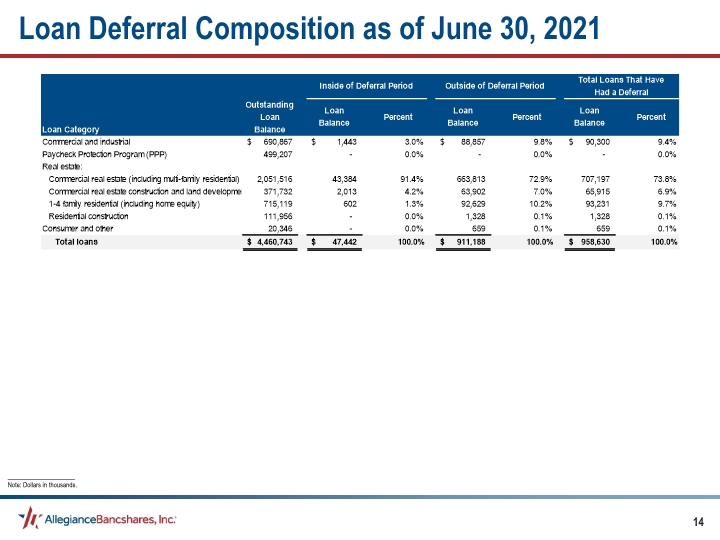
Loan Deferral Composition as of June 30, 2021 _____________________ Note: Dollars in thousands.
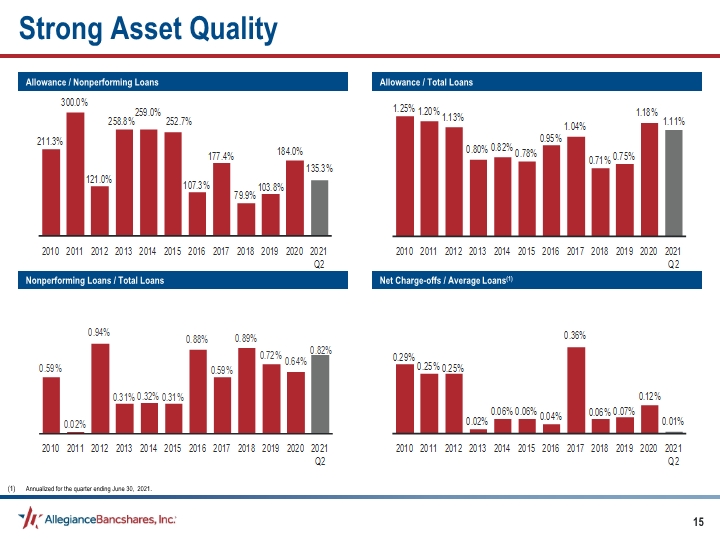
Allowance / Total Loans Allowance / Nonperforming Loans Net Charge-offs / Average Loans(1) Nonperforming Loans / Total Loans Strong Asset Quality Annualized for the quarter ending June 30, 2021.
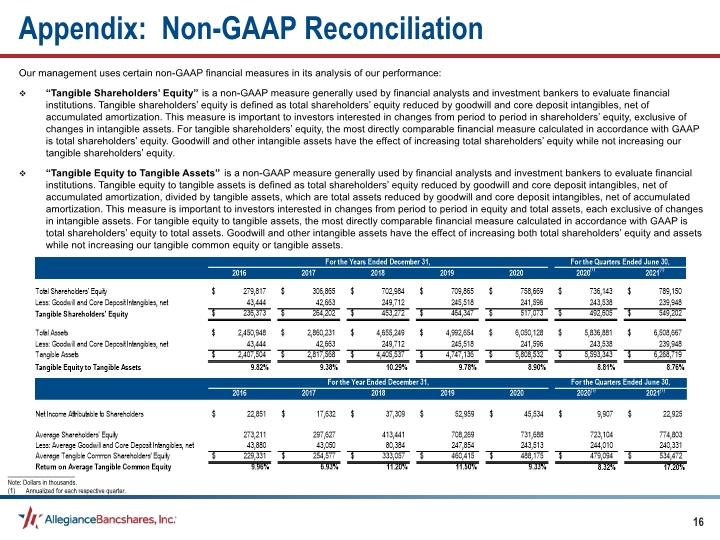
Our management uses certain non-GAAP financial measures in its analysis of our performance: “Tangible Shareholders’ Equity” is a non-GAAP measure generally used by financial analysts and investment bankers to evaluate financial institutions. Tangible shareholders’ equity is defined as total shareholders’ equity reduced by goodwill and core deposit intangibles, net of accumulated amortization. This measure is important to investors interested in changes from period to period in shareholders’ equity, exclusive of changes in intangible assets. For tangible shareholders’ equity, the most directly comparable financial measure calculated in accordance with GAAP is total shareholders’ equity. Goodwill and other intangible assets have the effect of increasing total shareholders’ equity while not increasing our tangible shareholders’ equity. “Tangible Equity to Tangible Assets” is a non-GAAP measure generally used by financial analysts and investment bankers to evaluate financial institutions. Tangible equity to tangible assets is defined as total shareholders’ equity reduced by goodwill and core deposit intangibles, net of accumulated amortization, divided by tangible assets, which are total assets reduced by goodwill and core deposit intangibles, net of accumulated amortization. This measure is important to investors interested in changes from period to period in equity and total assets, each exclusive of changes in intangible assets. For tangible equity to tangible assets, the most directly comparable financial measure calculated in accordance with GAAP is total shareholders’ equity to total assets. Goodwill and other intangible assets have the effect of increasing both total shareholders’ equity and assets while not increasing our tangible common equity or tangible assets. Appendix: Non-GAAP Reconciliation _____________________ Note: Dollars in thousands. Annualized for each respective quarter.
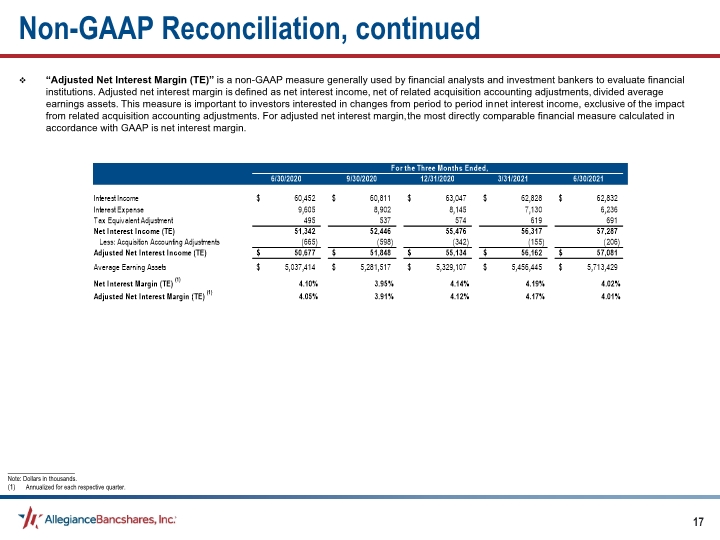
Non-GAAP Reconciliation, continued “Adjusted Net Interest Margin (TE)” is a non-GAAP measure generally used by financial analysts and investment bankers to evaluate financial institutions. Adjusted net interest margin is defined as net interest income, net of related acquisition accounting adjustments, divided average earnings assets. This measure is important to investors interested in changes from period to period in net interest income, exclusive of the impact from related acquisition accounting adjustments. For adjusted net interest margin, the most directly comparable financial measure calculated in accordance with GAAP is net interest margin. _____________________ Note: Dollars in thousands. Annualized for each respective quarter.
