Attached files
| file | filename |
|---|---|
| EX-99.2 - EX-99.2 FINANCIAL SUPPLEMENT FISCAL THIRD QUARTER 2021 OF RJF - RAYMOND JAMES FINANCIAL INC | rjf0630q321supplement.htm |
| EX-99.1 - EX-99.1 PRESS RELEASE DATED JULY 28, 2021 - RAYMOND JAMES FINANCIAL INC | rjf20210630q321earnings.htm |
| 8-K - 8-K - RAYMOND JAMES FINANCIAL INC | rjf-20210728.htm |

FISCAL 3Q21 RESULTS July 28, 2021

2 Paul Reilly Chairman & CEO, Raymond James Financial OVERVIEW OF RESULTS

3 * These are non-GAAP measures. See the schedule in the Appendix of this presentation for a reconciliation of our non-GAAP measures to the most directly comparable GAAP measures and for more information on these measures. There were no non-GAAP adjustments to earnings in 3Q20 and 2Q21; therefore percent changes for earnings-related non-GAAP financial measures are calculated based on non-GAAP financial measures for the current periods as compared to GAAP results for the comparative periods. FISCAL 3Q21 HIGHLIGHTS $ in millions, except per share amounts 3Q21 vs. 3Q20 vs. 2Q21 As Reported: Net revenues RECORD $ 2,471 35% 4% Net income $ 307 78% (14)% Earnings per common share - diluted $ 2.18 77% (13)% 3Q20 2Q21 Return on equity 15.9 % 10.0% 19.0% vs. 3Q20 vs. 2Q21 Non-GAAP Measures:* Adjusted net income RECORD $ 386 124% 9% Adjusted earnings per common share - diluted RECORD $ 2.74 123% 9% 3Q20 2Q21 Adjusted return on equity 19.9 % NA NA Return on tangible common equity 17.7 % 10.9% 21.2% Adjusted return on tangible common equity 22.2 % NA NA

4 FISCAL 3Q21 KEY METRICS $ in billions 3Q21 vs. 3Q20 vs. 2Q21 Client assets under administration RECORD $ 1,165.0 33% 7% Private Client Group (PCG) assets under administration RECORD $ 1,102.9 32% 7% PCG assets in fee-based accounts RECORD $ 616.7 39% 9% Financial assets under management RECORD $ 191.0 31% 7% Total clients' domestic cash sweep balances RECORD $ 62.9 21% —% PCG financial advisors RECORD 8,413 3% 1% Bank loans, net RECORD $ 23.9 13% 4% Note: Records indicated as of quarter-end date and do not reflect monthly reported data.

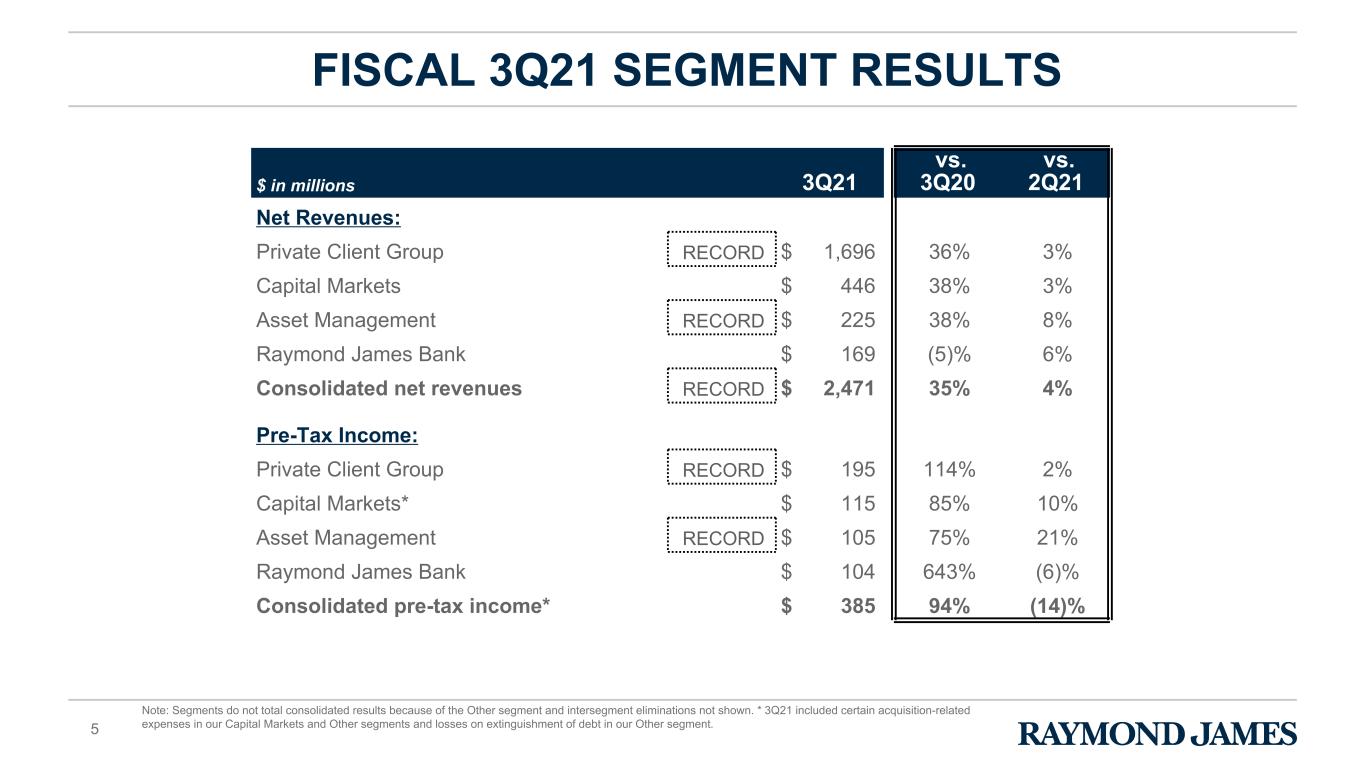
5 FISCAL 3Q21 SEGMENT RESULTS $ in millions 3Q21 vs. 3Q20 vs. 2Q21 Net Revenues: Private Client Group RECORD $ 1,696 36% 3% Capital Markets $ 446 38% 3% Asset Management RECORD $ 225 38% 8% Raymond James Bank $ 169 (5)% 6% Consolidated net revenues RECORD $ 2,471 35% 4% Pre-Tax Income: Private Client Group RECORD $ 195 114% 2% Capital Markets* $ 115 85% 10% Asset Management RECORD $ 105 75% 21% Raymond James Bank $ 104 643% (6)% Consolidated pre-tax income* $ 385 94% (14)% Note: Segments do not total consolidated results because of the Other segment and intersegment eliminations not shown. * 3Q21 included certain acquisition-related expenses in our Capital Markets and Other segments and losses on extinguishment of debt in our Other segment.

6 FYTD 2021 HIGHLIGHTS (9 months) $ in millions, except per share amounts FYTD 2021 vs. FYTD 2020 As Reported: Net revenues RECORD $ 7,065 20% Net income RECORD $ 974 60% Earnings per common share - diluted RECORD $ 6.92 60% FYTD 2020 Return on equity 17.4 % 11.9% vs. FYTD 2020 Non-GAAP Measures:* Adjusted net income RECORD $ 1,055 73% Adjusted earnings per common share - diluted RECORD $ 7.50 73% FYTD 2020 Adjusted return on equity 18.7 % NA Return on tangible common equity 19.3 % 13.1% Adjusted return on tangible common equity 20.8 % NA Note: FYTD 2021 is from the period October 1, 2020 to June 30, 2021; FYTD 2020 is from the period October 1, 2019 to June 30, 2020. * These are non-GAAP measures. See the schedule in the Appendix of this presentation for a reconciliation of our non-GAAP measures to the most directly comparable GAAP measures and for more information on these measures. There were no non-GAAP adjustments to earnings in FYTD 2020; therefore percent changes for earnings-related non-GAAP financial measures are calculated based on non-GAAP financial measures for the current periods as compared to GAAP results for the comparative periods.

7 FYTD 2021 SEGMENT RESULTS (9 months) $ in millions FYTD 2021 vs. FYTD 2020 Net Revenues: Private Client Group RECORD $ 4,810 16% Capital Markets RECORD $ 1,331 51% Asset Management RECORD $ 629 18% Raymond James Bank $ 496 (18)% Consolidated net revenues RECORD $ 7,065 20% Pre-Tax Income: Private Client Group RECORD $ 527 27% Capital Markets* RECORD $ 349 193% Asset Management RECORD $ 275 33% Raymond James Bank $ 286 75% Consolidated pre-tax income* RECORD $ 1,231 55% Note: FYTD 2021 is from the period October 1, 2020 to June 30, 2021; FYTD 2020 is from the period October 1, 2019 to June 30, 2020; Segments do not total consolidated results because of the Other segment and intersegment eliminations not shown. * FYTD 2021 included certain acquisition-related expenses in our Capital Markets and Other segments and losses on extinguishment of debt in our Other segment.

8 Paul Shoukry Chief Financial Officer, Raymond James Financial FINANCIAL REVIEW

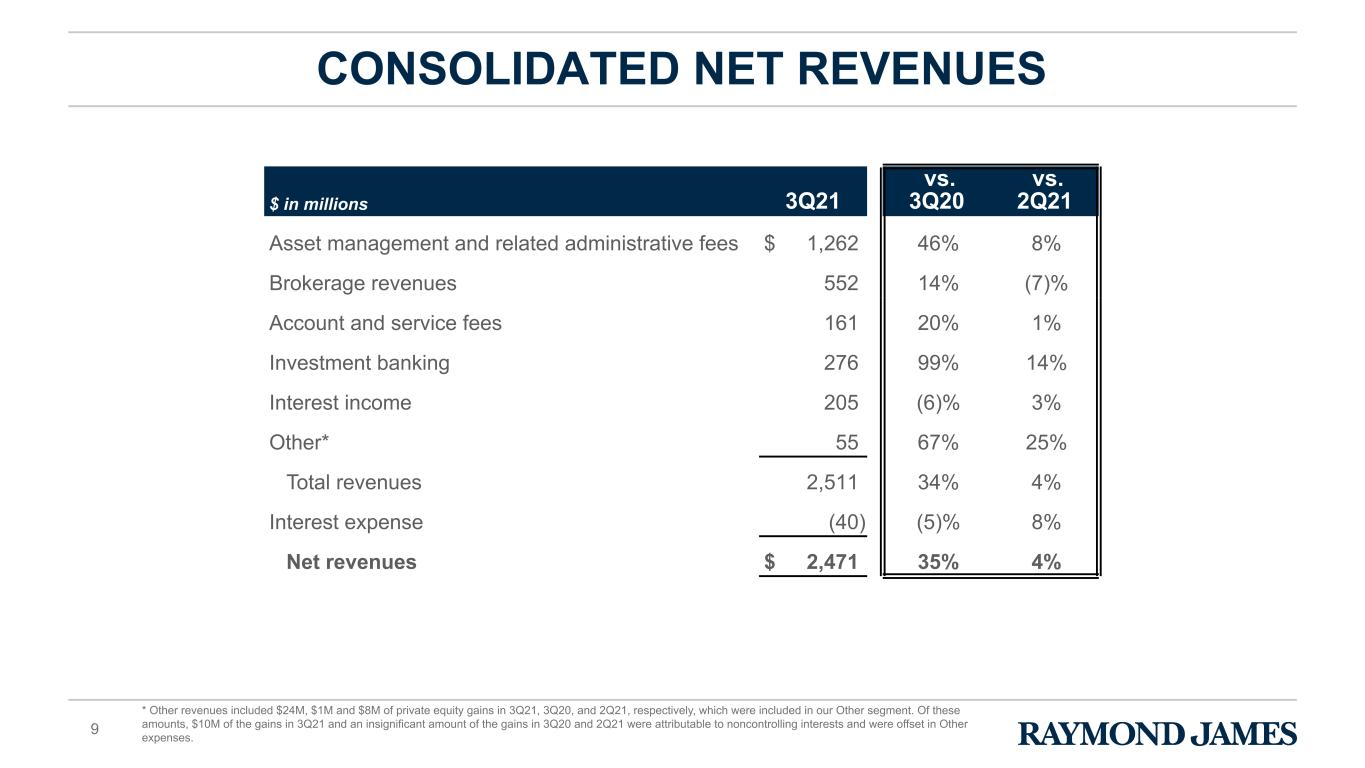
9 CONSOLIDATED NET REVENUES $ in millions 3Q21 vs. 3Q20 vs. 2Q21 Asset management and related administrative fees $ 1,262 46% 8% Brokerage revenues 552 14% (7)% Account and service fees 161 20% 1% Investment banking 276 99% 14% Interest income 205 (6)% 3% Other* 55 67% 25% Total revenues 2,511 34% 4% Interest expense (40) (5)% 8% Net revenues $ 2,471 35% 4% * Other revenues included $24M, $1M and $8M of private equity gains in 3Q21, 3Q20, and 2Q21, respectively, which were included in our Other segment. Of these amounts, $10M of the gains in 3Q21 and an insignificant amount of the gains in 3Q20 and 2Q21 were attributable to noncontrolling interests and were offset in Other expenses.

10 Note: May not total due to rounding. * Raymond James Bank Deposit Program (RJBDP) is a multi-bank sweep program in which clients' cash deposits in their brokerage accounts are swept into interest-bearing deposit accounts at Raymond James Bank and various third-party banks. C lie nt s' D om es tic C as h Sw ee p B al an ce s ($ B ) C ash Sw eep B alances as a % of D om estic PC G A U A Clients' Domestic Cash Sweep Balances as a % of Domestic PCG Assets Under Administration (AUA) 24.1 25.6 26.7 28.2 29.3 24.7 26.0 26.1 25.1 25.1 3.2 4.0 8.8 9.5 8.651.9 55.6 61.6 62.8 62.9 6.6% 6.7% 6.7% 6.5% 6.1% 3Q20 4Q20 1Q21 2Q21 3Q21 DOMESTIC CASH SWEEP BALANCES Year-over-year change: 21% Sequential change: —% RJBDP - RJ Bank* RJBDP - Third-Party Banks* Client Interest Program

11 NET INTEREST INCOME & RJBDP FEES (THIRD-PARTY BANKS) * As reported in Account and Service Fees in the PCG segment. ** Computed by dividing annualized RJBDP fees - third-party banks, which are net of the interest expense paid to clients by the third-party banks, by the average daily RJBDP balance at third-party banks. Firmwide Net Interest Income RJBDP Fees (Third-Party Banks)* $ in m ill io ns 195 180 186 182 183 175 159 165 163 165 20 21 21 19 18 3Q20 4Q20 1Q21 2Q21 3Q21 Average Yield on RJBDP (Third-Party Banks)** 0.33% 0.33% 0.31% 0.30% 0.29% 3Q20 4Q20 1Q21 2Q21 3Q21 Net Interest Margin 2.29% 2.09% 2.02% 1.94% 1.92% 1.75% 1.56% 1.45% 1.32% 1.31% 3Q20 4Q20 1Q21 2Q21 3Q21 Firmwide Net Interest Margin RJ Bank Net Interest Margin

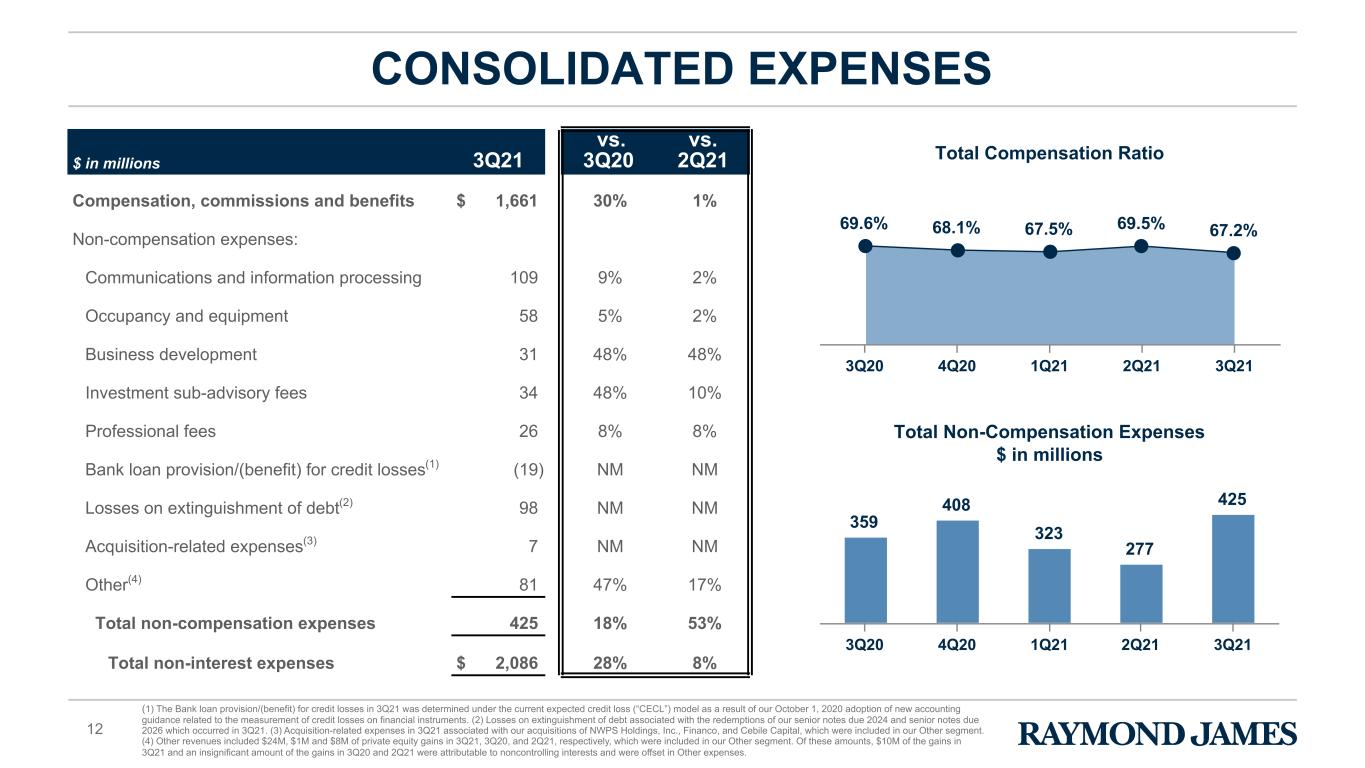
12 CONSOLIDATED EXPENSES $ in millions 3Q21 vs. 3Q20 vs. 2Q21 Compensation, commissions and benefits $ 1,661 30% 1% Non-compensation expenses: Communications and information processing 109 9% 2% Occupancy and equipment 58 5% 2% Business development 31 48% 48% Investment sub-advisory fees 34 48% 10% Professional fees 26 8% 8% Bank loan provision/(benefit) for credit losses(1) (19) NM NM Losses on extinguishment of debt(2) 98 NM NM Acquisition-related expenses(3) 7 NM NM Other(4) 81 47% 17% Total non-compensation expenses 425 18% 53% Total non-interest expenses $ 2,086 28% 8% Total Compensation Ratio 69.6% 68.1% 67.5% 69.5% 67.2% 3Q20 4Q20 1Q21 2Q21 3Q21 Total Non-Compensation Expenses $ in millions 359 408 323 277 425 3Q20 4Q20 1Q21 2Q21 3Q21 (1) The Bank loan provision/(benefit) for credit losses in 3Q21 was determined under the current expected credit loss (“CECL”) model as a result of our October 1, 2020 adoption of new accounting guidance related to the measurement of credit losses on financial instruments. (2) Losses on extinguishment of debt associated with the redemptions of our senior notes due 2024 and senior notes due 2026 which occurred in 3Q21. (3) Acquisition-related expenses in 3Q21 associated with our acquisitions of NWPS Holdings, Inc., Financo, and Cebile Capital, which were included in our Other segment. (4) Other revenues included $24M, $1M and $8M of private equity gains in 3Q21, 3Q20, and 2Q21, respectively, which were included in our Other segment. Of these amounts, $10M of the gains in 3Q21 and an insignificant amount of the gains in 3Q20 and 2Q21 were attributable to noncontrolling interests and were offset in Other expenses.

13 * 4Q20 included a $7M loss in our Capital Markets segment related to the sale of our interests in certain entities that operated predominantly in France, which closed during 1Q21, and $46M in our Other segment related to the reduction in workforce expenses associated with position eliminations that occurred in response to the economic environment. ** 3Q21 included certain acquisition-related expenses in our Capital Markets and Other segments and losses on extinguishment of debt in our Other segment. *** This is a non-GAAP measure. See the schedule in the Appendix of this presentation for a reconciliation of our non-GAAP measures to the most directly comparable GAAP measures and for more information on these measures. 10.8% 12.3% 18.0% 18.8% 15.6% 14.9% 19.8% Pre-Tax Margin (GAAP) Pre-Tax Margin (Adjusted)*** 3Q20 4Q20* 1Q21 2Q21 3Q21** CONSOLIDATED PRE-TAX MARGIN

14 OTHER FINANCIAL INFORMATION $ in millions, except per share amounts 3Q21 vs. 3Q20 vs. 2Q21 Total assets $ 57,161 28% 2% RJF corporate cash* $ 1,557 (27)% (8)% Total equity attributable to RJF $ 7,863 13% 4% Book value per share $ 57.44 13% 4% Tangible book value per share** $ 51.55 10% 4% Weighted-average common and common equivalent shares outstanding – diluted 141.1 1% —% 3Q20 2Q21 Tier 1 capital ratio*** 24.3 % 24.8% 23.6% Total capital ratio*** 25.5 % 26.0% 24.7% Tier 1 leverage ratio*** 12.6 % 14.5% 12.2% Effective tax rate 20.3 % 13.1% 20.6% * This amount includes cash on hand at the parent, as well as parent cash loaned to Raymond James & Associates ("RJ&A"), which RJ&A has invested on behalf of RJF in cash and cash equivalents or otherwise deployed in its normal business activities. ** This is a non-GAAP measure. See the schedule in the Appendix of this presentation for a reconciliation of our non-GAAP measures to the most directly comparable GAAP measures and for more information on these measures. *** Estimated.

15 Dividends Paid and Share Repurchases* $ in millions 51 101 65 114 102 50 10 60 4851 51 55 54 54 Share Repurchases* Dividends Paid 3Q20 4Q20 1Q21 2Q21 3Q21 CAPITAL MANAGEMENT $632 million remains under current share repurchase authorization Number of Shares Repurchased* (thousands) — 678 108 500 375 Average Share Price of Shares Repurchased* — $73.74 $92.79 $120.06 $128.55 * Under the Board of Directors' share repurchase authorization. Total of $433 million over the past 5 quarters

16 RAYMOND JAMES BANK KEY CREDIT TRENDS $ in millions 3Q21 vs. 3Q20 vs. 2Q21 Bank loan provision/(benefit) for credit losses* $ (19) NM NM Net charge-offs: Charge-offs related to loan sales $ 1 (98)% (50)% All other 3 (73)% NM Total net charge-offs $ 4 (94)% 100% 3Q20 2Q21 Nonperforming assets as a % of total assets 0.12 % 0.08% 0.09% Bank loan allowance for credit losses as a % of loans held for investment* 1.34 % 1.56% 1.50% Criticized loans as a % of loans held for investment 4.07 % 3.41% 4.35% * The Bank loan provision/(benefit) for credit losses in 3Q21 was determined under the current expected credit loss (“CECL”) model as a result of our October 1, 2020 adoption of new accounting guidance related to the measurement of credit losses on financial instruments.

17 OUTLOOK

APPENDIX 18

19 Note: Please refer to the footnotes on slide 22 for additional information. Three months ended Nine months ended $ in millions September 30, 2020 December 31, 2020 June 30, 2021 June 30, 2019 June 30, 2021 Net income $ 209 $ 312 $ 307 $ 769 $ 974 Non-GAAP adjustments: Losses on extinguishment of debt (1) — — 98 — 98 Acquisition and disposition-related expenses (2) 7 2 7 15 9 Reduction in workforce expenses (3) 46 — — — — Pre-tax impact of non-GAAP adjustments 53 2 105 15 107 Tax effect of non-GAAP adjustments (13) — (26) — (26) Total non-GAAP adjustments, net of tax 40 2 79 15 81 Adjusted net income $ 249 $ 314 $ 386 $ 784 $ 1,055 Pre-tax income $ 256 $ 399 $ 385 $ 1,021 $ 1,231 Pre-tax impact of non-GAAP adjustments (as detailed above) 53 2 105 15 107 Adjusted pre-tax income $ 309 $ 401 $ 490 $ 1,036 $ 1,338 Pre-tax margin (4) 12.3 % 18.0 % 15.6 % 17.9 % 17.4 % Non-GAAP adjustments: Losses on extinguishment of debt (1) — % — % 3.9 % — % 1.4 % Acquisition and disposition-related expenses (2) 0.4 % — % 0.3 % 0.2 % 0.1 % Reduction in workforce expenses (3) 2.2 % — % — % — % — % Total non-GAAP adjustments, net of tax 2.6 % — % 4.2 % 0.2 % 1.5 % Adjusted pre-tax margin (4) 14.9 % 18.0 % 19.8 % 18.1 % 18.9 % continued on next slide We utilize certain non-GAAP financial measures as additional measures to aid in, and enhance, the understanding of our financial results and related measures. These non-GAAP financial measures have been separately identified in this document. We believe certain of these non-GAAP financial measures provides useful information to management and investors by excluding certain material items that may not be indicative of our core operating results. We utilize these non-GAAP financial measures in assessing the financial performance of the business, as they facilitate a comparison of current- and prior-period results. We believe that return on tangible common equity and tangible book value per share are meaningful to investors as they facilitate comparisons of our results to the results of other companies. In the following tables, the tax effect of non-GAAP adjustments reflects the statutory rate associated with each non-GAAP item. These non-GAAP financial measures should be considered in addition to, and not as a substitute for, measures of financial performance prepared in accordance with GAAP. In addition, our non-GAAP financial measures may not be comparable to similarly titled non-GAAP financial measures of other companies. The following tables provide a reconciliation of non-GAAP financial measures to the most directly comparable GAAP measures for those periods which include non-GAAP adjustments. RECONCILIATION OF NON-GAAP FINANCIAL MEASURES TO GAAP FINANCIAL MEASURES (UNAUDITED)

20 Book value per share (6) As of $ in millions, except per share amounts June 30, 2020 March 31, 2021 June 30, 2021 Total equity attributable to Raymond James Financial, Inc. $ 6,965 $ 7,592 $ 7,863 Less non-GAAP adjustments: Goodwill and identifiable intangible assets, net 602 868 862 Deferred tax liabilities, net (33) (56) (56) Tangible common equity attributable to Raymond James Financial, Inc. $ 6,396 $ 6,780 $ 7,057 Common shares outstanding 137.0 137.2 136.9 Book value per share (6) $ 50.84 $ 55.34 $ 57.44 Tangible book value per share (6) $ 46.69 $ 49.42 $ 51.55 Three months ended Nine months ended Earnings per common share (5) June 30, 2021 June 30, 2021 Basic $ 2.24 $ 7.09 Non-GAAP adjustments: Losses on extinguishment of debt (1) 0.71 0.71 Acquisition-related expenses (2) 0.05 0.07 Tax effect of non-GAAP adjustments (0.19) (0.19) Total non-GAAP adjustments, net of tax 0.57 0.59 Adjusted basic $ 2.81 $ 7.68 Diluted $ 2.18 $ 6.92 Non-GAAP adjustments: Losses on extinguishment of debt (1) 0.69 0.70 Acquisition-related expenses (2) 0.05 0.06 Tax effect of non-GAAP adjustments (0.18) (0.18) Total non-GAAP adjustments, net of tax 0.56 0.58 Adjusted diluted $ 2.74 $ 7.50 RECONCILIATION OF NON-GAAP FINANCIAL MEASURES TO GAAP FINANCIAL MEASURES (UNAUDITED) continued on next slideNote: Please refer to the footnotes on slide 22 for additional information.

21 Return on equity Three months ended Nine months ended $ in millions June 30, 2020 March 31, 2021 June 30, 2021 June 30, 2020 June 30, 2021 Average equity (7) $ 6,882 $ 7,478 $ 7,728 $ 6,797 $ 7,483 Impact on average equity of non-GAAP adjustments: Losses on extinguishment of debt (1) NA NA 49 NA 25 Acquisition-related expenses (2) NA NA 4 NA 2 Tax effect of non-GAAP adjustments NA NA (13) NA (7) Adjusted average equity (7) NA NA $ 7,768 NA $ 7,503 Average equity (7) $ 6,882 $ 7,478 $ 7,728 $ 6,797 $ 7,483 Less: Average goodwill and identifiable intangible assets, net 603 851 865 606 791 Average deferred tax liabilities, net (32) (56) (56) (30) (51) Average tangible common equity (7) $ 6,311 $ 6,683 $ 6,919 $ 6,221 $ 6,743 Impact on average equity of non-GAAP adjustments: Losses on extinguishment of debt (1) NA NA 49 NA 25 Acquisition-related expenses (2) NA NA 4 NA 2 Tax effect of non-GAAP adjustments NA NA (13) NA (7) Adjusted average tangible common equity (7) NA NA $ 6,959 NA $ 6,763 Return on equity (8) 10.0 % 19.0 % 15.9 % 11.9 % 17.4 % Adjusted return on equity (8) NA NA 19.9 % NA 18.7 % Return on tangible common equity (8) 10.9 % 21.2 % 17.7 % 13.1 % 19.3 % Adjusted return on tangible common equity (8) NA NA 22.2 % NA 20.8 % RECONCILIATION OF NON-GAAP FINANCIAL MEASURES TO GAAP FINANCIAL MEASURES (UNAUDITED) Note: Please refer to the footnotes on slide 22 for additional information.

22 FOOTNOTES (1) Losses on extinguishment of debt as presented in the Condensed Consolidated Statements of Income include make-whole premiums, the accelerated amortization of debt issuance costs, and certain legal and other professional fees associated with the redemptions of our $250 million of 5.625% senior notes due 2024 and our $500 million of 3.625% senior notes due 2026 which occurred during our fiscal third quarter of 2021. (2) The three months ended September 30, 2020 included a $7 million loss in our Capital Markets segment related to the sale of our interests in certain entities that operated predominantly in France, which closed during our fiscal first quarter of 2021. Acquisition-related expenses for the three months ended December 31, 2020 and the three and nine months ended June 30, 2021 primarily included professional and integration expenses associated with our acquisitions of NWPS Holdings, Inc. and Financo, which were completed in December 2020 and March 2021, respectively, and Cebile Capital, announced in May 2021, which were included in our Other segment. Acquisition-related expenses for the three and nine months ended June 30, 2021 also included amortization expense related to intangible assets with short-term useful lives associated with our Financo acquisition, which was included in our Capital Markets segment. The nine months ended June 30, 2019 included a $15 million loss in our Capital Markets segment on the sale of our operations related to research, sales and trading of European equities. (3) The reduction in workforce expenses for the three months ended September 30, 2020 were associated with position eliminations in response to the economic environment. These expenses were included in our Other segment and primarily consisted of severance and related payroll expenses, as well as expenses related to company-paid benefits. (4) Pre-tax margin is computed by dividing pre-tax income by net revenues for each respective period or, in the case of adjusted pre-tax margin, computed by dividing adjusted pre-tax income by net revenues for each respective period. (5) Earnings per common share is computed by dividing net income (less allocation of earnings and dividends to participating securities) by weighted-average common shares outstanding (basic or diluted as applicable) for each respective period or, in the case of adjusted earnings per common share, computed by dividing adjusted net income (less allocation of earnings and dividends to participating securities) by weighted-average common shares outstanding (basic or diluted as applicable) for each respective period. (6) Book value per share is computed by dividing total equity attributable to Raymond James Financial, Inc. by the number of common shares outstanding at the end of each respective period or, in the case of tangible book value per share, computed by dividing tangible common equity by the number of common shares outstanding at the end of each respective period. Tangible common equity is defined as total equity attributable to Raymond James Financial, Inc. less goodwill and intangible assets, net of related deferred taxes. (7) Average equity is computed by adding total equity attributable to Raymond James Financial, Inc. as of the date indicated to the prior quarter-end total, and dividing by two, or in the case of average tangible common equity, computed by adding tangible common equity as of the date indicated to the prior quarter-end total, and dividing by two. For the year-to-date period, average equity is computed by adding the total equity attributable to Raymond James Financial, Inc. as of each quarter-end date during the indicated period to the beginning of year total, and dividing by four, or in the case of average tangible common equity, computed by adding tangible common equity as of each quarter-end date during the indicated period to the beginning of year total, and dividing by four. Adjusted average equity is computed by adjusting for the impact on average equity of the non-GAAP adjustments, as applicable for each respective period. Adjusted average tangible common equity is computed by adjusting for the impact on average tangible common equity of the non-GAAP adjustments, as applicable for each respective period. (8) Return on equity is computed by dividing annualized net income by average equity for each respective period or, in the case of return on tangible common equity, computed by dividing annualized net income by average tangible common equity for each respective period. Adjusted return on equity is computed by dividing annualized adjusted net income by adjusted average equity for each respective period, or in the case of adjusted return on tangible common equity, computed by dividing annualized adjusted net income by adjusted average tangible common equity for each respective period.
