Attached files
| file | filename |
|---|---|
| 8-K - 8-K - META FINANCIAL GROUP INC | cash-20210728.htm |
| EX-99.1 - EX-99.1 - META FINANCIAL GROUP INC | cash6302021earningsreleasea.htm |

QUARTERLY INVESTOR UPDATE THIRD QUARTER FISCAL YEAR 2021
FORWARD LOOKING STATEMENTS 2 This investor update contains “forward-looking statements” which are made in good faith by the Company pursuant to the “safe harbor” provisions of the Private Securities Litigation Reform Act of 1995. You can identify forward-looking statements by words such as “may,” “hope,” “will,” “should,” “expect,” “plan,” “anticipate,” “intend,” “believe,” “estimate,” “predict,” “potential,” “continue,” “could,” “future,” or the negative of those terms, or other words of similar meaning or similar expressions. These forward-looking statements are based on information currently available to us and assumptions about future events, and include statements with respect to the Company’s beliefs, expectations, estimates, and intentions, which are subject to significant risks and uncertainties, and are subject to change based on various factors, some of which are beyond the Company’s control. Such risks, uncertainties and other factors may cause our actual growth, results of operations, financial condition, cash flows, performance and business prospects and opportunities to differ materially from those expressed in, or implied by, these forward-looking statements. Such statements address, among others, the following subjects: future operating results; expectations in connection with the impact of the ongoing COVID-19 pandemic and related government actions on our business, our industry and the capital markets; customer retention; loan and other product demand; expectations concerning acquisitions and divestitures; new products and services, including those offered by Meta Payment Systems, Refund Advantage, EPS Financial and Specialty Consumer Services divisions; credit quality; the level of net charge-offs and the adequacy of the allowance for loan and lease losses; technology; and the Company's employees. The following factors, among others, could cause the Company's financial performance and results of operations to differ materially from the expectations, estimates, and intentions expressed in such forward-looking statements: maintaining our executive management team; expected growth opportunities may not be realized or may take longer to realize than expected; the potential adverse effects of the ongoing COVID-19 pandemic and any governmental or societal responses thereto, including the deployment and efficacy of the COVID-19 vaccines, or other unusual and infrequently occurring events; actual changes in interest rates and the Fed Funds rate; additional changes in tax laws; the strength of the United States' economy, in general, and the strength of the local economies in which the Company operates; changes in, trade, monetary, and fiscal policies and laws, including interest rate policies of the Federal Reserve; inflation, market, and monetary fluctuations; the timely and efficient development of, and acceptance of, new products and services offered by the Company or its strategic partners, as well as risks (including reputational and litigation) attendant thereto, and the perceived overall value of these products and services by users; the risks of dealing with or utilizing third parties, including, in connection with the Company’s refund advance business, the risk of reduced volume of refund advance loans as a result of reduced customer demand for or usage of the Company’s strategic partners’ refund advance products; our relationship with, and any actions which may be initiated by, our regulators; the impact of changes in financial services laws and regulations, including, but not limited to, laws and regulations relating to the tax refund industry and the insurance premium finance industry; technological changes, including, but not limited to, the protection of our electronic systems and information; the impact of acquisitions and divestitures; litigation risk; the growth of the Company’s business, as well as expenses related thereto; continued maintenance by MetaBank of its status as a well-capitalized institution, changes in consumer spending and saving habits; the impact of our participation as prepaid card issuer for the Economic Impact Payment (“EIP”) program and similar programs, losses from fraudulent or illegal activity, technological risks and developments and cyber threats, attacks or events; the success of the Company at maintaining its high quality asset level and managing and collecting assets of borrowers in default should problem assets increase; and the other factors described under the caption “Risk Factors” and in other sections of the Company’s Annual Report on Form 10-K for the Company's fiscal year ended September 30, 2020 and in other filings made by the Company with the Securities and Exchange Commission (“SEC”). The forward-looking statements included herein speak only as of the date of this investor update. The Company expressly disclaims any intent or obligation to update any forward-looking statements, whether written or oral, that may be made from time to time by or on behalf of the Company or its subsidiaries, whether as a result of new information, changed circumstances or future events or for any other reason. Meta Financial Group, Inc. (Nasdaq: CASH) | Quarterly Investor Presentation

3 WE STRIVE TO INCREASE FINANCIAL AVAILABILITY, CHOICE, AND OPPORTUNITY THROUGH FINANCIAL EMPOWERMENT. We work to disrupt traditional banking norms by developing partnerships with fintechs, affinity groups, government agencies, and other banks to make a range of quality financial products and services available to the communities we serve nationally. Our national bank charter, coordination with regulators, and deep understanding of risk mitigation and compliance allows us to guide our partners and deliver the financial products and services that meet the needs of those who need them most. We believe in financial inclusion for all®. Meta Financial Group, Inc. (Nasdaq: CASH) | Quarterly Investor Presentation
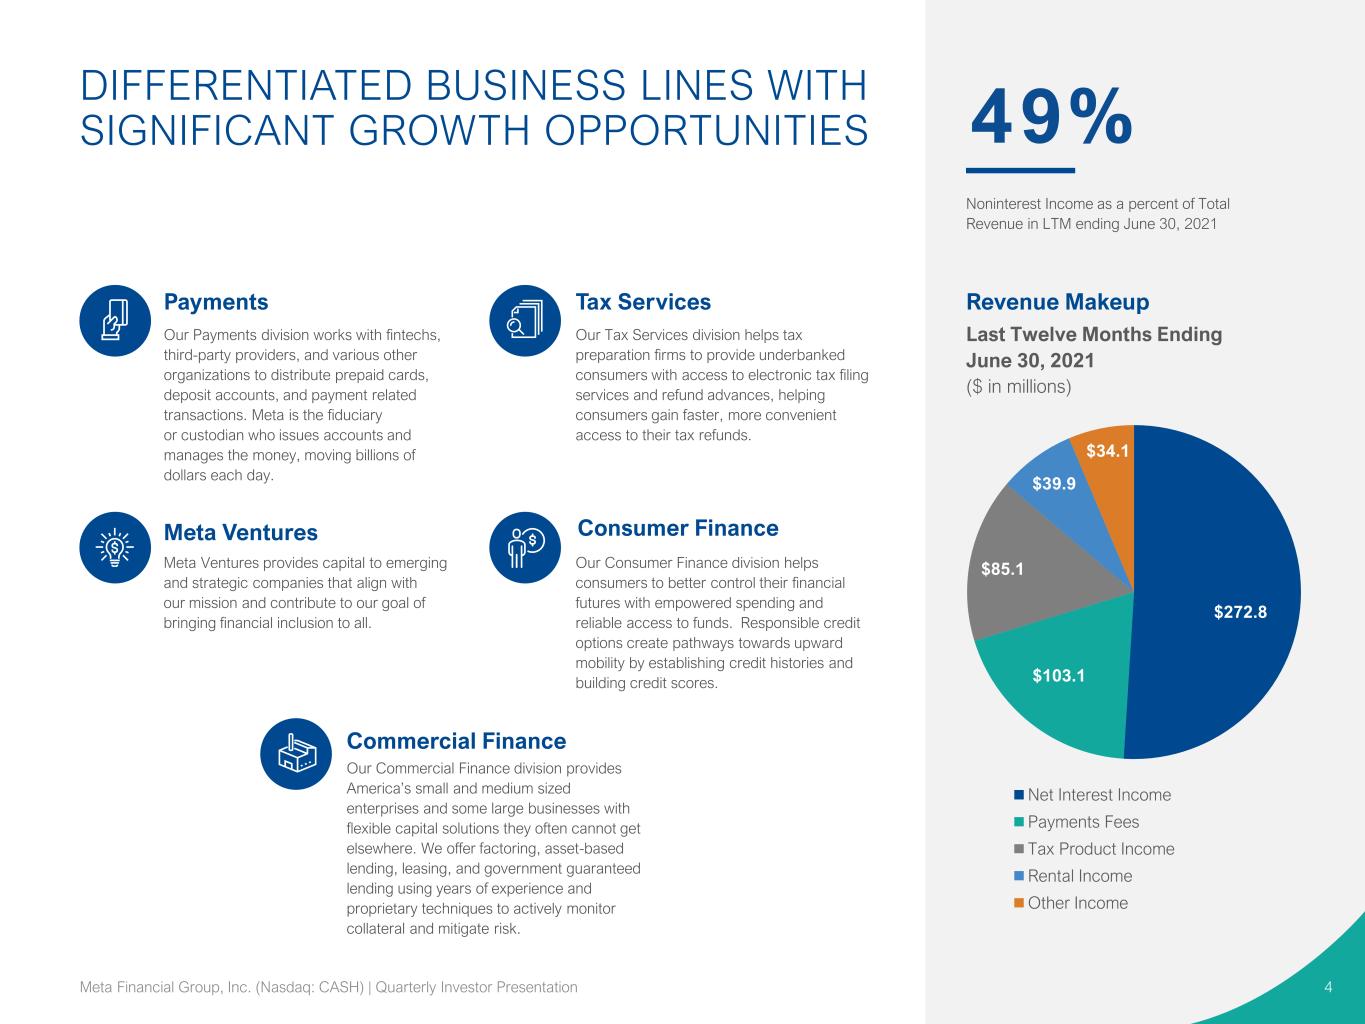
DIFFERENTIATED BUSINESS LINES WITH SIGNIFICANT GROWTH OPPORTUNITIES 49% $272.8 $103.1 $85.1 $39.9 $34.1 Net Interest Income Payments Fees Tax Product Income Rental Income Other Income Noninterest Income as a percent of Total Revenue in LTM ending June 30, 2021 Consumer Finance Our Consumer Finance division helps consumers to better control their financial futures with empowered spending and reliable access to funds. Responsible credit options create pathways towards upward mobility by establishing credit histories and building credit scores. Meta Ventures provides capital to emerging and strategic companies that align with our mission and contribute to our goal of bringing financial inclusion to all. Our Tax Services division helps tax preparation firms to provide underbanked consumers with access to electronic tax filing services and refund advances, helping consumers gain faster, more convenient access to their tax refunds. Tax Services Our Payments division works with fintechs, third-party providers, and various other organizations to distribute prepaid cards, deposit accounts, and payment related transactions. Meta is the fiduciary or custodian who issues accounts and manages the money, moving billions of dollars each day. Payments Meta Ventures Our Commercial Finance division provides America’s small and medium sized enterprises and some large businesses with flexible capital solutions they often cannot get elsewhere. We offer factoring, asset-based lending, leasing, and government guaranteed lending using years of experience and proprietary techniques to actively monitor collateral and mitigate risk. Commercial Finance Revenue Makeup Last Twelve Months Ending June 30, 2021 ($ in millions) 4Meta Financial Group, Inc. (Nasdaq: CASH) | Quarterly Investor Presentation
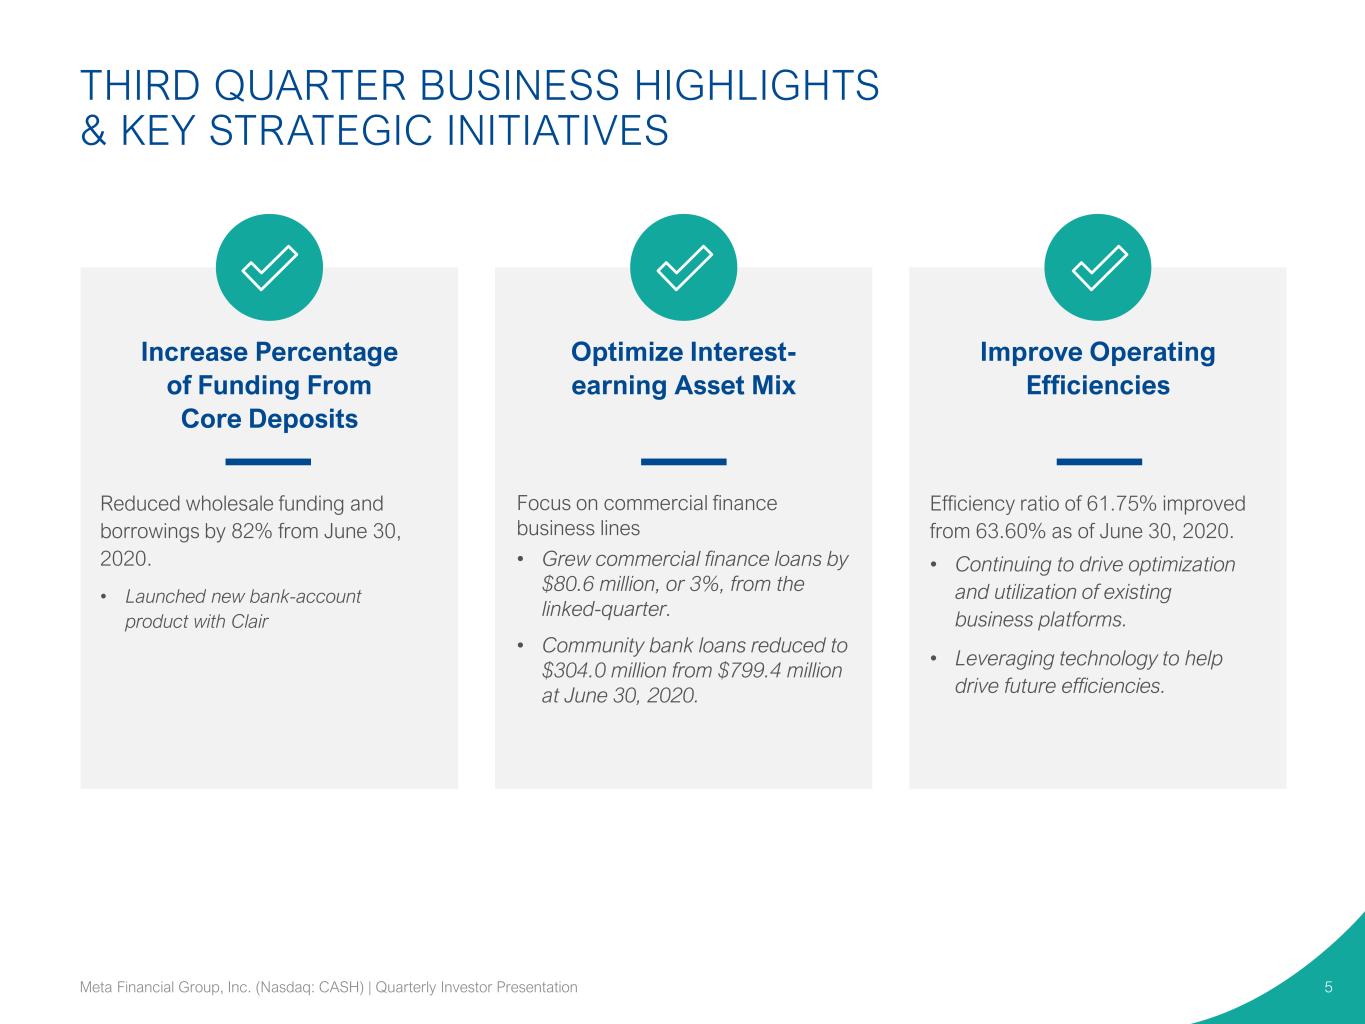
Increase Percentage of Funding From Core Deposits Optimize Interest- earning Asset Mix Improve Operating Efficiencies Efficiency ratio of 61.75% improved from 63.60% as of June 30, 2020. • Continuing to drive optimization and utilization of existing business platforms. • Leveraging technology to help drive future efficiencies. Reduced wholesale funding and borrowings by 82% from June 30, 2020. • Launched new bank-account product with Clair Focus on commercial finance business lines • Grew commercial finance loans by $80.6 million, or 3%, from the linked-quarter. • Community bank loans reduced to $304.0 million from $799.4 million at June 30, 2020. THIRD QUARTER BUSINESS HIGHLIGHTS & KEY STRATEGIC INITIATIVES 5Meta Financial Group, Inc. (Nasdaq: CASH) | Quarterly Investor Presentation

SUMMARY FINANCIAL RESULTS THIRD QUARTER ENDED JUNE 30, 2021 6 1 Amounts presented are used in the two-class earnings per common share calculation. INCOME STATEMENT ($ in thousands, except per share data) 3Q21 2Q21 3Q20 Net interest income 68,475 73,850 62,137 Provision for credit losses 4,612 30,290 15,093 Total noninterest income 62,453 113,453 41,048 Total noninterest expense 81,523 95,971 71,241 Net income before taxes 44,793 61,042 16,851 Income tax expense (benefit) 4,934 1,133 (2,426) Net income before non-controlling interest 39,859 59,909 19,277 Net income attributable to non-controlling interest 1,159 843 1,087 Net income attributable to parent 38,701 59,066 18,190 Less: Allocation of earnings to participating securities1 729 1,113 432 Net income attributable to common shareholders1 37,972 57,953 17,758 Earnings per share, diluted $1.21 $1.84 $0.53 Average diluted shares 31,338,947 31,535,022 33,815,651 Revenue of $130.9 million, a 27% increase compared to $103.2 million for the same quarter in fiscal 2020. • Strong revenue growth compared to the prior year related to payments fee income driven by increased activity related to stimulus programs and delayed timing of the tax season. Noninterest expense increased 14% to $81.5 million for the fiscal 2021 third quarter, from $71.2 million for the same quarter of last year • Driven by increases in compensation due to a return to more normalized incentive accruals and additional employees to support growth as well as increased refund transfer expense due to timing. Earnings per share increased 128% year-over-year to $1.21. Meta Financial Group, Inc. (Nasdaq: CASH) | Quarterly Investor Presentation

BALANCE SHEET HIGHLIGHTS THIRD QUARTER ENDED JUNE 30, 2021 7 BALANCE SHEET PERIOD ENDING ($ in thousands) 3Q21 2Q21 3Q20 Cash and cash equivalents 720,243 3,724,242 3,108,141 Investments 1,981,852 1,552,892 1,268,416 Loans held for sale 87,905 67,635 79,905 Loans and leases (HFI)1 3,496,670 3,657,531 3,502,646 Allowance for credit losses (91,208) (98,892) (65,747) Other assets 856,350 886,715 885,665 Total assets 7,051,812 9,790,123 8,779,026 Total deposits2 5,888,871 8,642,413 7,590,325 Total borrowings 93,634 95,336 209,781 Other liabilities 192,674 217,116 149,011 Total liabilities 6,175,179 8,954,865 7,949,117 Total stockholders’ equity 876,633 835,258 829,909 Total liabilities and stockholders’ equity 7,051,812 9,790,123 8,779,026 Loans (HFI) / Deposits 59 % 42 % 46 % Net Interest Margin 3.75 % 3.07 % 3.28 % Return on Average Assets 1.90 % 2.22 % 0.86 % Return on Average Equity 18.07 % 28.93 % 8.83 % 1Includes $143.3 million, $208.6 million, and $215.5 million of PPP loans in 3Q21, 2Q21, and 3Q20, respectively. 2Includes payments businesses deposits of $5.70 billion, $8.44 billion, and $6.76 billion for 3Q21, 2Q21, and 3Q20, respectively. Average deposits from the payments businesses for the third quarter were $6.78 billion, a 7.5% increase from $6.32 billion for the 3Q20 quarter. The effects of government stimulus programs have had a significant impact on the Company’s balance sheet. These programs include Economic Impact Payments (“EIP”), enhanced unemployment benefits that flow through to existing prepaid card programs, and Paycheck Protection Program (“PPP”) loans. Meta Financial Group, Inc. (Nasdaq: CASH) | Quarterly Investor Presentation

Quarterly Average Earning Asset Mix % in charts represent % of total interest earning assets At the Quarter Ended JUNE 30, 2021 JUNE 30, 2020 ($ in thousands) 3 Q 2 1 3 Q 2 0 Y/Y Δ COMMERCIAL FINANCE 2,586,527 2,158,905 20% Term lending 920,279 738,454 25% Asset-based lending 263,237 181,130 45% Factoring 320,629 206,361 55% Lease financing 282,940 264,988 7% Insurance premium finance 417,652 359,147 16% SBA/USDA¹ 263,709 308,611 (15)% Other commercial finance 118,081 100,214 18% CONSUMER FINANCE 227,756 241,585 (6)% Consumer credit programs 105,440 102,808 3% Other consumer finance 122,316 138,777 (12)% TAX SERVICES 41,268 19,168 115% WAREHOUSE FINANCE 335,704 277,614 21% COMMUNITY BANKING 303,984 799,437 (62)% TOTAL GROSS LOANS & LEASES HFI 3,495,239 3,496,709 0% TOTAL GROSS LOANS & LEASES HFS 87,905 79,905 10% CASH & INVESTMENTS 2,635,758 4,303,341 (39)% TOTAL EARNING ASSETS 6,250,132 7,879,955 (21)% RENTAL EQUIPMENT, NET 211,368 216,336 (2)% 1Includes balances of $143.3 million in Paycheck Protection Program loans at June 30, 2021 and $215.5 million at June 30, 2020. DIVERSIFIED EARNING ASSET PORTFOLIO 8 28%25% 36% 7% 6% 8% 1%7% 1% 12%4% 5% 50% 58% 50% 3Q202Q213Q21 Commercial Finance Target: >55% Consumer & Warehouse Finance Target: <15%Tax Services Community Bank Target: 0% Cash & Investments Target: <20% The effects of government stimulus programs in 2020 and 2021 have had a significant impact on the Company’s cash balances. Meta Financial Group, Inc. (Nasdaq: CASH) | Quarterly Investor Presentation
CONSUMER BUSINESS LINES 9Meta Financial Group, Inc. (Nasdaq: CASH) | Quarterly Investor Presentation
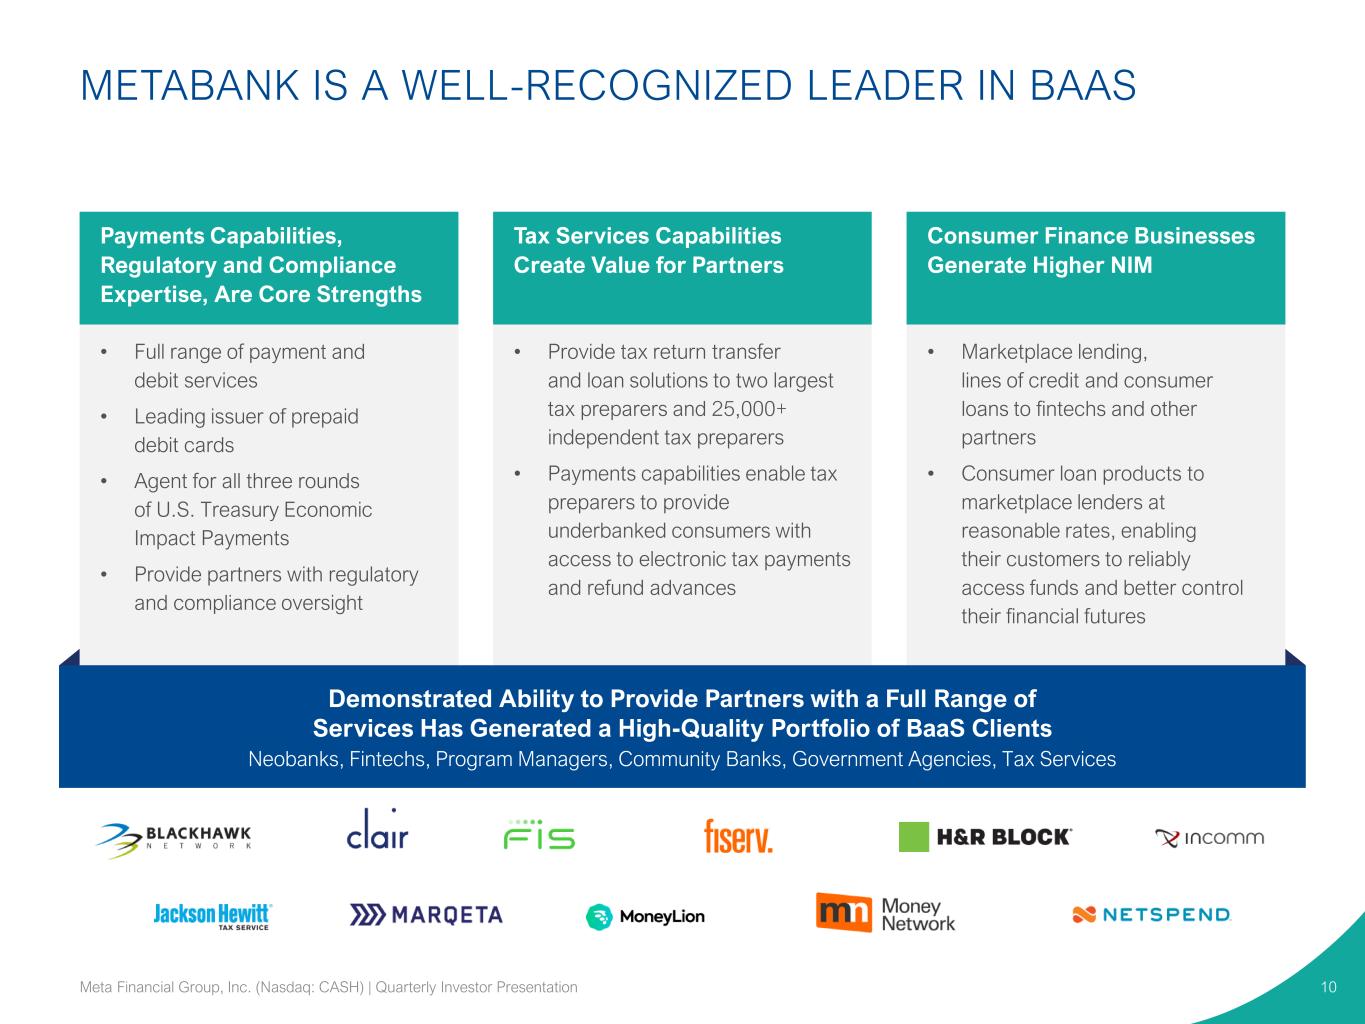
METABANK IS A WELL-RECOGNIZED LEADER IN BAAS 10 • Full range of payment and debit services • Leading issuer of prepaid debit cards • Agent for all three rounds of U.S. Treasury Economic Impact Payments • Provide partners with regulatory and compliance oversight • Provide tax return transfer and loan solutions to two largest tax preparers and 25,000+ independent tax preparers • Payments capabilities enable tax preparers to provide underbanked consumers with access to electronic tax payments and refund advances • Marketplace lending, lines of credit and consumer loans to fintechs and other partners • Consumer loan products to marketplace lenders at reasonable rates, enabling their customers to reliably access funds and better control their financial futures Payments Capabilities, Regulatory and Compliance Expertise, Are Core Strengths Tax Services Capabilities Create Value for Partners Consumer Finance Businesses Generate Higher NIM Demonstrated Ability to Provide Partners with a Full Range of Services Has Generated a High-Quality Portfolio of BaaS Clients Neobanks, Fintechs, Program Managers, Community Banks, Government Agencies, Tax Services Meta Financial Group, Inc. (Nasdaq: CASH) | Quarterly Investor Presentation

METABANK SERVES AS THE HUB OF THE PAYMENTS ECOSYSTEM 11 Regulatory/Compliance Oversight OCC Primary Regulator Issuing/Acquiring Bank End User Card Holder/ Consumer End User Merchants Processor Issuing 20+ Fintech / Program Manager Partners 50+ Community Banks 1200+ Debit/Credit Networks 20+ Fed / Settlement ATM Sponsorship 85+ ISOs Processor Acquiring 10+ Meta Financial Group, Inc. (Nasdaq: CASH) | Quarterly Investor Presentation

0.0 20,000.0 40,000.0 60,000.0 80,000.0 100,000.0 120,000.0 3Q20 2Q21 3Q21 Payments Tax Services Consumer Finance BAAS CAPABILITIES GENERATE INCREASING LOW-COST DEPOSITS AND REVENUE 12 Growth in BaaS revenue Average Payments Deposits* ($ in billions) 26% 53% 33% % of Total Revenue $6.32 $9.29 $6.79 0.0 1.0 2.0 3.0 4.0 5.0 6.0 7.0 8.0 9.0 10.0 3Q20 2Q21 3Q21 *Deposit growth reflects stimulus-related deposits as a result of Economic Impact Payments (EIP) disbursed in 2020 and 2021. **Banking Services includes ATM, ACH/Faster Payments, Merchant Acquiring Growth in BaaS payments- generated deposits Banking Services** Checking Prepaid 10% 8% 82% Meta Financial Group, Inc. (Nasdaq: CASH) | Quarterly Investor Presentation

Refund advances (“RAs”) and refund-transfers (“RTs”) leverage BaaS infrastructure and are core to MetaBank’s mission, as they allow consumers quicker access to their money. Strong revenue generation in the quarter compared to the prior year related to delayed timing of RT product income due to the extension of the tax filing deadline by the IRS. • RT product income for the overall tax season of $35.4 million, or up 5% compared to the 2020 tax season. • RA originations of $1.79 billion compared to $1.33 billion in the 2020 tax season. – 2021 tax season benefited by the addition of H&R Block relationship. TAX SERVICES ECONOMICS Three Months Ended Nine Months Ended $ in millions June 30, 2021 June 30, 2020 % Change June 30, 2021 June 30, 2020 % Change Net interest income (expense) 0.61 0.0 0% 1.03 (1.33) (177)% Tax advance product income 0.89 0.03 3062% 47.41 31.84 49% RT product income 12.07 4.59 163% 35.40 33.73 5% Total revenue $ 13.57 $ 4.62 194% $ 83.84 $ 64.24 31% Total expense 2.41 (0.15) (1710)% 11.18 10.30 8% Provision for credit losses 4.69 (0.10) (4788)% 32.82 20.41 61% Net income, pre-tax $ 6.47 $ 4.87 33% $ 39.85 $ 33.53 19% Total refund advance originations - - - $ 1,793 $ 1,335 34% Approximate loss rate¹ (9 months) 1.83 % 1.53 % 20% RELATIONSHIPS WITH FRANCHISES (H&R BLOCK, JACKSON HEWITT) RELATIONSHIPS WITH INDEPENDENTS (META TAX) Tax Season at MetaBank ramps up during the first fiscal quarter, peaks during the second fiscal quarter, and wraps up during the third fiscal quarter. As a result, performance for the nine months ended June 30 is a better reflection on the overall performance for tax season as it alleviates timing differences between quarters. TAX SEASON UPDATE 2021 1 Approximate loss rate calculated by taking provision for loan & lease losses divided by total refund advance originations. 13Meta Financial Group, Inc. (Nasdaq: CASH) | Quarterly Investor Presentation

LENDING BUSINESS LINES 14Meta Financial Group, Inc. (Nasdaq: CASH) | Quarterly Investor Presentation
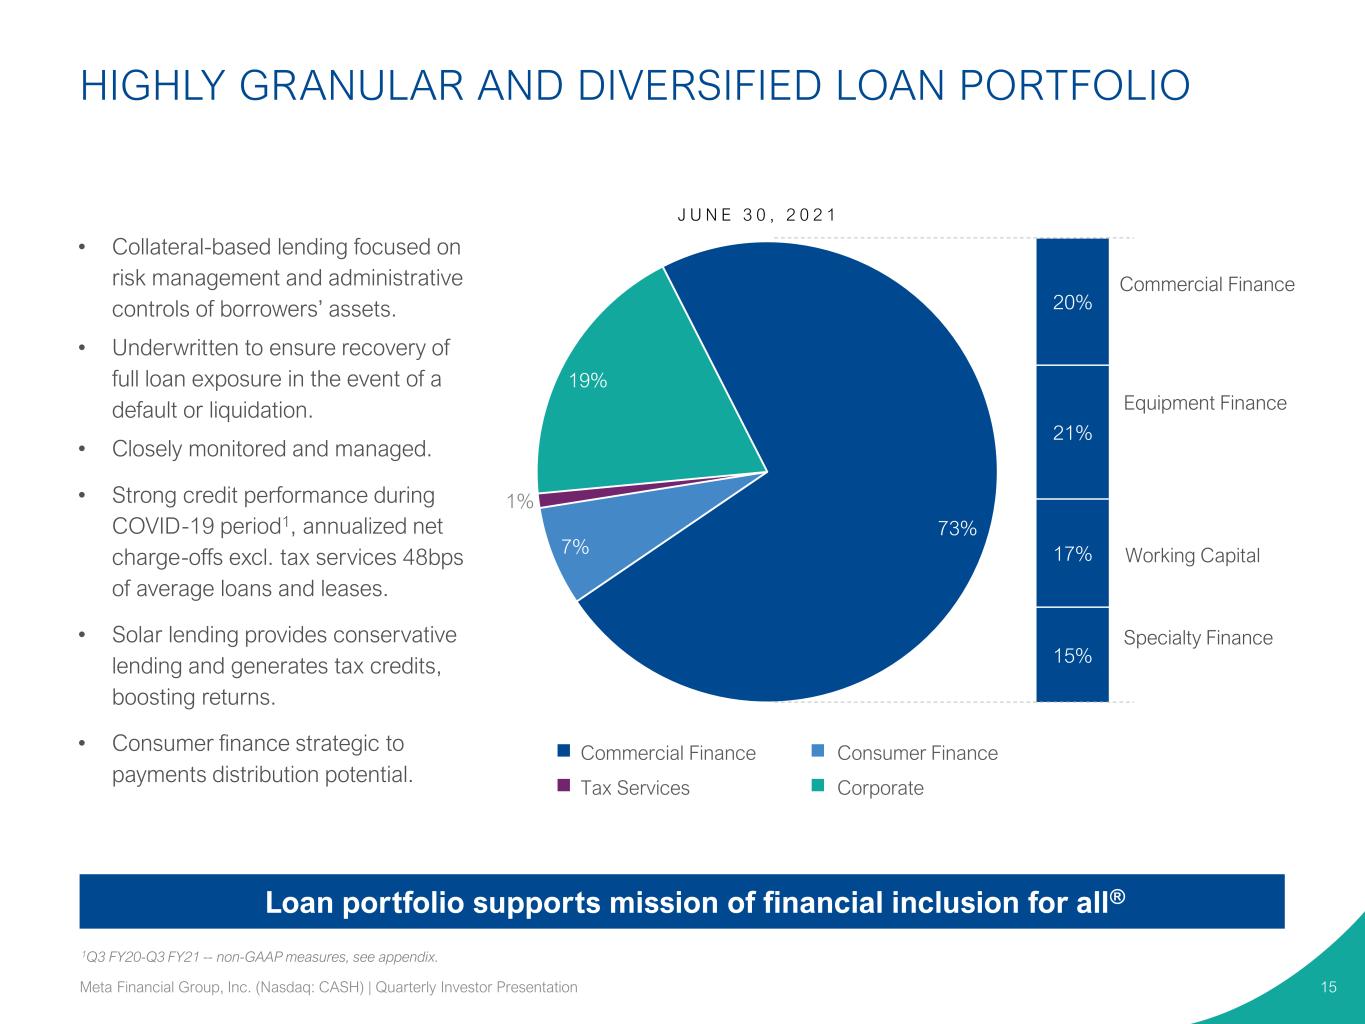
HIGHLY GRANULAR AND DIVERSIFIED LOAN PORTFOLIO 15 • Collateral-based lending focused on risk management and administrative controls of borrowers’ assets. • Underwritten to ensure recovery of full loan exposure in the event of a default or liquidation. • Closely monitored and managed. • Strong credit performance during COVID-19 period1, annualized net charge-offs excl. tax services 48bps of average loans and leases. • Solar lending provides conservative lending and generates tax credits, boosting returns. • Consumer finance strategic to payments distribution potential. Loan portfolio supports mission of financial inclusion for all® 73% 7% 1% 19% Commercial Finance Consumer Finance Tax Services Corporate 15% 17% 21% 20% Working Capital Equipment Finance Commercial Finance Specialty Finance J U N E 3 0 , 2 0 2 1 1Q3 FY20-Q3 FY21 -- non-GAAP measures, see appendix. Meta Financial Group, Inc. (Nasdaq: CASH) | Quarterly Investor Presentation
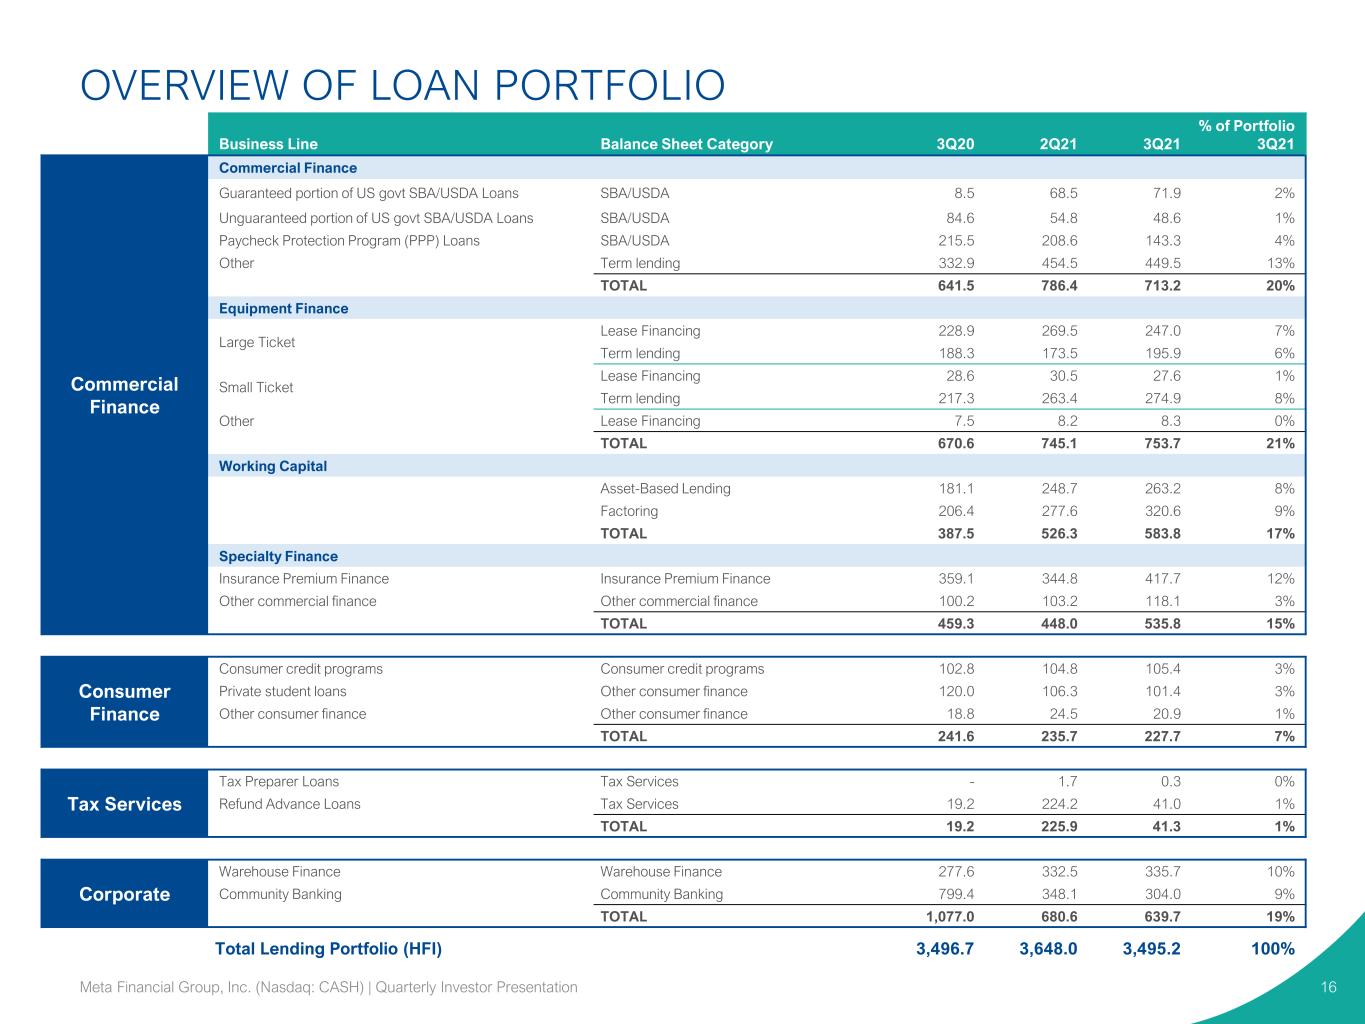
OVERVIEW OF LOAN PORTFOLIO 16 Business Line Balance Sheet Category 3Q20 2Q21 3Q21 % of Portfolio 3Q21 Commercial Finance Commercial Finance Guaranteed portion of US govt SBA/USDA Loans SBA/USDA 8.5 68.5 71.9 2% Unguaranteed portion of US govt SBA/USDA Loans SBA/USDA 84.6 54.8 48.6 1% Paycheck Protection Program (PPP) Loans SBA/USDA 215.5 208.6 143.3 4% Other Term lending 332.9 454.5 449.5 13% TOTAL 641.5 786.4 713.2 20% Equipment Finance Large Ticket Lease Financing 228.9 269.5 247.0 7% Term lending 188.3 173.5 195.9 6% Small Ticket Lease Financing 28.6 30.5 27.6 1% Term lending 217.3 263.4 274.9 8% Other Lease Financing 7.5 8.2 8.3 0% TOTAL 670.6 745.1 753.7 21% Working Capital Asset-Based Lending 181.1 248.7 263.2 8% Factoring 206.4 277.6 320.6 9% TOTAL 387.5 526.3 583.8 17% Specialty Finance Insurance Premium Finance Insurance Premium Finance 359.1 344.8 417.7 12% Other commercial finance Other commercial finance 100.2 103.2 118.1 3% TOTAL 459.3 448.0 535.8 15% Consumer Finance Consumer credit programs Consumer credit programs 102.8 104.8 105.4 3% Private student loans Other consumer finance 120.0 106.3 101.4 3% Other consumer finance Other consumer finance 18.8 24.5 20.9 1% TOTAL 241.6 235.7 227.7 7% Tax Services Tax Preparer Loans Tax Services - 1.7 0.3 0% Refund Advance Loans Tax Services 19.2 224.2 41.0 1% TOTAL 19.2 225.9 41.3 1% Corporate Warehouse Finance Warehouse Finance 277.6 332.5 335.7 10% Community Banking Community Banking 799.4 348.1 304.0 9% TOTAL 1,077.0 680.6 639.7 19% Total Lending Portfolio (HFI) 3,496.7 3,648.0 3,495.2 100% Meta Financial Group, Inc. (Nasdaq: CASH) | Quarterly Investor Presentation

• Permanent debt financing | $111.7 million outstanding (Investment Advisor) and $98.3 million outstanding (Insurance Agency) – Financed through both SBA 7(a) ($77.9 million) and Conventional ($132.1 million) product offerings. – Repeatable and predictable cash flows of insurance premiums and asset management fees are supported by underlying intangible, book of business collateral, that is generally diversified across hundreds or thousands of clients. SELECT COMMERCIAL FINANCE AREAS 17 Renewable Energy Significant lender for both solar and fuel cell power generation projects. Debt financing for renewable energy via conventional term loans and United States Department of Agriculture (“USDA”) Guaranteed Loan Programs. Investment tax credit financing via sale-leasebacks. • Renewable energy debt financing | $382.1 million outstanding1 – Safe and conservative lending characteristics with long-term power purchase agreements and low loan-to-values generates predictable cash flow and safeguards the loan’s debt service coverage capability. – Originations: $24.8 million in USDA solar loans for the third quarter of 2021 and $75.1 million in USDA solar loans in fiscal 2021. • Renewable energy investment tax credit (“ITC”) financing • Originations: $13.5 million in ITC eligible alternative energy sale-leasebacks for the third quarter of 2021, $3.4 million in total net ITC. • Total originations fiscal year-to-date 2021 of $72.0 million, resulted in $18.9 million in total net ITC. Insurance / Investment Advisory Provide business acquisition financing for insurance agencies and investment advisory practices. 1 Majority in Term Lending balance sheet category. Meta Financial Group, Inc. (Nasdaq: CASH) | Quarterly Investor Presentation

Commercial Real Estate Industry Composition ($ in millions) OUTSTANDING BALANCE % OF TOTAL¹ Commercial Real Estate $287.1 7.7% Commercial Operating 7.7 0.2% Agricultural 7.8 0.2% 1-4 Family Real Estate 1.4 0.1% Total $304.0 8.2% • All hospitality loans have resumed principal and interest payments according to the loan terms except for one loan relationship. – Occupancy and revenue per available room are showing improving trends as the summer season is underway. • $19.8 million in nonperforming community banking loans as of June 30, 2021 – Theater relationship makes up 90% of community bank nonperforming loans. – Received $7.3 million in July 2021 of shuttered venue operators grant funds of which were used to bring all payments current on the relationship. – Since June, outlook is trending favorably as reports show theater attendance that would support all operating expenses and debt service. 62% 17% 8% 6% 6% 1% Hotel/Motel Multifamily Retail Theater Office Building Other² During the quarter classified $18.1 million of community bank loans as held for sale. LEGACY COMMUNITY BANK PORTFOLIO AS OF JUNE 30, 2021 | SERVICED BY CENTRAL BANK 18 ¹ Total includes total gross loans & leases of $3.50 billion and rental equipment, net of $211.4 million, as of June 30, 2021, exposures are based on current outstanding balances as of June 30, 2021 ² Other includes subsectors comprised of less than 1% of total commercial real estate as of June 30, 2021 ($287.1 million) Meta Financial Group, Inc. (Nasdaq: CASH) | Quarterly Investor Presentation

ASSET QUALITY, INTEREST RATE RISK, & CAPITAL 19Meta Financial Group, Inc. (Nasdaq: CASH) | Quarterly Investor Presentation

$4.9 $5.5 $3.8 $3.8 $2.8 0.55% 0.63% 0.44% 0.44% 0.32% 3Q20 4Q20 1Q21 2Q21 3Q21 Period Ended NCOs NCOs / Average Loans Adjusted Net Charge-Offs (“NCOs”)¹ Excludes Tax Services NCOs and Related Seasonal Average Loans ($ in millions) KEY CREDIT METRICS • Annualized adjusted net charge-offs1: – 0.32% of average loans in 3Q21 – 0.46% of average loans over last 12 months • Allowance for credit loss $91.2 million, or 2.61% of total loans and leases, a decrease from the linked-quarter. $56.1 $48.0 $53.2 $46.7 $45.1 0.64% 0.79% 0.73% 0.48% 0.64% 3Q20 4Q20 1Q21 2Q21 3Q21 Period Ended NPAs NPAs / Total Assets ASSET QUALITY 20 1 Non-GAAP measures, see appendix for reconciliations. Tax Services NCOs and related seasonal average loans are excluded to adjust for the cyclicality of activity related to the overall economics of the tax services business line. $39.3 $34.0 $42.3 $43.5 $41.9 1.10% 0.97% 1.18% 1.17% 1.17% 3Q20 4Q20 1Q21 2Q21 3Q21 Period Ended NPLs NPLs / Total Loans Nonperforming Assets (“NPAs”) ($ in millions) Nonperforming Loans (“NPLs”) ($ in millions) Meta Financial Group, Inc. (Nasdaq: CASH) | Quarterly Investor Presentation

-10% 5% 20% 35% -100 +100 +200 +300 Parallel Shock Ramp 1 Fixed rate securities, loans and leases are shown for contractual periods. -2,000 0 2,000 4,000 6,000 Month 1-12 Month 13-36 Month 37-60 Month 61-180 V o lu m e ( $ M M ) Period Variance Total Assets Total Liabilities INTEREST RATE RISK MANAGEMENT JUNE 30, 2021 21 11% 25% 11% 53% • Low-rate environment -- focus is on reducing wholesale funding and redeploying deposits and assets into positive carry opportunities. • Interest rate risk shows asset sensitive balance sheet - net interest income modeled under an instantaneous, parallel rate shock and a gradual parallel ramp. • Management also employs rigorous modeling techniques under a variety of yield curve shapes, twists and ramps. Fixed Rate > 1 Year 12-Month Interest Rate Sensitivity from Base Net Interest Income Earning Asset Pricing Attributes1 Asset/Liability Gap Analysis Fixed Rate < 1 Year Floating or Variable Federal Reserve Bank Deposits (Floating or Variable) Meta Financial Group, Inc. (Nasdaq: CASH) | Quarterly Investor Presentation

5.91% 6.58% 7.39% 4.75% 6.85%6.89% 7.56% 8.60% 5.47% 7.83% 3Q20 4Q20 1Q21 2Q21 3Q21 CAPITAL AND SOURCES OF LIQUIDITY REGULATORY CAPITAL AS OF JUNE 30, 2021 Minimum Requirement to be Well-Capitalized under Prompt Corrective Action Provisions Meta Financial Group, Inc. MetaBank, N.A. Capital Ratio Trends At June 30, 2021¹ Meta Financial Group, Inc. MetaBank, N.A. Tier 1 Leverage 6.85% 7.83% Tier 1 Leverage – EIP-adjusted² N/A 7.95% Common Equity Tier 1 12.76% 14.94% Tier 1 Capital 13.11% 14.96% Total Capital 16.18% 16.22% • MetaBank remains well-capitalized. Granted temporary exemption from meeting certain capital leverage ratios by the OCC, related to participation in distributing Bank-issued EIP cards. • Tier 1 Leverage ratios impacted from government stimulus programs mentioned above. – MetaBank EIP-adjusted Tier 1 Leverage of 7.95% better reflects the balance sheet reducing the impact from the temporary EIP card-related balances. Primary & Secondary Liquidity Sources ($ in millions) Cash and Cash Equivalents $720 Unpledged Investment Securities $1,020 FHLB Borrowing Capacity $780 Funds Available through Fed Discount Window $235 PPP Loan Collateral $140 Unsecured Lines of Credit $1,265 - $1,535 EIP Deposit Balances Held at Other Banks $2,710 14.99% 15.30% 14.14% 14.65% 16.18% 15.12% 15.26% 14.14% 14.66% 16.22% 3Q20 4Q20 1Q21 2Q21 3Q21 10% 5% 22 Total Capital Ratio Tier 1 Leverage Ratio 1 Regulatory capital reflects the Company's election of the five-year CECL transition for regulatory capital purposes. Amounts are preliminary pending completion and filing of the Company's regulatory reports. ² Non-GAAP measure, see appendix for reconciliations. Meta Financial Group, Inc. (Nasdaq: CASH) | Quarterly Investor Presentation

APPENDIX 23Meta Financial Group, Inc. (Nasdaq: CASH) | Quarterly Investor Presentation

June 30, 2021 March 31, 2021 COUNT $ BALANCE COUNT $ BALANCE COMMUNITY BANK 9 $ 36.6 15 $58.7 Hospitality 9 36.6 11 40.8 Movie Theater 0 - 4 17.9 COMMERCIAL FINANCE 24 $3.2 55 $5.8 Small ticket equipment finance 23 1.6 55 5.8 Other commercial finance 1 1.6 0 - CONSUMER 50 $1.6 76 $1.9 TOTAL 83 $41.5 146 $66.4 % TOTAL LOANS AND LEASES (excl. PPP) 1% 2% ACTIVE COVID-19 LOAN AND LEASE MODIFICATIONS AND DEFERRALS 24 Excluding PPP loans, active deferments and modifications decreased from $66.4 million or 2% of total gross loans and leases at March 31, 2021 to $43.1 million or 1% of total gross loans and leases at June 30, 2021. Meta Financial Group, Inc. (Nasdaq: CASH) | Quarterly Investor Presentation

THREE MONTHS ENDED ($ in millions) JUNE 30, 2021 MARCH 31, 2021 DECEMBER 31, 2020 SEPTEMBER 30, 2020 JUNE 30, 2020 Average interest-earning assets 7,316,820 9,768,242 5,636,445 6,806,366 7,608,616 Net interest income 68,475 73,850 65,999 64,513 62,137 Net interest margin 3.75% 3.07% 4.65% 3.77% 3.28% Interest-earning assets 7,316,820 9,768,242 5,636,445 6,806,366 7,608,618 LESS: Estimated cash adjustment 125,365 2,679,372 624,857 1,573,727 2,323,425 EIP-ADJUSTED AVERAGE INTEREST-EARNING ASSETS 7,191,455 7,088,870 5,011,588 5,232,639 5,285,193 Net interest income 68,475 73,850 65,999 64,513 62,137 LESS: Estimated cash interest adjustment 31 661 157 396 578 EIP-ADJUSTED NET INTEREST INCOME 68,444 73,189 65,842 64,177 61,559 EIP-ADJUSTED NET INTEREST MARGIN 3.82% 4.19% 5.21% 4.87% 4.68% Interest-earning assets 7,316,820 9,768,242 LESS: Estimated cash adjustment 1,867,987 4,187,558 ADJUSTED AVERAGE INTEREST-EARNING ASSETS 5,448,833 5,580,684 Net interest income 68,475 73,850 LESS: Estimated cash interest adjustment 528 1,090 ADJUSTED NET INTEREST INCOME 67,947 72,760 ADJUSTED NET INTEREST MARGIN 5.00% 5.29% RETURN ON AVERAGE ASSETS (“ROAA”) JUNE 30, 2021 MARCH 31, 2021 DECEMBER 31, 2020 SEPTEMBER 30, 2020 JUNE 30, 2020 Net income 38,701 59,066 28,037 13,158 18,190 Average assets 8,158,558 10,655,852 6,481,823 7,672,773 8,439,206 ROAA 1.90% 2.22% 1.73% 0.69% 0.86% LESS: Estimated cash adjustment 125,365 2,679,372 624,857 1,573,727 2,323,425 LESS: Estimated cash interest adjustment 31 661 157 396 578 EIP-ADJUSTED AVERAGE ASSETS 8,033,193 7,976,480 5,856,966 6,099,046 6,115,781 EIP-ADJUSTED NET INCOME 38,670 58,405 27,880 12,762 17,612 EIP-ADJUSTED ROAA 1.93% 2.93% 1.90% 0.84% 1.15% NON-GAAP RECONCILIATIONS EIP-RELATED ADJUSTMENTS 25 ADJ USTMENT INFLATED CASH BALANCES ADJ USTMENT FOR EIP -RELATED ASSETS Net Interest Margin Meta Financial Group, Inc. (Nasdaq: CASH) | Quarterly Investor Presentation

($ in millions) JUNE 30, 2020 MARCH 31, 2020 DECEMBER 31, 2020 SEPTEMBER 30, 2020 JUNE 30, 2020 Total stockholder's equity $ 980,163 $ 934,010 $ 912,143 $ 933,430 $ 923,520 LESS: Goodwill, net of associated deferred tax liabilities 301,179 301,602 301,999 302,396 302,815 LESS: Certain other intangible assets 35,100 36,780 39,403 40,964 42,865 LESS: Net deferred tax assets from operating loss and tax credit carry-forwards 17,754 19,306 24,105 18,361 10,360 LESS: Net unrealized gains (losses) on available-for-sale securities 14,750 12,458 19,894 17,762 8,382 LESS: Non-controlling interest 1,490 1,092 1,536 3,603 3,787 Common Equity Tier 1 Capital ("CET1") 609,891 562,772 525,206 550,344 555,311 Tier 1 minority interest not included in common equity tier 1 capital 932 690 750 1,894 1,894 Total Tier 1 capital 610,823 563,462 525,956 552,238 557,205 Total Assets (Quarter Average) $ 8,160,147 $ 10,662,731 $ 6,487,231 $ 7,679,897 $ 8,446,393 ADD: Available for sale securities amortized cost (20,713) (20,219) (24,694) (22,844) (8,420) ADD: Deferred tax 5,206 5,077 6,201 5,724 2,104 ADD: CECL adoption 13,913 10,439 10,439 0 0 LESS: Deductions from CET1 354,032 357,688 365,507 361,721 356,040 ADJUSTED TOTAL ASSETS $ 7,804,521 $ 10,300,340 $ 6,113,671 $ 7,301,056 $ 8,084,037 METABANK REGULATORY TIER 1 LEVERAGE 7.83 % 5.47 % 8.60 % 7.56 % 6.89% Adjusted total assets $ 7,804,521 $ 10,300,340 $ 6,113,671 $ 7,301,056 $ 8,084,037 LESS: EIP prepaid card-related assets (cash) 125,365 2,679,372 624,857 1,573,727 2,323,425 EIP-ADJUSTED TOTAL ASSETS $ 7,679,156 $ 7,620,968 $ 5,488,814 $ 5,727,329 $ 5,760,612 METABANK EIP-ADJUSTED TIER 1 LEVERAGE 7.95 % 7.39 % 9.58 % 9.64 % 9.67% NON-GAAP RECONCILIATIONS EIP-RELATED CAPITAL ADJUSTMENTS 26 ADJ USTMENT FOR EIP -RELATED ASSETS MetaBank Tier 1 Leverage Meta Financial Group, Inc. (Nasdaq: CASH) | Quarterly Investor Presentation

1 Tax Services NCOs and average loans are excluded to adjust for the cyclicality of activity related to the overall economics of the Company's tax services business line. FINANCIAL MEASURE RECONCILIATIONS 27 For the last twelve months ended ($ in thousands) Jun 30, 2021 Mar 31, 2021 Dec 31, 2020 Sep 30, 2020 Jun 30, 2020 Noninterest Expense - GAAP 330,352 320,070 315,828 319,051 314,911 Net Interest Income 272,837 266,499 260,386 259,038 260,142 Noninterest Income 262,111 240,706 247,766 239,794 235,024 Total Revenue: GAAP 534,948 507,205 508,152 498,832 495,166 Efficiency Ratio, LTM 61.75% 63.10% 62.15% 63.96% 63.60% For the quarter ended ($ in thousands) Jun 30, 2021 Mar 31, 2021 Dec 31, 2020 Sep 30, 2020 Jun 30, 2020 Net Charge-offs 12,333 3,696 2,836 18,538 14,700 Less: Tax services net charge-offs 9,488 (54) (956) 13,034 9,782 Adjusted Net Charge-offs $2,845 $3,750 $3,792 $5,504 $4,918 Quarterly Average Loans and Leases 3,618,733 4,120,555 3,495,696 3,536,997 3,622,928 Less: Quarterly Average Tax Services Loans 91,804 714,789 25,104 16,650 39,845 Adjusted Quarterly Loans and Leases $3,526,929 $3,405,766 $3,470,592 $3,520,347 $3,583,083 Annualized NCOs/Average Loans and Leases 1.36% 0.36% 0.32% 2.10% 1.62% Adjusted Annualized NCOs/Adjusted Average Loans and Leases1 0.32% 0.44% 0.44% 0.63% 0.55% Efficiency Ratio Non-GAAP Reconciliation Adjusted Annualized NCOs and Adjusted Average Loans and Leases Meta Financial Group, Inc. (Nasdaq: CASH) | Quarterly Investor Presentation
