Attached files
| file | filename |
|---|---|
| EX-99.1 - EX-99.1 - ANNALY CAPITAL MANAGEMENT INC | a2021q2nlyex991.htm |
| 8-K - 8-K - ANNALY CAPITAL MANAGEMENT INC | nly-20210728.htm |
© Copyright 2021 Annaly Capital Management, Inc. All rights reserved. Second Quarter 2021 Financial Summary July 28, 2021
© Copyright 2021 Annaly Capital Management, Inc. All rights reserved. This presentation is issued by Annaly Capital Management, Inc. ("Annaly"), an internally managed, publicly traded company that has elected to be taxed as a real estate investment trust for federal income tax purposes, and is being furnished in connection with Annaly’s Second Quarter 2021 earnings release. This presentation is provided for investors in Annaly for informational purposes only and is not an offer to sell, or a solicitation of an offer to buy, any security or instrument. Forward-Looking Statements This presentation, other written or oral communications, and our public documents to which we refer contain or incorporate by reference certain forward-looking statements which are based on various assumptions (some of which are beyond our control) and may be identified by reference to a future period or periods or by the use of forward- looking terminology, such as “may,” “will,” “believe,” “expect,” “anticipate,” “continue,” or similar terms or variations on those terms or the negative of those terms. Actual results could differ materially from those set forth in forward-looking statements due to a variety of factors, including, but not limited to, risks and uncertainties related to the COVID-19 pandemic, including as related to adverse economic conditions on real estate-related assets and financing conditions (and our outlook for our business in light of these conditions, which is uncertain); changes in interest rates; changes in the yield curve; changes in prepayment rates; the availability of mortgage-backed securities and other securities for purchase; the availability of financing and, if available, the terms of any financing; changes in the market value of our assets; changes in business conditions and the general economy; operational risks or risk management failures by us or critical third parties, including cybersecurity incidents; our ability to grow our residential credit business; our ability to grow our middle market lending business; credit risks related to our investments in credit risk transfer securities, residential mortgage-backed securities and related residential mortgage credit assets and corporate debt; risks related to investments in MSR; our ability to consummate any contemplated investment opportunities; changes in government regulations or policy affecting our business; our ability to maintain our qualification as a REIT for U.S. federal income tax purposes; and our ability to maintain our exemption from registration under the Investment Company Act; and the timing and ultimate completion of the sale of our commercial real estate business. For a discussion of the risks and uncertainties which could cause actual results to differ from those contained in the forward-looking statements, see “Risk Factors” in our most recent Annual Report on Form 10-K and any subsequent Quarterly Reports on Form 10-Q. The Company does not undertake, and specifically disclaims any obligation, to publicly release the result of any revisions which may be made to any forward-looking statements to reflect the occurrence of anticipated or unanticipated events or circumstances after the date of such statements, except as required by law. We routinely post important information for investors on our website, www.annaly.com. We intend to use this webpage as a means of disclosing material information, for complying with our disclosure obligations under Regulation FD and to post and update investor presentations and similar materials on a regular basis. Annaly encourages investors, analysts, the media and others interested in Annaly to monitor the Investors section of our website, in addition to following our press releases, SEC filings, public conference calls, presentations, webcasts and other information we post from time to time on our website. To sign-up for email-notifications, please visit the “Email Alerts” section of our website, www.annaly.com, under the “Investors” section and enter the required information to enable notifications. The information contained on, or that may be accessed through, our webpage is not incorporated by reference into, and is not a part of, this document. Past performance is no guarantee of future results. There is no guarantee that any investment strategy referenced herein will work under all market conditions. Prior to making any investment decision, you should evaluate your ability to invest for the long-term, especially during periods of downturns in the market. You alone assume the responsibility of evaluating the merits and risks associated with any potential investment or investment strategy referenced herein. To the extent that this material contains reference to any past specific investment recommendations or strategies which were or would have been profitable to any person, it should not be assumed that recommendations made in the future will be profitable or will equal the performance of such past investment recommendations or strategies. The information contained herein is not intended to provide, and should not be relied upon for accounting, legal or tax advice or investment recommendations for Annaly or any of its affiliates. Regardless of source, information is believed to be reliable for purposes used herein, but Annaly makes no representation or warranty as to the accuracy or completeness thereof and does not take any responsibility for information obtained from sources outside of Annaly. Certain information contained in the presentation discusses general market activity, industry or sector trends, or other broad-based economic, market or political conditions and should not be construed as research or investment advice. 1 Important Notices
© Copyright 2021 Annaly Capital Management, Inc. All rights reserved. Updates to Financial Disclosures Commencing with the Company’s financial results for the quarter ended June 30, 2021 and for subsequent reporting periods, the Company has relabeled “Core Earnings (excluding PAA)” as “Earnings Available for Distribution” (“EAD”). Earnings Available for Distribution, which is a non-GAAP financial measure intended to supplement the Company’s financial results computed in accordance with U.S. generally accepted accounting principles (“GAAP”), is replacing the Company’s prior presentation of Core Earnings (excluding PAA). In addition, Core Earnings (excluding PAA) results from prior reporting periods is being relabeled Earnings Available for Distribution. In line with evolving industry practices, the Company believes the term Earnings Available for Distribution more accurately reflects the principal purpose of the measure than the term Core Earnings (excluding PAA) and will serve as a useful indicator for investors in evaluating the Company’s performance and its ability to pay dividends. The definition of Earnings Available for Distribution is identical to the definition of Core Earning (excluding PAA) from prior reporting periods. As such, Earnings Available for Distribution is defined as the sum of (a) economic net interest income, (b) TBA dollar roll income and CMBX coupon income, (c) realized amortization of MSR, (d) other income (loss) (excluding depreciation expense related to commercial real estate and amortization of intangibles, non-EAD income allocated to equity method investments and other non-EAD components of other income (loss)), (e) general and administrative expenses (excluding transaction expenses and non-recurring items) and (f) income taxes (excluding the income tax effect of non-EAD income (loss) items) and excludes (g) the premium amortization adjustment ("PAA") representing the cumulative impact on prior periods, but not the current period, of quarter-over-quarter changes in estimated long-term prepayment speeds related to the Company’s Agency mortgage-backed securities. Earnings Available for Distribution should not be considered a substitute for, or superior to, GAAP net income. Please refer to the "Non-GAAP Financial Measures" section for a detailed discussion of Earnings Available for Distribution. Beginning with the quarter ended June 30, 2021, the Company began classifying certain portfolio activity- or volume-related expenses (including but not limited to brokerage and commission fees, due diligence costs and securitization expenses) as Other income (loss) rather than Other general and administrative expenses in the Consolidated Statements of Comprehensive Income (Loss) to better reflect the nature of the items and the Company’s approach to expense management. As such, prior periods have been conformed to the current presentation. Divestiture of Commercial Real Estate Business On March 25, 2021, the Company announced the sale of substantially all of the assets that comprise its commercial real estate business to Slate Asset Management for $2.33 billion, which is expected to be completed by the third quarter of 2021. The Company also intends to sell nearly all of the remaining assets that are not included in the sale to Slate. On July 22, 2021, the platform and the significant majority of the assets were transferred with remaining assets expected to be transferred by the end of the third quarter of 2021. As of March 31, 2021, the Company met the conditions for held-for sale accounting which requires that assets be carried at the lower of amortized cost or fair value less costs to sell. Assets and liabilities associated with the commercial real estate business are reported separately in the Company’s Consolidated Statement of Financial Condition as Assets and Liabilities of Disposal Group Held for Sale, respectively. The Company’s Consolidated Statement of Comprehensive Income (Loss) reflects a reversal of previously recognized loan loss provisions as well as business divestiture-related gains (losses), which include valuation allowances on commercial real estate assets, impairment of goodwill and estimated transaction costs. Revenues and expenses associated with the commercial real estate business will be reflected in the Company’s results of operations and key financial metrics through closing. 2 Important Notices (continued)
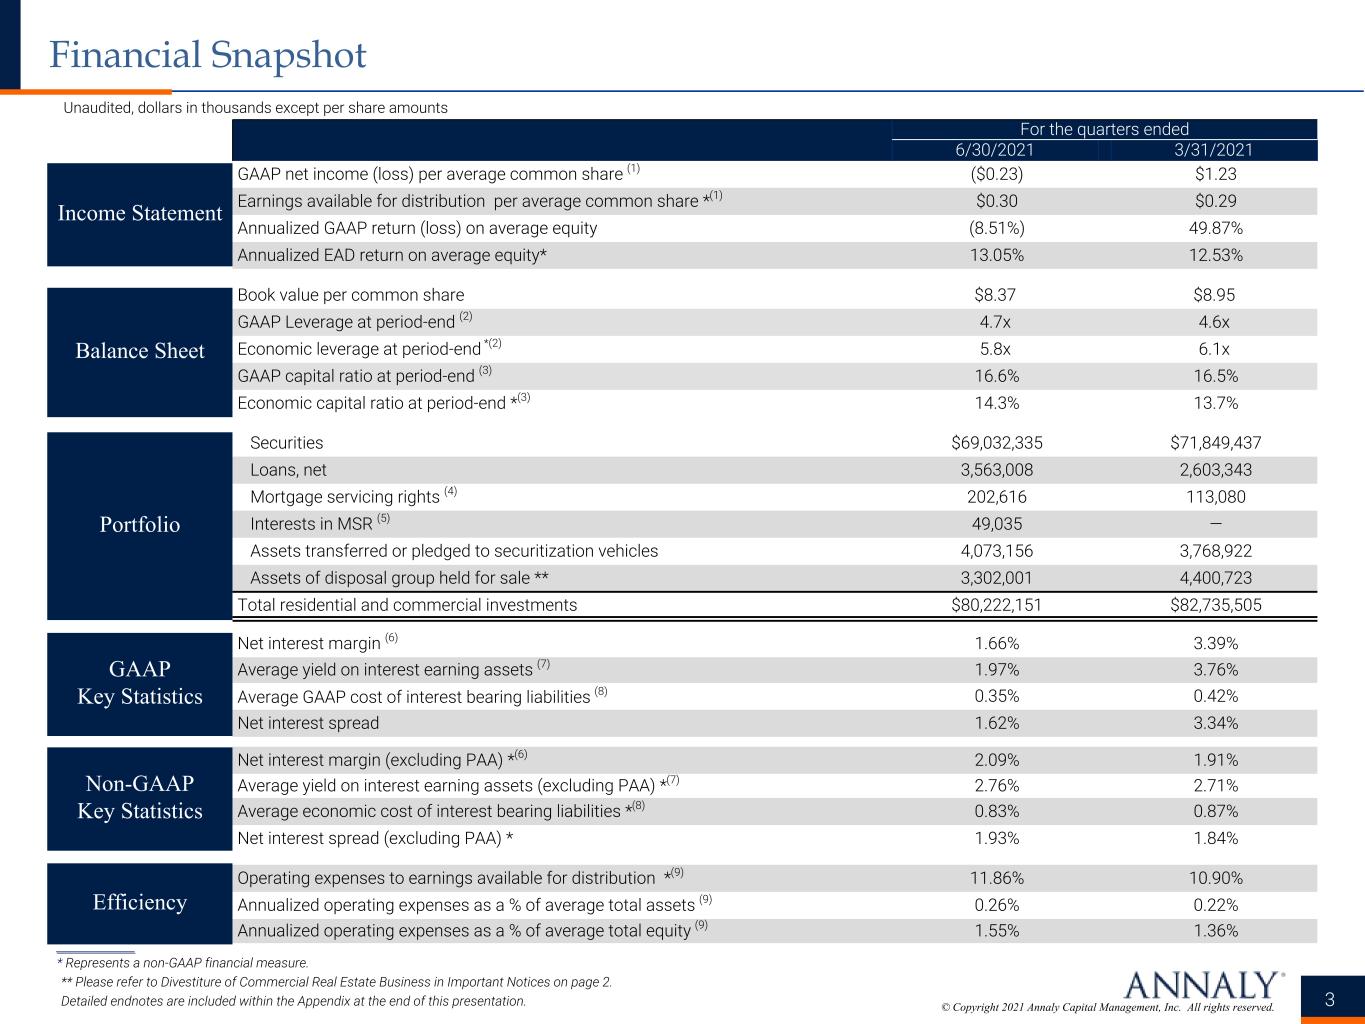
© Copyright 2021 Annaly Capital Management, Inc. All rights reserved. Portfolio Efficiency GAAP Key Statistics Income Statement Balance Sheet For the quarters ended 6/30/2021 3/31/2021 GAAP net income (loss) per average common share (1) ($0.23) $1.23 Earnings available for distribution per average common share *(1) $0.30 $0.29 Annualized GAAP return (loss) on average equity (8.51%) 49.87% Annualized EAD return on average equity* 13.05% 12.53% Book value per common share $8.37 $8.95 GAAP Leverage at period-end (2) 4.7x 4.6x Economic leverage at period-end *(2) 5.8x 6.1x GAAP capital ratio at period-end (3) 16.6% 16.5% Economic capital ratio at period-end *(3) 14.3% 13.7% Securities $69,032,335 $71,849,437 Loans, net 3,563,008 2,603,343 Mortgage servicing rights (4) 202,616 113,080 Interests in MSR (5) 49,035 — Assets transferred or pledged to securitization vehicles 4,073,156 3,768,922 Assets of disposal group held for sale ** 3,302,001 4,400,723 Total residential and commercial investments $80,222,151 $82,735,505 Net interest margin (6) 1.66% 3.39% Average yield on interest earning assets (7) 1.97% 3.76% Average GAAP cost of interest bearing liabilities (8) 0.35% 0.42% Net interest spread 1.62% 3.34% Net interest margin (excluding PAA) *(6) 2.09% 1.91% Average yield on interest earning assets (excluding PAA) *(7) 2.76% 2.71% Average economic cost of interest bearing liabilities *(8) 0.83% 0.87% Net interest spread (excluding PAA) * 1.93% 1.84% Operating expenses to earnings available for distribution *(9) 11.86% 10.90% Annualized operating expenses as a % of average total assets (9) 0.26% 0.22% Annualized operating expenses as a % of average total equity (9) 1.55% 1.36% Unaudited, dollars in thousands except per share amounts 3 Financial Snapshot Non-GAAP Key Statistics ______________ * Represents a non-GAAP financial measure. ** Please refer to Divestiture of Commercial Real Estate Business in Important Notices on page 2. Detailed endnotes are included within the Appendix at the end of this presentation.
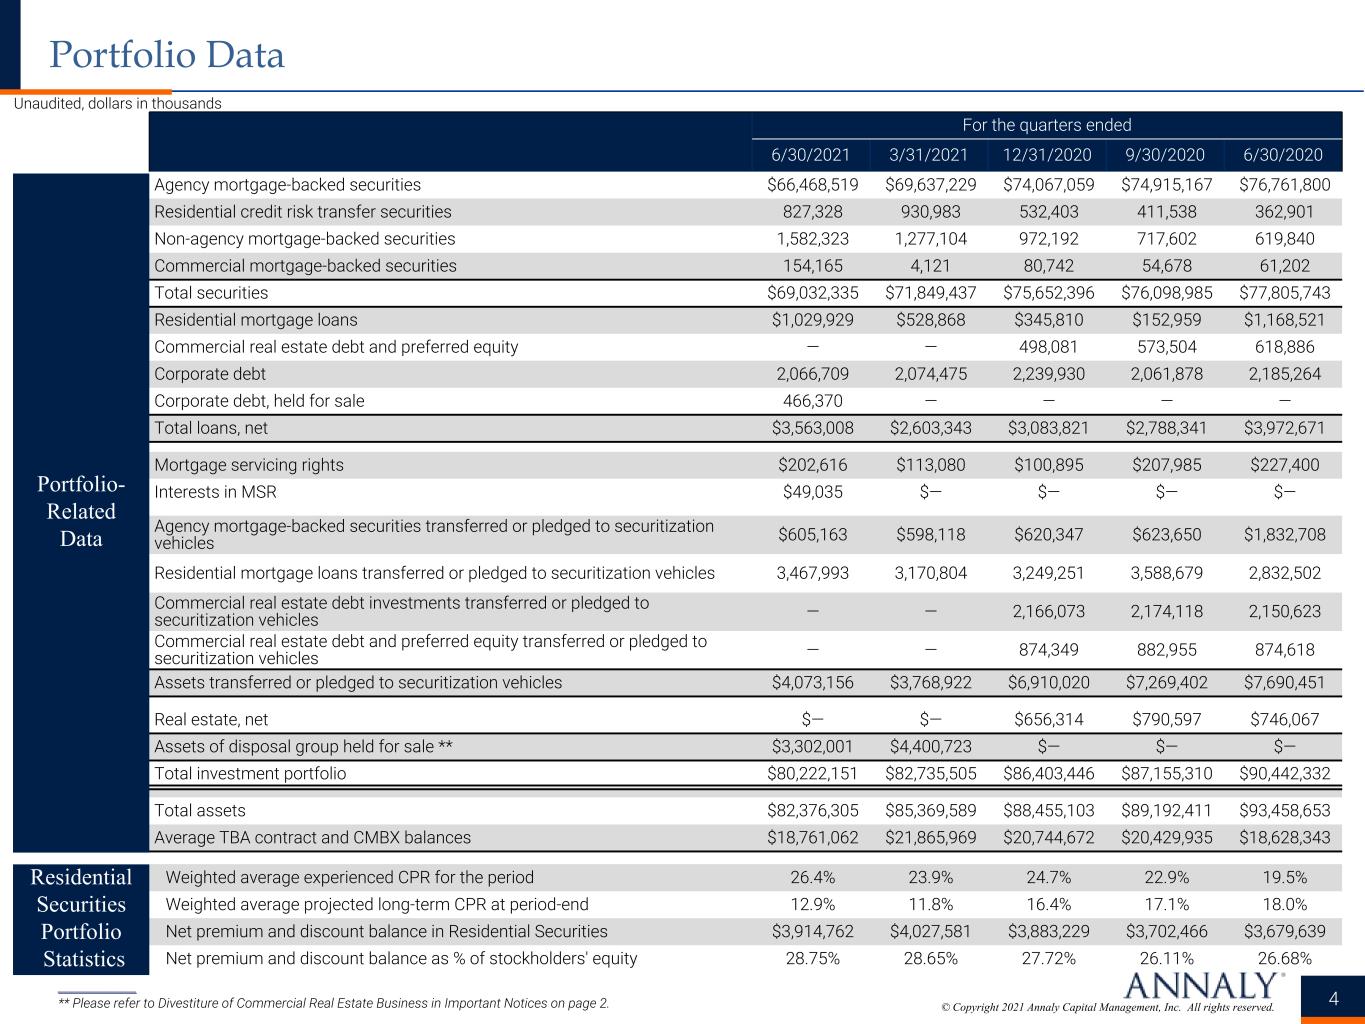
© Copyright 2021 Annaly Capital Management, Inc. All rights reserved. Portfolio- Related Data Residential Securities Portfolio Statistics Unaudited, dollars in thousands 4 Portfolio Data For the quarters ended 6/30/2021 3/31/2021 12/31/2020 9/30/2020 6/30/2020 Agency mortgage-backed securities $66,468,519 $69,637,229 $74,067,059 $74,915,167 $76,761,800 Residential credit risk transfer securities 827,328 930,983 532,403 411,538 362,901 Non-agency mortgage-backed securities 1,582,323 1,277,104 972,192 717,602 619,840 Commercial mortgage-backed securities 154,165 4,121 80,742 54,678 61,202 Total securities $69,032,335 $71,849,437 $75,652,396 $76,098,985 $77,805,743 Residential mortgage loans $1,029,929 $528,868 $345,810 $152,959 $1,168,521 Commercial real estate debt and preferred equity — — 498,081 573,504 618,886 Corporate debt 2,066,709 2,074,475 2,239,930 2,061,878 2,185,264 Corporate debt, held for sale 466,370 — — — — Total loans, net $3,563,008 $2,603,343 $3,083,821 $2,788,341 $3,972,671 Mortgage servicing rights $202,616 $113,080 $100,895 $207,985 $227,400 Interests in MSR $49,035 $— $— $— $— Agency mortgage-backed securities transferred or pledged to securitization vehicles $605,163 $598,118 $620,347 $623,650 $1,832,708 Residential mortgage loans transferred or pledged to securitization vehicles 3,467,993 3,170,804 3,249,251 3,588,679 2,832,502 Commercial real estate debt investments transferred or pledged to securitization vehicles — — 2,166,073 2,174,118 2,150,623 Commercial real estate debt and preferred equity transferred or pledged to securitization vehicles — — 874,349 882,955 874,618 Assets transferred or pledged to securitization vehicles $4,073,156 $3,768,922 $6,910,020 $7,269,402 $7,690,451 Real estate, net $— $— $656,314 $790,597 $746,067 Assets of disposal group held for sale ** $3,302,001 $4,400,723 $— $— $— Total investment portfolio $80,222,151 $82,735,505 $86,403,446 $87,155,310 $90,442,332 Total assets $82,376,305 $85,369,589 $88,455,103 $89,192,411 $93,458,653 Average TBA contract and CMBX balances $18,761,062 $21,865,969 $20,744,672 $20,429,935 $18,628,343 Weighted average experienced CPR for the period 26.4% 23.9% 24.7% 22.9% 19.5% Weighted average projected long-term CPR at period-end 12.9% 11.8% 16.4% 17.1% 18.0% Net premium and discount balance in Residential Securities $3,914,762 $4,027,581 $3,883,229 $3,702,466 $3,679,639 Net premium and discount balance as % of stockholders' equity 28.75% 28.65% 27.72% 26.11% 26.68% ______________ ** Please refer to Divestiture of Commercial Real Estate Business in Important Notices on page 2.
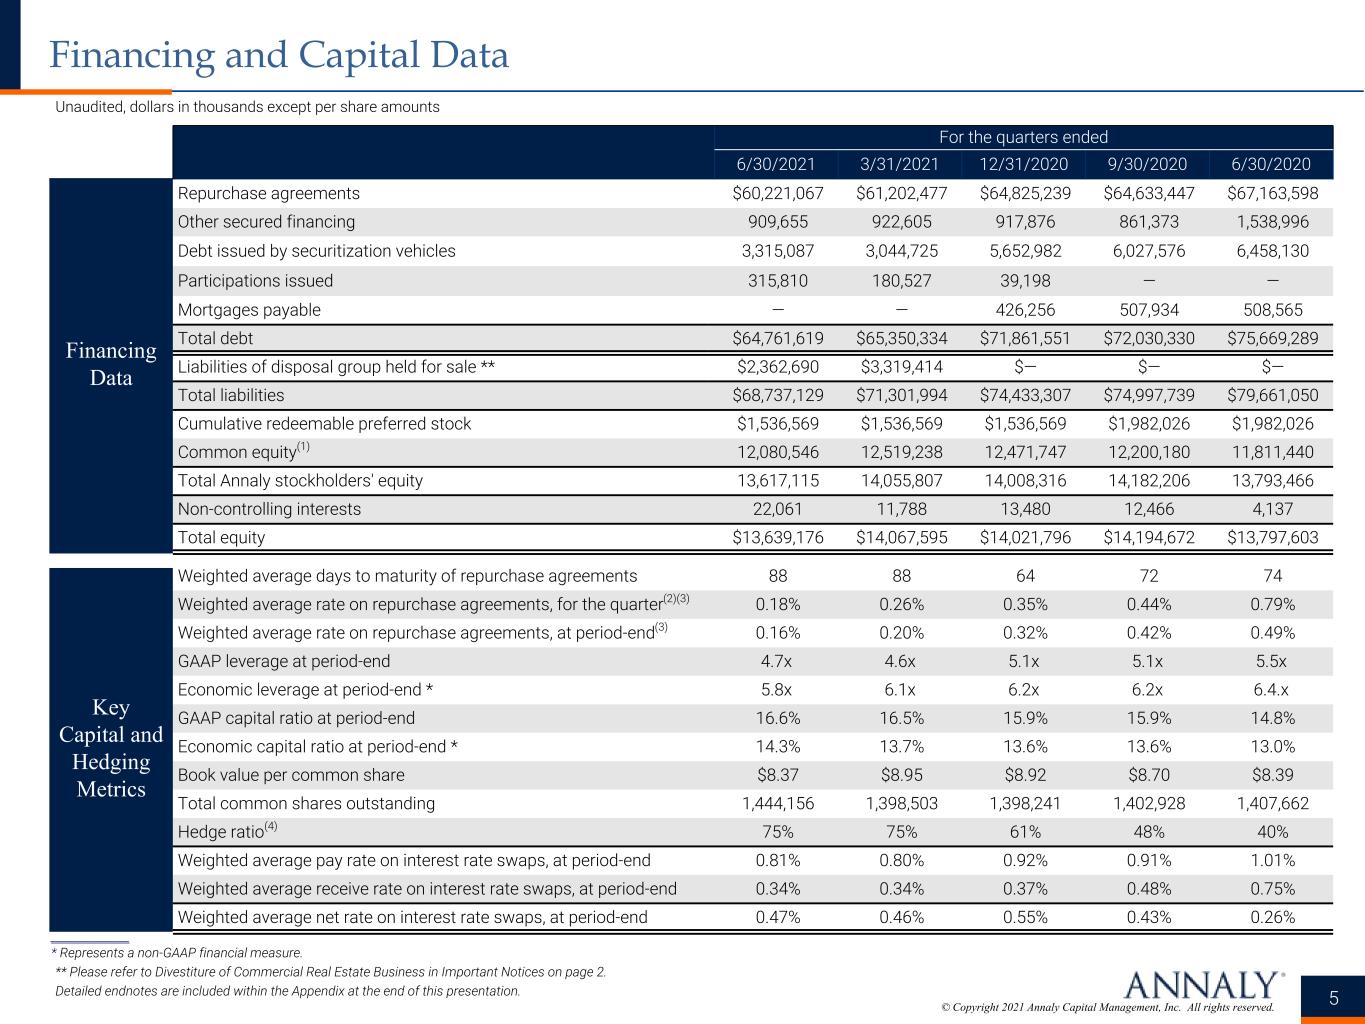
© Copyright 2021 Annaly Capital Management, Inc. All rights reserved. Financing Data Key Capital and Hedging Metrics ______________ * Represents a non-GAAP financial measure. ** Please refer to Divestiture of Commercial Real Estate Business in Important Notices on page 2. Detailed endnotes are included within the Appendix at the end of this presentation. Unaudited, dollars in thousands except per share amounts 5 Financing and Capital Data For the quarters ended 6/30/2021 3/31/2021 12/31/2020 9/30/2020 6/30/2020 Repurchase agreements $60,221,067 $61,202,477 $64,825,239 $64,633,447 $67,163,598 Other secured financing 909,655 922,605 917,876 861,373 1,538,996 Debt issued by securitization vehicles 3,315,087 3,044,725 5,652,982 6,027,576 6,458,130 Participations issued 315,810 180,527 39,198 — — Mortgages payable — — 426,256 507,934 508,565 Total debt $64,761,619 $65,350,334 $71,861,551 $72,030,330 $75,669,289 Liabilities of disposal group held for sale ** $2,362,690 $3,319,414 $— $— $— Total liabilities $68,737,129 $71,301,994 $74,433,307 $74,997,739 $79,661,050 Cumulative redeemable preferred stock $1,536,569 $1,536,569 $1,536,569 $1,982,026 $1,982,026 Common equity(1) 12,080,546 12,519,238 12,471,747 12,200,180 11,811,440 Total Annaly stockholders' equity 13,617,115 14,055,807 14,008,316 14,182,206 13,793,466 Non-controlling interests 22,061 11,788 13,480 12,466 4,137 Total equity $13,639,176 $14,067,595 $14,021,796 $14,194,672 $13,797,603 Weighted average days to maturity of repurchase agreements 88 88 64 72 74 Weighted average rate on repurchase agreements, for the quarter(2)(3) 0.18% 0.26% 0.35% 0.44% 0.79% Weighted average rate on repurchase agreements, at period-end(3) 0.16% 0.20% 0.32% 0.42% 0.49% GAAP leverage at period-end 4.7x 4.6x 5.1x 5.1x 5.5x Economic leverage at period-end * 5.8x 6.1x 6.2x 6.2x 6.4.x GAAP capital ratio at period-end 16.6% 16.5% 15.9% 15.9% 14.8% Economic capital ratio at period-end * 14.3% 13.7% 13.6% 13.6% 13.0% Book value per common share $8.37 $8.95 $8.92 $8.70 $8.39 Total common shares outstanding 1,444,156 1,398,503 1,398,241 1,402,928 1,407,662 Hedge ratio(4) 75% 75% 61% 48% 40% Weighted average pay rate on interest rate swaps, at period-end 0.81% 0.80% 0.92% 0.91% 1.01% Weighted average receive rate on interest rate swaps, at period-end 0.34% 0.34% 0.37% 0.48% 0.75% Weighted average net rate on interest rate swaps, at period-end 0.47% 0.46% 0.55% 0.43% 0.26%
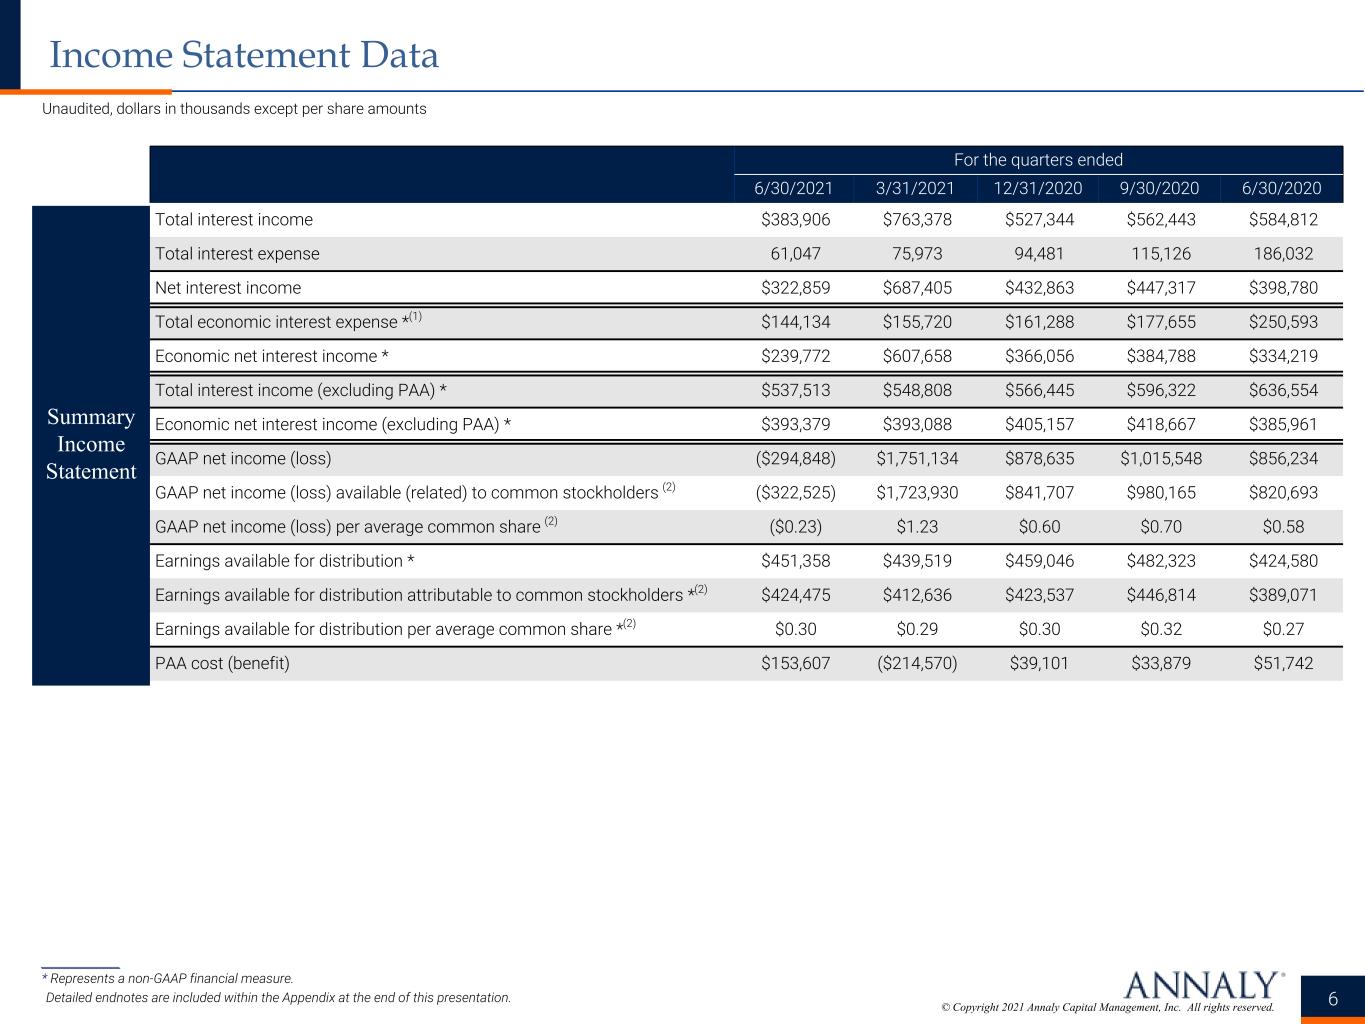
© Copyright 2021 Annaly Capital Management, Inc. All rights reserved. ______________ * Represents a non-GAAP financial measure. Detailed endnotes are included within the Appendix at the end of this presentation. Unaudited, dollars in thousands except per share amounts 6 Income Statement Data For the quarters ended 6/30/2021 3/31/2021 12/31/2020 9/30/2020 6/30/2020 Total interest income $383,906 $763,378 $527,344 $562,443 $584,812 Total interest expense 61,047 75,973 94,481 115,126 186,032 Net interest income $322,859 $687,405 $432,863 $447,317 $398,780 Total economic interest expense *(1) $144,134 $155,720 $161,288 $177,655 $250,593 Economic net interest income * $239,772 $607,658 $366,056 $384,788 $334,219 Total interest income (excluding PAA) * $537,513 $548,808 $566,445 $596,322 $636,554 Economic net interest income (excluding PAA) * $393,379 $393,088 $405,157 $418,667 $385,961 GAAP net income (loss) ($294,848) $1,751,134 $878,635 $1,015,548 $856,234 GAAP net income (loss) available (related) to common stockholders (2) ($322,525) $1,723,930 $841,707 $980,165 $820,693 GAAP net income (loss) per average common share (2) ($0.23) $1.23 $0.60 $0.70 $0.58 Earnings available for distribution * $451,358 $439,519 $459,046 $482,323 $424,580 Earnings available for distribution attributable to common stockholders *(2) $424,475 $412,636 $423,537 $446,814 $389,071 Earnings available for distribution per average common share *(2) $0.30 $0.29 $0.30 $0.32 $0.27 PAA cost (benefit) $153,607 ($214,570) $39,101 $33,879 $51,742 Summary Income Statement
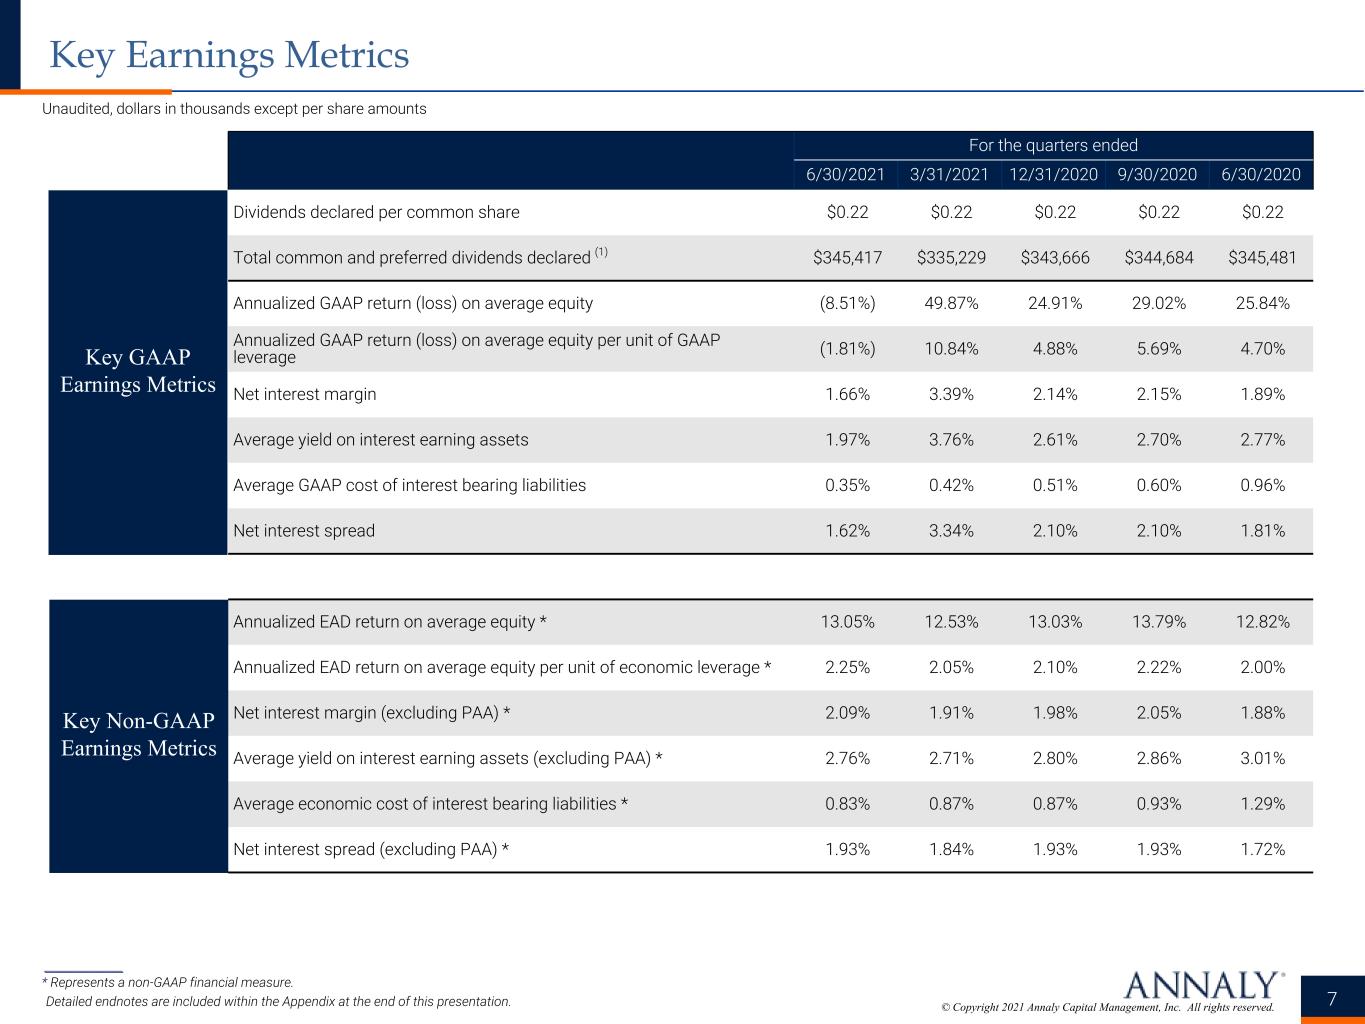
© Copyright 2021 Annaly Capital Management, Inc. All rights reserved. For the quarters ended 6/30/2021 3/31/2021 12/31/2020 9/30/2020 6/30/2020 Dividends declared per common share $0.22 $0.22 $0.22 $0.22 $0.22 Total common and preferred dividends declared (1) $345,417 $335,229 $343,666 $344,684 $345,481 Annualized GAAP return (loss) on average equity (8.51%) 49.87% 24.91% 29.02% 25.84% Annualized GAAP return (loss) on average equity per unit of GAAP leverage (1.81%) 10.84% 4.88% 5.69% 4.70% Net interest margin 1.66% 3.39% 2.14% 2.15% 1.89% Average yield on interest earning assets 1.97% 3.76% 2.61% 2.70% 2.77% Average GAAP cost of interest bearing liabilities 0.35% 0.42% 0.51% 0.60% 0.96% Net interest spread 1.62% 3.34% 2.10% 2.10% 1.81% Annualized EAD return on average equity * 13.05% 12.53% 13.03% 13.79% 12.82% Annualized EAD return on average equity per unit of economic leverage * 2.25% 2.05% 2.10% 2.22% 2.00% Net interest margin (excluding PAA) * 2.09% 1.91% 1.98% 2.05% 1.88% Average yield on interest earning assets (excluding PAA) * 2.76% 2.71% 2.80% 2.86% 3.01% Average economic cost of interest bearing liabilities * 0.83% 0.87% 0.87% 0.93% 1.29% Net interest spread (excluding PAA) * 1.93% 1.84% 1.93% 1.93% 1.72% Key GAAP Earnings Metrics ______________ * Represents a non-GAAP financial measure. Detailed endnotes are included within the Appendix at the end of this presentation. Unaudited, dollars in thousands except per share amounts 7 Key Earnings Metrics Key Non-GAAP Earnings Metrics
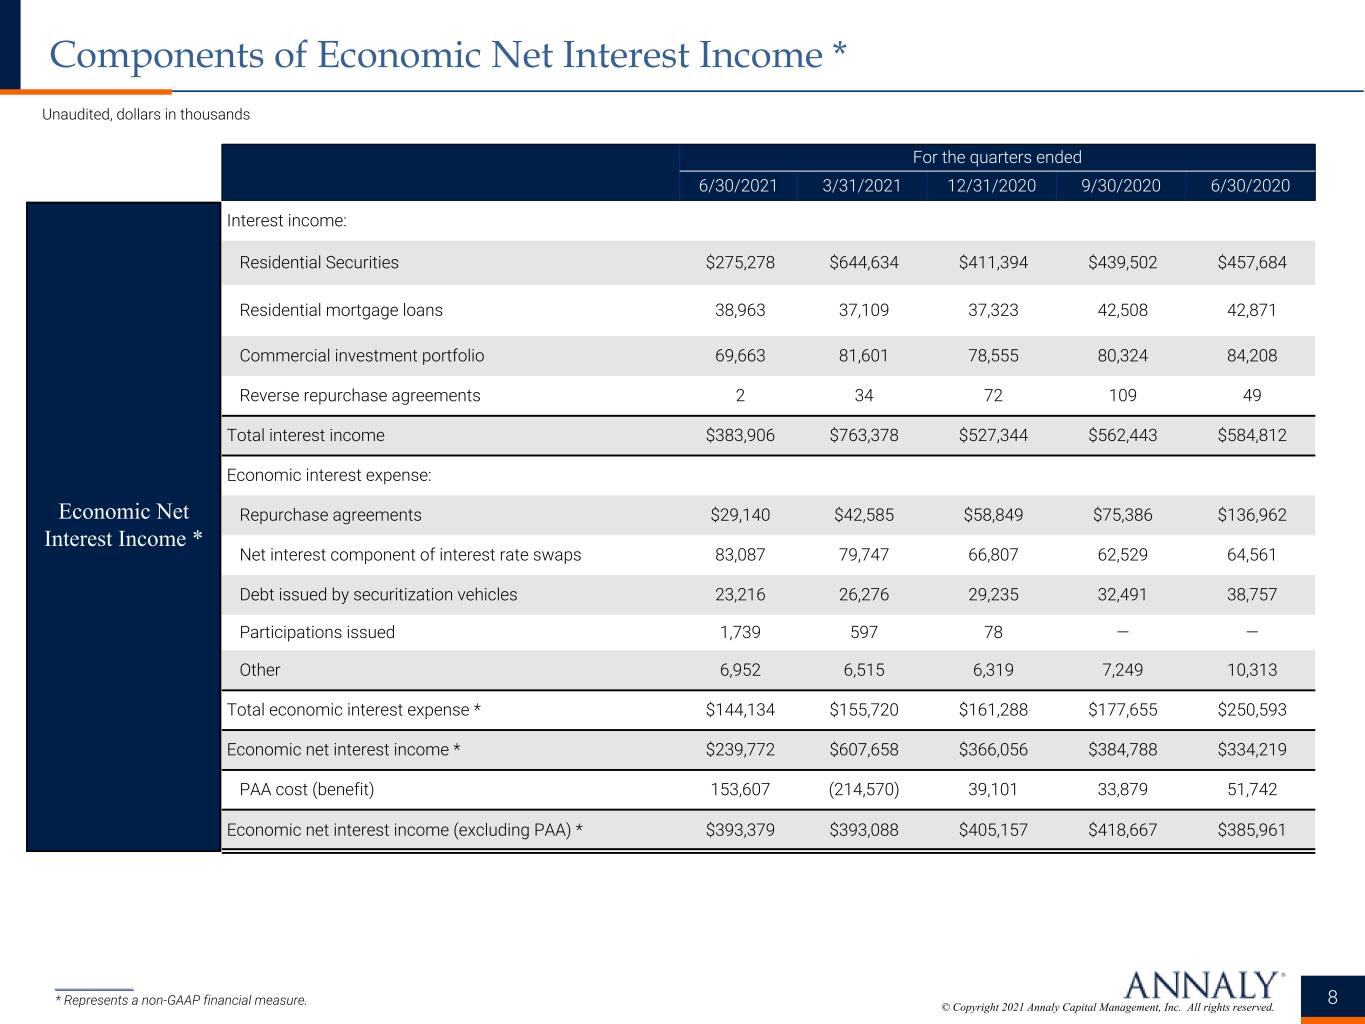
© Copyright 2021 Annaly Capital Management, Inc. All rights reserved. Economic Net Interest Income * ______________ * Represents a non-GAAP financial measure. Unaudited, dollars in thousands 8 Components of Economic Net Interest Income * For the quarters ended 6/30/2021 3/31/2021 12/31/2020 9/30/2020 6/30/2020 Interest income: Residential Securities $275,278 $644,634 $411,394 $439,502 $457,684 Residential mortgage loans 38,963 37,109 37,323 42,508 42,871 Commercial investment portfolio 69,663 81,601 78,555 80,324 84,208 Reverse repurchase agreements 2 34 72 109 49 Total interest income $383,906 $763,378 $527,344 $562,443 $584,812 Economic interest expense: Repurchase agreements $29,140 $42,585 $58,849 $75,386 $136,962 Net interest component of interest rate swaps 83,087 79,747 66,807 62,529 64,561 Debt issued by securitization vehicles 23,216 26,276 29,235 32,491 38,757 Participations issued 1,739 597 78 — — Other 6,952 6,515 6,319 7,249 10,313 Total economic interest expense * $144,134 $155,720 $161,288 $177,655 $250,593 Economic net interest income * $239,772 $607,658 $366,056 $384,788 $334,219 PAA cost (benefit) 153,607 (214,570) 39,101 33,879 51,742 Economic net interest income (excluding PAA) * $393,379 $393,088 $405,157 $418,667 $385,961
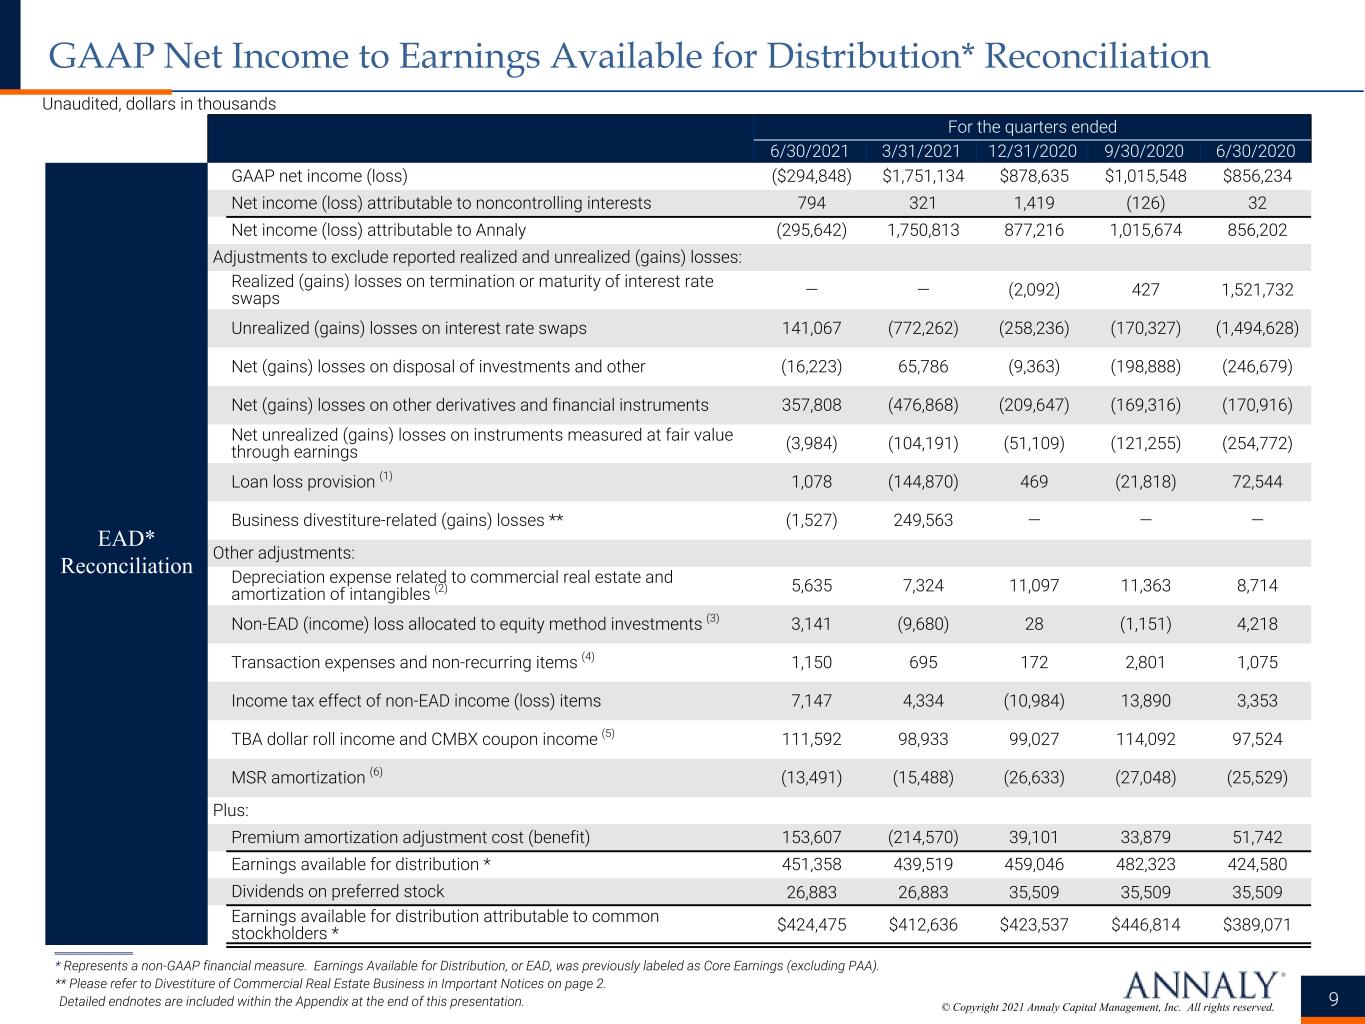
© Copyright 2021 Annaly Capital Management, Inc. All rights reserved. EAD* Reconciliation 9 GAAP Net Income to Earnings Available for Distribution* Reconciliation For the quarters ended 6/30/2021 3/31/2021 12/31/2020 9/30/2020 6/30/2020 GAAP net income (loss) ($294,848) $1,751,134 $878,635 $1,015,548 $856,234 Net income (loss) attributable to noncontrolling interests 794 321 1,419 (126) 32 Net income (loss) attributable to Annaly (295,642) 1,750,813 877,216 1,015,674 856,202 Adjustments to exclude reported realized and unrealized (gains) losses: Realized (gains) losses on termination or maturity of interest rate swaps — — (2,092) 427 1,521,732 Unrealized (gains) losses on interest rate swaps 141,067 (772,262) (258,236) (170,327) (1,494,628) Net (gains) losses on disposal of investments and other (16,223) 65,786 (9,363) (198,888) (246,679) Net (gains) losses on other derivatives and financial instruments 357,808 (476,868) (209,647) (169,316) (170,916) Net unrealized (gains) losses on instruments measured at fair value through earnings (3,984) (104,191) (51,109) (121,255) (254,772) Loan loss provision (1) 1,078 (144,870) 469 (21,818) 72,544 Business divestiture-related (gains) losses ** (1,527) 249,563 — — — Other adjustments: Depreciation expense related to commercial real estate and amortization of intangibles (2) 5,635 7,324 11,097 11,363 8,714 Non-EAD (income) loss allocated to equity method investments (3) 3,141 (9,680) 28 (1,151) 4,218 Transaction expenses and non-recurring items (4) 1,150 695 172 2,801 1,075 Income tax effect of non-EAD income (loss) items 7,147 4,334 (10,984) 13,890 3,353 TBA dollar roll income and CMBX coupon income (5) 111,592 98,933 99,027 114,092 97,524 MSR amortization (6) (13,491) (15,488) (26,633) (27,048) (25,529) Plus: Premium amortization adjustment cost (benefit) 153,607 (214,570) 39,101 33,879 51,742 Earnings available for distribution * 451,358 439,519 459,046 482,323 424,580 Dividends on preferred stock 26,883 26,883 35,509 35,509 35,509 Earnings available for distribution attributable to common stockholders * $424,475 $412,636 $423,537 $446,814 $389,071 ______________ * Represents a non-GAAP financial measure. Earnings Available for Distribution, or EAD, was previously labeled as Core Earnings (excluding PAA). ** Please refer to Divestiture of Commercial Real Estate Business in Important Notices on page 2. Detailed endnotes are included within the Appendix at the end of this presentation. Unaudited, dollars in thousands
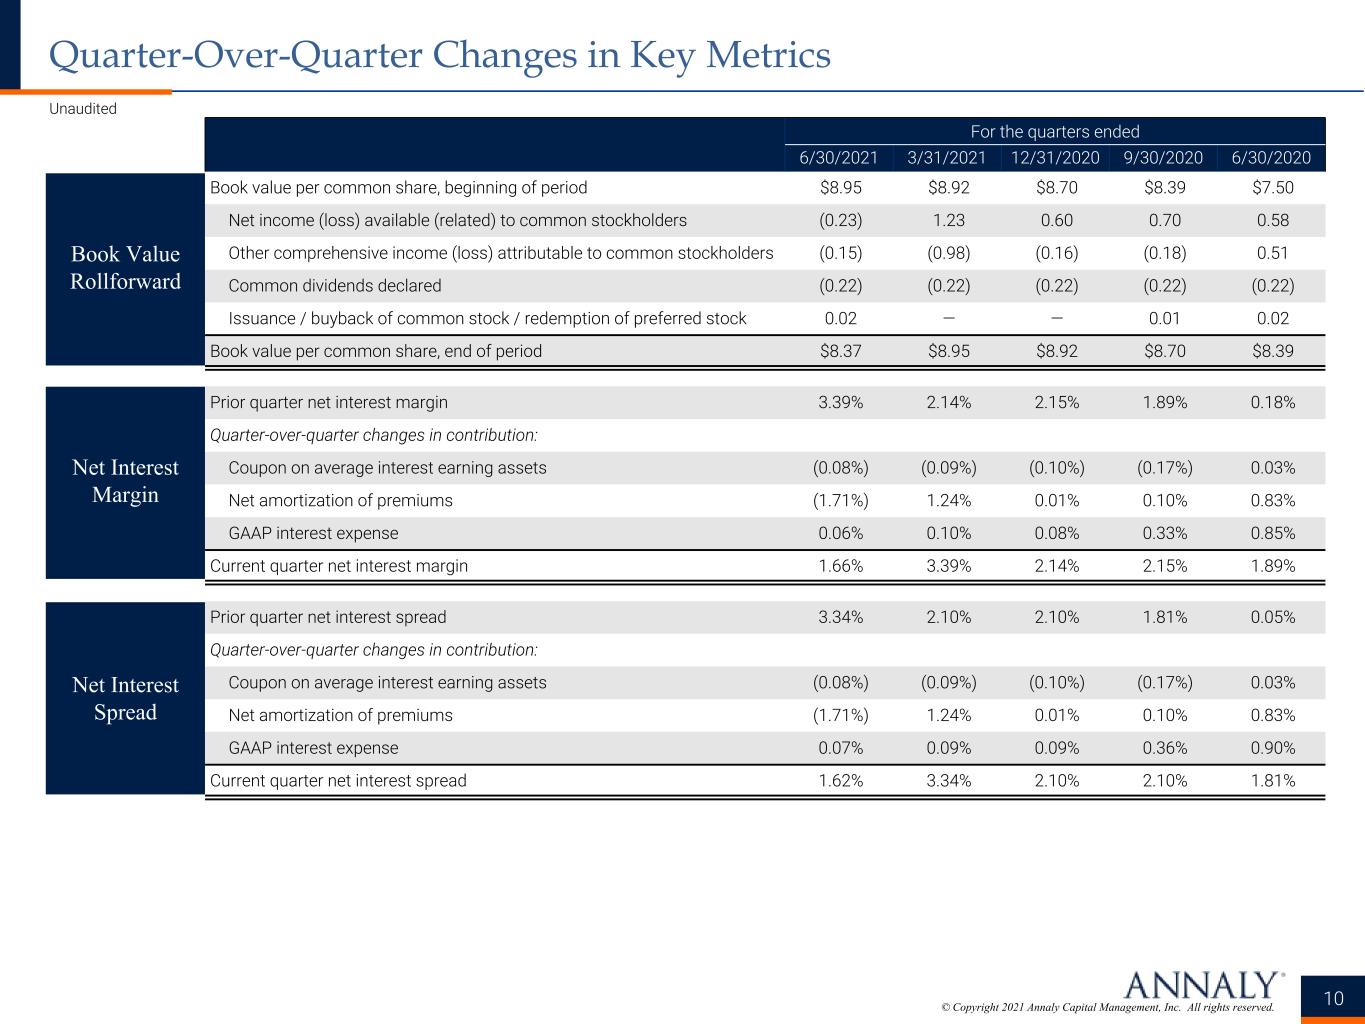
© Copyright 2021 Annaly Capital Management, Inc. All rights reserved. Book Value Rollforward Net Interest Margin Unaudited 10 Quarter-Over-Quarter Changes in Key Metrics For the quarters ended 6/30/2021 3/31/2021 12/31/2020 9/30/2020 6/30/2020 Book value per common share, beginning of period $8.95 $8.92 $8.70 $8.39 $7.50 Net income (loss) available (related) to common stockholders (0.23) 1.23 0.60 0.70 0.58 Other comprehensive income (loss) attributable to common stockholders (0.15) (0.98) (0.16) (0.18) 0.51 Common dividends declared (0.22) (0.22) (0.22) (0.22) (0.22) Issuance / buyback of common stock / redemption of preferred stock 0.02 — — 0.01 0.02 Book value per common share, end of period $8.37 $8.95 $8.92 $8.70 $8.39 Prior quarter net interest margin 3.39% 2.14% 2.15% 1.89% 0.18% Quarter-over-quarter changes in contribution: Coupon on average interest earning assets (0.08%) (0.09%) (0.10%) (0.17%) 0.03% Net amortization of premiums (1.71%) 1.24% 0.01% 0.10% 0.83% GAAP interest expense 0.06% 0.10% 0.08% 0.33% 0.85% Current quarter net interest margin 1.66% 3.39% 2.14% 2.15% 1.89% Prior quarter net interest spread 3.34% 2.10% 2.10% 1.81% 0.05% Quarter-over-quarter changes in contribution: Coupon on average interest earning assets (0.08%) (0.09%) (0.10%) (0.17%) 0.03% Net amortization of premiums (1.71%) 1.24% 0.01% 0.10% 0.83% GAAP interest expense 0.07% 0.09% 0.09% 0.36% 0.90% Current quarter net interest spread 1.62% 3.34% 2.10% 2.10% 1.81% Net Interest Spread
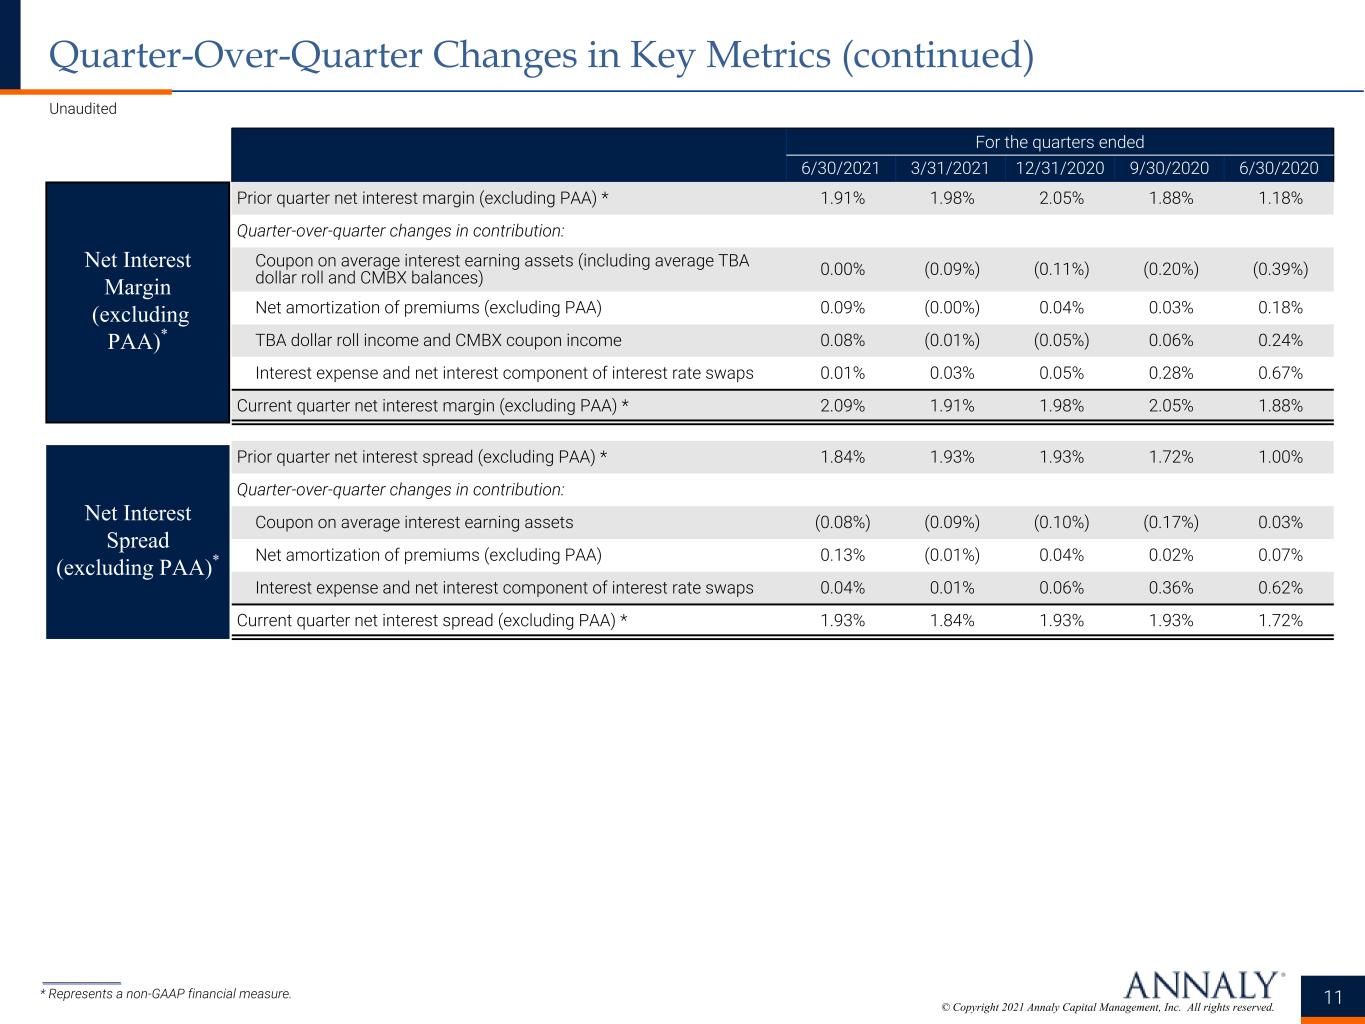
© Copyright 2021 Annaly Capital Management, Inc. All rights reserved. Net Interest Margin (excluding PAA)* Unaudited 11 Quarter-Over-Quarter Changes in Key Metrics (continued) ______________ * Represents a non-GAAP financial measure. For the quarters ended 6/30/2021 3/31/2021 12/31/2020 9/30/2020 6/30/2020 Prior quarter net interest margin (excluding PAA) * 1.91% 1.98% 2.05% 1.88% 1.18% Quarter-over-quarter changes in contribution: Coupon on average interest earning assets (including average TBA dollar roll and CMBX balances) 0.00% (0.09%) (0.11%) (0.20%) (0.39%) Net amortization of premiums (excluding PAA) 0.09% (0.00%) 0.04% 0.03% 0.18% TBA dollar roll income and CMBX coupon income 0.08% (0.01%) (0.05%) 0.06% 0.24% Interest expense and net interest component of interest rate swaps 0.01% 0.03% 0.05% 0.28% 0.67% Current quarter net interest margin (excluding PAA) * 2.09% 1.91% 1.98% 2.05% 1.88% Prior quarter net interest spread (excluding PAA) * 1.84% 1.93% 1.93% 1.72% 1.00% Quarter-over-quarter changes in contribution: Coupon on average interest earning assets (0.08%) (0.09%) (0.10%) (0.17%) 0.03% Net amortization of premiums (excluding PAA) 0.13% (0.01%) 0.04% 0.02% 0.07% Interest expense and net interest component of interest rate swaps 0.04% 0.01% 0.06% 0.36% 0.62% Current quarter net interest spread (excluding PAA) * 1.93% 1.84% 1.93% 1.93% 1.72% Net Interest Spread (excluding PAA)*
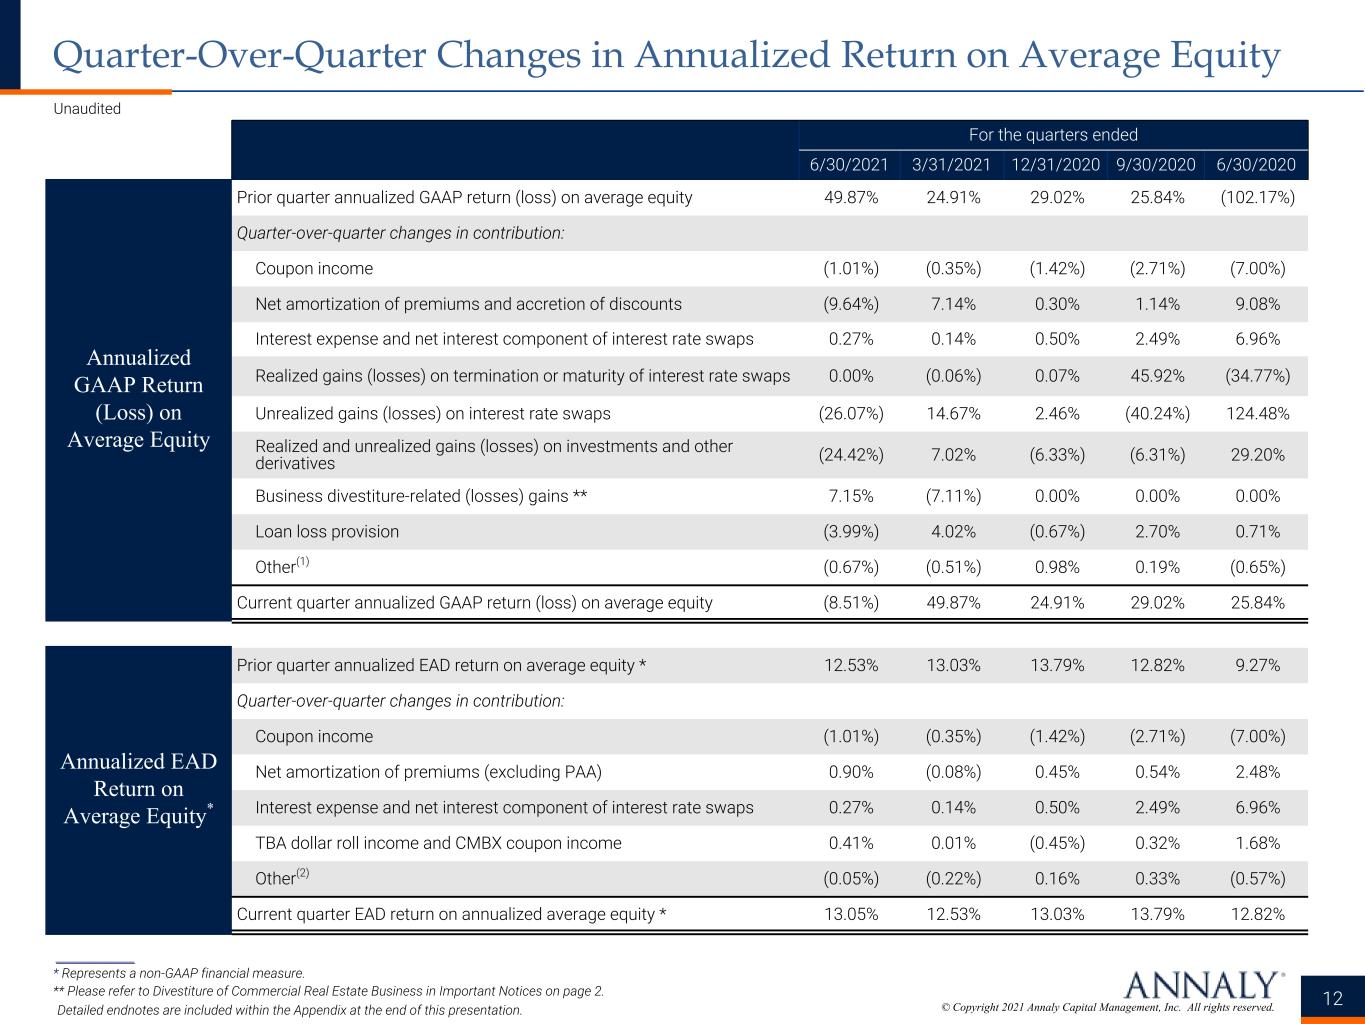
© Copyright 2021 Annaly Capital Management, Inc. All rights reserved. Annualized GAAP Return (Loss) on Average Equity Annualized EAD Return on Average Equity* ______________ * Represents a non-GAAP financial measure. ** Please refer to Divestiture of Commercial Real Estate Business in Important Notices on page 2. Detailed endnotes are included within the Appendix at the end of this presentation. Unaudited 12 Quarter-Over-Quarter Changes in Annualized Return on Average Equity For the quarters ended 6/30/2021 3/31/2021 12/31/2020 9/30/2020 6/30/2020 Prior quarter annualized GAAP return (loss) on average equity 49.87% 24.91% 29.02% 25.84% (102.17%) Quarter-over-quarter changes in contribution: Coupon income (1.01%) (0.35%) (1.42%) (2.71%) (7.00%) Net amortization of premiums and accretion of discounts (9.64%) 7.14% 0.30% 1.14% 9.08% Interest expense and net interest component of interest rate swaps 0.27% 0.14% 0.50% 2.49% 6.96% Realized gains (losses) on termination or maturity of interest rate swaps 0.00% (0.06%) 0.07% 45.92% (34.77%) Unrealized gains (losses) on interest rate swaps (26.07%) 14.67% 2.46% (40.24%) 124.48% Realized and unrealized gains (losses) on investments and other derivatives (24.42%) 7.02% (6.33%) (6.31%) 29.20% Business divestiture-related (losses) gains ** 7.15% (7.11%) 0.00% 0.00% 0.00% Loan loss provision (3.99%) 4.02% (0.67%) 2.70% 0.71% Other(1) (0.67%) (0.51%) 0.98% 0.19% (0.65%) Current quarter annualized GAAP return (loss) on average equity (8.51%) 49.87% 24.91% 29.02% 25.84% Prior quarter annualized EAD return on average equity * 12.53% 13.03% 13.79% 12.82% 9.27% Quarter-over-quarter changes in contribution: Coupon income (1.01%) (0.35%) (1.42%) (2.71%) (7.00%) Net amortization of premiums (excluding PAA) 0.90% (0.08%) 0.45% 0.54% 2.48% Interest expense and net interest component of interest rate swaps 0.27% 0.14% 0.50% 2.49% 6.96% TBA dollar roll income and CMBX coupon income 0.41% 0.01% (0.45%) 0.32% 1.68% Other(2) (0.05%) (0.22%) 0.16% 0.33% (0.57%) Current quarter EAD return on annualized average equity * 13.05% 12.53% 13.03% 13.79% 12.82%
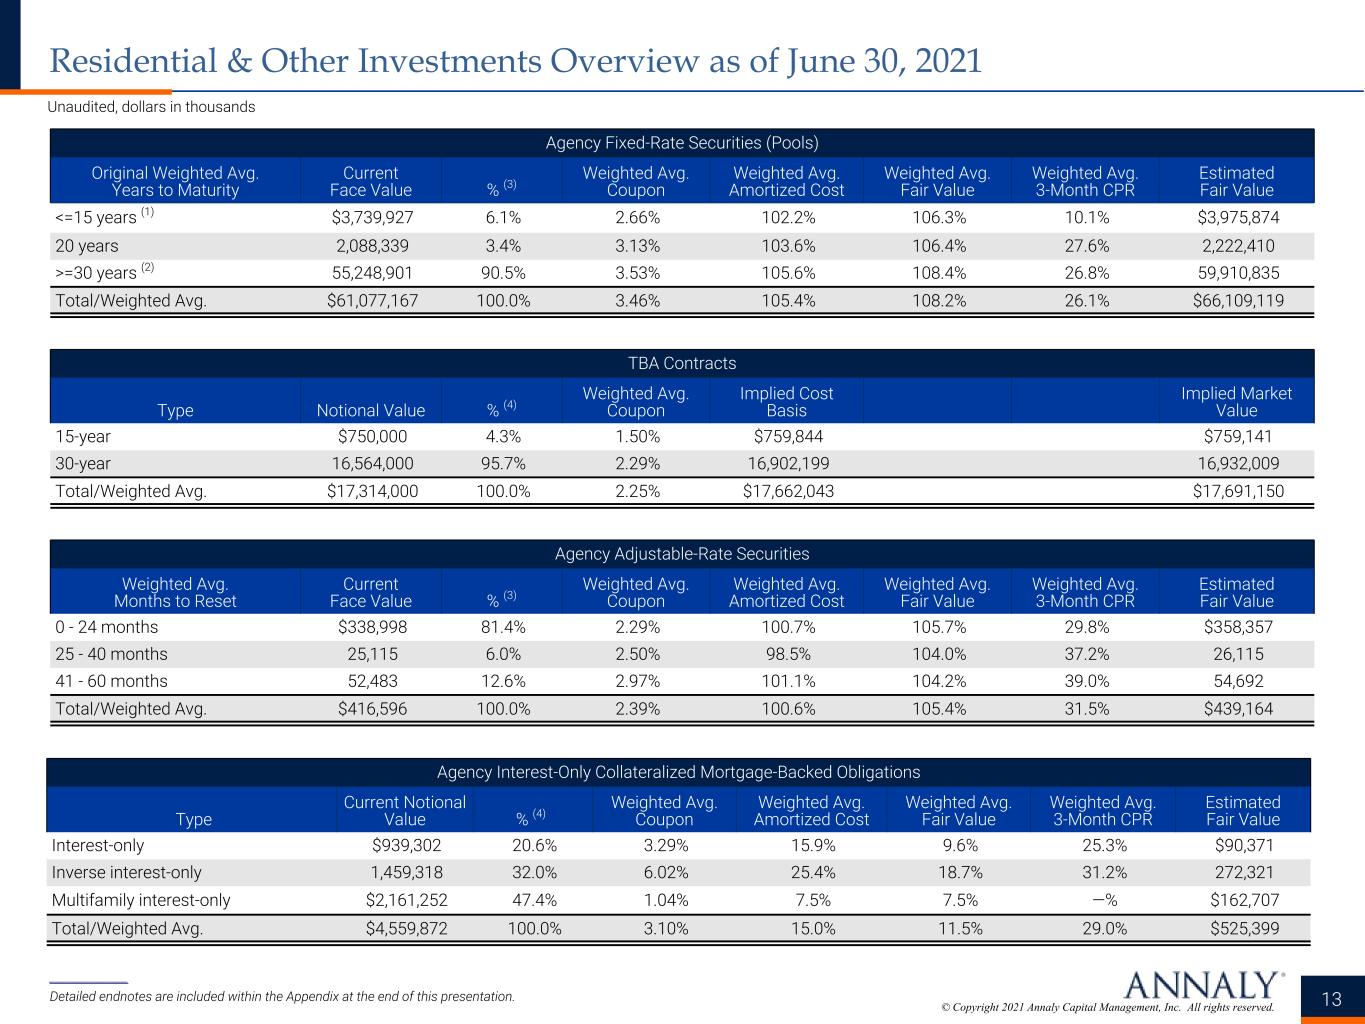
© Copyright 2021 Annaly Capital Management, Inc. All rights reserved. ______________ Detailed endnotes are included within the Appendix at the end of this presentation. Unaudited, dollars in thousands 13 Residential & Other Investments Overview as of June 30, 2021 Agency Fixed-Rate Securities (Pools) Original Weighted Avg. Years to Maturity Current Face Value % (3) Weighted Avg. Coupon Weighted Avg. Amortized Cost Weighted Avg. Fair Value Weighted Avg. 3-Month CPR Estimated Fair Value <=15 years (1) $3,739,927 6.1% 2.66% 102.2% 106.3% 10.1% $3,975,874 20 years 2,088,339 3.4% 3.13% 103.6% 106.4% 27.6% 2,222,410 >=30 years (2) 55,248,901 90.5% 3.53% 105.6% 108.4% 26.8% 59,910,835 Total/Weighted Avg. $61,077,167 100.0% 3.46% 105.4% 108.2% 26.1% $66,109,119 TBA Contracts Type Notional Value % (4) Weighted Avg. Coupon Implied Cost Basis Implied Market Value 15-year $750,000 4.3% 1.50% $759,844 $759,141 30-year 16,564,000 95.7% 2.29% 16,902,199 16,932,009 Total/Weighted Avg. $17,314,000 100.0% 2.25% $17,662,043 $17,691,150 Agency Adjustable-Rate Securities Weighted Avg. Months to Reset Current Face Value % (3) Weighted Avg. Coupon Weighted Avg. Amortized Cost Weighted Avg. Fair Value Weighted Avg. 3-Month CPR Estimated Fair Value 0 - 24 months $338,998 81.4% 2.29% 100.7% 105.7% 29.8% $358,357 25 - 40 months 25,115 6.0% 2.50% 98.5% 104.0% 37.2% 26,115 41 - 60 months 52,483 12.6% 2.97% 101.1% 104.2% 39.0% 54,692 Total/Weighted Avg. $416,596 100.0% 2.39% 100.6% 105.4% 31.5% $439,164 Agency Interest-Only Collateralized Mortgage-Backed Obligations Type Current Notional Value % (4) Weighted Avg. Coupon Weighted Avg. Amortized Cost Weighted Avg. Fair Value Weighted Avg. 3-Month CPR Estimated Fair Value Interest-only $939,302 20.6% 3.29% 15.9% 9.6% 25.3% $90,371 Inverse interest-only 1,459,318 32.0% 6.02% 25.4% 18.7% 31.2% 272,321 Multifamily interest-only $2,161,252 47.4% 1.04% 7.5% 7.5% —% $162,707 Total/Weighted Avg. $4,559,872 100.0% 3.10% 15.0% 11.5% 29.0% $525,399
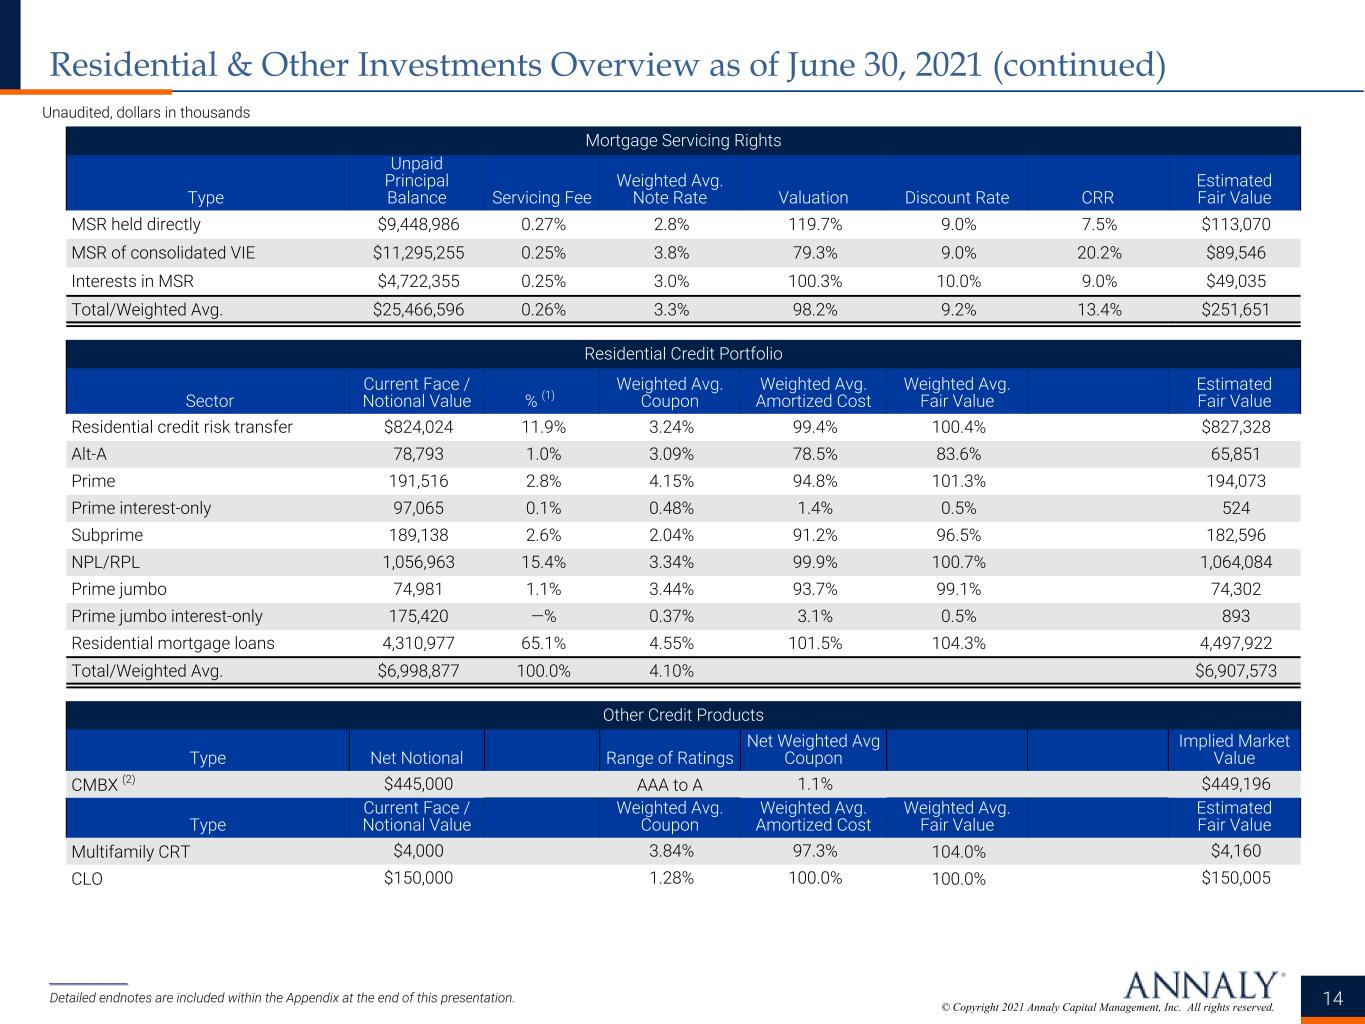
© Copyright 2021 Annaly Capital Management, Inc. All rights reserved. ______________ Detailed endnotes are included within the Appendix at the end of this presentation. Unaudited, dollars in thousands 14 Residential & Other Investments Overview as of June 30, 2021 (continued) Mortgage Servicing Rights Type Unpaid Principal Balance Servicing Fee Weighted Avg. Note Rate Valuation Discount Rate CRR Estimated Fair Value MSR held directly $9,448,986 0.27% 2.8% 119.7% 9.0% 7.5% $113,070 MSR of consolidated VIE $11,295,255 0.25% 3.8% 79.3% 9.0% 20.2% $89,546 Interests in MSR $4,722,355 0.25% 3.0% 100.3% 10.0% 9.0% $49,035 Total/Weighted Avg. $25,466,596 0.26% 3.3% 98.2% 9.2% 13.4% $251,651 Residential Credit Portfolio Sector Current Face / Notional Value % (1) Weighted Avg. Coupon Weighted Avg. Amortized Cost Weighted Avg. Fair Value Estimated Fair Value Residential credit risk transfer $824,024 11.9% 3.24% 99.4% 100.4% $827,328 Alt-A 78,793 1.0% 3.09% 78.5% 83.6% 65,851 Prime 191,516 2.8% 4.15% 94.8% 101.3% 194,073 Prime interest-only 97,065 0.1% 0.48% 1.4% 0.5% 524 Subprime 189,138 2.6% 2.04% 91.2% 96.5% 182,596 NPL/RPL 1,056,963 15.4% 3.34% 99.9% 100.7% 1,064,084 Prime jumbo 74,981 1.1% 3.44% 93.7% 99.1% 74,302 Prime jumbo interest-only 175,420 —% 0.37% 3.1% 0.5% 893 Residential mortgage loans 4,310,977 65.1% 4.55% 101.5% 104.3% 4,497,922 Total/Weighted Avg. $6,998,877 100.0% 4.10% $6,907,573 Other Credit Products Type Net Notional Range of Ratings Net Weighted Avg Coupon Implied Market Value CMBX (2) $445,000 AAA to A 1.1% $449,196 Type Current Face / Notional Value Weighted Avg. Coupon Weighted Avg. Amortized Cost Weighted Avg. Fair Value Estimated Fair Value Multifamily CRT $4,000 3.84% 97.3% 104.0% $4,160 CLO $150,000 1.28% 100.0% 100.0% $150,005
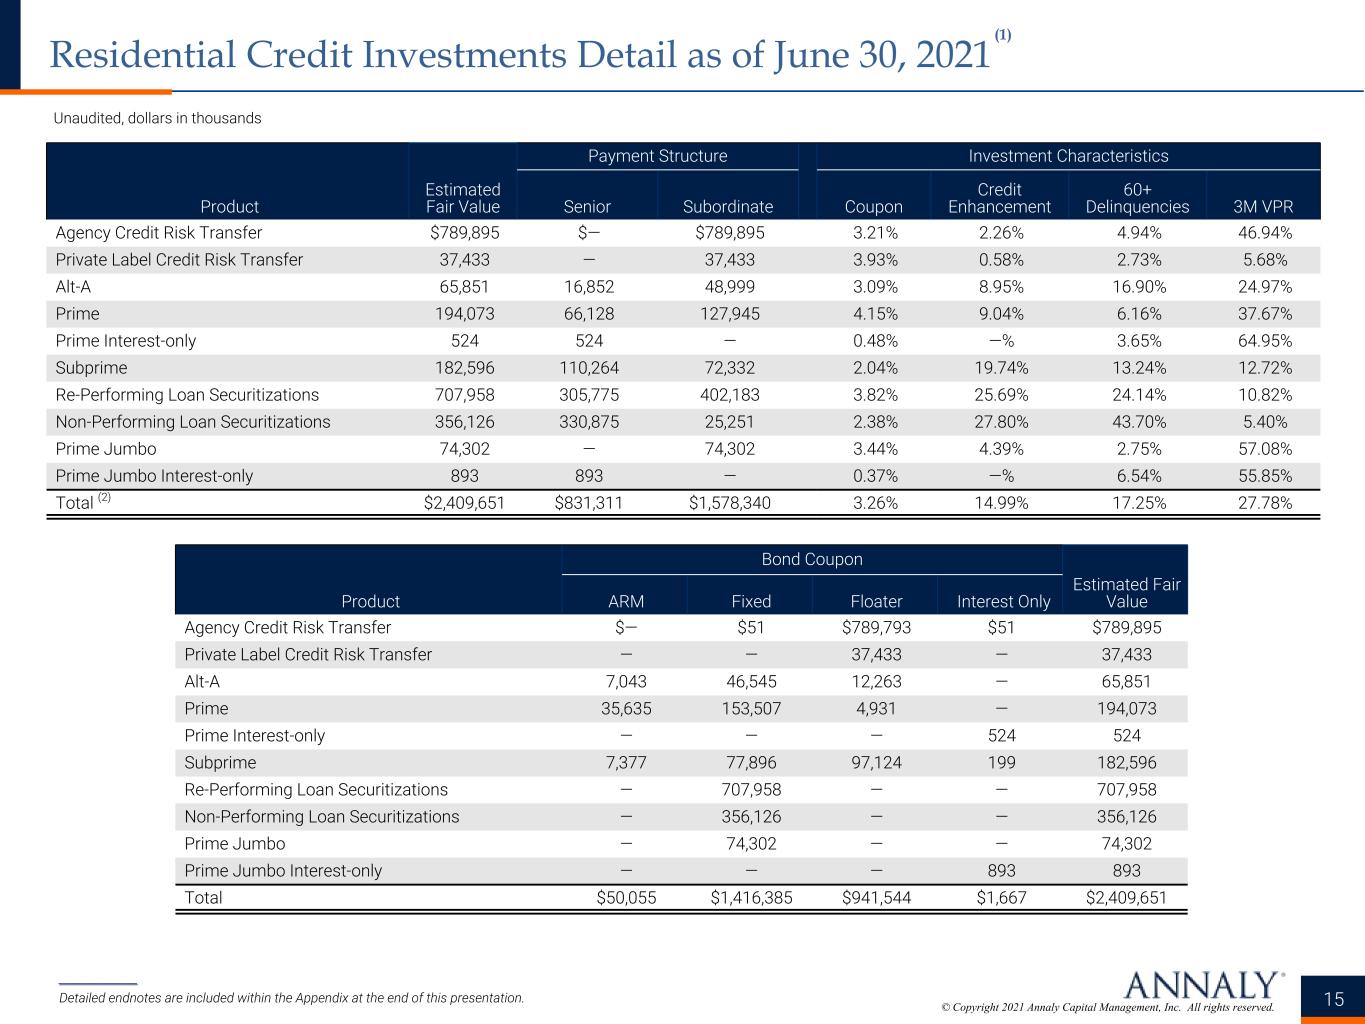
© Copyright 2021 Annaly Capital Management, Inc. All rights reserved. ______________ Detailed endnotes are included within the Appendix at the end of this presentation. Unaudited, dollars in thousands 15 Residential Credit Investments Detail as of June 30, 2021 (1) Product Estimated Fair Value Payment Structure Investment Characteristics Senior Subordinate Coupon Credit Enhancement 60+ Delinquencies 3M VPR Agency Credit Risk Transfer $789,895 $— $789,895 3.21% 2.26% 4.94% 46.94% Private Label Credit Risk Transfer 37,433 — 37,433 3.93% 0.58% 2.73% 5.68% Alt-A 65,851 16,852 48,999 3.09% 8.95% 16.90% 24.97% Prime 194,073 66,128 127,945 4.15% 9.04% 6.16% 37.67% Prime Interest-only 524 524 — 0.48% —% 3.65% 64.95% Subprime 182,596 110,264 72,332 2.04% 19.74% 13.24% 12.72% Re-Performing Loan Securitizations 707,958 305,775 402,183 3.82% 25.69% 24.14% 10.82% Non-Performing Loan Securitizations 356,126 330,875 25,251 2.38% 27.80% 43.70% 5.40% Prime Jumbo 74,302 — 74,302 3.44% 4.39% 2.75% 57.08% Prime Jumbo Interest-only 893 893 — 0.37% —% 6.54% 55.85% Total (2) $2,409,651 $831,311 $1,578,340 3.26% 14.99% 17.25% 27.78% Product Bond Coupon Estimated Fair ValueARM Fixed Floater Interest Only Agency Credit Risk Transfer $— $51 $789,793 $51 $789,895 Private Label Credit Risk Transfer — — 37,433 — 37,433 Alt-A 7,043 46,545 12,263 — 65,851 Prime 35,635 153,507 4,931 — 194,073 Prime Interest-only — — — 524 524 Subprime 7,377 77,896 97,124 199 182,596 Re-Performing Loan Securitizations — 707,958 — — 707,958 Non-Performing Loan Securitizations — 356,126 — — 356,126 Prime Jumbo — 74,302 — — 74,302 Prime Jumbo Interest-only — — — 893 893 Total $50,055 $1,416,385 $941,544 $1,667 $2,409,651
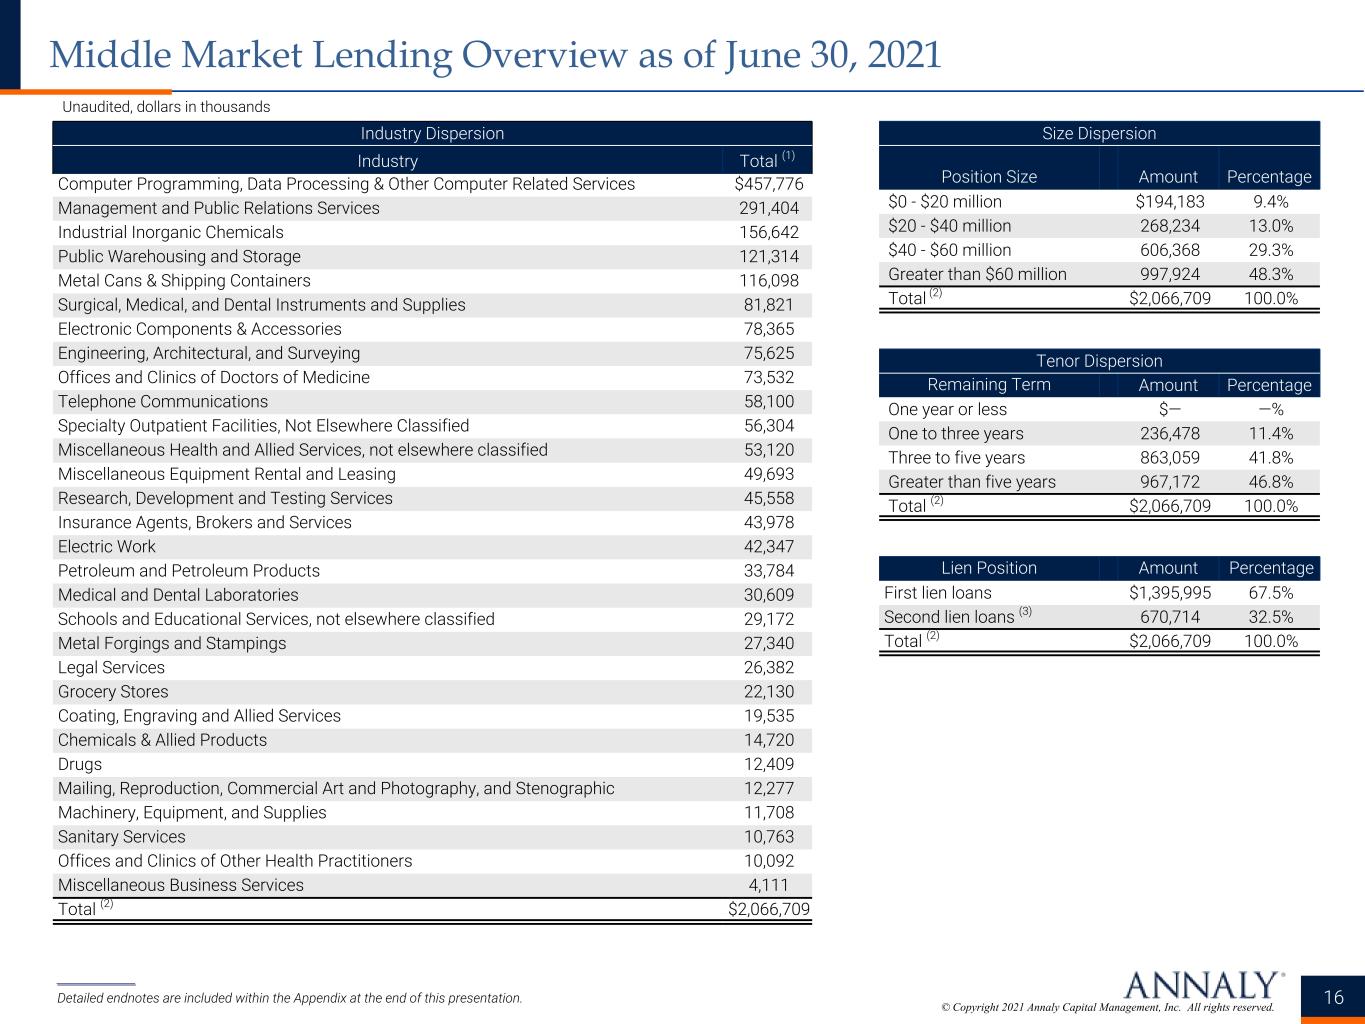
© Copyright 2021 Annaly Capital Management, Inc. All rights reserved. Unaudited, dollars in thousands 16 Middle Market Lending Overview as of June 30, 2021 Industry Dispersion Industry Total (1) Computer Programming, Data Processing & Other Computer Related Services $457,776 Management and Public Relations Services 291,404 Industrial Inorganic Chemicals 156,642 Public Warehousing and Storage 121,314 Metal Cans & Shipping Containers 116,098 Surgical, Medical, and Dental Instruments and Supplies 81,821 Electronic Components & Accessories 78,365 Engineering, Architectural, and Surveying 75,625 Offices and Clinics of Doctors of Medicine 73,532 Telephone Communications 58,100 Specialty Outpatient Facilities, Not Elsewhere Classified 56,304 Miscellaneous Health and Allied Services, not elsewhere classified 53,120 Miscellaneous Equipment Rental and Leasing 49,693 Research, Development and Testing Services 45,558 Insurance Agents, Brokers and Services 43,978 Electric Work 42,347 Petroleum and Petroleum Products 33,784 Medical and Dental Laboratories 30,609 Schools and Educational Services, not elsewhere classified 29,172 Metal Forgings and Stampings 27,340 Legal Services 26,382 Grocery Stores 22,130 Coating, Engraving and Allied Services 19,535 Chemicals & Allied Products 14,720 Drugs 12,409 Mailing, Reproduction, Commercial Art and Photography, and Stenographic 12,277 Machinery, Equipment, and Supplies 11,708 Sanitary Services 10,763 Offices and Clinics of Other Health Practitioners 10,092 Miscellaneous Business Services 4,111 Total (2) $2,066,709 Size Dispersion Position Size Amount Percentage $0 - $20 million $194,183 9.4% $20 - $40 million 268,234 13.0% $40 - $60 million 606,368 29.3% Greater than $60 million 997,924 48.3% Total (2) $2,066,709 100.0% Tenor Dispersion Remaining Term Amount Percentage One year or less $— —% One to three years 236,478 11.4% Three to five years 863,059 41.8% Greater than five years 967,172 46.8% Total (2) $2,066,709 100.0% Lien Position Amount Percentage First lien loans $1,395,995 67.5% Second lien loans (3) 670,714 32.5% Total (2) $2,066,709 100.0% ______________ Detailed endnotes are included within the Appendix at the end of this presentation.
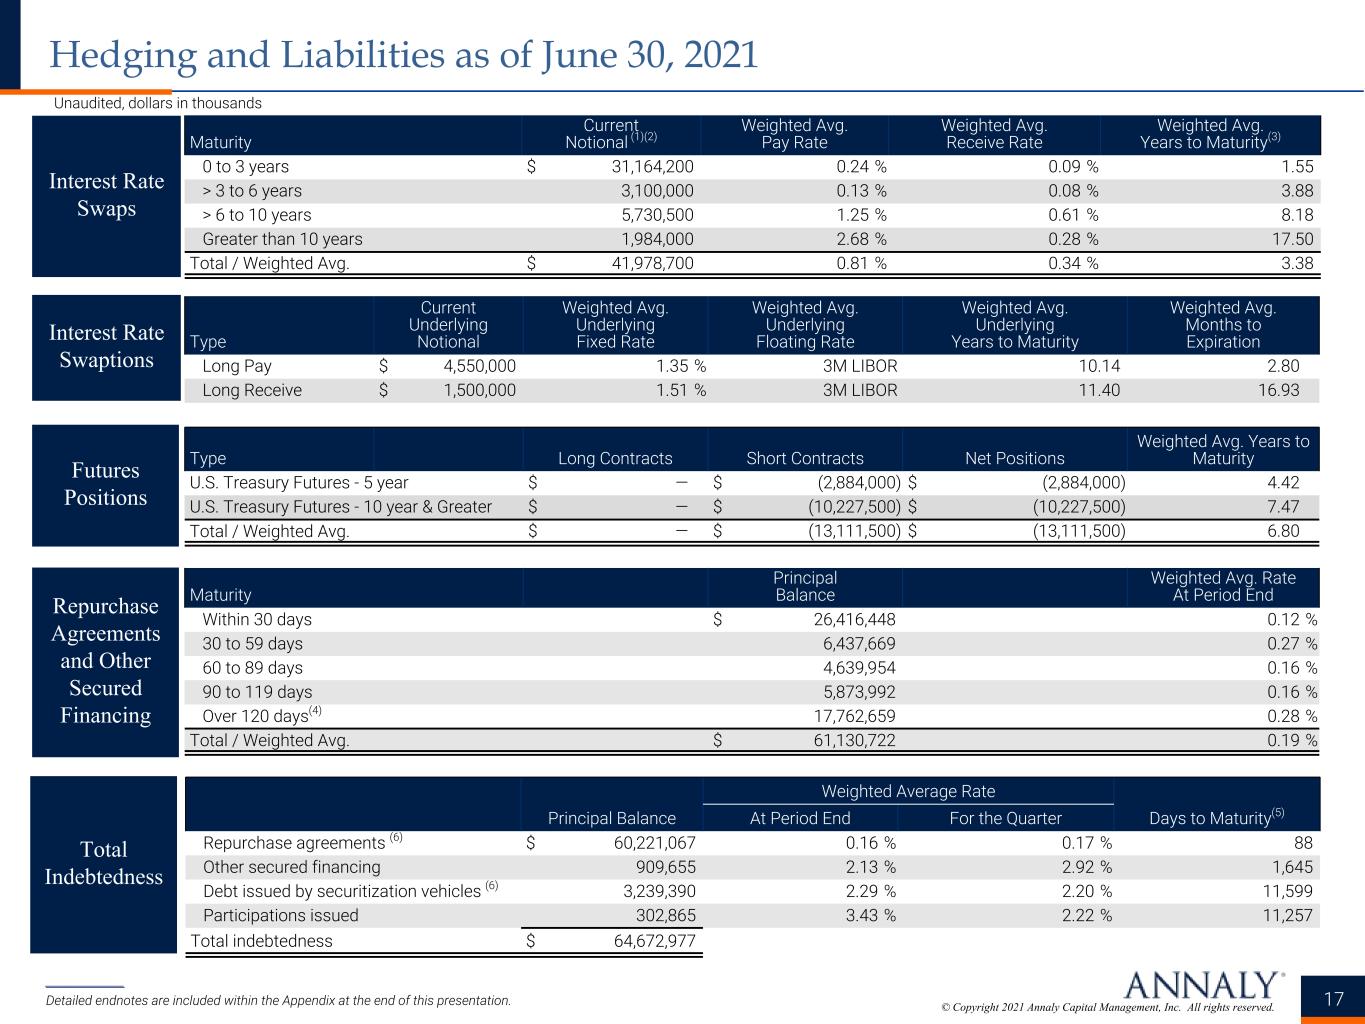
© Copyright 2021 Annaly Capital Management, Inc. All rights reserved. ______________ Detailed endnotes are included within the Appendix at the end of this presentation. 17 Unaudited, dollars in thousands Hedging and Liabilities as of June 30, 2021 Principal Balance Weighted Average Rate Days to Maturity(5)At Period End For the Quarter Repurchase agreements (6) $ 60,221,067 0.16 % 0.17 % 88 Other secured financing 909,655 2.13 % 2.92 % 1,645 Debt issued by securitization vehicles (6) 3,239,390 2.29 % 2.20 % 11,599 Participations issued 302,865 3.43 % 2.22 % 11,257 Total indebtedness $ 64,672,977 Maturity Current Notional (1)(2) Weighted Avg. Pay Rate Weighted Avg. Receive Rate Weighted Avg. Years to Maturity(3) 0 to 3 years $ 31,164,200 0.24 % 0.09 % 1.55 > 3 to 6 years 3,100,000 0.13 % 0.08 % 3.88 > 6 to 10 years 5,730,500 1.25 % 0.61 % 8.18 Greater than 10 years 1,984,000 2.68 % 0.28 % 17.50 Total / Weighted Avg. $ 41,978,700 0.81 % 0.34 % 3.38 Type Current Underlying Notional Weighted Avg. Underlying Fixed Rate Weighted Avg. Underlying Floating Rate Weighted Avg. Underlying Years to Maturity Weighted Avg. Months to Expiration Long Pay $ 4,550,000 1.35 % 3M LIBOR 10.14 2.80 Long Receive $ 1,500,000 1.51 % 3M LIBOR 11.40 16.93 Type Long Contracts Short Contracts Net Positions Weighted Avg. Years to Maturity U.S. Treasury Futures - 5 year $ — $ (2,884,000) $ (2,884,000) 4.42 U.S. Treasury Futures - 10 year & Greater $ — $ (10,227,500) $ (10,227,500) 7.47 Total / Weighted Avg. $ — $ (13,111,500) $ (13,111,500) 6.80 Maturity Principal Balance Weighted Avg. Rate At Period End Within 30 days $ 26,416,448 0.12 % 30 to 59 days 6,437,669 0.27 % 60 to 89 days 4,639,954 0.16 % 90 to 119 days 5,873,992 0.16 % Over 120 days(4) 17,762,659 0.28 % Total / Weighted Avg. $ 61,130,722 0.19 % Interest Rate Swaps Interest Rate Swaptions Futures Positions Repurchase Agreements and Other Secured Financing Total Indebtedness
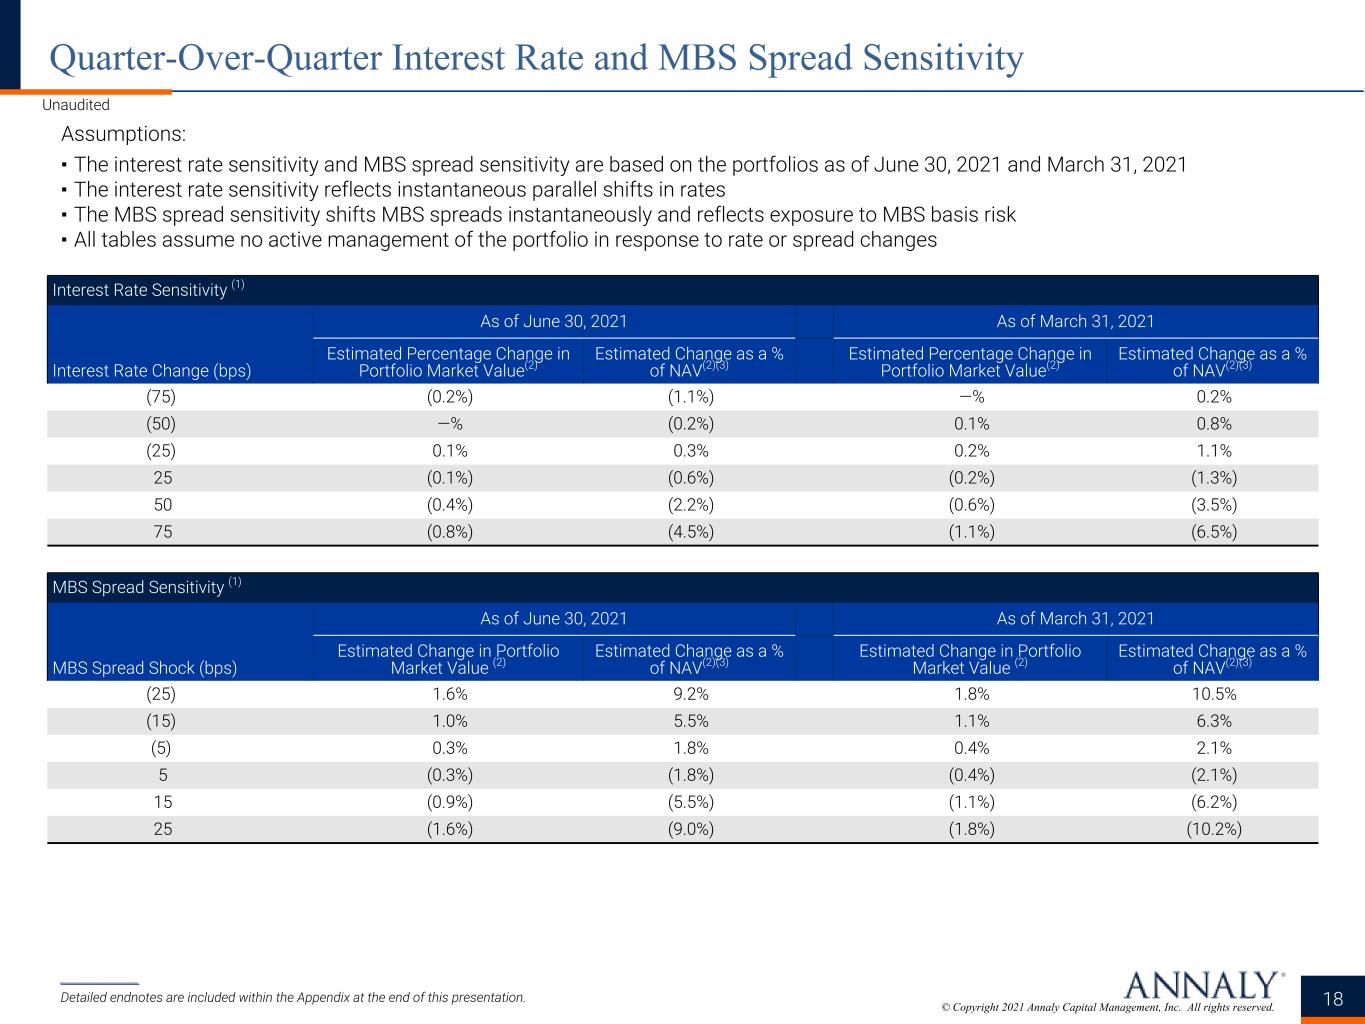
© Copyright 2021 Annaly Capital Management, Inc. All rights reserved. ______________ Detailed endnotes are included within the Appendix at the end of this presentation. Unaudited 18 Quarter-Over-Quarter Interest Rate and MBS Spread Sensitivity Assumptions: ▪ The interest rate sensitivity and MBS spread sensitivity are based on the portfolios as of June 30, 2021 and March 31, 2021 ▪ The interest rate sensitivity reflects instantaneous parallel shifts in rates ▪ The MBS spread sensitivity shifts MBS spreads instantaneously and reflects exposure to MBS basis risk ▪ All tables assume no active management of the portfolio in response to rate or spread changes Interest Rate Sensitivity (1) Interest Rate Change (bps) As of June 30, 2021 As of March 31, 2021 Estimated Percentage Change in Portfolio Market Value(2) Estimated Change as a % of NAV(2)(3) Estimated Percentage Change in Portfolio Market Value(2) Estimated Change as a % of NAV(2)(3) (75) (0.2%) (1.1%) —% 0.2% (50) —% (0.2%) 0.1% 0.8% (25) 0.1% 0.3% 0.2% 1.1% 25 (0.1%) (0.6%) (0.2%) (1.3%) 50 (0.4%) (2.2%) (0.6%) (3.5%) 75 (0.8%) (4.5%) (1.1%) (6.5%) MBS Spread Sensitivity (1) MBS Spread Shock (bps) As of June 30, 2021 As of March 31, 2021 Estimated Change in Portfolio Market Value (2) Estimated Change as a % of NAV(2)(3) Estimated Change in Portfolio Market Value (2) Estimated Change as a % of NAV(2)(3) (25) 1.6% 9.2% 1.8% 10.5% (15) 1.0% 5.5% 1.1% 6.3% (5) 0.3% 1.8% 0.4% 2.1% 5 (0.3%) (1.8%) (0.4%) (2.1%) 15 (0.9%) (5.5%) (1.1%) (6.2%) 25 (1.6%) (9.0%) (1.8%) (10.2%)
Appendix
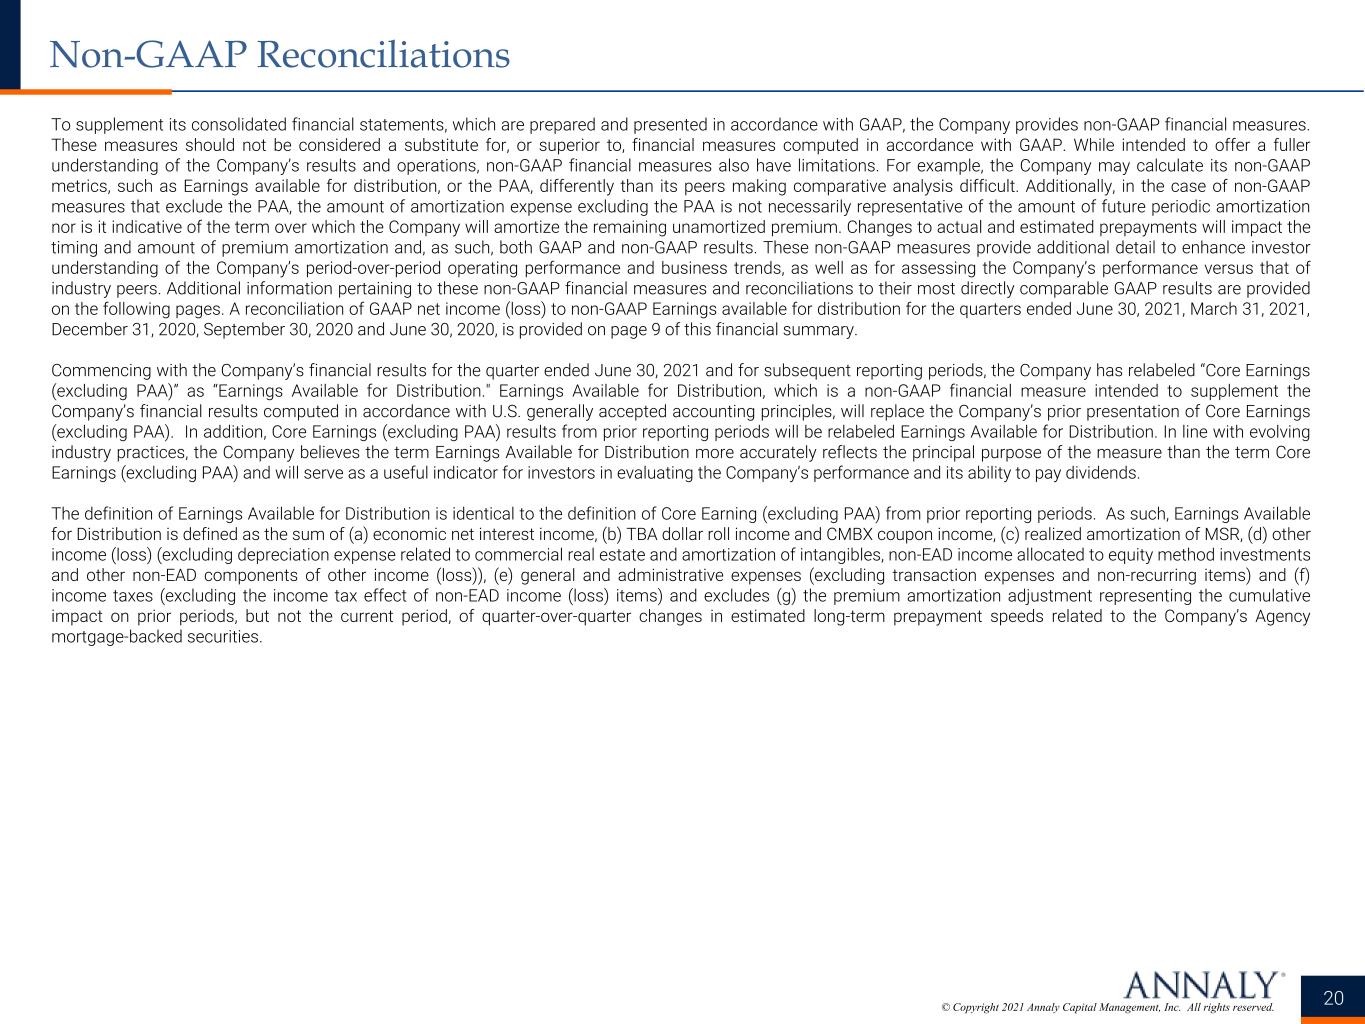
© Copyright 2021 Annaly Capital Management, Inc. All rights reserved. 20 Non-GAAP Reconciliations To supplement its consolidated financial statements, which are prepared and presented in accordance with GAAP, the Company provides non-GAAP financial measures. These measures should not be considered a substitute for, or superior to, financial measures computed in accordance with GAAP. While intended to offer a fuller understanding of the Company’s results and operations, non-GAAP financial measures also have limitations. For example, the Company may calculate its non-GAAP metrics, such as Earnings available for distribution, or the PAA, differently than its peers making comparative analysis difficult. Additionally, in the case of non-GAAP measures that exclude the PAA, the amount of amortization expense excluding the PAA is not necessarily representative of the amount of future periodic amortization nor is it indicative of the term over which the Company will amortize the remaining unamortized premium. Changes to actual and estimated prepayments will impact the timing and amount of premium amortization and, as such, both GAAP and non-GAAP results. These non-GAAP measures provide additional detail to enhance investor understanding of the Company’s period-over-period operating performance and business trends, as well as for assessing the Company’s performance versus that of industry peers. Additional information pertaining to these non-GAAP financial measures and reconciliations to their most directly comparable GAAP results are provided on the following pages. A reconciliation of GAAP net income (loss) to non-GAAP Earnings available for distribution for the quarters ended June 30, 2021, March 31, 2021, December 31, 2020, September 30, 2020 and June 30, 2020, is provided on page 9 of this financial summary. Commencing with the Company’s financial results for the quarter ended June 30, 2021 and for subsequent reporting periods, the Company has relabeled “Core Earnings (excluding PAA)” as “Earnings Available for Distribution." Earnings Available for Distribution, which is a non-GAAP financial measure intended to supplement the Company’s financial results computed in accordance with U.S. generally accepted accounting principles, will replace the Company’s prior presentation of Core Earnings (excluding PAA). In addition, Core Earnings (excluding PAA) results from prior reporting periods will be relabeled Earnings Available for Distribution. In line with evolving industry practices, the Company believes the term Earnings Available for Distribution more accurately reflects the principal purpose of the measure than the term Core Earnings (excluding PAA) and will serve as a useful indicator for investors in evaluating the Company’s performance and its ability to pay dividends. The definition of Earnings Available for Distribution is identical to the definition of Core Earning (excluding PAA) from prior reporting periods. As such, Earnings Available for Distribution is defined as the sum of (a) economic net interest income, (b) TBA dollar roll income and CMBX coupon income, (c) realized amortization of MSR, (d) other income (loss) (excluding depreciation expense related to commercial real estate and amortization of intangibles, non-EAD income allocated to equity method investments and other non-EAD components of other income (loss)), (e) general and administrative expenses (excluding transaction expenses and non-recurring items) and (f) income taxes (excluding the income tax effect of non-EAD income (loss) items) and excludes (g) the premium amortization adjustment representing the cumulative impact on prior periods, but not the current period, of quarter-over-quarter changes in estimated long-term prepayment speeds related to the Company’s Agency mortgage-backed securities.
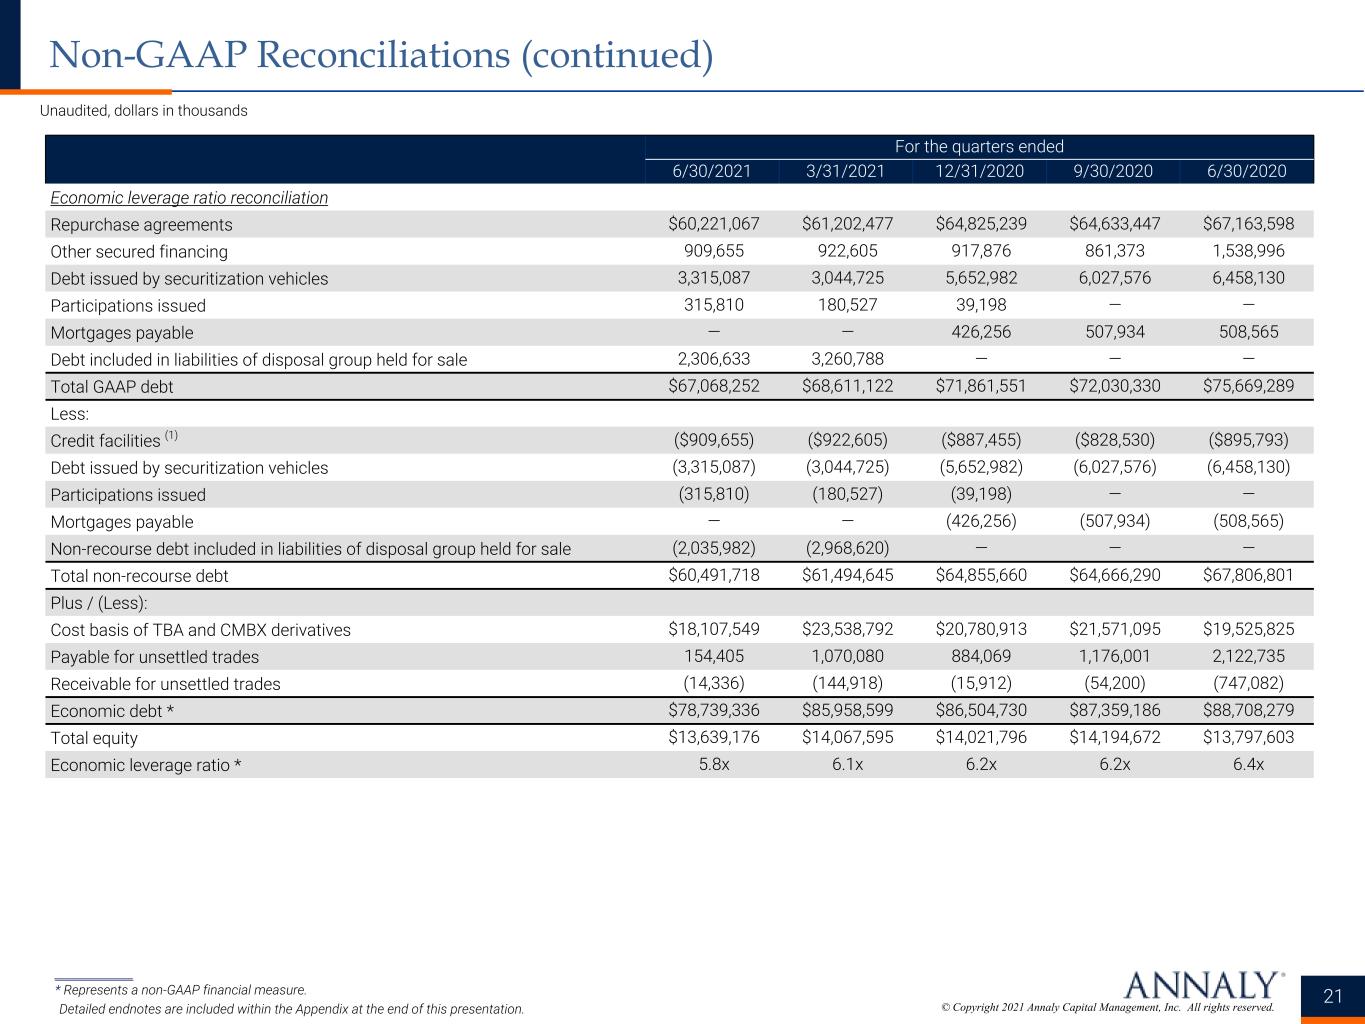
© Copyright 2021 Annaly Capital Management, Inc. All rights reserved. Unaudited, dollars in thousands 21 Non-GAAP Reconciliations (continued) For the quarters ended 6/30/2021 3/31/2021 12/31/2020 9/30/2020 6/30/2020 Economic leverage ratio reconciliation Repurchase agreements $60,221,067 $61,202,477 $64,825,239 $64,633,447 $67,163,598 Other secured financing 909,655 922,605 917,876 861,373 1,538,996 Debt issued by securitization vehicles 3,315,087 3,044,725 5,652,982 6,027,576 6,458,130 Participations issued 315,810 180,527 39,198 — — Mortgages payable — — 426,256 507,934 508,565 Debt included in liabilities of disposal group held for sale 2,306,633 3,260,788 — — — Total GAAP debt $67,068,252 $68,611,122 $71,861,551 $72,030,330 $75,669,289 Less: Credit facilities (1) ($909,655) ($922,605) ($887,455) ($828,530) ($895,793) Debt issued by securitization vehicles (3,315,087) (3,044,725) (5,652,982) (6,027,576) (6,458,130) Participations issued (315,810) (180,527) (39,198) — — Mortgages payable — — (426,256) (507,934) (508,565) Non-recourse debt included in liabilities of disposal group held for sale (2,035,982) (2,968,620) — — — Total non-recourse debt $60,491,718 $61,494,645 $64,855,660 $64,666,290 $67,806,801 Plus / (Less): Cost basis of TBA and CMBX derivatives $18,107,549 $23,538,792 $20,780,913 $21,571,095 $19,525,825 Payable for unsettled trades 154,405 1,070,080 884,069 1,176,001 2,122,735 Receivable for unsettled trades (14,336) (144,918) (15,912) (54,200) (747,082) Economic debt * $78,739,336 $85,958,599 $86,504,730 $87,359,186 $88,708,279 Total equity $13,639,176 $14,067,595 $14,021,796 $14,194,672 $13,797,603 Economic leverage ratio * 5.8x 6.1x 6.2x 6.2x 6.4x ______________ * Represents a non-GAAP financial measure. Detailed endnotes are included within the Appendix at the end of this presentation.
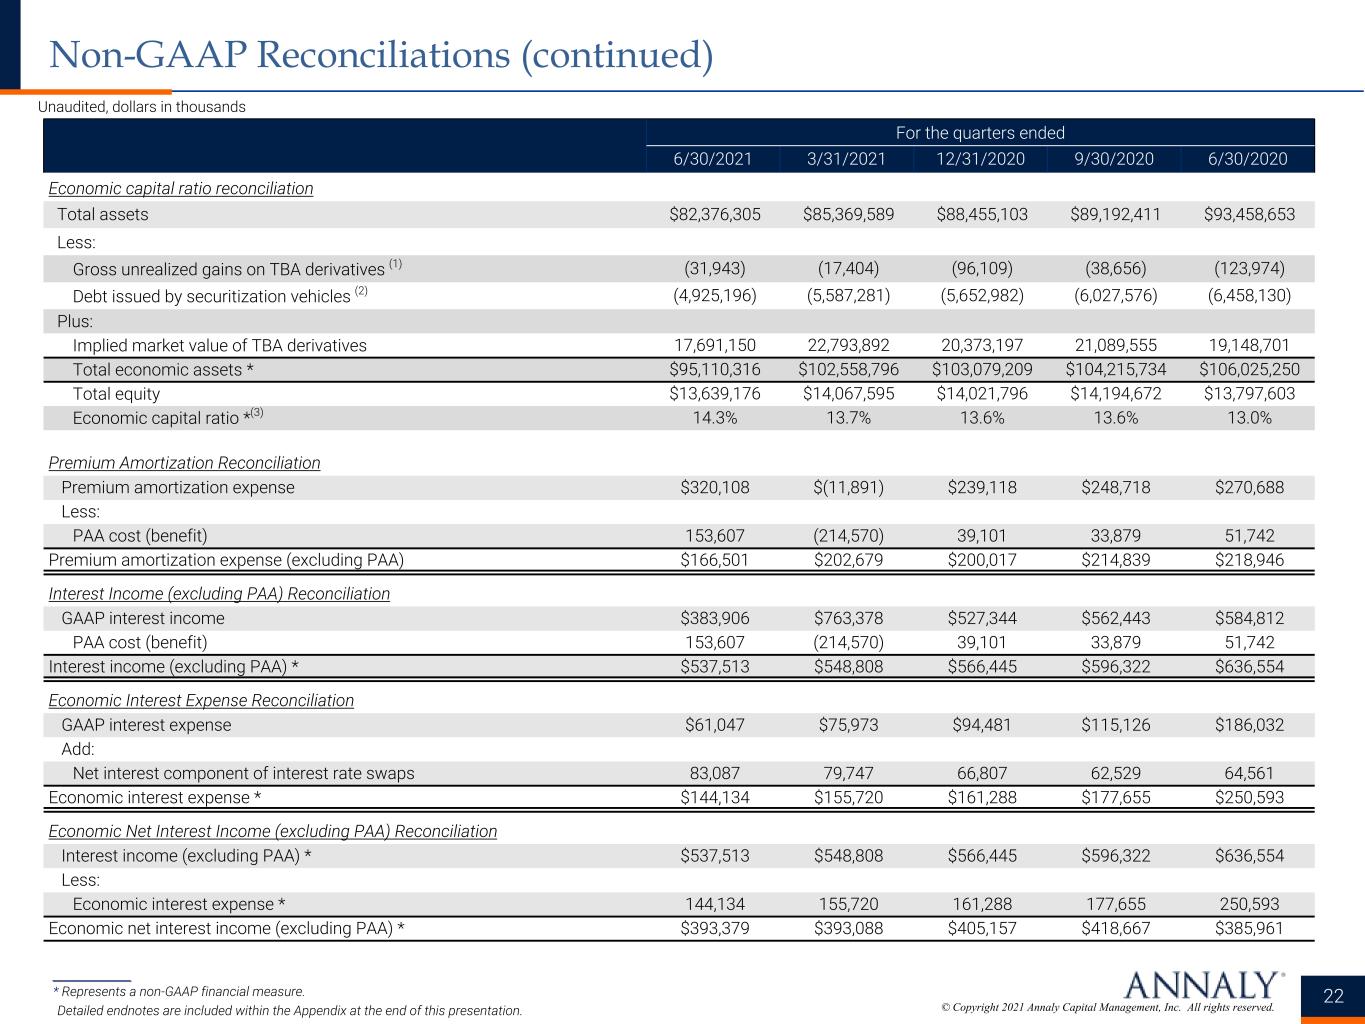
© Copyright 2021 Annaly Capital Management, Inc. All rights reserved. Unaudited, dollars in thousands 22 Non-GAAP Reconciliations (continued) For the quarters ended 6/30/2021 3/31/2021 12/31/2020 9/30/2020 6/30/2020 Economic capital ratio reconciliation Total assets $82,376,305 $85,369,589 $88,455,103 $89,192,411 $93,458,653 Less: Gross unrealized gains on TBA derivatives (1) (31,943) (17,404) (96,109) (38,656) (123,974) Debt issued by securitization vehicles (2) (4,925,196) (5,587,281) (5,652,982) (6,027,576) (6,458,130) Plus: Implied market value of TBA derivatives 17,691,150 22,793,892 20,373,197 21,089,555 19,148,701 Total economic assets * $95,110,316 $102,558,796 $103,079,209 $104,215,734 $106,025,250 Total equity $13,639,176 $14,067,595 $14,021,796 $14,194,672 $13,797,603 Economic capital ratio *(3) 14.3% 13.7% 13.6% 13.6% 13.0% Premium Amortization Reconciliation Premium amortization expense $320,108 $(11,891) $239,118 $248,718 $270,688 Less: PAA cost (benefit) 153,607 (214,570) 39,101 33,879 51,742 Premium amortization expense (excluding PAA) $166,501 $202,679 $200,017 $214,839 $218,946 Interest Income (excluding PAA) Reconciliation GAAP interest income $383,906 $763,378 $527,344 $562,443 $584,812 PAA cost (benefit) 153,607 (214,570) 39,101 33,879 51,742 Interest income (excluding PAA) * $537,513 $548,808 $566,445 $596,322 $636,554 Economic Interest Expense Reconciliation GAAP interest expense $61,047 $75,973 $94,481 $115,126 $186,032 Add: Net interest component of interest rate swaps 83,087 79,747 66,807 62,529 64,561 Economic interest expense * $144,134 $155,720 $161,288 $177,655 $250,593 Economic Net Interest Income (excluding PAA) Reconciliation Interest income (excluding PAA) * $537,513 $548,808 $566,445 $596,322 $636,554 Less: Economic interest expense * 144,134 155,720 161,288 177,655 250,593 Economic net interest income (excluding PAA) * $393,379 $393,088 $405,157 $418,667 $385,961 ______________ * Represents a non-GAAP financial measure. Detailed endnotes are included within the Appendix at the end of this presentation.
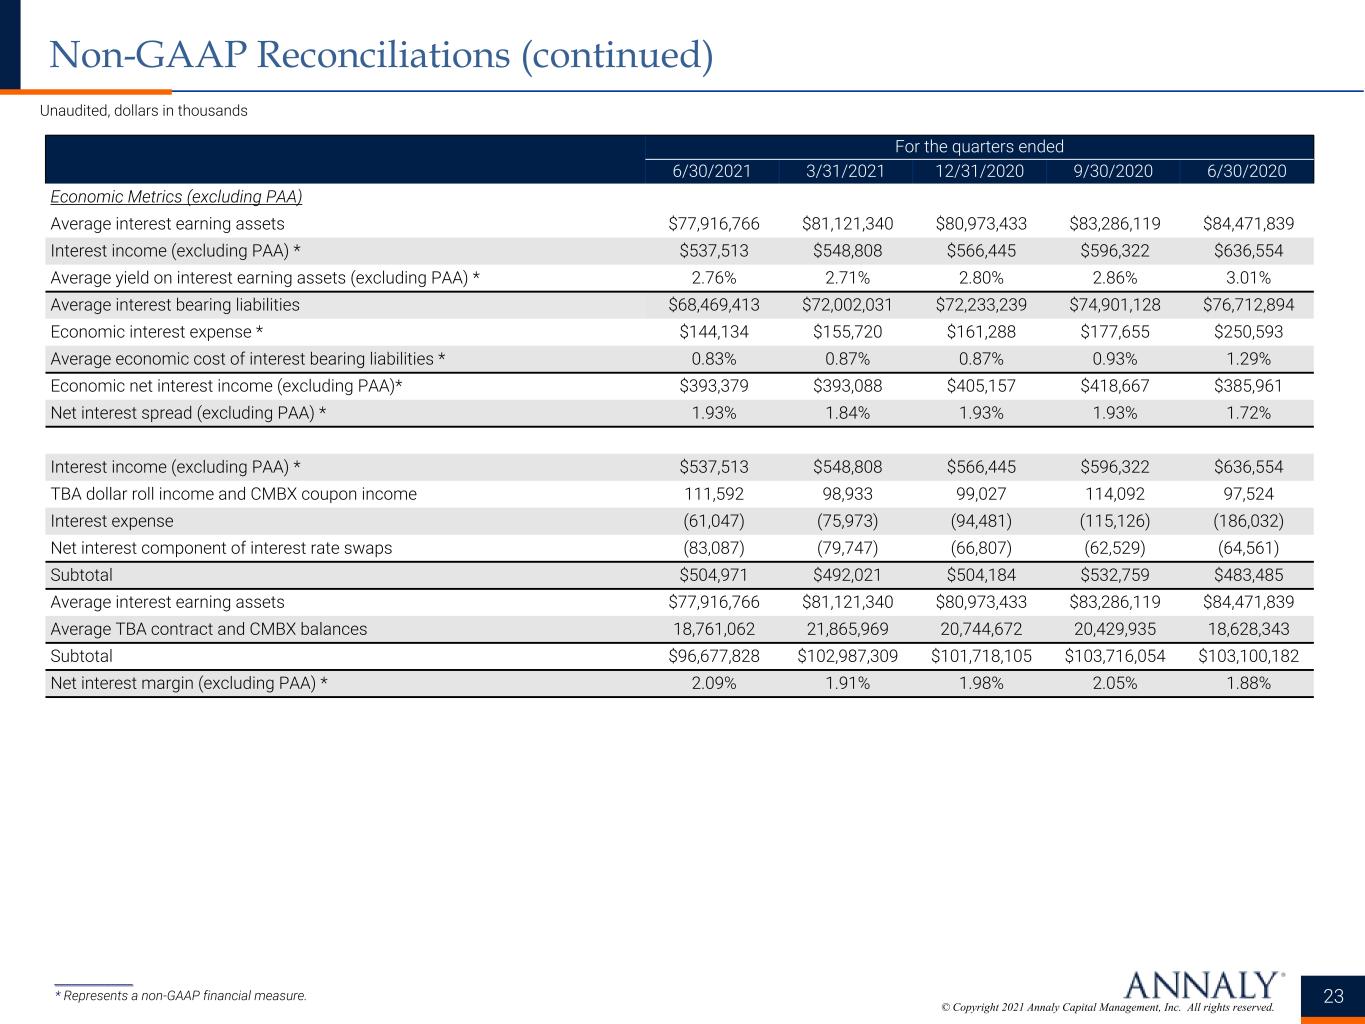
© Copyright 2021 Annaly Capital Management, Inc. All rights reserved. Unaudited, dollars in thousands 23 Non-GAAP Reconciliations (continued) For the quarters ended 6/30/2021 3/31/2021 12/31/2020 9/30/2020 6/30/2020 Economic Metrics (excluding PAA) Average interest earning assets $77,916,766 $81,121,340 $80,973,433 $83,286,119 $84,471,839 Interest income (excluding PAA) * $537,513 $548,808 $566,445 $596,322 $636,554 Average yield on interest earning assets (excluding PAA) * 2.76% 2.71% 2.80% 2.86% 3.01% Average interest bearing liabilities $68,469,413 $72,002,031 $72,233,239 $74,901,128 $76,712,894 Economic interest expense * $144,134 $155,720 $161,288 $177,655 $250,593 Average economic cost of interest bearing liabilities * 0.83% 0.87% 0.87% 0.93% 1.29% Economic net interest income (excluding PAA)* $393,379 $393,088 $405,157 $418,667 $385,961 Net interest spread (excluding PAA) * 1.93% 1.84% 1.93% 1.93% 1.72% Interest income (excluding PAA) * $537,513 $548,808 $566,445 $596,322 $636,554 TBA dollar roll income and CMBX coupon income 111,592 98,933 99,027 114,092 97,524 Interest expense (61,047) (75,973) (94,481) (115,126) (186,032) Net interest component of interest rate swaps (83,087) (79,747) (66,807) (62,529) (64,561) Subtotal $504,971 $492,021 $504,184 $532,759 $483,485 Average interest earning assets $77,916,766 $81,121,340 $80,973,433 $83,286,119 $84,471,839 Average TBA contract and CMBX balances 18,761,062 21,865,969 20,744,672 20,429,935 18,628,343 Subtotal $96,677,828 $102,987,309 $101,718,105 $103,716,054 $103,100,182 Net interest margin (excluding PAA) * 2.09% 1.91% 1.98% 2.05% 1.88% ______________ * Represents a non-GAAP financial measure.
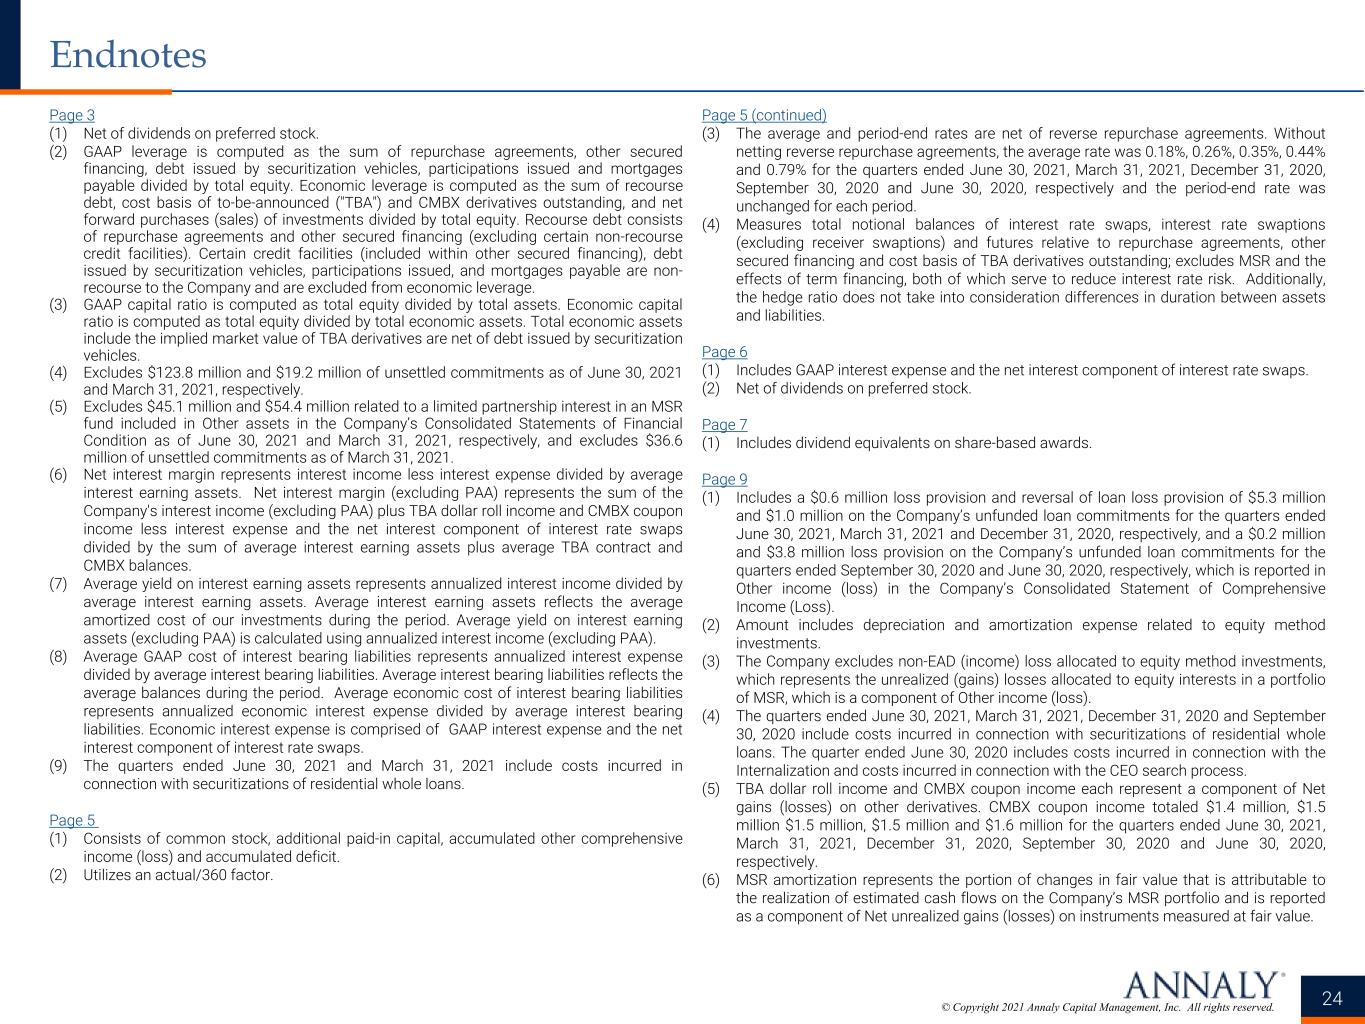
© Copyright 2021 Annaly Capital Management, Inc. All rights reserved. 24 Endnotes Page 3 (1) Net of dividends on preferred stock. (2) GAAP leverage is computed as the sum of repurchase agreements, other secured financing, debt issued by securitization vehicles, participations issued and mortgages payable divided by total equity. Economic leverage is computed as the sum of recourse debt, cost basis of to-be-announced ("TBA") and CMBX derivatives outstanding, and net forward purchases (sales) of investments divided by total equity. Recourse debt consists of repurchase agreements and other secured financing (excluding certain non-recourse credit facilities). Certain credit facilities (included within other secured financing), debt issued by securitization vehicles, participations issued, and mortgages payable are non- recourse to the Company and are excluded from economic leverage. (3) GAAP capital ratio is computed as total equity divided by total assets. Economic capital ratio is computed as total equity divided by total economic assets. Total economic assets include the implied market value of TBA derivatives are net of debt issued by securitization vehicles. (4) Excludes $123.8 million and $19.2 million of unsettled commitments as of June 30, 2021 and March 31, 2021, respectively. (5) Excludes $45.1 million and $54.4 million related to a limited partnership interest in an MSR fund included in Other assets in the Company’s Consolidated Statements of Financial Condition as of June 30, 2021 and March 31, 2021, respectively, and excludes $36.6 million of unsettled commitments as of March 31, 2021. (6) Net interest margin represents interest income less interest expense divided by average interest earning assets. Net interest margin (excluding PAA) represents the sum of the Company's interest income (excluding PAA) plus TBA dollar roll income and CMBX coupon income less interest expense and the net interest component of interest rate swaps divided by the sum of average interest earning assets plus average TBA contract and CMBX balances. (7) Average yield on interest earning assets represents annualized interest income divided by average interest earning assets. Average interest earning assets reflects the average amortized cost of our investments during the period. Average yield on interest earning assets (excluding PAA) is calculated using annualized interest income (excluding PAA). (8) Average GAAP cost of interest bearing liabilities represents annualized interest expense divided by average interest bearing liabilities. Average interest bearing liabilities reflects the average balances during the period. Average economic cost of interest bearing liabilities represents annualized economic interest expense divided by average interest bearing liabilities. Economic interest expense is comprised of GAAP interest expense and the net interest component of interest rate swaps. (9) The quarters ended June 30, 2021 and March 31, 2021 include costs incurred in connection with securitizations of residential whole loans. Page 5 (1) Consists of common stock, additional paid-in capital, accumulated other comprehensive income (loss) and accumulated deficit. (2) Utilizes an actual/360 factor. Page 5 (continued) (3) The average and period-end rates are net of reverse repurchase agreements. Without netting reverse repurchase agreements, the average rate was 0.18%, 0.26%, 0.35%, 0.44% and 0.79% for the quarters ended June 30, 2021, March 31, 2021, December 31, 2020, September 30, 2020 and June 30, 2020, respectively and the period-end rate was unchanged for each period. (4) Measures total notional balances of interest rate swaps, interest rate swaptions (excluding receiver swaptions) and futures relative to repurchase agreements, other secured financing and cost basis of TBA derivatives outstanding; excludes MSR and the effects of term financing, both of which serve to reduce interest rate risk. Additionally, the hedge ratio does not take into consideration differences in duration between assets and liabilities. Page 6 (1) Includes GAAP interest expense and the net interest component of interest rate swaps. (2) Net of dividends on preferred stock. Page 7 (1) Includes dividend equivalents on share-based awards. Page 9 (1) Includes a $0.6 million loss provision and reversal of loan loss provision of $5.3 million and $1.0 million on the Company’s unfunded loan commitments for the quarters ended June 30, 2021, March 31, 2021 and December 31, 2020, respectively, and a $0.2 million and $3.8 million loss provision on the Company’s unfunded loan commitments for the quarters ended September 30, 2020 and June 30, 2020, respectively, which is reported in Other income (loss) in the Company’s Consolidated Statement of Comprehensive Income (Loss). (2) Amount includes depreciation and amortization expense related to equity method investments. (3) The Company excludes non-EAD (income) loss allocated to equity method investments, which represents the unrealized (gains) losses allocated to equity interests in a portfolio of MSR, which is a component of Other income (loss). (4) The quarters ended June 30, 2021, March 31, 2021, December 31, 2020 and September 30, 2020 include costs incurred in connection with securitizations of residential whole loans. The quarter ended June 30, 2020 includes costs incurred in connection with the Internalization and costs incurred in connection with the CEO search process. (5) TBA dollar roll income and CMBX coupon income each represent a component of Net gains (losses) on other derivatives. CMBX coupon income totaled $1.4 million, $1.5 million $1.5 million, $1.5 million and $1.6 million for the quarters ended June 30, 2021, March 31, 2021, December 31, 2020, September 30, 2020 and June 30, 2020, respectively. (6) MSR amortization represents the portion of changes in fair value that is attributable to the realization of estimated cash flows on the Company’s MSR portfolio and is reported as a component of Net unrealized gains (losses) on instruments measured at fair value.
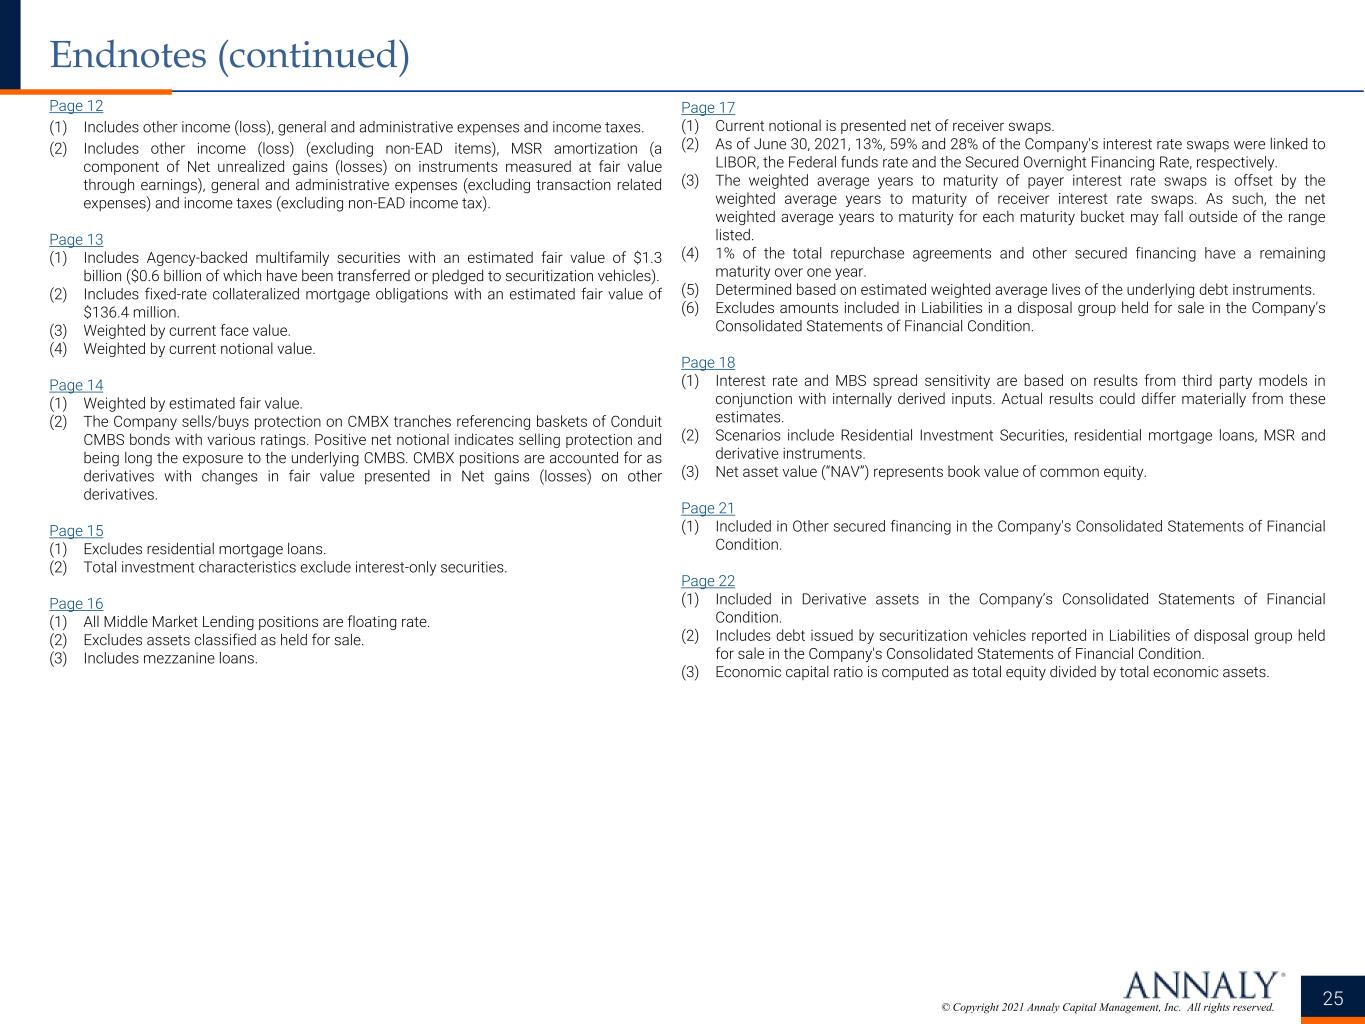
© Copyright 2021 Annaly Capital Management, Inc. All rights reserved. 25 Endnotes (continued) Page 12 (1) Includes other income (loss), general and administrative expenses and income taxes. (2) Includes other income (loss) (excluding non-EAD items), MSR amortization (a component of Net unrealized gains (losses) on instruments measured at fair value through earnings), general and administrative expenses (excluding transaction related expenses) and income taxes (excluding non-EAD income tax). Page 13 (1) Includes Agency-backed multifamily securities with an estimated fair value of $1.3 billion ($0.6 billion of which have been transferred or pledged to securitization vehicles). (2) Includes fixed-rate collateralized mortgage obligations with an estimated fair value of $136.4 million. (3) Weighted by current face value. (4) Weighted by current notional value. Page 14 (1) Weighted by estimated fair value. (2) The Company sells/buys protection on CMBX tranches referencing baskets of Conduit CMBS bonds with various ratings. Positive net notional indicates selling protection and being long the exposure to the underlying CMBS. CMBX positions are accounted for as derivatives with changes in fair value presented in Net gains (losses) on other derivatives. Page 15 (1) Excludes residential mortgage loans. (2) Total investment characteristics exclude interest-only securities. Page 16 (1) All Middle Market Lending positions are floating rate. (2) Excludes assets classified as held for sale. (3) Includes mezzanine loans. Page 17 (1) Current notional is presented net of receiver swaps. (2) As of June 30, 2021, 13%, 59% and 28% of the Company's interest rate swaps were linked to LIBOR, the Federal funds rate and the Secured Overnight Financing Rate, respectively. (3) The weighted average years to maturity of payer interest rate swaps is offset by the weighted average years to maturity of receiver interest rate swaps. As such, the net weighted average years to maturity for each maturity bucket may fall outside of the range listed. (4) 1% of the total repurchase agreements and other secured financing have a remaining maturity over one year. (5) Determined based on estimated weighted average lives of the underlying debt instruments. (6) Excludes amounts included in Liabilities in a disposal group held for sale in the Company’s Consolidated Statements of Financial Condition. Page 18 (1) Interest rate and MBS spread sensitivity are based on results from third party models in conjunction with internally derived inputs. Actual results could differ materially from these estimates. (2) Scenarios include Residential Investment Securities, residential mortgage loans, MSR and derivative instruments. (3) Net asset value (“NAV”) represents book value of common equity. Page 21 (1) Included in Other secured financing in the Company's Consolidated Statements of Financial Condition. Page 22 (1) Included in Derivative assets in the Company’s Consolidated Statements of Financial Condition. (2) Includes debt issued by securitization vehicles reported in Liabilities of disposal group held for sale in the Company's Consolidated Statements of Financial Condition. (3) Economic capital ratio is computed as total equity divided by total economic assets.
