Attached files
| file | filename |
|---|---|
| EX-99.3 - EX-99.3 - ECOLAB INC. | ecl-20210727xex99d3.htm |
| EX-99.1 - EX-99.1 - ECOLAB INC. | ecl-20210727xex99d1.htm |
| 8-K - 8-K - ECOLAB INC. | ecl-20210727x8k.htm |
Exhibit 99.2
| Please see Ecolab’s news release dated July 27, 2021 for additional information, including discussion on the use of certain non-GAAP financial measures. Second Quarter 2021 Teleconference Supplemental Data |
| Please see Ecolab’s news release dated July 27, 2021 for additional information, including discussion on the use of certain non-GAAP financial measures. . Cautionary Statement 2 Forward-Looking Information This communication contains forward looking statements as that term is defined in the Private Securities Litigation Reform Act of 1995. These forward-looking statements include, but are not limited to, statements regarding COVID-19 pandemic trends, the U.S. and global economic recovery, inflation, and our financial and business performance and prospects, including sales, earnings, pricing and new business. These statements are based on the current expectations of management. There are a number of risks and uncertainties that could cause actual results to differ materially from the forward-looking statements. In particular, with respect to the pandemic, numerous factors will determine the extent of the impact on our business, including the severity of the disease, the duration of the outbreak, the distribution and efficacy of vaccines, the likelihood of a resurgence of the outbreak, including as a result of emerging variants, actions that may be taken by governmental authorities intended to minimize the spread of the pandemic or to stimulate the economy and other unintended consequences. Additional risks and uncertainties are set forth under Item 1A of our most recent Form 10-K, and our other public filings with the Securities and Exchange Commission (“SEC”), and include the effects and duration of the COVID-19 pandemic; the vitality of the markets we serve; the impact of economic factors such as the worldwide economy; our ability to execute key business initiatives; potential information technology infrastructure failures or breaches in data security; our ability to attract, retain and develop high caliber management talent to lead our business; our ability to innovate and to commercialize digital solutions; exposure to global economic, political and legal risks; difficulty in procuring raw materials or fluctuations in raw material costs; and other uncertainties or risks reported from time to time in our reports to the SEC. In light of these risks, uncertainties and factors, the forward-looking events discussed in this communication may not occur. We caution that undue reliance should not be placed on forward-looking statements, which speak only as of the date made. Ecolab does not undertake, and expressly disclaims, any duty to update any forward-looking statement, except as required by law. Non-GAAP Financial Information This communication includes Company information that does not conform to generally accepted accounting principles (GAAP). Management believes that a presentation of this information is meaningful to investors because it provides insight with respect to ongoing operating results of the Company and allows investors to better evaluate the financial results of the Company. These measures should not be viewed as an alternative to GAAP measures of performance. Furthermore, these measures may not be consistent with similar measures provided by other companies. Reconciliations of our non-GAAP measures included within this presentation are included in the “Non-GAAP Financial Measures” section of this presentation. |
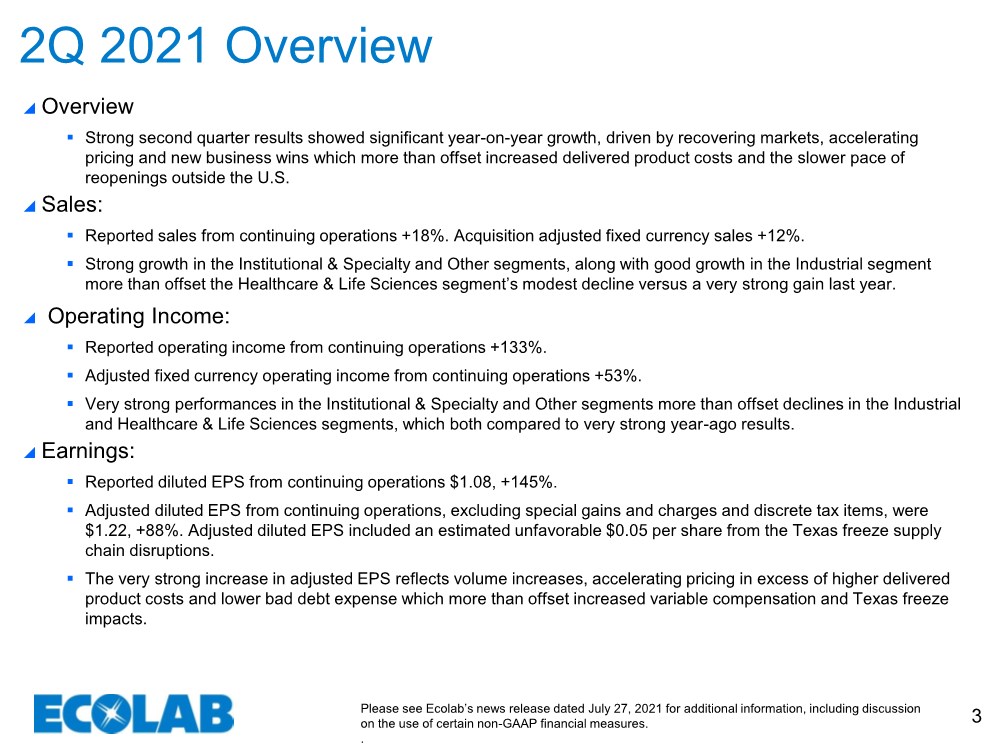
| Please see Ecolab’s news release dated July 27, 2021 for additional information, including discussion on the use of certain non-GAAP financial measures. . 3 Overview ▪ Strong second quarter results showed significant year-on-year growth, driven by recovering markets, accelerating pricing and new business wins which more than offset increased delivered product costs and the slower pace of reopenings outside the U.S. Sales: ▪ Reported sales from continuing operations +18%. Acquisition adjusted fixed currency sales +12%. ▪ Strong growth in the Institutional & Specialty and Other segments, along with good growth in the Industrial segment more than offset the Healthcare & Life Sciences segment’s modest decline versus a very strong gain last year. Operating Income: ▪ Reported operating income from continuing operations +133%. ▪ Adjusted fixed currency operating income from continuing operations +53%. ▪ Very strong performances in the Institutional & Specialty and Other segments more than offset declines in the Industrial and Healthcare & Life Sciences segments, which both compared to very strong year-ago results. Earnings: ▪ Reported diluted EPS from continuing operations $1.08, +145%. ▪ Adjusted diluted EPS from continuing operations, excluding special gains and charges and discrete tax items, were $1.22, +88%. Adjusted diluted EPS included an estimated unfavorable $0.05 per share from the Texas freeze supply chain disruptions. ▪ The very strong increase in adjusted EPS reflects volume increases, accelerating pricing in excess of higher delivered product costs and lower bad debt expense which more than offset increased variable compensation and Texas freeze impacts. 2Q 2021 Overview |
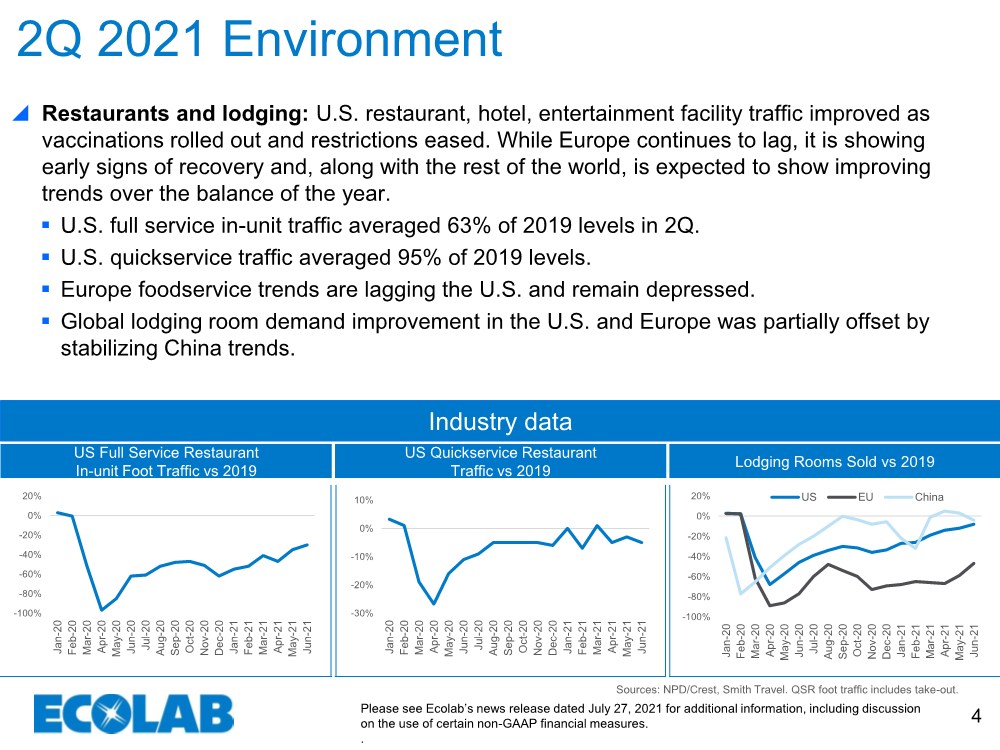
| Please see Ecolab’s news release dated July 27, 2021 for additional information, including discussion on the use of certain non-GAAP financial measures. . -100% -80% -60% -40% -20% 0% 20% Jan-20 Feb-20 Mar-20 Apr-20 May-20 Jun-20 Jul-20 Aug-20 Sep-20 Oct-20 Nov-20 Dec-20 Jan-21 Feb-21 Mar-21 Apr-21 May-21 Jun-21 US EU China 4 Restaurants and lodging: U.S. restaurant, hotel, entertainment facility traffic improved as vaccinations rolled out and restrictions eased. While Europe continues to lag, it is showing early signs of recovery and, along with the rest of the world, is expected to show improving trends over the balance of the year. ▪ U.S. full service in-unit traffic averaged 63% of 2019 levels in 2Q. ▪ U.S. quickservice traffic averaged 95% of 2019 levels. ▪ Europe foodservice trends are lagging the U.S. and remain depressed. ▪ Global lodging room demand improvement in the U.S. and Europe was partially offset by stabilizing China trends. 2Q 2021 Environment Sources: NPD/Crest, Smith Travel. QSR foot traffic includes take-out. US Full Service Restaurant In-unit Foot Traffic vs 2019 Industry data US Quickservice Restaurant Traffic vs 2019 Lodging Rooms Sold vs 2019 -30% -20% -10% 0% 10% Jan-20 Feb-20 Mar-20 Apr-20 May-20 Jun-20 Jul-20 Aug-20 Sep-20 Oct-20 Nov-20 Dec-20 Jan-21 Feb-21 Mar-21 Apr-21 May-21 Jun-21 -100% -80% -60% -40% -20% 0% 20% Jan-20 Feb-20 Mar-20 Apr-20 May-20 Jun-20 Jul-20 Aug-20 Sep-20 Oct-20 Nov-20 Dec-20 Jan-21 Feb-21 Mar-21 Apr-21 May-21 Jun-21 |
| Please see Ecolab’s news release dated July 27, 2021 for additional information, including discussion on the use of certain non-GAAP financial measures. . 5 2021 Outlook We expect the U.S. recovery to continue, Europe to reopen as forecasted, the rest of the world to follow soon after, and a continued higher cost environment. We have implemented strong pricing actions in 2021 that remain ahead of input costs, and pricing will provide further coverage as it builds through the second half. Our new business and innovation pipelines are at record levels; new focus areas, including life sciences, data centers and animal health, are well-positioned to drive growth and global leadership; and our leading digital capabilities are continuing to broaden, develop and add competitive advantages. We expect continued strong year-on-year performance in the second half of 2021, with attractive sequential earnings improvement in the third quarter and more significant comparative gains in the fourth quarter as pricing actions have an increasing benefit. We continue to look for full year 2021 diluted earnings per share to exceed 2019 diluted earnings per share from continuing operations, excluding the $0.15 per share impact from the Texas freeze. Our strong business momentum, along with our leading world-class solutions that help customers solve their operating problems and achieve their ESG ambitions, provide us with the confidence that Ecolab will continue delivering strong, consistent growth for many years to come. |
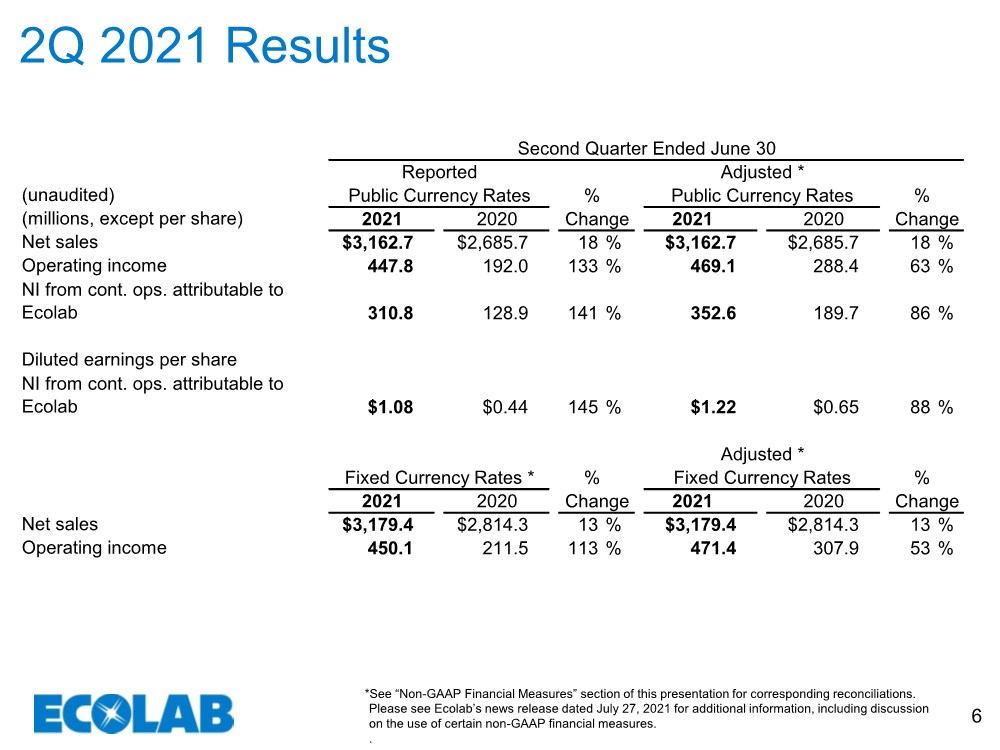
| Please see Ecolab’s news release dated July 27, 2021 for additional information, including discussion on the use of certain non-GAAP financial measures. . 6 2Q 2021 Results *See “Non-GAAP Financial Measures” section of this presentation for corresponding reconciliations. (unaudited) (millions, except per share) 2021 Net sales $3,162.7 $2,685.7 18 % $3,162.7 $2,685.7 18 % Operating income 447.8 192.0 133 % 469.1 288.4 63 % NI from cont. ops. attributable to Ecolab 310.8 128.9 141 % 352.6 189.7 86 % Diluted earnings per share NI from cont. ops. attributable to Ecolab $1.08 $0.44 145 % $1.22 $0.65 88 % 2021 Net sales $3,179.4 $2,814.3 13 % $3,179.4 $2,814.3 13 % Operating income 450.1 211.5 113 % 471.4 307.9 53 % Adjusted * Second Quarter Ended June 30 Reported Adjusted * Public Currency Rates % Public Currency Rates % 2021 2020 Change 2020 Change Fixed Currency Rates * % Fixed Currency Rates % 2021 2020 Change 2020 Change |
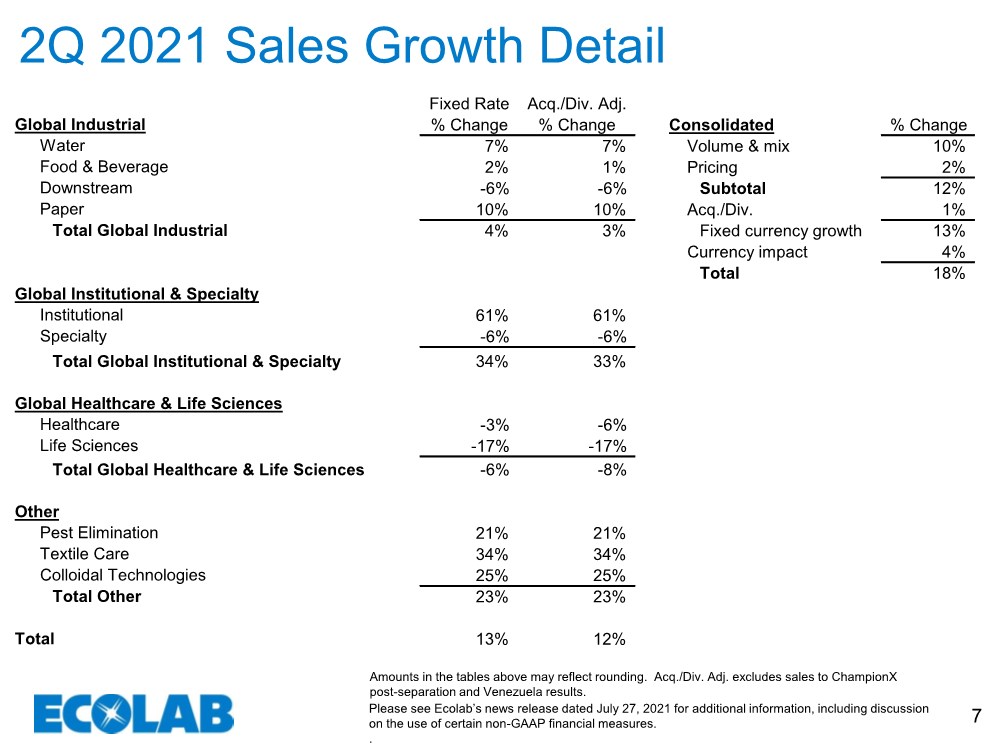
| Please see Ecolab’s news release dated July 27, 2021 for additional information, including discussion on the use of certain non-GAAP financial measures. . 7 2Q 2021 Sales Growth Detail Amounts in the tables above may reflect rounding. Acq./Div. Adj. excludes sales to ChampionX post-separation and Venezuela results. Fixed Rate Acq./Div. Adj. Global Industrial % Change % Change Consolidated % Change Water 7% 7% Volume & mix 10% Food & Beverage 2% 1% Pricing 2% Downstream -6% -6% Subtotal 12% Paper 10% 10% Acq./Div. 1% Total Global Industrial 4% 3% Fixed currency growth 13% Currency impact 4% Total 18% Global Institutional & Specialty Institutional 61% 61% Specialty -6% -6% Total Global Institutional & Specialty 34% 33% Global Healthcare & Life Sciences Healthcare -3% -6% Life Sciences -17% -17% Total Global Healthcare & Life Sciences -6% -8% Other Pest Elimination 21% 21% Textile Care 34% 34% Colloidal Technologies 25% 25% Total Other 23% 23% Total 13% 12% |
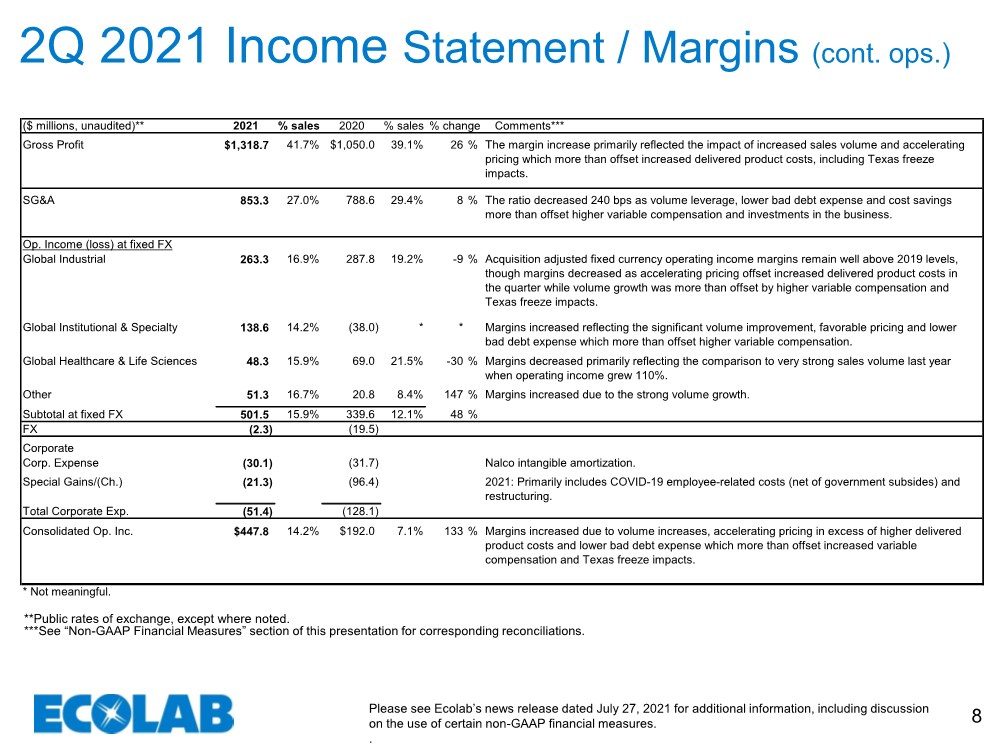
| Please see Ecolab’s news release dated July 27, 2021 for additional information, including discussion on the use of certain non-GAAP financial measures. . 8 2Q 2021 Income Statement / Margins (cont. ops.) **Public rates of exchange, except where noted. ***See “Non-GAAP Financial Measures” section of this presentation for corresponding reconciliations. ($ millions, unaudited)** 2021 % sales 2020 % sales Comments*** Gross Profit $1,318.7 41.7% $1,050.0 39.1% 26 % The margin increase primarily reflected the impact of increased sales volume and accelerating pricing which more than offset increased delivered product costs, including Texas freeze impacts. SG&A 853.3 27.0% 788.6 29.4% 8 % The ratio decreased 240 bps as volume leverage, lower bad debt expense and cost savings more than offset higher variable compensation and investments in the business. Op. Income (loss) at fixed FX Global Industrial 263.3 16.9% 287.8 19.2% -9 % Acquisition adjusted fixed currency operating income margins remain well above 2019 levels, though margins decreased as accelerating pricing offset increased delivered product costs in the quarter while volume growth was more than offset by higher variable compensation and Texas freeze impacts. Global Institutional & Specialty 138.6 14.2% (38.0) ** Margins increased reflecting the significant volume improvement, favorable pricing and lower bad debt expense which more than offset higher variable compensation. Global Healthcare & Life Sciences 48.3 15.9% 69.0 21.5% -30 % Margins decreased primarily reflecting the comparison to very strong sales volume last year when operating income grew 110%. Other 51.3 16.7% 20.8 8.4% 147 % Margins increased due to the strong volume growth. Subtotal at fixed FX 501.5 15.9% 339.6 12.1% 48 % FX (2.3) (19.5) Corporate Corp. Expense (30.1) (31.7) Nalco intangible amortization. Special Gains/(Ch.) (21.3) (96.4) 2021: Primarily includes COVID-19 employee-related costs (net of government subsides) and restructuring. Total Corporate Exp. (51.4) (128.1) Consolidated Op. Inc. $447.8 14.2% $192.0 7.1% 133 % Margins increased due to volume increases, accelerating pricing in excess of higher delivered product costs and lower bad debt expense which more than offset increased variable compensation and Texas freeze impacts. * Not meaningful. % change |
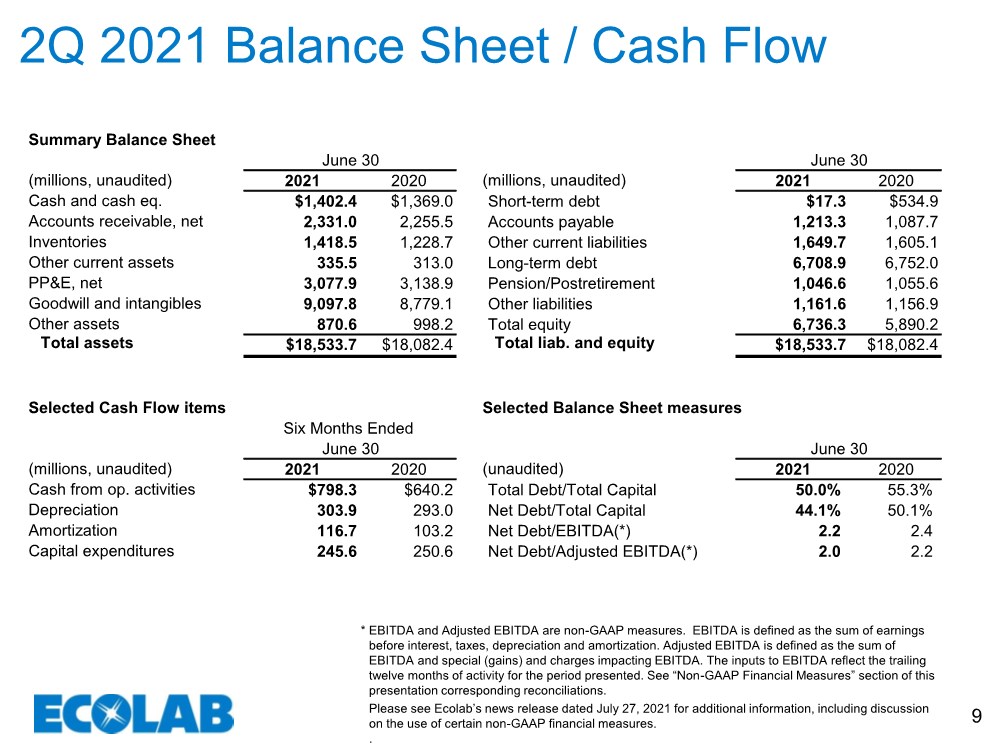
| Please see Ecolab’s news release dated July 27, 2021 for additional information, including discussion on the use of certain non-GAAP financial measures. . 9 2Q 2021 Balance Sheet / Cash Flow EBITDA and Adjusted EBITDA are non-GAAP measures. EBITDA is defined as the sum of earnings before interest, taxes, depreciation and amortization. Adjusted EBITDA is defined as the sum of EBITDA and special (gains) and charges impacting EBITDA. The inputs to EBITDA reflect the trailing twelve months of activity for the period presented. See “Non-GAAP Financial Measures” section of this presentation corresponding reconciliations. * Summary Balance Sheet (millions, unaudited) 2021 2020 (millions, unaudited) 2021 2020 Cash and cash eq. $1,402.4 $1,369.0 Short-term debt $17.3 $534.9 Accounts receivable, net 2,331.0 2,255.5 Accounts payable 1,213.3 1,087.7 Inventories 1,418.5 1,228.7 Other current liabilities 1,649.7 1,605.1 Other current assets 335.5 313.0 Long-term debt 6,708.9 6,752.0 PP&E, net 3,077.9 3,138.9 Pension/Postretirement 1,046.6 1,055.6 Goodwill and intangibles 9,097.8 8,779.1 Other liabilities 1,161.6 1,156.9 Other assets 870.6 998.2 Total equity 6,736.3 5,890.2 Total assets $18,533.7 $18,082.4 Total liab. and equity $18,533.7 $18,082.4 Selected Cash Flow items (millions, unaudited) 2021 2020 (unaudited) 2021 2020 Cash from op. activities $798.3 $640.2 Total Debt/Total Capital 50.0% 55.3% Depreciation 303.9 293.0 Net Debt/Total Capital 44.1% 50.1% Amortization 116.7 103.2 Net Debt/EBITDA(*) 2.2 2.4 Capital expenditures 245.6 250.6 Net Debt/Adjusted EBITDA(*) 2.0 2.2 June 30 June 30 Six Months Ended Selected Balance Sheet measures June 30 June 30 |
| Please see Ecolab’s news release dated July 27, 2021 for additional information, including discussion on the use of certain non-GAAP financial measures. . 10 Appendix |
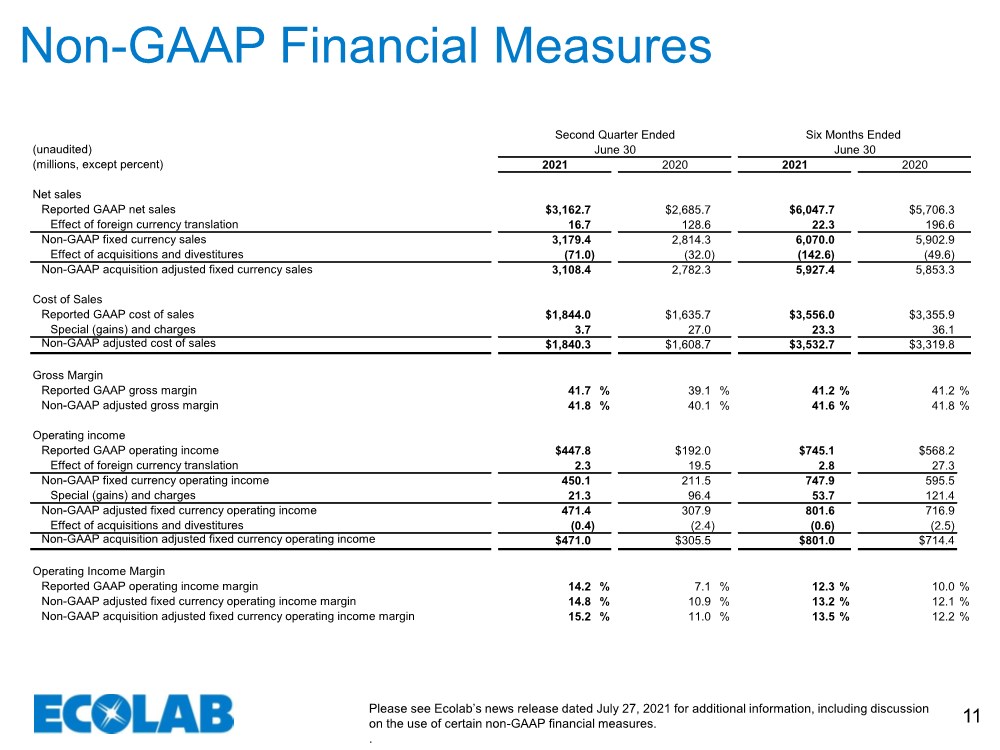
| Please see Ecolab’s news release dated July 27, 2021 for additional information, including discussion on the use of certain non-GAAP financial measures. . 11 Non-GAAP Financial Measures (unaudited) (millions, except percent) Net sales Reported GAAP net sales $3,162.7 $2,685.7 $6,047.7 $5,706.3 Effect of foreign currency translation 16.7 128.6 22.3 196.6 Non-GAAP fixed currency sales 3,179.4 2,814.3 6,070.0 5,902.9 Effect of acquisitions and divestitures (71.0) (32.0) (142.6) (49.6) Non-GAAP acquisition adjusted fixed currency sales 3,108.4 2,782.3 5,927.4 5,853.3 Cost of Sales Reported GAAP cost of sales $1,844.0 $1,635.7 $3,556.0 $3,355.9 Special (gains) and charges 3.7 27.0 23.3 36.1 Non-GAAP adjusted cost of sales $1,840.3 $1,608.7 $3,532.7 $3,319.8 Gross Margin Reported GAAP gross margin 41.7 % 39.1 % 41.2 % 41.2 % Non-GAAP adjusted gross margin 41.8 % 40.1 % 41.6 % 41.8 % Operating income Reported GAAP operating income $447.8 $192.0 $745.1 $568.2 Effect of foreign currency translation 2.3 19.5 2.8 27.3 Non-GAAP fixed currency operating income 450.1 211.5 747.9 595.5 Special (gains) and charges 21.3 96.4 53.7 121.4 Non-GAAP adjusted fixed currency operating income 471.4 307.9 801.6 716.9 Effect of acquisitions and divestitures (0.4) (2.4) (0.6) (2.5) Non-GAAP acquisition adjusted fixed currency operating income $471.0 $305.5 $801.0 $714.4 Operating Income Margin Reported GAAP operating income margin 14.2 % 7.1 % 12.3 % 10.0 % Non-GAAP adjusted fixed currency operating income margin 14.8 % 10.9 % 13.2 % 12.1 % Non-GAAP acquisition adjusted fixed currency operating income margin 15.2 % 11.0 % 13.5 % 12.2 % Second Quarter Ended June 30 Six Months Ended June 30 2021 2020 2021 2020 |
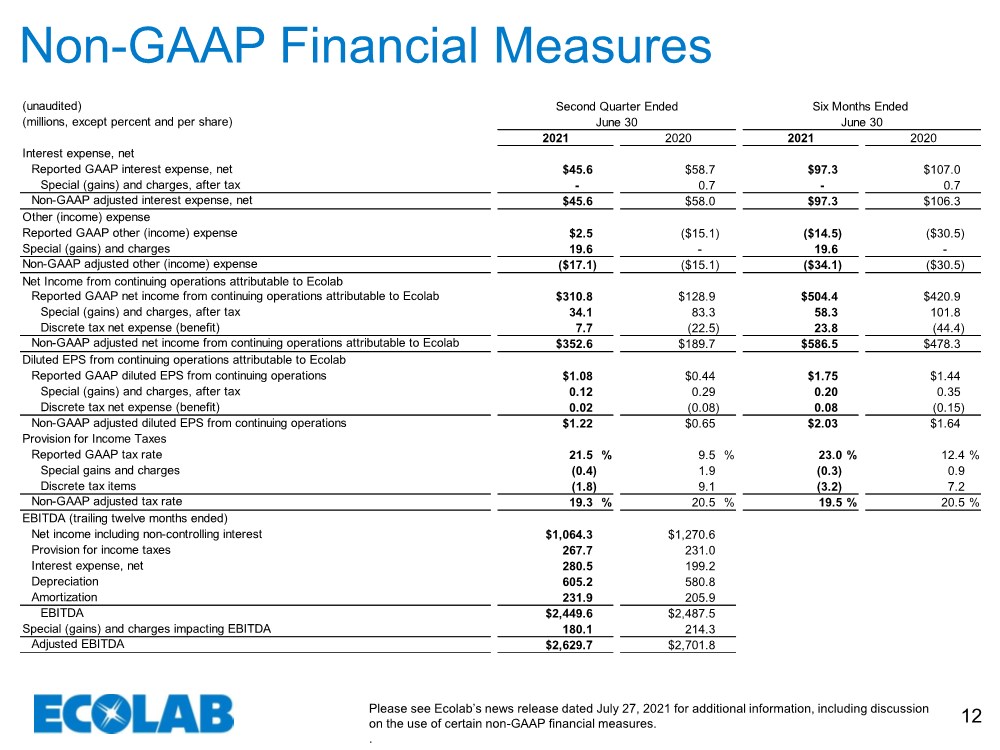
| Please see Ecolab’s news release dated July 27, 2021 for additional information, including discussion on the use of certain non-GAAP financial measures. . 12 Non-GAAP Financial Measures (unaudited) (millions, except percent and per share) Interest expense, net Reported GAAP interest expense, net $45.6 $58.7 $97.3 $107.0 Special (gains) and charges, after tax - 0.7 - 0.7 Non-GAAP adjusted interest expense, net $45.6 $58.0 $97.3 $106.3 Other (income) expense Reported GAAP other (income) expense $2.5 ($15.1) ($14.5) ($30.5) Special (gains) and charges 19.6 - 19.6 - Non-GAAP adjusted other (income) expense ($17.1) ($15.1) ($34.1) ($30.5) Net Income from continuing operations attributable to Ecolab Reported GAAP net income from continuing operations attributable to Ecolab $310.8 $128.9 $504.4 $420.9 Special (gains) and charges, after tax 34.1 83.3 58.3 101.8 Discrete tax net expense (benefit) 7.7 (22.5) 23.8 (44.4) Non-GAAP adjusted net income from continuing operations attributable to Ecolab $352.6 $189.7 $586.5 $478.3 Diluted EPS from continuing operations attributable to Ecolab Reported GAAP diluted EPS from continuing operations $1.08 $0.44 $1.75 $1.44 Special (gains) and charges, after tax 0.12 0.29 0.20 0.35 Discrete tax net expense (benefit) 0.02 (0.08) 0.08 (0.15) Non-GAAP adjusted diluted EPS from continuing operations $1.22 $0.65 $2.03 $1.64 Provision for Income Taxes Reported GAAP tax rate 21.5 % 9.5 % 23.0 % 12.4 % Special gains and charges (0.4) 1.9 (0.3) 0.9 Discrete tax items (1.8) 9.1 (3.2) 7.2 Non-GAAP adjusted tax rate 19.3 % 20.5 % 19.5 % 20.5 % EBITDA (trailing twelve months ended) Net income including non-controlling interest $1,064.3 $1,270.6 Provision for income taxes 267.7 231.0 Interest expense, net 280.5 199.2 Depreciation 605.2 580.8 Amortization 231.9 205.9 EBITDA $2,449.6 $2,487.5 Special (gains) and charges impacting EBITDA 180.1 214.3 Adjusted EBITDA $2,629.7 $2,701.8 2021 2020 2021 2020 June 30 June 30 Second Quarter Ended Six Months Ended |
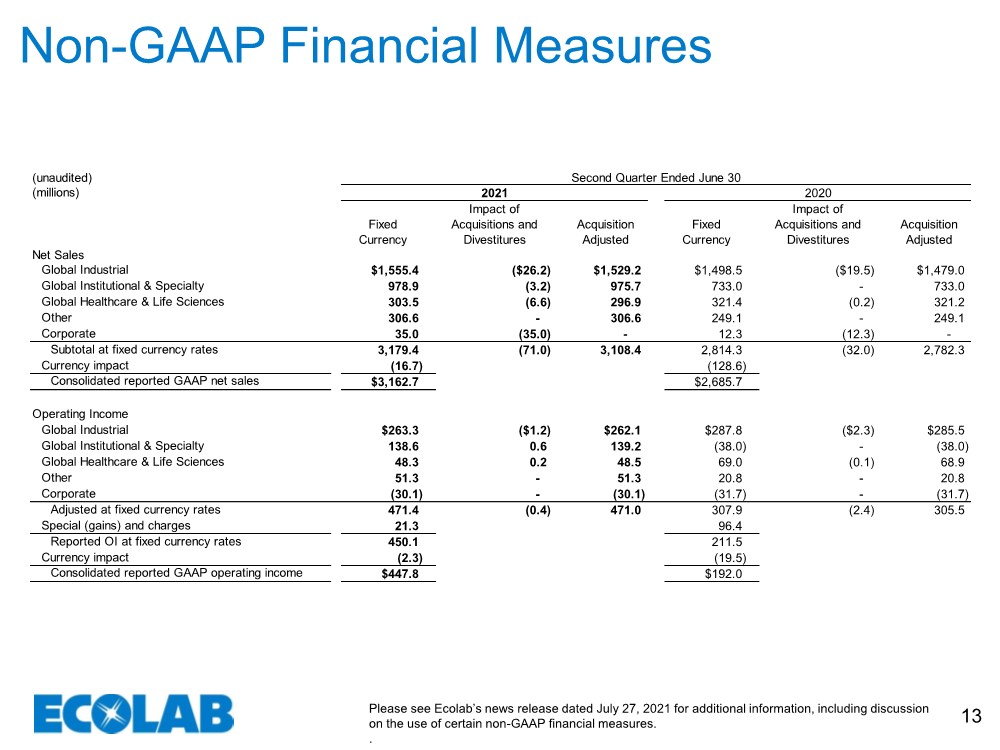
| Please see Ecolab’s news release dated July 27, 2021 for additional information, including discussion on the use of certain non-GAAP financial measures. . 13 Non-GAAP Financial Measures (unaudited) (millions) Fixed Currency Impact of Acquisitions and Divestitures Acquisition Adjusted Fixed Currency Impact of Acquisitions and Divestitures Acquisition Adjusted Net Sales Global Industrial $1,555.4 ($26.2) $1,529.2 $1,498.5 ($19.5) $1,479.0 Global Institutional & Specialty 978.9 (3.2) 975.7 733.0 - 733.0 Global Healthcare & Life Sciences 303.5 (6.6) 296.9 321.4 (0.2) 321.2 Other 306.6 - 306.6 249.1 - 249.1 Corporate 35.0 (35.0) - 12.3 (12.3) - Subtotal at fixed currency rates 3,179.4 (71.0) 3,108.4 2,814.3 (32.0) 2,782.3 Currency impact (16.7) (128.6) Consolidated reported GAAP net sales $3,162.7 $2,685.7 Operating Income Global Industrial $263.3 ($1.2) $262.1 $287.8 ($2.3) $285.5 Global Institutional & Specialty 138.6 0.6 139.2 (38.0) - (38.0) Global Healthcare & Life Sciences 48.3 0.2 48.5 69.0 (0.1) 68.9 Other 51.3 - 51.3 20.8 - 20.8 Corporate (30.1) - (30.1) (31.7) - (31.7) Adjusted at fixed currency rates 471.4 (0.4) 471.0 307.9 (2.4) 305.5 Special (gains) and charges 21.3 96.4 Reported OI at fixed currency rates 450.1 211.5 Currency impact (2.3) (19.5) Consolidated reported GAAP operating income $447.8 $192.0 Second Quarter Ended June 30 2021 2020 |
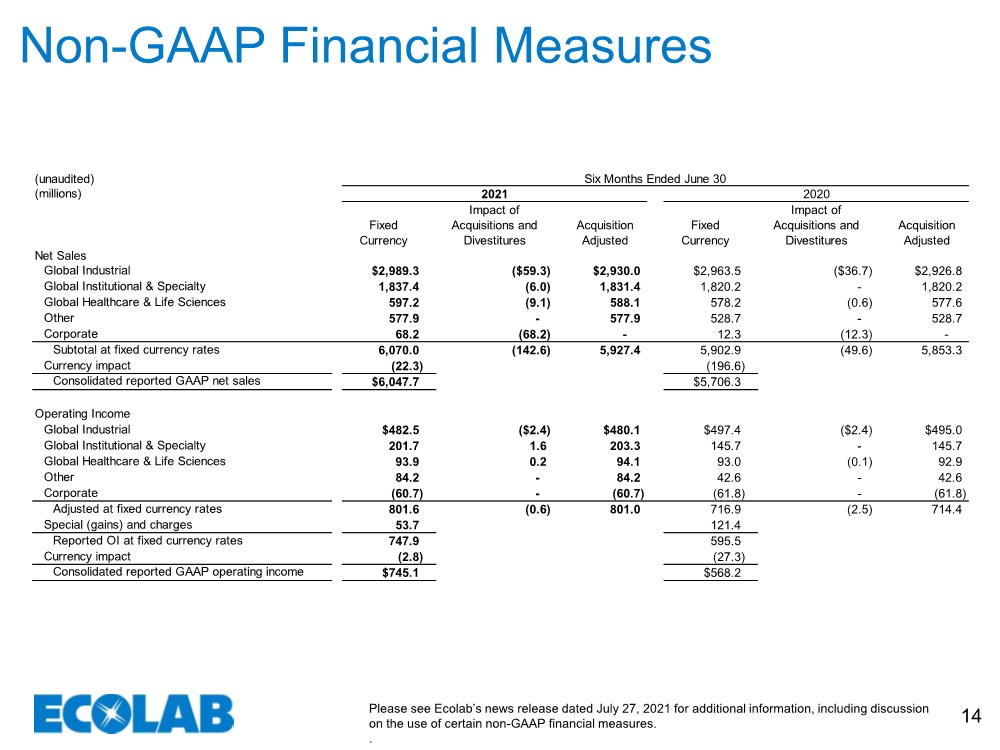
| Please see Ecolab’s news release dated July 27, 2021 for additional information, including discussion on the use of certain non-GAAP financial measures. . 14 Non-GAAP Financial Measures (unaudited) (millions) Fixed Currency Impact of Acquisitions and Divestitures Acquisition Adjusted Fixed Currency Impact of Acquisitions and Divestitures Acquisition Adjusted Net Sales Global Industrial $2,989.3 ($59.3) $2,930.0 $2,963.5 ($36.7) $2,926.8 Global Institutional & Specialty 1,837.4 (6.0) 1,831.4 1,820.2 - 1,820.2 Global Healthcare & Life Sciences 597.2 (9.1) 588.1 578.2 (0.6) 577.6 Other 577.9 - 577.9 528.7 - 528.7 Corporate 68.2 (68.2) - 12.3 (12.3) - Subtotal at fixed currency rates 6,070.0 (142.6) 5,927.4 5,902.9 (49.6) 5,853.3 Currency impact (22.3) (196.6) Consolidated reported GAAP net sales $6,047.7 $5,706.3 Operating Income Global Industrial $482.5 ($2.4) $480.1 $497.4 ($2.4) $495.0 Global Institutional & Specialty 201.7 1.6 203.3 145.7 - 145.7 Global Healthcare & Life Sciences 93.9 0.2 94.1 93.0 (0.1) 92.9 Other 84.2 - 84.2 42.6 - 42.6 Corporate (60.7) - (60.7) (61.8) - (61.8) Adjusted at fixed currency rates 801.6 (0.6) 801.0 716.9 (2.5) 714.4 Special (gains) and charges 53.7 121.4 Reported OI at fixed currency rates 747.9 595.5 Currency impact (2.8) (27.3) Consolidated reported GAAP operating income $745.1 $568.2 Six Months Ended June 30 2021 2020 |