Attached files
| file | filename |
|---|---|
| EX-99.1 - PRESS RELEASE - Midland States Bancorp, Inc. | exh_991.htm |
| 8-K - FORM 8-K - Midland States Bancorp, Inc. | f8k_072221.htm |
Exhibit 99.2

1 Midland States Bancorp, Inc. NASDAQ: MSBI Second Quarter 2021 Earnings Call
2 Forward - Looking Statements. This presentation may contain forward - looking statements within the meaning of the federal securities laws. Forward - looking statements expressing management’s current expectations, forecasts of future events or long - te rm goals may be based upon beliefs, expectations and assumptions of Midland’s management, and are generally identifiable by the use of words such as “believe,” “expect,” “anticipate,” “plan,” “intend,” “estimate,” “may,” “will,” “would,” “could,” “should” o r o ther similar expressions. All statements in this presentation speak only as of the date they are made, and Midland undertakes no obligation to update any statement. A number of factors, many of which are beyond the ability of Midland to control or predic t, could cause actual results to differ materially from those in its forward - looking statements including the effects of the Corona virus Disease 2019 (“COVID - 19”) pandemic, including its potential effects on the economic environment, our customers and our operations, as well as any changes to federal, state or local government laws, regulations or orders in connection with the pandemic. These risks and uncertainties should be considered in evaluating forward - looking statements, and undue reliance shoul d not be placed on such statements. Additional information concerning Midland and its businesses, including additional factors tha t could materially affect Midland’s financial results, are included in Midland’s filings with the Securities and Exchange Commi ssi on. Use of Non - GAAP Financial Measures. This presentation may contain certain financial information determined by methods other than in accordance with accounting principles generally accepted in the United States (“GAAP”). These non - GAAP financial measure s include “Adjusted Earnings,” “Adjusted Pre - Tax, Pre - Provision Income,” “Adjusted Diluted Earnings Per Share,” “Adjusted Return o n Average Assets,” “Adjusted Return on Average Shareholders’ Equity,” “Adjusted Return on Average Tangible Common Equity,” “Adjusted Pre - Tax, Provision Return on Average Assets,” “Efficiency Ratio,” “Tangible Common Equity to Tangible Assets,” “Tangib le Book Value Per Share,” and “Return on Average Tangible Common Equity.” The Company believes that these non - GAAP financial measures provide both management and investors a more complete understanding of the Company’s funding profile and profitability. These non - GAAP financial measures are supplemental and are not a substitute for any analysis based on GAAP financ ial measures. Not all companies use the same calculation of these measures; therefore this presentation may not be comparable to other similarly titled measures as presented by other companies. Reconciliations of these non - GAAP measures are provided in the Appendix section of this presentation.
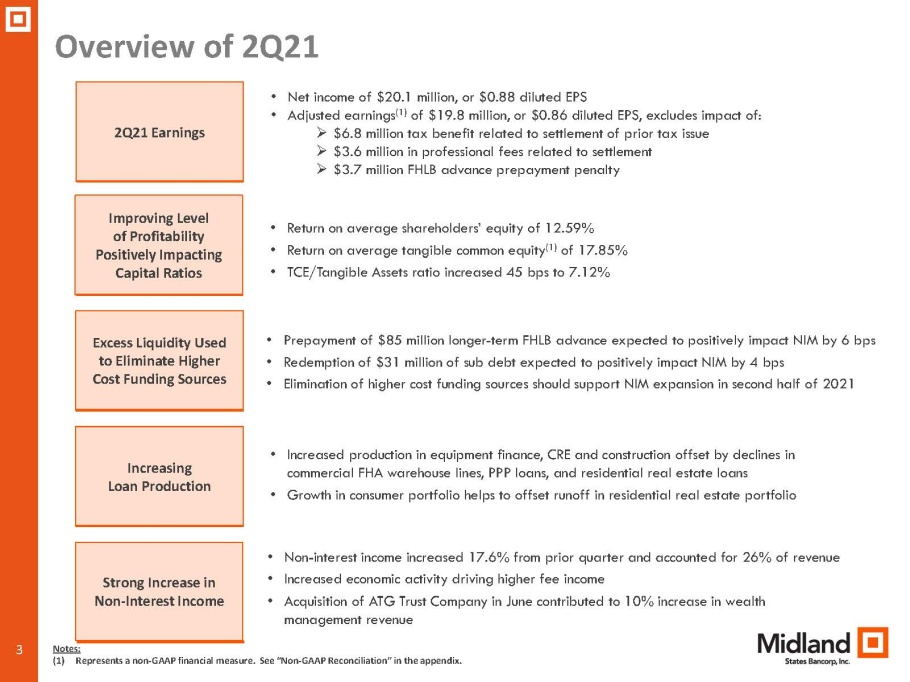
3 Overview of 2Q21 3 Increasing Loan Production 2Q21 Earnings Strong Increase in Non - Interest Income • Increased production in equipment finance, CRE and construction offset by declines in commercial FHA warehouse lines, PPP loans, and residential real estate loans • Growth in consumer portfolio helps to offset runoff in residential real estate portfolio • Non - interest income increased 17.6% from prior quarter and accounted for 26% of revenue • Increased economic activity driving higher fee income • Acquisition of ATG Trust Company in June contributed to 10% increase in wealth management revenue Excess Liquidity Used to Eliminate Higher Cost Funding Sources • Prepayment of $85 million longer - term FHLB advance expected to positively impact NIM by 6 bps • Redemption of $31 million of sub debt expected to positively impact NIM by 4 bps • Elimination of higher cost funding sources should support NIM expansion in second half of 2021 • Net income of $20.1 million, or $0.88 diluted EPS • Adjusted earnings (1) of $19.8 million, or $0.86 diluted EPS, excludes impact of: » $6.8 million tax benefit related to settlement of prior tax issue » $3.6 million in professional fees related to settlement » $3.7 million FHLB advance prepayment penalty Notes: (1) Represents a non - GAAP financial measure. See “Non - GAAP Reconciliation” in the appendix. Improving Level of Profitability Positively Impacting Capital Ratios • Return on average shareholders’ equity of 12.59% • Return on average tangible common equity (1) of 17.85% • TCE/Tangible Assets ratio increased 45 bps to 7.12%
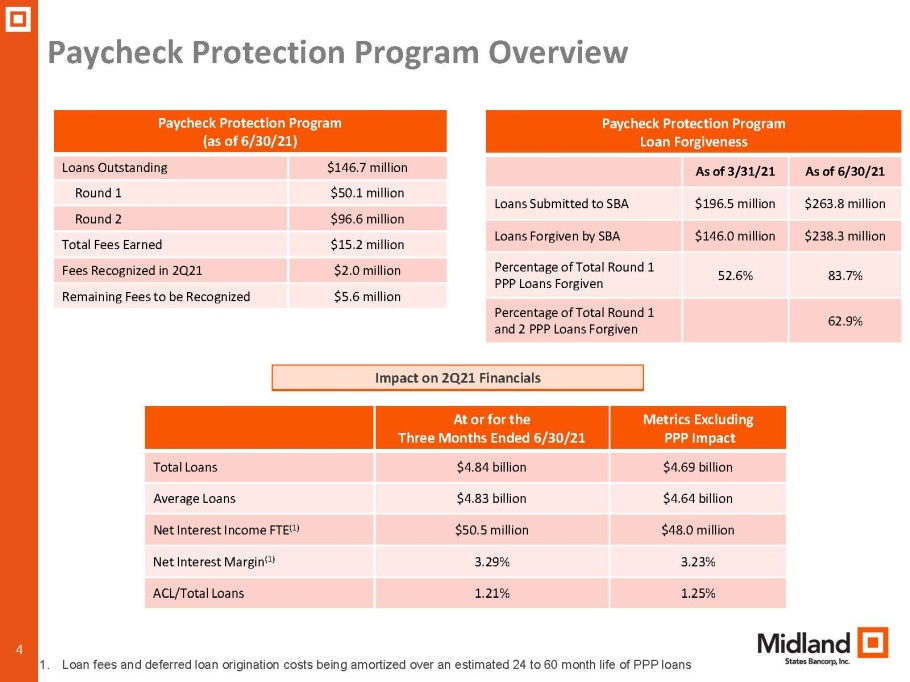
4 Paycheck Protection Program Overview Paycheck Protection Program (as of 6/30/21) Loans Outstanding $146.7 million Round 1 $50.1 million Round 2 $96.6 million Total Fees Earned $15.2 million Fees Recognized in 2Q21 $2.0 million Remaining Fees to be Recognized $5.6 million Impact on 2Q21 Financials At or for the Three Months Ended 6/30/21 Metrics Excluding PPP Impact Total Loans $4.84 billion $4.69 billion Average Loans $4.83 billion $4.64 billion Net Interest Income FTE (1) $50.5 million $48.0 million Net Interest Margin (1) 3.29% 3.23% ACL/Total Loans 1.21% 1.25% 1. Loan fees and deferred loan origination costs being amortized over an estimated 24 to 60 month life of PPP loans Paycheck Protection Program Loan Forgiveness As of 3/31/21 As of 6/30/21 Loans Submitted to SBA $196.5 million $263.8 million Loans Forgiven by SBA $146.0 million $238.3 million Percentage of Total Round 1 PPP Loans Forgiven 52.6% 83.7% Percentage of Total Round 1 and 2 PPP Loans Forgiven 62.9%
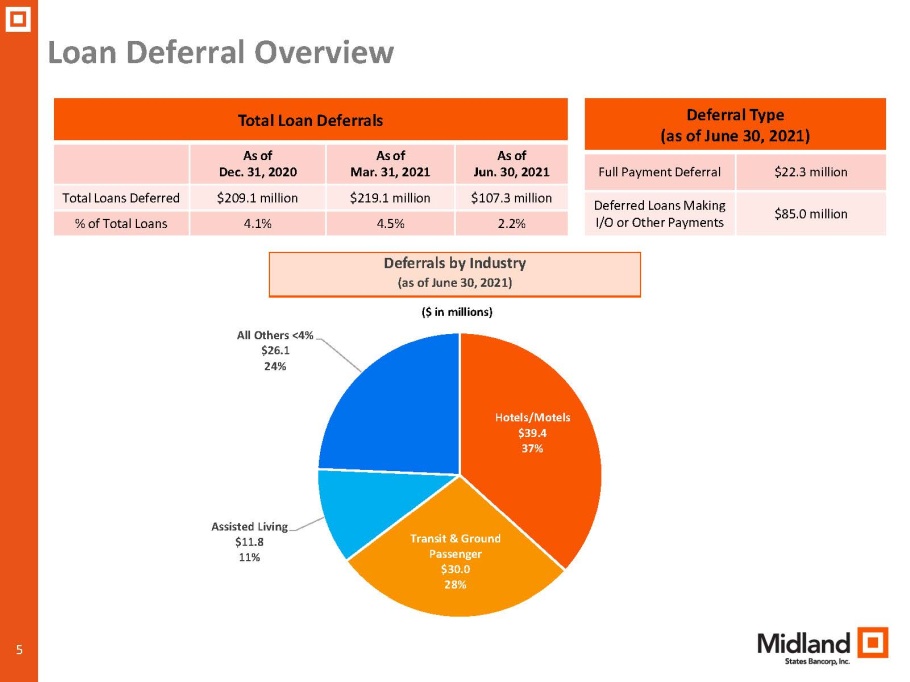
5 Loan Deferral Overview Total Loan Deferrals As of Dec. 31, 2020 As of Mar. 31, 2021 As of Jun. 30, 2021 Total Loans Deferred $209.1 million $219.1 million $107.3 million % of Total Loans 4.1% 4.5% 2.2% Deferrals by Industry (as of June 30, 2021) Hotels/Motels $39.4 37% Transit & Ground Passenger $30.0 28% Assisted Living $11.8 11% All Others <4% $26.1 24% ($ in millions) Deferral Type (as of June 30, 2021) Full Payment Deferral $22.3 million Deferred Loans Making I/O or Other Payments $85.0 million

6 2Q 2021 1Q 2021 2Q 2020 Commercial loans and leases $ 1,831 $ 1,977 $ 1,856 Commercial real estate 1,540 1,494 1,495 Construction and land development 213 192 208 Residential real estate 367 399 509 Consumer 885 849 771 Total Loans $4,836 $4,911 $4,839 Total Loans ex. Commercial FHA Lines and PPP $4,560 $4,494 $4,436 Loan Portfolio Total Loans and Average Loan Yield • Total loans decreased $74.9 million from prior quarter to $4.84 billion • Decline due to lower end of period balances on commercial FHA warehouse credit lines, lower PPP loans and continued runoff in residential real estate portfolio driven by refinancing activity • Increase in loan production resulted in higher balances of commercial real estate, construction and consumer loans • Excluding PPP loans and commercial FHA warehouse credit lines, total loans increased at an annualized rate of 6% during 2Q21 • PPP loans were $146.7 million at Jun. 30, 2021, a decrease of $64.8 million from Mar. 31, 2021 Loan Portfolio Mix (in millions, as of quarter - end) (in millions, as of quarter - end) $4,839 $4,941 $5,103 $4,911 $4,836 4.64% 4.57% 4.58% 4.50% 4.43% 2Q 2020 3Q 2020 4Q 2020 1Q 2021 2Q 2021 Total Loans Average Loan Yield
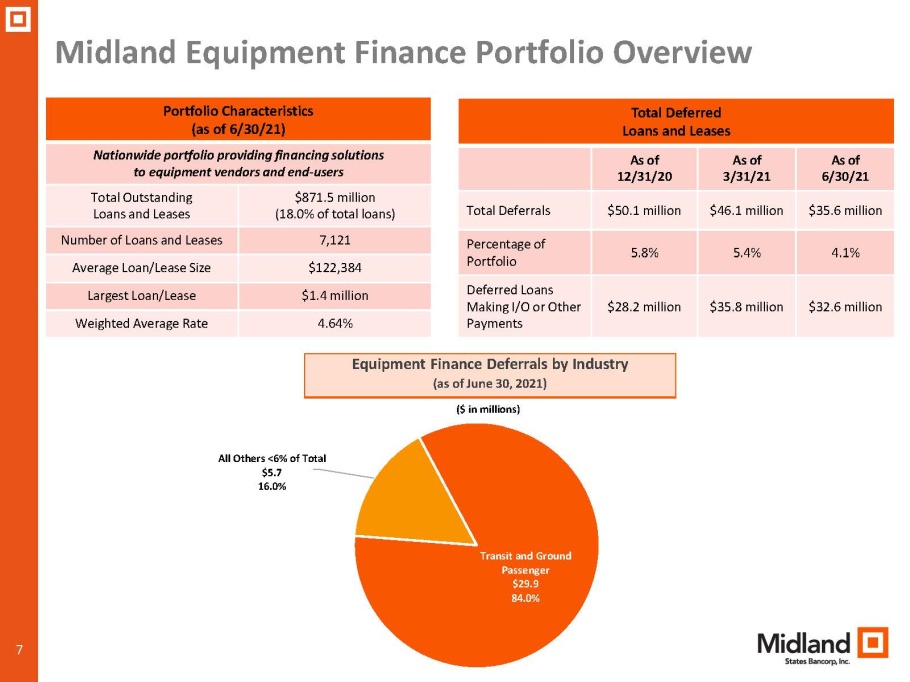
7 Midland Equipment Finance Portfolio Overview ($ in millions) Portfolio Characteristics (as of 6/30/21) Nationwide portfolio providing financing solutions to equipment vendors and end - users Total Outstanding Loans and Leases $871.5 million (18.0% of total loans) Number of Loans and Leases 7,121 Average Loan/Lease Size $122,384 Largest Loan/Lease $1.4 million Weighted Average Rate 4.64% Avg. FICO Score 604 Transit and Ground Passenger $29.9 84.0% All Others <6% of Total $5.7 16.0% Total Deferred Loans and Leases As of 12/31/20 As of 3/31/21 As of 6/30/21 Total Deferrals $50.1 million $46.1 million $35.6 million Percentage of Portfolio 5.8% 5.4% 4.1% Deferred Loans Making I/O or Other Payments $28.2 million $35.8 million $32.6 million Equipment Finance Deferrals by Industry (as of June 30, 2021)
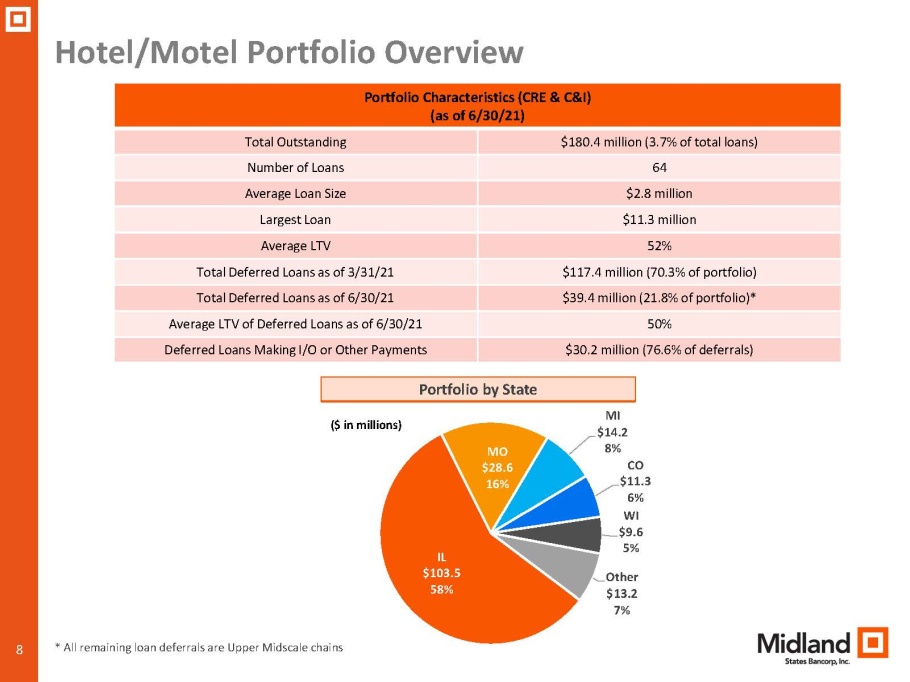
8 Hotel/Motel Portfolio Overview ($ in millions) Portfolio Characteristics (CRE & C&I) (as of 6/30/21) Total Outstanding $180.4 million (3.7% of total loans) Number of Loans 64 Average Loan Size $2.8 million Largest Loan $11.3 million Average LTV 52% Total Deferred Loans as of 3/31/21 $117.4 million (70.3% of portfolio) Total Deferred Loans as of 6/30/21 $39.4 million (21.8% of portfolio)* Average LTV of Deferred Loans as of 6/30/21 50% Deferred Loans Making I/O or Other Payments $30.2 million (76.6% of deferrals) Portfolio by State IL $103.5 58% MO $28.6 16% MI $14.2 8% CO $11.3 6% WI $9.6 5% Other $13.2 7% * All remaining loan deferrals are Upper Midscale chains
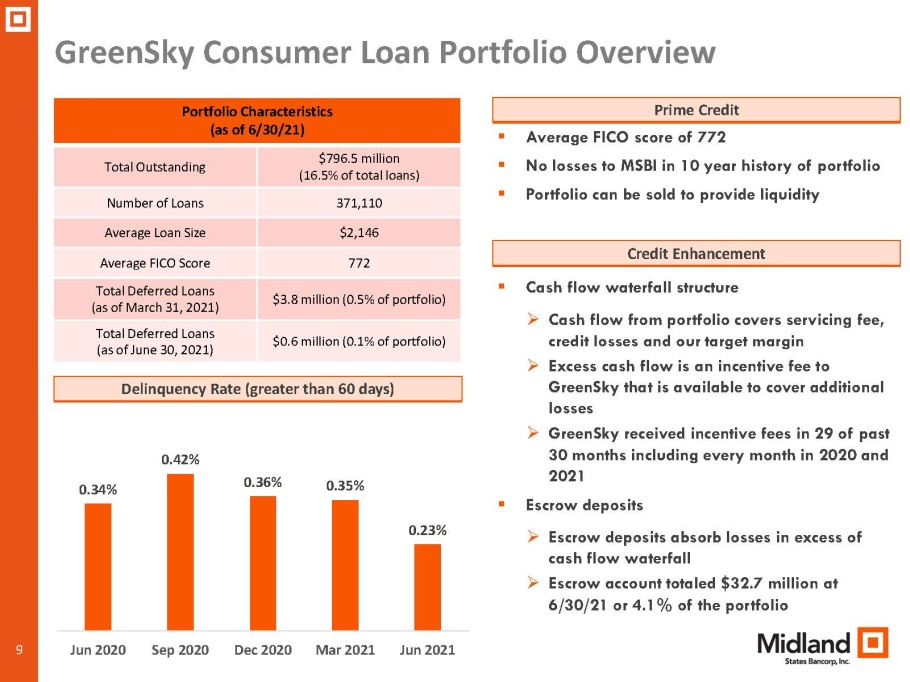
9 GreenSky Consumer Loan Portfolio Overview Delinquency Rate (greater than 60 days) Portfolio Characteristics (as of 6/30/21) Total Outstanding $796.5 million (16.5% of total loans) Number of Loans 371,110 Average Loan Size $2,146 Average FICO Score 772 Total Deferred Loans (as of March 31, 2021) $3.8 million (0.5% of portfolio) Total Deferred Loans (as of June 30, 2021) $0.6 million (0.1% of portfolio) ▪ Average FICO score of 772 ▪ No losses to MSBI in 10 year history of portfolio ▪ Portfolio can be sold to provide liquidity Prime Credit 0.34% 0.42% 0.36% 0.35% 0.23% Jun 2020 Sep 2020 Dec 2020 Mar 2021 Jun 2021 ▪ Cash flow waterfall structure » Cash flow from portfolio covers servicing fee, credit losses and our target margin » Excess cash flow is an incentive fee to GreenSky that is available to cover additional losses » GreenSky received incentive fees in 29 of past 30 months including every month in 2020 and 2021 ▪ Escrow deposits » Escrow deposits absorb losses in excess of cash flow waterfall » Escrow account totaled $32.7 million at 6/30/21 or 4.1% of the portfolio Credit Enhancement
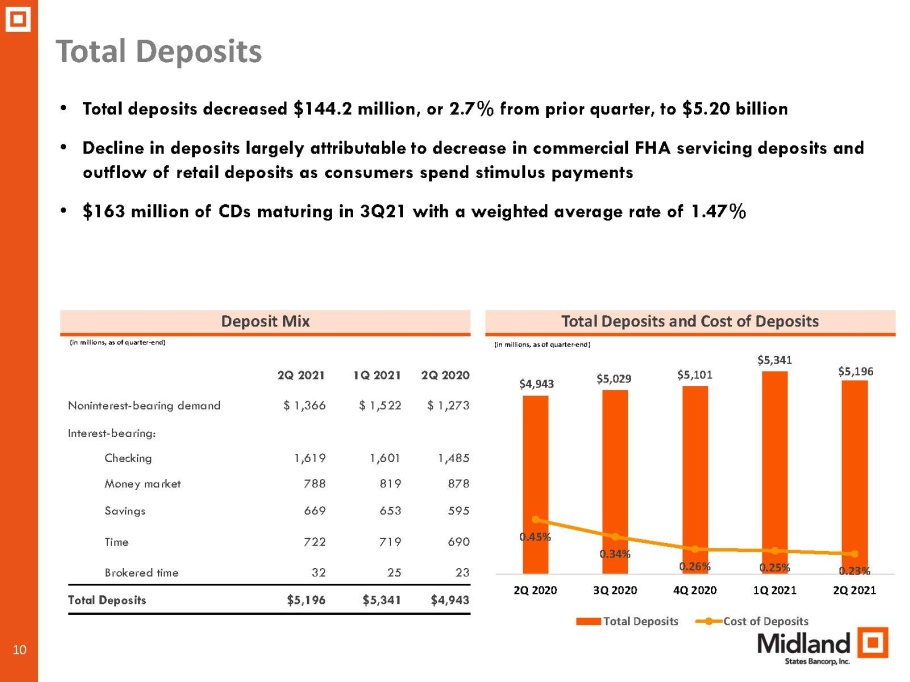
10 2Q 2021 1Q 2021 2Q 2020 Noninterest - bearing demand $ 1,366 $ 1,522 $ 1,273 Interest - bearing: Checking 1,619 1,601 1,485 Money market 788 819 878 Savings 669 653 595 Time 722 719 690 Brokered time 32 25 23 Total Deposits $5,196 $5,341 $4,943 Total Deposits Total Deposits and Cost of Deposits • Total deposits decreased $144.2 million, or 2.7% from prior quarter, to $5.20 billion • Decline in deposits largely attributable to decrease in commercial FHA servicing deposits and outflow of retail deposits as consumers spend stimulus payments • $163 million of CDs maturing in 3Q21 with a weighted average rate of 1.47% Deposit Mix (in millions, as of quarter - end) (in millions, as of quarter - end) $4,943 $5,029 $5,101 $5,341 $5,196 0.45% 0.34% 0.26% 0.25% 0.23% 2Q 2020 3Q 2020 4Q 2020 1Q 2021 2Q 2021 Total Deposits Cost of Deposits
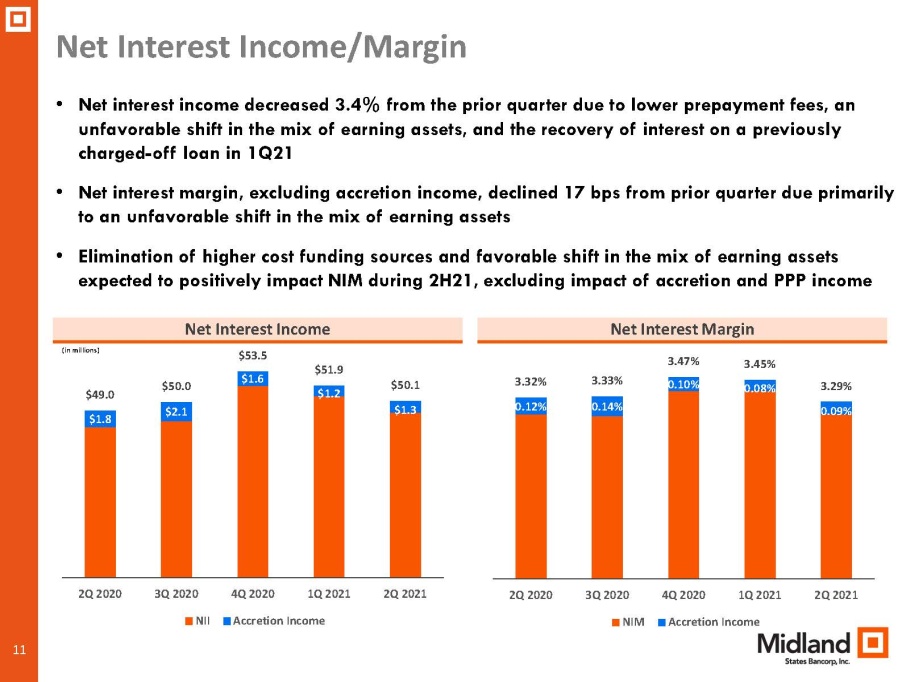
11 • Net interest income decreased 3.4% from the prior quarter due to lower prepayment fees, an unfavorable shift in the mix of earning assets, and the recovery of interest on a previously charged - off loan in 1Q21 • Net interest margin, excluding accretion income, declined 17 bps from prior quarter due primarily to an unfavorable shift in the mix of earning assets • Elimination of higher cost funding sources and favorable shift in the mix of earning assets expected to positively impact NIM during 2H21, excluding impact of accretion and PPP income Net Interest Income/Margin Net Interest Margin Net Interest Income (in millions) $1.8 $2.1 $1.6 $1.2 $1.3 $49.0 $50.0 $53.5 $51.9 $50.1 2Q 2020 3Q 2020 4Q 2020 1Q 2021 2Q 2021 NII Accretion Income 0.12% 0.14% 0.10% 0.08% 0.09% 3.32% 3.33% 3.47% 3.45% 3.29% 2Q 2020 3Q 2020 4Q 2020 1Q 2021 2Q 2021 NIM Accretion Income
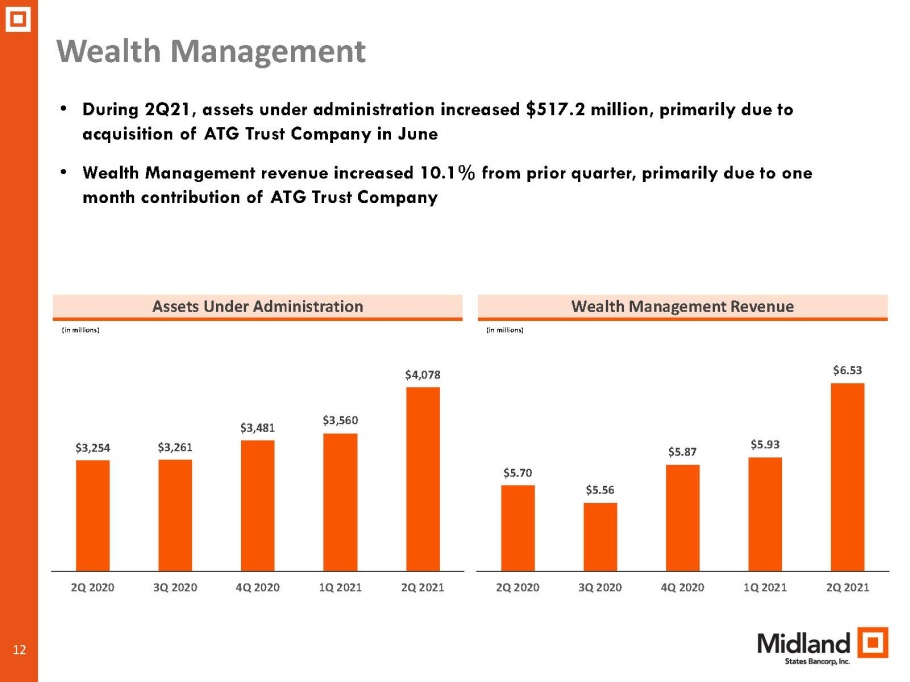
12 • During 2Q21, assets under administration increased $517.2 million, primarily due to acquisition of ATG Trust Company in June • Wealth Management revenue increased 10.1% from prior quarter, primarily due to one month contribution of ATG Trust Company Wealth Management Wealth Management Revenue Assets Under Administration (in millions) (in millions ) $3,254 $3,261 $3,481 $3,560 $4,078 2Q 2020 3Q 2020 4Q 2020 1Q 2021 2Q 2021 $5.70 $5.56 $5.87 $5.93 $6.53 2Q 2020 3Q 2020 4Q 2020 1Q 2021 2Q 2021
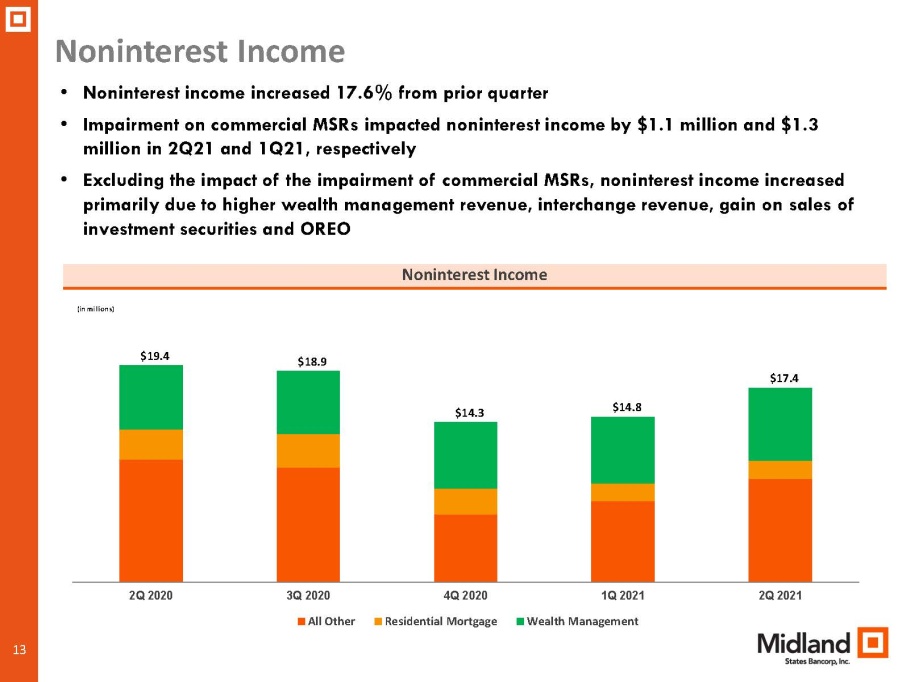
13 Noninterest Income • Noninterest income increased 17.6% from prior quarter • Impairment on commercial MSRs impacted noninterest income by $1.1 million and $1.3 million in 2Q21 and 1Q21, respectively • Excluding the impact of the impairment of commercial MSRs, noninterest income increased primarily due to higher wealth management revenue, interchange revenue, gain on sales of investment securities and OREO Noninterest Income (in millions) $19.4 $18.9 $14.3 $14.8 $17.4 2Q 2020 3Q 2020 4Q 2020 1Q 2021 2Q 2021 All Other Residential Mortgage Wealth Management
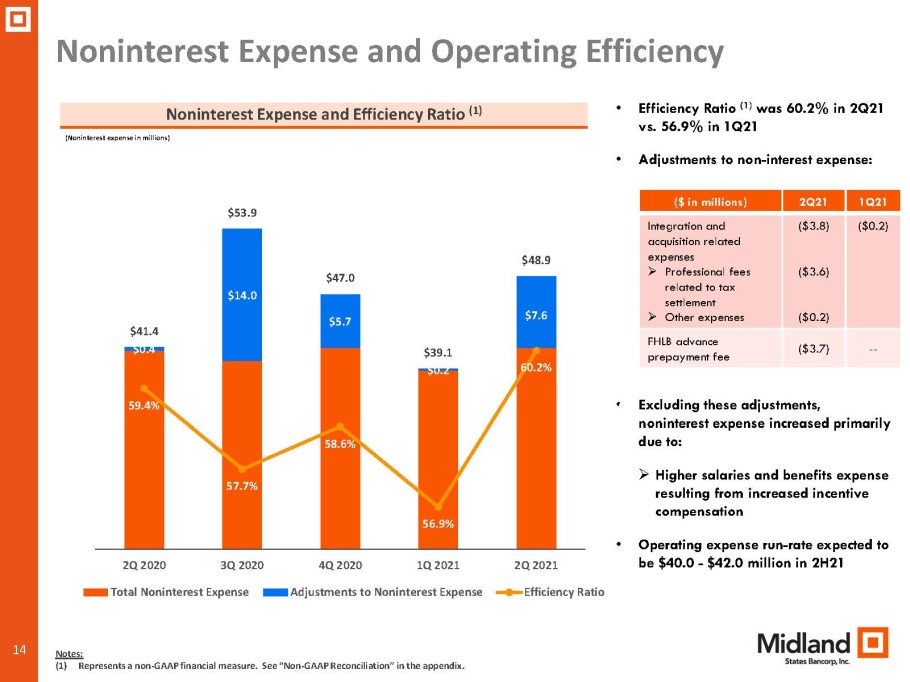
14 Noninterest Expense and Operating Efficiency • Efficiency Ratio (1) was 60.2% in 2Q21 vs. 56.9% in 1Q21 • Adjustments to non - interest expense: • Excluding these adjustments, noninterest expense increased primarily due to: » Higher salaries and benefits expense resulting from increased incentive compensation • Operating expense run - rate expected to be $40.0 - $42.0 million in 2H21 Noninterest Expense and Efficiency Ratio (1) (Noninterest expense in millions) Notes: (1) Represents a non - GAAP financial measure. See “Non - GAAP Reconciliation” in the appendix. ($ in millions) 2Q21 1Q21 Integration and acquisition related expenses » Professional fees related to tax settlement » Other expenses ($3.8) ($3.6) ($0.2) ($0.2) FHLB advance prepayment fee ($3.7) -- $0.4 $14.0 $5.7 $0.2 $7.6 $41.4 $53.9 $47.0 $39.1 $48.9 59.4% 57.7% 58.6% 56.9% 60.2% 56.0% 57.0% 58.0% 59.0% 60.0% 61.0% 62.0% 63.0% 64.0% $20.0 $25.0 $30.0 $35.0 $40.0 $45.0 $50.0 $55.0 $60.0 2Q 2020 3Q 2020 4Q 2020 1Q 2021 2Q 2021 Total Noninterest Expense Adjustments to Noninterest Expense Efficiency Ratio
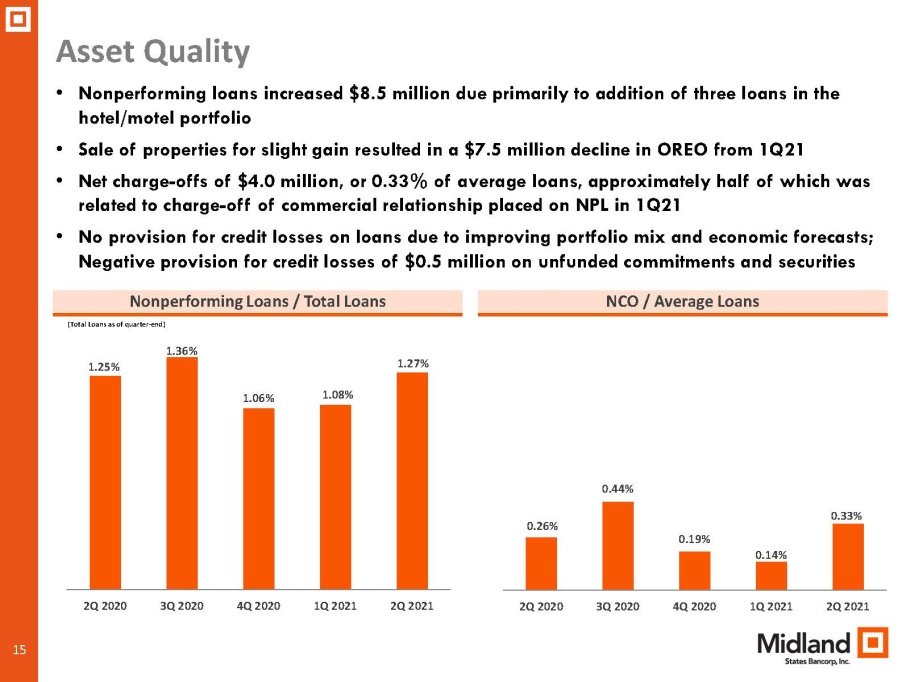
15 Asset Quality NCO / Average Loans • Nonperforming loans increased $8.5 million due primarily to addition of three loans in the hotel/motel portfolio • Sale of properties for slight gain resulted in a $7.5 million decline in OREO from 1Q21 • Net charge - offs of $4.0 million, or 0.33% of average loans, approximately half of which was related to charge - off of commercial relationship placed on NPL in 1Q21 • No provision for credit losses on loans due to improving portfolio mix and economic forecasts; Negative provision for credit losses of $0.5 million on unfunded commitments and securities Nonperforming Loans / Total Loans (Total Loans as of quarter - end) 1.25% 1.36% 1.06% 1.08% 1.27% 2Q 2020 3Q 2020 4Q 2020 1Q 2021 2Q 2021 0.26% 0.44% 0.19% 0.14% 0.33% 2Q 2020 3Q 2020 4Q 2020 1Q 2021 2Q 2021
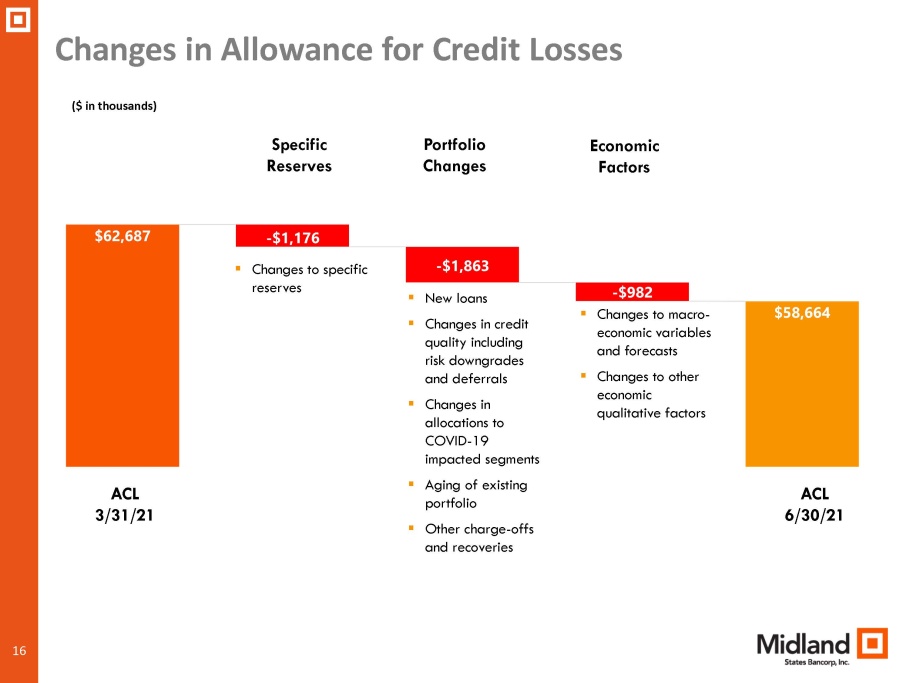
16 Changes in Allowance for Credit Losses ACL 3/31/21 ACL 6/30/21 ($ in thousands) Specific Reserves Portfolio Changes Economic Factors ▪ Changes to specific reserves ▪ New loans ▪ Changes in credit quality including risk downgrades and deferrals ▪ Changes in allocations to COVID - 19 impacted segments ▪ Aging of existing portfolio ▪ Other charge - offs and recoveries ▪ Changes to macro - economic variables and forecasts ▪ Changes to other economic qualitative factors
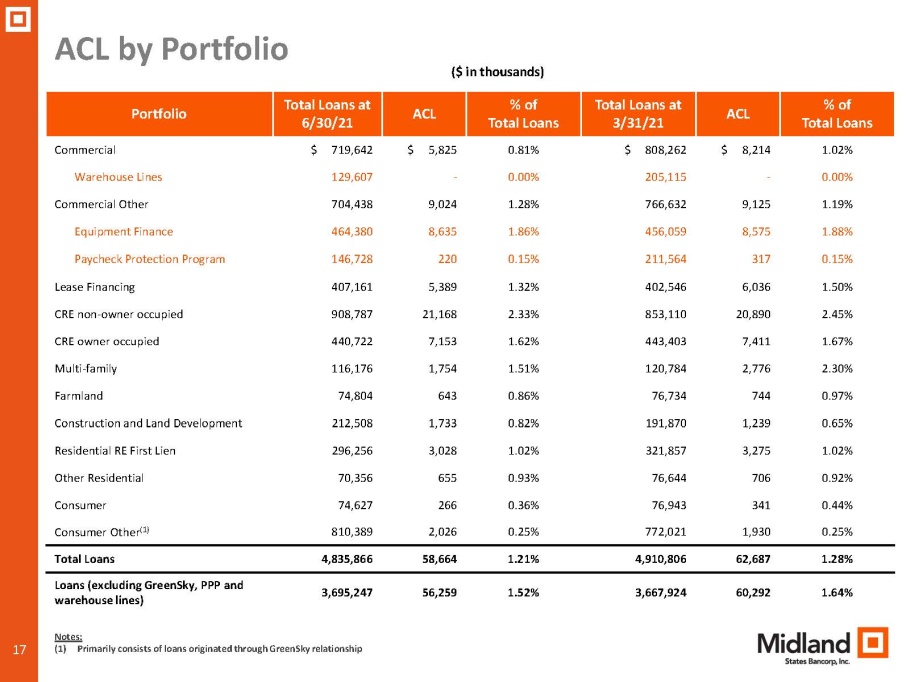
17 ACL by Portfolio Portfolio Total Loans at 6/30/21 ACL % of Total Loans Total Loans at 3/31/21 ACL % of Total Loans Commercial $ 719,642 $ 5,825 0.81% $ 808,262 $ 8,214 1.02% Warehouse Lines 129,607 - 0.00% 205,115 - 0.00% Commercial Other 704,438 9,024 1.28% 766,632 9,125 1.19% Equipment Finance 464,380 8,635 1.86% 456,059 8,575 1.88% Paycheck Protection Program 146,728 220 0.15% 211,564 317 0.15% Lease Financing 407,161 5,389 1.32% 402,546 6,036 1.50% CRE non - owner occupied 908,787 21,168 2.33% 853,110 20,890 2.45% CRE owner occupied 440,722 7,153 1.62% 443,403 7,411 1.67% Multi - family 116,176 1,754 1.51% 120,784 2,776 2.30% Farmland 74,804 643 0.86% 76,734 744 0.97% Construction and Land Development 212,508 1,733 0.82% 191,870 1,239 0.65% Residential RE First Lien 296,256 3,028 1.02% 321,857 3,275 1.02% Other Residential 70,356 655 0.93% 76,644 706 0.92% Consumer 74,627 266 0.36% 76,943 341 0.44% Consumer Other (1) 810,389 2,026 0.25% 772,021 1,930 0.25% Total Loans 4,835,866 58,664 1.21% 4,910,806 62,687 1.28% Loans (excluding GreenSky, PPP and warehouse lines) 3,695,247 56,259 1.52% 3,667,924 60,292 1.64% ($ in thousands) Notes: (1) Primarily consists of loans originated through GreenSky relationship
18 Outlook • Continued improvement in economic conditions should lead to reductions in problem loans and increased loan demand • Loan pipeline in Community Banking group approximately 14% higher than end of 1Q21, which should lead to higher level of loan growth in second half of 2021, favorable shift in earning asset mix, and further increases in profitability • Continued implementation of technology initiatives expected to result in further efficiencies and stable expense levels in second half of 2021 • Significant progress made on internal business optimization goals and strengthening of capital ratios provides opportunity to resume evaluation of small M&A opportunities with compelling strategic and economic rationales 18
19 APPENDIX
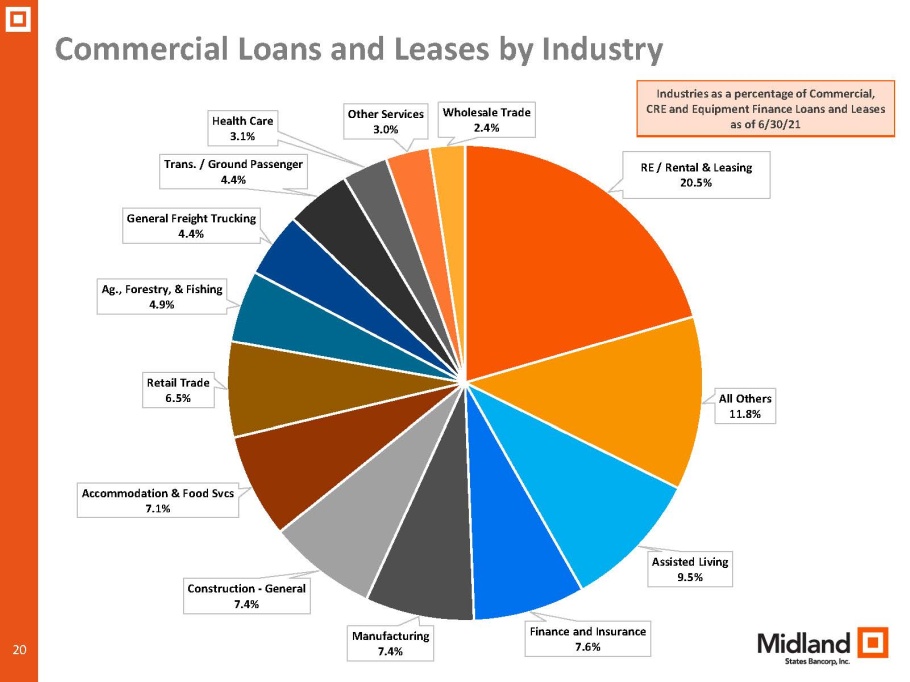
20 Commercial Loans and Leases by Industry RE / Rental & Leasing 20.5% All Others 11.8% Assisted Living 9.5% Finance and Insurance 7.6% Manufacturing 7.4% Construction - General 7.4% Accommodation & Food Svcs 7.1% Retail Trade 6.5% Ag., Forestry, & Fishing 4.9% General Freight Trucking 4.4% Trans. / Ground Passenger 4.4% Health Care 3.1% Other Services 3.0% Wholesale Trade 2.4% Industries as a percentage of Commercial, CRE and Equipment Finance Loans and Leases as of 6/30/21
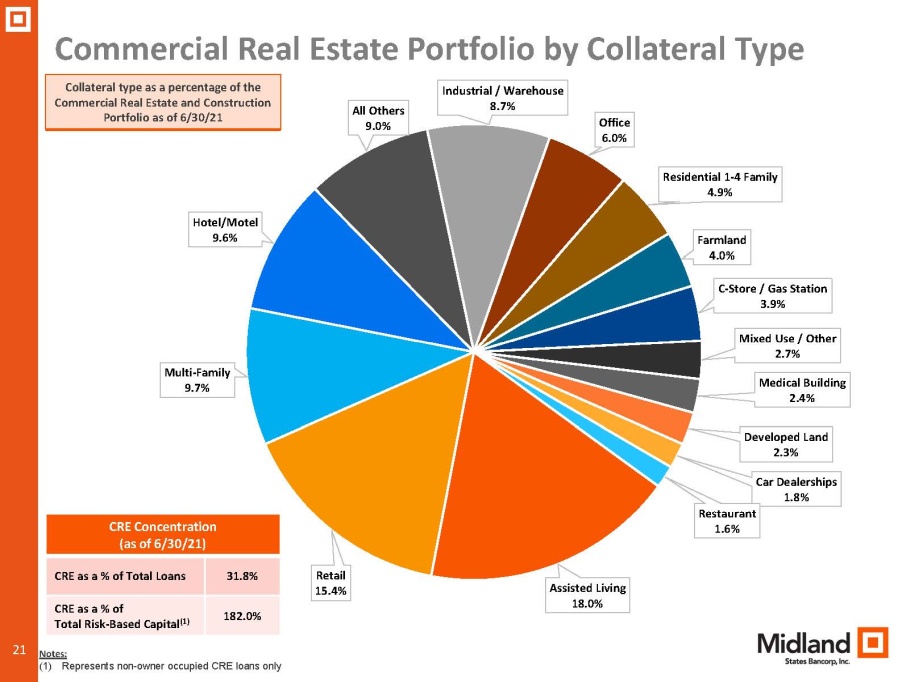
21 Commercial Real Estate Portfolio by Collateral Type Assisted Living 18.0% Retail 15.4% Multi - Family 9.7% Hotel/Motel 9.6% All Others 9.0% Industrial / Warehouse 8.7% Office 6.0% Residential 1 - 4 Family 4.9% Farmland 4.0% C - Store / Gas Station 3.9% Mixed Use / Other 2.7% Medical Building 2.4% Developed Land 2.3% Car Dealerships 1.8% Restaurant 1.6% Collateral type as a percentage of the Commercial Real Estate and Construction Portfolio as of 6/30/21 CRE Concentration (as of 6/30/21) CRE as a % of Total Loans 31.8% CRE as a % of Total Risk - Based Capital (1) 182.0% Notes: (1) Represents non - owner occupied CRE loans only
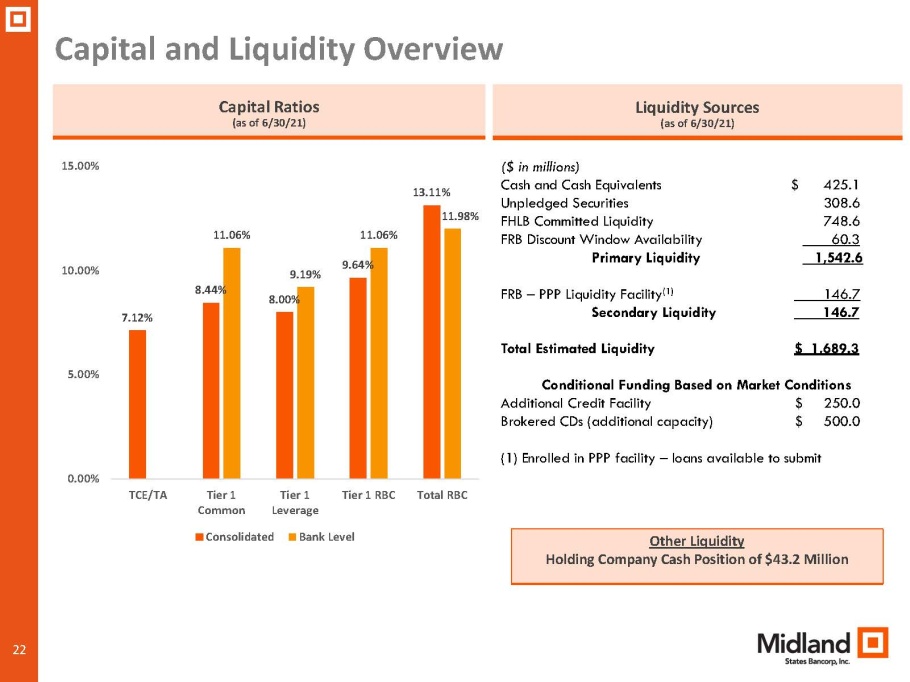
22 Capital and Liquidity Overview Capital Ratios (as of 6/30/21) Liquidity Sources (as of 6/30/21) 7.12% 8.44% 8.00% 9.64% 13.11% 11.06% 9.19% 11.06% 11.98% 0.00% 5.00% 10.00% 15.00% TCE/TA Tier 1 Common Tier 1 Leverage Tier 1 RBC Total RBC Consolidated Bank Level ($ in millions) Cash and Cash Equivalents $ 425.1 Unpledged Securities 308.6 FHLB Committed Liquidity 748.6 FRB Discount Window Availability 60.3 Primary Liquidity 1,542.6 FRB – PPP Liquidity Facility (1) 146.7 Secondary Liquidity 146.7 Total Estimated Liquidity $ 1,689.3 Conditional Funding Based on Market Conditions Additional Credit Facility $ 250.0 Brokered CDs (additional capacity) $ 500.0 (1) Enrolled in PPP facility – loans available to submit Other Liquidity Holding Company Cash Position of $43.2 Million
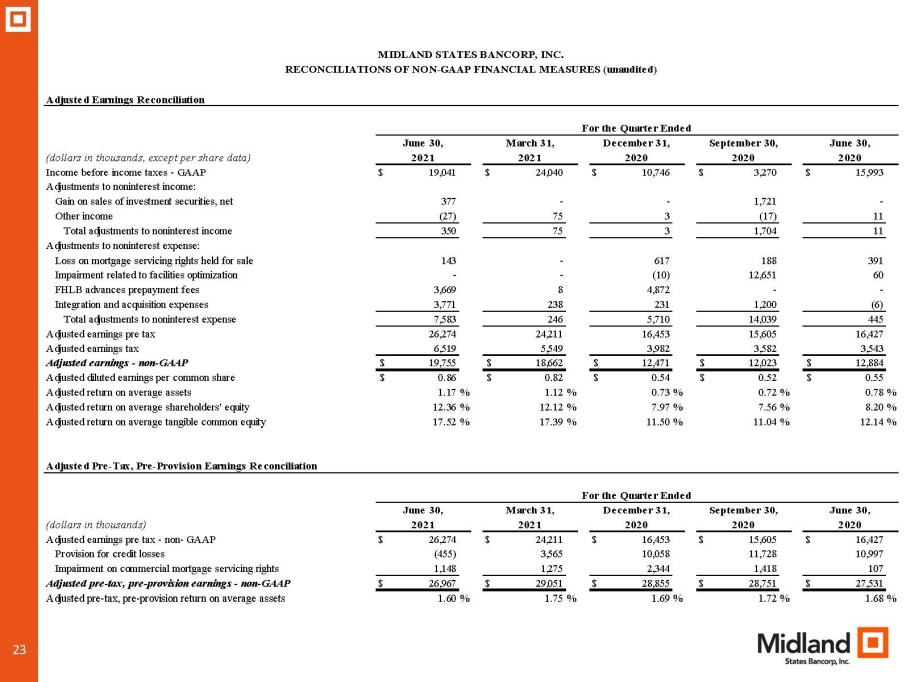
23 (dollars in thousands, except per share data) Income before income taxes - GAAP $ 19,041 $ 24,040 $ 10,746 $ 3,270 $ 15,993 Adjustments to noninterest income: Gain on sales of investment securities, net 377 - - 1,721 - Other income (27) 75 3 (17) 11 Total adjustments to noninterest income 350 75 3 1,704 11 Adjustments to noninterest expense: Loss on mortgage servicing rights held for sale 143 - 617 188 391 Impairment related to facilities optimization - - (10) 12,651 60 FHLB advances prepayment fees 3,669 8 4,872 - - Integration and acquisition expenses 3,771 238 231 1,200 (6) Total adjustments to noninterest expense 7,583 246 5,710 14,039 445 Adjusted earnings pre tax 26,274 24,211 16,453 15,605 16,427 Adjusted earnings tax 6,519 5,549 3,982 3,582 3,543 Adjusted earnings - non-GAAP $ 19,755 $ 18,662 $ 12,471 $ 12,023 $ 12,884 Adjusted diluted earnings per common share $ 0.86 $ 0.82 $ 0.54 $ 0.52 $ 0.55 Adjusted return on average assets 1.17% 1.12% 0.73% 0.72% 0.78% Adjusted return on average shareholders' equity 12.36% 12.12% 7.97% 7.56% 8.20% Adjusted return on average tangible common equity 17.52% 17.39% 11.50% 11.04% 12.14% (dollars in thousands) Adjusted earnings pre tax - non- GAAP $ 26,274 $ 24,211 $ 16,453 $ 15,605 $ 16,427 Provision for credit losses (455) 3,565 10,058 11,728 10,997 Impairment on commercial mortgage servicing rights 1,148 1,275 2,344 1,418 107 Adjusted pre-tax, pre-provision earnings - non-GAAP $ 26,967 $ 29,051 $ 28,855 $ 28,751 $ 27,531 Adjusted pre-tax, pre-provision return on average assets 1.60% 1.75% 1.69% 1.72% 1.68% June 30, 20202020 September 30, Adjusted Pre-Tax, Pre-Provision Earnings Reconciliation For the Quarter Ended December 31, 20202021 March 31,June 30, 2021 2020 June 30, MIDLAND STATES BANCORP, INC. Adjusted Earnings Reconciliation For the Quarter Ended RECONCILIATIONS OF NON-GAAP FINANCIAL MEASURES (unaudited) 2020 December 31, September 30, 20202021 March 31, 2021 June 30,
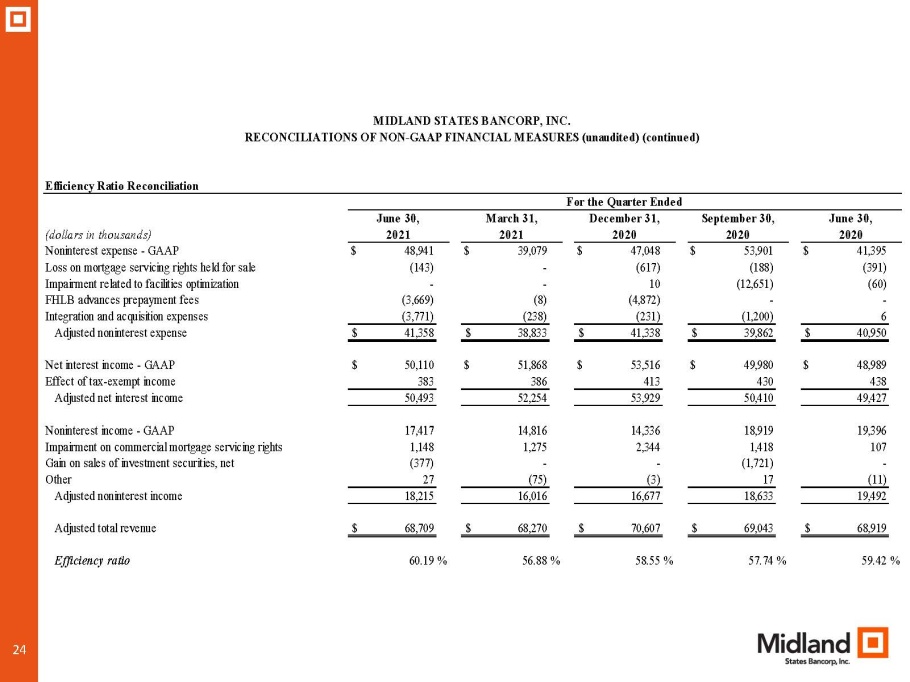
24 (dollars in thousands) Noninterest expense - GAAP $ 48,941 $ 39,079 $ 47,048 $ 53,901 $ 41,395 Loss on mortgage servicing rights held for sale (143) - (617) (188) (391) Impairment related to facilities optimization - - 10 (12,651) (60) FHLB advances prepayment fees (3,669) (8) (4,872) - - Integration and acquisition expenses (3,771) (238) (231) (1,200) 6 Adjusted noninterest expense $ 41,358 $ 38,833 $ 41,338 $ 39,862 $ 40,950 Net interest income - GAAP $ 50,110 $ 51,868 $ 53,516 $ 49,980 $ 48,989 Effect of tax-exempt income 383 386 413 430 438 Adjusted net interest income 50,493 52,254 53,929 50,410 49,427 Noninterest income - GAAP 17,417 14,816 14,336 18,919 19,396 Impairment on commercial mortgage servicing rights 1,148 1,275 2,344 1,418 107 Gain on sales of investment securities, net (377) - - (1,721) - Other 27 (75) (3) 17 (11) Adjusted noninterest income 18,215 16,016 16,677 18,633 19,492 Adjusted total revenue $ 68,709 $ 68,270 $ 70,607 $ 69,043 $ 68,919 Efficiency ratio 60.19% 56.88% 58.55% 57.74% 59.42% 2020 June 30, MIDLAND STATES BANCORP, INC. Efficiency Ratio Reconciliation For the Quarter Ended RECONCILIATIONS OF NON-GAAP FINANCIAL MEASURES (unaudited) (continued) 2020 December 31, September 30, 20202021 March 31, 2021 June 30,
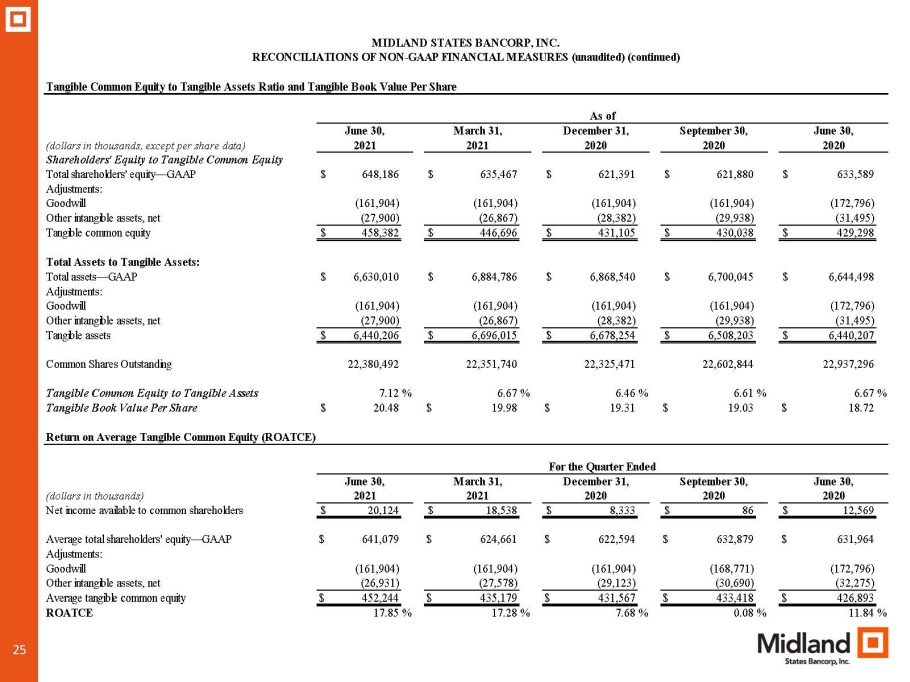
25 (dollars in thousands, except per share data) Shareholders' Equity to Tangible Common Equity Total shareholders' equity—GAAP $ 648,186 $ 635,467 $ 621,391 $ 621,880 $ 633,589 Adjustments: Goodwill (161,904) (161,904) (161,904) (161,904) (172,796) Other intangible assets, net (27,900) (26,867) (28,382) (29,938) (31,495) Tangible common equity $ 458,382 $ 446,696 $ 431,105 $ 430,038 $ 429,298 Total Assets to Tangible Assets: Total assets—GAAP $ 6,630,010 $ 6,884,786 $ 6,868,540 $ 6,700,045 $ 6,644,498 Adjustments: Goodwill (161,904) (161,904) (161,904) (161,904) (172,796) Other intangible assets, net (27,900) (26,867) (28,382) (29,938) (31,495) Tangible assets $ 6,440,206 $ 6,696,015 $ 6,678,254 $ 6,508,203 $ 6,440,207 Common Shares Outstanding 22,380,492 22,351,740 22,325,471 22,602,844 22,937,296 Tangible Common Equity to Tangible Assets 7.12% 6.67% 6.46% 6.61% 6.67% Tangible Book Value Per Share $ 20.48 $ 19.98 $ 19.31 $ 19.03 $ 18.72 (dollars in thousands) Net income available to common shareholders $ 20,124 $ 18,538 $ 8,333 $ 86 $ 12,569 Average total shareholders' equity—GAAP $ 641,079 $ 624,661 $ 622,594 $ 632,879 $ 631,964 Adjustments: Goodwill (161,904) (161,904) (161,904) (168,771) (172,796) Other intangible assets, net (26,931) (27,578) (29,123) (30,690) (32,275) Average tangible common equity $ 452,244 $ 435,179 $ 431,567 $ 433,418 $ 426,893 ROATCE 17.85% 17.28% 7.68% 0.08% 11.84% Return on Average Tangible Common Equity (ROATCE) 2020 June 30, 2020 June 30, 2020 September 30, 2020 December 31, For the Quarter Ended 2021 March 31, 2021 June 30, MIDLAND STATES BANCORP, INC. Tangible Common Equity to Tangible Assets Ratio and Tangible Book Value Per Share As of RECONCILIATIONS OF NON-GAAP FINANCIAL MEASURES (unaudited) (continued) 2020 December 31, September 30, 20202021 March 31, 2021 June 30,