Attached files
| file | filename |
|---|---|
| 8-K - FORM 8-K - CRAWFORD & CO | tm2122646-1_8k.htm |
Exhibit 99.1

1 Crawford 101 July 2021

2 2 Forward - Looking Statements and Additional Information Forward - Looking Statements This presentation contains forward - looking statements, including statements about the expected future financial condition, resul ts of operations and earnings outlook of Crawford & Company. Statements, both qualitative and quantitative, that are not statements of historical fact may be "forward - looking statements" as defined in the Private Securities Litigation Reform Act of 1995 and other securities laws. Forward - looking statements involve a number of risks and uncertainties that could cause actual results to differ materially from historical experience or Crawford & Company's present expectations. Acco rdi ngly, no one should place undue reliance on forward - looking statements, which speak only as of the date on which they are made. Crawford & Company does not undertake to update forward - looking statements to reflect the impact of circumstances or events that may arise or not arise after the date the forward - looking statements are made. Results for any interim period presented herein are not necessarily indicative of results to be expected for the full year or for any oth er future period. For further information regarding Crawford & Company, and the risks and uncertainties involved in forward - looking statements, please read Crawford & Company's reports filed with the Securities and Exchange Commission and avail able at www.sec.gov or in the Investor Relations section of Crawford & Company's website at www.crawco.com. Crawford's business is dependent, to a significant extent, on case volumes. The Company cannot predict the future trend of ca se volumes for a number of reasons, including the fact that the frequency and severity of weather - related claims and the occurrence of natural and man - made disasters, which are a significant source of cases and revenue for the Company, are gener ally not subject to accurate forecasting. Revenues Before Reimbursements ("Revenues") Revenues Before Reimbursements are referred to as "Revenues" in both consolidated and segment charts, bullets and tables thro ugh out this presentation. Segment and Consolidated Operating Earnings Under the Financial Accounting Standards Board's Accounting Standards Codification ("ASC") Topic 280, "Segment Reporting," th e C ompany has defined segment operating earnings as the primary measure used by the Company to evaluate the results of each of its three operating segments. Segment operating earnings represent segment earnings, including the direct and indirect costs of certain administrative functions required to operate our business, but excludes unallocated corporate and shared costs and credits, net corporate interest expense, stock option expense, amortization of customer - relations hip intangible assets, goodwill impairment, restructuring costs, gain on disposition of business, arbitration and claim settlements, income taxes and net income or loss attributable to noncontrolling interests and redeemable noncontrolling in terests. Earnings Per Share The Company's two classes of stock are substantially identical, except with respect to voting rights and the Company's abilit y t o pay greater cash dividends on the non - voting Class A Common Stock than on the voting Class B Common Stock, subject to certain limitations. In addition, with respect to mergers or similar transactions, holders of Class A Common Stock mu st receive the same type and amount of consideration as holders of Class B Common Stock, unless different consideration is approved by the holders of 75% of the Class A Common Stock, voting as a class. In certain periods, the Company has paid a higher dividend on CRD - A than on CRD - B. This may result in a different earnings per s hare ("EPS") for each class of stock due to the two - class method of computing EPS as required by ASC Topic 260 - "Earnings Per Share". The two - class method is an earnings allocation method under which EPS is calculated for each class of comm on stock considering both dividends declared and participation rights in undistributed earnings as if all such earnings had been distributed during the period. Segment Gross Profit Segment gross profit is defined as revenues, less direct costs, which exclude indirect centralized administrative support cos ts allocated to the business. Indirect expenses consist of centralized administrative support costs, regional and local shared services that are allocated to each segment based on usage. Non - GAAP Financial Information For additional information about certain non - GAAP financial information presented herein, see the Appendix following this presen tation.

3 4 Introduction to Crawford & Company 19 Industry Overview 29 Investing in Innovation 35 Growth Strategy 41 Financial Overview 45 Environmental, Social and Governance 51 Global Service Lines: Loss Adjusting 57 Global Service Lines: Platform Solutions 63 Global Service Lines: TPA: Broadspire 68 Conclusion 71 Appendix A: Full Year 2020 Consolidated Financial Results 75 Appendix B: Global Service Lines 79 Appendix C: Non - GAAP Financial Information 88 Appendix D: Additional Case Studies Table of Contents

4 Introduction to Crawford & Company

5 $ 18 BILLION + Claims managed annually 1.6 MILLION Claims handled 5 The world’s largest publicly listed independent provider of global claims management and outsourcing solutions. BY GLOBAL SERVICE LINES BY GEOGRAPHY 44% ⎹ Loss Adjusting 38% ⎹ TPA: Broadspire 18% ⎹ Platform Solutions 58% ⎹ US 9% ⎹ Canada 13% ⎹ UK 7% ⎹ Australia 13% ⎹ Rest of the world OUR PURPOSE: To restore and enhance lives, businesses and communities OUR VALUES: RESTORE R espect, E mpowerment, S ustainability, T raining, O ne Crawford, R ecognition, E ntrepreneurial Spirit 9,000 Total employees BY MARKET ¹ (1) Reflects 2020; figures are approximate 35% ⎹ Corporations 65% ⎹ Carriers Who We Are

6 6 Our History 1941 - Jim Crawford founds Crawford & Company in Georgia 1946 - Established Crawford Educational Services training program 1957 - Crawford opens office in London, begins international expansion 1967 - 25th anniversary; offices in Canada, Puerto Rico, England, and U.S. 1968 - Crawford becomes publicly traded on the OTC 1989 - Crawford becomes publicly traded on the NYSE 1990s - Crawford acquires Graham Miller, Brocklehurst & Thomas Howell 1999 - Crawford acquires Contractor Connection; adds managed repair 2006 - Crawford acquires Broadspire; largest acquisition to date 2014 - Crawford acquires GAB Robins UK; 2nd largest acquisition to date 2017 - Crawford acquires majority stake in WeGoLook 2020 - Crawford acquires HBA Group and Crawford Carvallo TIMELINE Our Purpose Restoring and enhancing lives, businesses and communities. Our Values Our mission is embedded in our values – to RESTORE is part of everything we do. 6 1998 - Crawford adds Adjusters Canada 2002 - Crawford adds Robertsons in Australia 2021 - Crawford celebrates 80 th anniversary

7 7 BY GLOBAL SERVICE LINES 44% ⎹ Loss Adjusting 38% ⎹ TPA: Broadspire 18% ⎹ Platform Solutions Crawford delivers services to its clients through a global service line reporting structure consisting of three operating segments : What We Do LOSS ADJUSTING TPA: BROADSPIRE PLATFORM SOLUTIONS • Loss Adjusting (Property / Auto / Liability) • Vehicle & Heavy Equipment Inspections • Casualty Large & Complex • Property Large & Complex • Specialty Loss Adjusting • Managed Repair • Catastrophe Response • Temporary Staffing • On - Demand Services • SaaS Platform • Workers Compensation • Disability & Leave Management • Auto / Motor • General Liability • Accident & Health • Affinity / Warranty • Legal Services / Recoveries We bring together thoughtful experts from around the world to offer comprehensive, intelligent solutions to our customers.

8 70 countries 9K Employees worldwide 50K field resources 6K network contractors 8 Global coverage that goes beyond borders.

9 9 Crawford Bridges the Gap Between Risk Bearers and Claimants Risk Bearers Carriers Self - Insured Corporations Captive Insurers Retail Customers Corporation Employees Corporation Insured Claimants Claims Ecosystem We close the gap for our customers: Expertise Scale Proximity

10 10 Carriers Self Insured Corporations Captive Insurers Expertise • Large loss claims in particular require technical subject matter expertise like forensics, engineering, energy which may not always be available in - house at a carrier or self - insured corporate Capacity • Independent adjustors (“IA”) provide flexible capacity during unforeseen events (e.g. CAT) • Helps carriers convert fixed costs into variable costs to manage weather driven volatility Cost • IA help carriers and self - insured corporations manage their loss cost and loss adjustment expenses through more accurate claim settlements Scale and Proximity • Large adjustment firms like Crawford have nationwide and global reach which smaller and regional carriers may lack Why is Crawford Needed?

11 11 Why is Crawford Needed? CARRIERS Accuracy, Quality and Expertise • Claims experience is an extension of a carrier’s brand • War on talent and increasing claims complexity has amplified need to hire more expertise • GTS offers global expertise in construction, engineering, forensic accounting, cyber and building consultancy Timeliness and Capacity • We have the capacity and scale to be there when needed • Independent adjusters provide flexible capacity during unforeseen events (e.g. CAT) • New innovative platform/network solutions providing alternative to traditional methods of inspection Cost Reduction • Intelligent triage – on demand inspection services, virtual inspection, on site adjuster, contractor managed repair • Helps carriers convert fixed costs into variable costs to manage weather driven volatility Scale and Proximity • Crawford has a nationwide and global reach that smaller and regional carriers may lack • Crawford’s suite of services provides enhanced offerings and ability to better leverage expertise resources

12 12 Why is Crawford Needed? CORPORATES Accuracy, Quality and Expertise • Bonus program for adjusters based on systematic and manual quality reviews • Cross - functional service team with strategic Account Exec driving vision and action plans • Biopsychosocial approach to understand injured worker and capture unique data points Timeliness and Capacity • 24/7 nurse triage program helps injured worker with self - care options and seamless transfers to intake • Corporation costs rise the longer the claim is open • Analytics platform allows real time professional caseload tracking to find resolutions sooner Cost Reduction • High - impact claim and clinical solutions help improve return - to - work rates and reduce average paid per claim, resulting in 15% savings on average • Data studies with Virtual Peer benchmarking to level set on program performance, find true opportunities, and drive action Scale and Proximity • Capability to Hub and Centralize claim handling based on desired program design • Strategic program design focused our customers’ goals and objectives
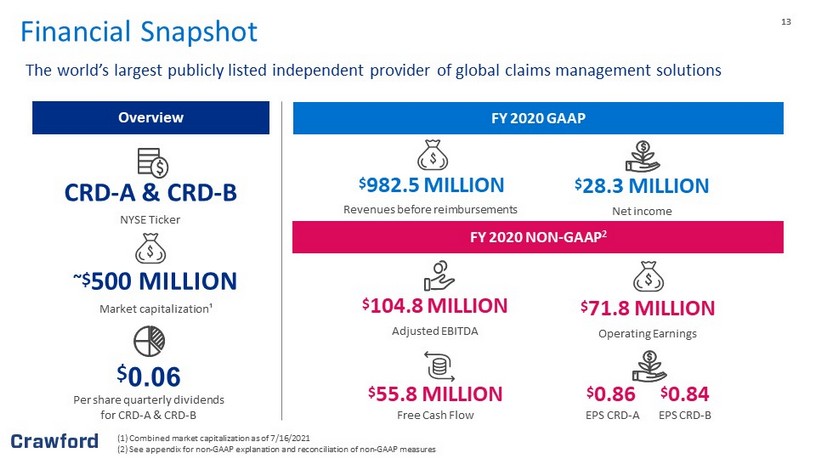
13 13 (1) Combined market capitalization as of 7/16/2021 (2) See appendix for non - GAAP explanation and reconciliation of non - GAAP measures Overview FY 2020 GAAP FY 2020 NON - GAAP 2 ~$ 500 MILLION Market capitalization¹ The world’s largest publicly listed independent provider of global claims management solutions $ 55.8 MILLION Free Cash Flow $ 71.8 MILLION Operating Earnings $ 982.5 MILLION Revenues before reimbursements $ 28.3 MILLION Net income $ 104.8 MILLION Adjusted EBITDA CRD - A & CRD - B NYSE Ticker $ 0.06 Per share quarterly dividends for CRD - A & CRD - B $ 0.86 $ 0.84 EPS CRD - A EPS CRD - B Financial Snapshot

14 14 Fee for service Time and expense No underwriting risk 95%+ retention rate Capital light business (CAPEX = 3% of sales) Diverse client base 3 - 5 year contracts Revenue Model

15 15 Key Customers Crawford’s customer base includes the largest global insurance carriers as well as Fortune 1000 companies

16 16 Description Customers Strategy • Adjust individual claims • Claim sizes vary from $500 to $5+ billion • Two units: 1. Major and complex claims (GTS) 2. Volume claims • Carriers of all sizes • MGAs • Lloyds • Benchmark in quality and expertise • Digitally enabled for efficiency • Broadest global reach • Major and complex: Grow by investing in expertise • Volume claims: Improve margin through efficiency • Alternative channel to loss adjusting services • Marketplace for existing and new disruptive services • Two units: 1. Managed Repair (Contractor Connection) 2. Network businesses (E.g., CAT, WGL, Crawford Inspection Services) • Carriers of all sizes • MGAs • Lloyds • Most comprehensive alternatives in industry to traditional loss adjusting approaches • New markets and capabilities enabled by tech, built on years of claims experience • Drive growth through scaling businesses with compelling transactional economics • Third party administration across workers compensation, liability, accident and health, disability and medical management claims • Legal services such as recovery, fraud and litigation • Corporations, municipalities • MGAs, captives • Small - to mid - size carriers • Industry leading data and analytics for improved claims outcomes • Intense digitization to improve adjuster and customer experience • Margin enhancement through digitization and scaling LOSS ADJUSTING TPA PLATFORMS Strategic evolution to reimagine claims ecosystem Evolving Crawford’s Strategy for Long - term Growth

17 17 Rohit Verma Chief Executive Officer Andrew Bart President, Loss Adjusting International Joseph Blanco President Pat Van Bakel President, Canada & Loss Adjusting North America Larry Thomas Global President, Platform Solutions Mike Hoberman President, TPA Solutions: Broadspire North America Benedict Burke Chief Client Officer, Global Client Development Mike Jones President, TPA Solutions: Broadspire International Michelle Montgomery Chief Marketing Officer Bruce Swain Chief Financial Officer Bonnie Sawdey Chief People Officer Tami Stevenson General Counsel Experienced Leadership Team With an average of 30+ years of experience, Crawford’s strong and seasoned leadership team leverages its extensive knowledge and industry experience to drive our business

18 18 Experienced leadership team averaging 30 years of experience in our field Secular tailwinds provided from continued growth in large loss claims Investing in digitization as a point of differentiation and driver of growth Well - positioned to benefit from a fragmented and consolidating market Long - term commitment to generating shareholder value Balance sheet strength and stability provides strategic optionality Committed to the integration of ESG best practices across our operations Why Invest in Crawford? Crawford’s leading market position in an evolving landscape provides a compelling investment narrative

19 Industry Overview

20 20 Competitive Landscape UNIVERSAL 01 Competes with us across all elements of our business globally EMERGING 05 Recently entered the insurance industry and are disrupting the landscape REGIONAL 03 Competitors that only serve a specific region/geography GLOBAL 02 Compete in segments of our business globally NICHE 04 Competitors in specific geographies that vary by size United States United Kingdom Canada Australia Europe Asia Central & South America

21 21 2,195 1,182 3,376 Other Losses MARKET OPPORTUNITY ($B) GLOBAL NON - LIFE INSURANCE PREMIUM $219B+ Est. Loss Adjusting Expenses (LAE) Global Market Size Breakdown $62B+ Est. Total Addressable Market OUTSOURCED 30% ~1.5% CRAWFORD & COMPANY MARKET SHARE* *Market share calculation = Non - Life Premium * Estimate Loss Ratio (@65%) * Estimated LAE (@10%)*Outsourced (@30%) / Crawford Re venue | Non - Life Premium based on Swiss Re’s 2020 Sigma Report Global Non - Life Insurance Market Size

22 22 Adjusters Focus on Optimizing Loss Expenses for Carriers (1) Net Premiums Written (NPW) Source: E&Y 2020 US P&C insurance performance analysis Crawford’s Focus Combined Ratio Sum of loss, loss adjustment expense (LAE) and underwriting expense ratios. Includes policyholder dividends (return of premium) as a percentage of NPW ¹ Underwriting Expense Sum of all expenses related to acquiring underwriting, and servicing policyholders as a percentage of NPW ¹ Total Loss Sum of LAE and pure loss as a percentage of NPW ¹ General Salaries, plant, property and equipment, and other overhead expenses / NPW ¹ Acquisition Advertising, sales, supervision, facilities and equipment costs / NPW ¹ LAE Cost of investigating and adjusting losses / NPW ¹ Commission Payments to agents and brokers / NPW ¹ (includes net payments on reinsurance assumed / ceded) Taxes, licenses and fees Premium taxes, agents and business licenses, insurance dept. fees and guaranty fund assessments / NPW ¹ Pure Loss Payments to claimants and reserve increases / NPW ¹

23 23 Loss Adjuster is a Brand Extension of the Carrier Claims Experience is Insurance Carrier’s “Moment of Truth” (1) Source: Accenture – Why Claims Service Matters? Customer satisfaction with the claims experience, and response to dissatisfaction ¹ Q: How satisfied are you with the way in which your insurance provider handled and settled your claim? Likelihood of switching providers, by claims satisfaction ¹ Q: How likely are you to stop doing business with one of your insurance providers and switch to another provider in the next 12 months?

24 24 Changes Leading to Increased Claims Outsourcing Claims outsourcing is highly dependent on the overall P&C market and continues to benefit from pressure on carriers to streamline cost structures and leverage third parties with specific expertise Downside reputational risk due to social and other media encourages carriers to seek outsourced solutions that enable quick and authoritative responses to major CAT events Increasing concentration of insured assets in risk - prone areas Frequency of catastrophic events has been increasing, particularly major loss events Recent COVID environment has accelerated adoption of alternative loss adjusting models Technology requirements are increasing, including increased scrutiny of data security 1 2 3 4 5 6
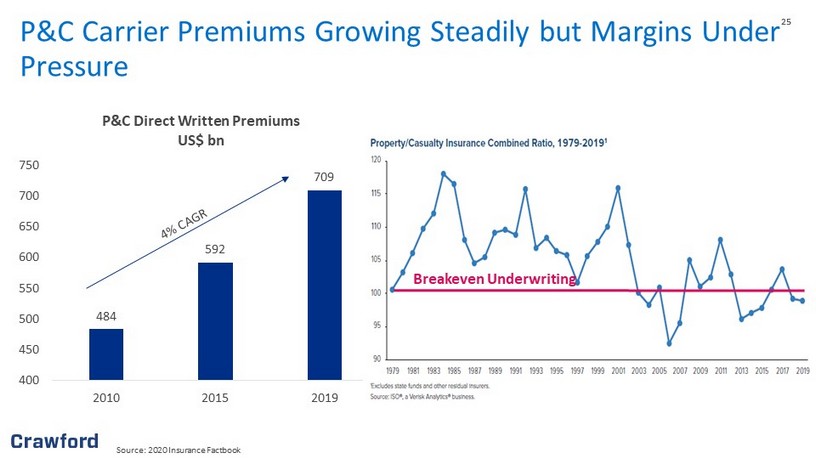
25 25 P&C Carrier Premiums Growing Steadily but Margins Under Pressure 484 592 709 400 450 500 550 600 650 700 750 2010 2015 2019 P&C Direct Written Premiums US$ bn Source: 2020 Insurance Factbook Breakeven Underwriting
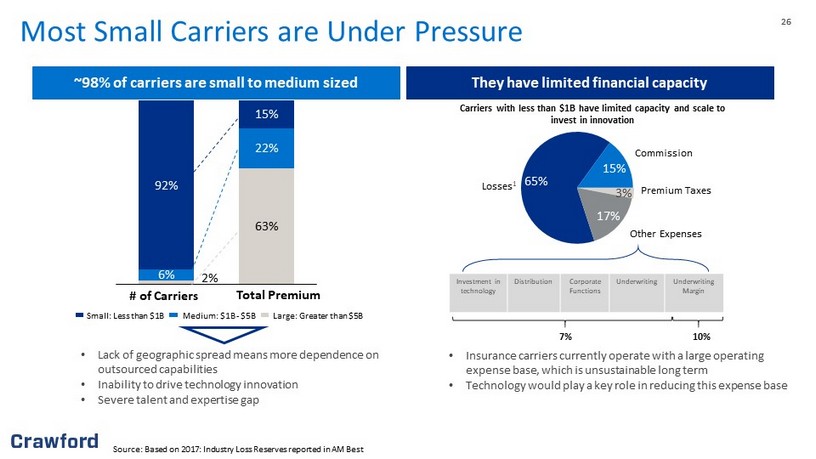
26 26 2 % 63 % 6% 22% 92% 15% # of Carriers Total Premium Medium: $1B - $5B Small: Less than $1B Large: Greater than $5B ~98% of carriers are small to medium sized They have limited financial capacity • Insurance carriers currently operate with a large operating expense base, which is unsustainable long term • Technology would play a key role in reducing this expense base 65% 15% 17% Losses 1 Commission Premium Taxes Other Expenses Investment in technology Distribution Corporate Functions Underwriting Underwriting Margin Carriers with less than $1B have limited capacity and scale to invest in innovation 10% 7% • Lack of geographic spread means more dependence on outsourced capabilities • Inability to drive technology innovation • Severe talent and expertise gap Source: Based on 2017: Industry Loss Reserves reported in AM Best 3% Most Small Carriers are Under Pressure

27 27 Auto Claims Frequency and CAT - Driven Losses Rising (1) Total physical damage claims closed with or without loss payments (2) SwissRe 41M 43M 46M 48M 52M 55M 58M 60M 62M 2010 2011 2012 2013 2014 2015 2016 2017 2018 Annual Auto Claims U.S. Auto Claims Frequency ¹ 166 169 172 175 178 181 184 188 192 2011 2012 2013 2014 2015 2016 2017 2018 2019 Motor Vehicle Repair CPI Rising Cost of Auto Claims Catastrophe - related insured losses (1970 - 2020) ² Trends leading to increased outsourcing

28 28 Coastline Population Steadily Growing 51.9 54.9 60.2 50 52 54 56 58 60 62 2000 2008 2017 Atlantic And Gulf of Mexico Coastline County Population, 2000 - 2017 (Millions) Source: 2020 Insurance Factbook

29 Investing in Innovation

30 Crawford is Partnering with Leading Insurtechs Smart Water Meters Property Measurement and 3 - D Modeling Digital Desk for Interior Property Claims Homeowners Insurance Automate and Expedite Claim Handling via Mobile Enables Digitalization of Estimate Review Process Enables Digitalization of Estimate Review Process Intelligent Communication Platform Immersive 3D Technology One - stop Information Portal for Adjusters

31 31 Investing to Drive Innovation and Accelerate Growth Crawford improves the claims journey via workflow automation, enhanced data and analytics, reduced cycle times and superior q ual ity Enabling Technology ¹ Key Benefits Robotic Process Automation Automates workflows and repetitive tasks throughout claims process API Integrations Integrates internal and external data sources to support automation of workflows and enhanced data & analytics Machine Learning Automates workflows with rule - based logic and algorithms Data Visualization Tools Creates visual representations of large amounts of data for easy ingestion and decision making Portals Intuitive, scalable and customizable portals for data exchange Asservio Automated estimate review software 3D Virtual Reality Supports virtual claims adjusting and digital reporting IoT Sensors / Telematics / Alexa Integration Supports omni - channel FNOL ² via Internet of Things IoT (1) This is a sampling of the enabling technologies implemented by Crawford (2) First Notice of Loss Cost Savings Increased Transparency Enhanced Data / Analytics Improved Quality Reduced Time Cycle Process Efficiency Key Benefits Legend

32 32 Improve Expense, Accuracy and Speed of Delivery Powered by digitization, best - in - class quality and industry - leading claims expertise, Crawford’s customer - centric claims solutions deliver rapid, accurate claim resolution to reduce costs and improve your customer’s experience OMNI - CHANNEL FNOL*/ INTAKE INTELLIGENT TRIAGE LOSS EVENTS All lines and geographies *First Notice of Loss ASSESSMENT VIRTUAL CLAIMS ADJUSTER FIELD ADJUSTER REMOTE SITE INSPECTION (low - mid complexity) Video Streaming / 3D VR Models SELF SERVICE APP (low complexity) Customer provides data / digital media via smartphone / PC MANAGED REPAIR (low - mid complexity) Referral to Contractor Connection to repair damage via network. FIELD VISIT (mid - high complexity) Field adjuster collects data and completes validation / estimate and coverage assessment FIELD VISIT (high value / complexity) Field adjuster collects data and completes validation/scoping. Specialist adjuster manages final claim deliverable to client ON DEMAND (mid complexity) WeGoLook Looker (including technical expertise and/or drone operators) or Ladder Assist inspector collects data REPAIR / SETTLEMENT FULFILLMENT Contractor estimate accuracy review, supporting documentation, cycle time management CLOSING REPORT Validation & recommendation FULL SETTLEMENT Cash / Repair / Replacement / Payment Key Benefits: • Customizable solution • Intelligent triage and robust assessment options enable use of the right solution for each claim • Process claims in as little as 3.7 days • Reduce costs by up to 30% (on average)

33 33 Delivering Customer Satisfaction Through Speed and Technology OnSite contact web app Looker app YouGoLook self - service app

34 POLICYHOLDER SELF SERVICE Policyholders submit images & information via self - service apps. • Self - service inspection • 3D property scan Crawford Digital Assist Order Crawford services and solutions in the US quickly and easily on the web ON - DEMAND SERVICES Instantly connect with resources to gather images & information from the field. • Ladder assist • Roof inspection • 3D property scan CONTRACTOR SERVICES Take claims all the way to finished repair through Contractor Connection. • Emergency services • Managed repair ADJUSTER SERVICES Tap into our vast network of licensed adjusters & other agents. • Appraisal (Property/Auto) • Adjustment • Contents EXPERT SERVICES For specialized support, Crawford has you covered. • Building consultancy • Forensic accounting

35 Growth Strategy

36 Fragmented Market Presents Consolidation Opportunities Consolidation Opportunity: >1,500 firms with average revenue of $1.25m (1) Based on $4 billion TAM Estimate, Stoneridge, IBIS World: Crawford Internal Estimates; Figures are approximate (2) U.S. revenues of Loss Adjusting and Networks (3) >$100mn in revenues 3 ² 0 10 20 30 40 50 60 Independent Adjusters Crawford Other Large Players US P&C Loss Adjusting Market Share¹ 50 % 7% 43%
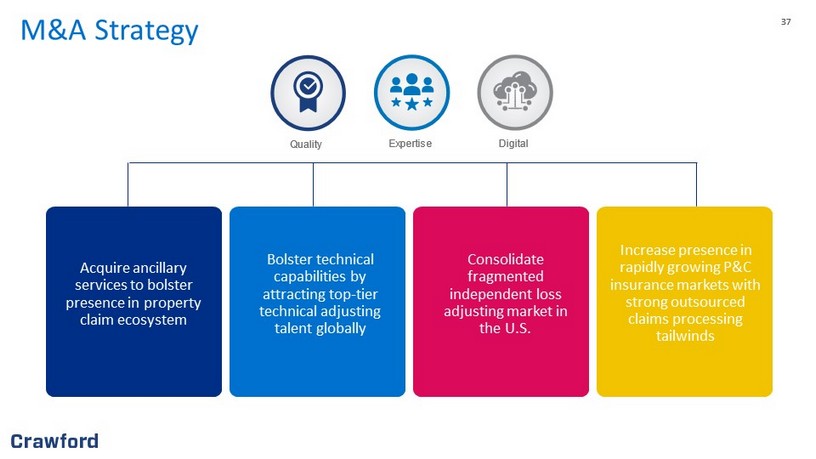
37 37 Acquire ancillary services to bolster presence in property claim ecosystem Bolster technical capabilities by attracting top - tier technical adjusting talent globally Consolidate fragmented independent loss adjusting market in the U.S. Increase presence in rapidly growing P&C insurance markets with strong outsourced claims processing tailwinds M&A Strategy 4XDOLW\ ([SHUWLVH

38 38 M&A Timeline Contractor Connection Acquisition 1999 Created the industry leader in managed repair solutions Broadspire Acquisition 2006 Supported our mission of becoming the leading third - party administrator in all segments of the market for casualty claims program administration GAB Robins UK Acquisition 2014 Expanded our claims management offering in the UK and bolstered our specialty lines claims services globally WeGoLook Acquisition 2017 Propelled us to the forefront of the industry and transformed the way we conduct business while accelerating our alternative platform to traditional loss adjusting services Garden City Group Divestiture 2018 Sale further concentrated our attention and resources on our high - growth business segments while enhancing the overall predictability and quality of earnings Lloyd Warwick International (LWI) Divestiture 2020 Sale allowed Crawford to simplify its loss adjusting brand structure HBA Group Acquisition 2020 Expanded Crawford’s legal service capabilities in Australia Crawford Carvallo Acquisition 2020 Expanded Crawford’s footprint in Latin America
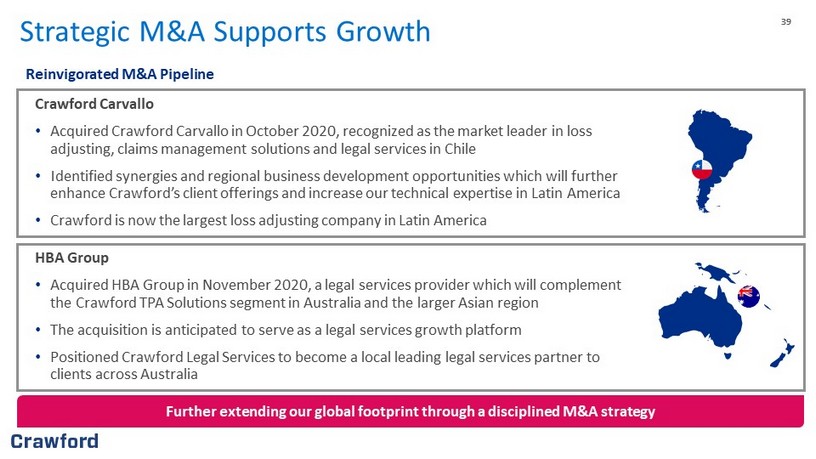
39 39 Strategic M&A Supports Growth Crawford Carvallo • Acquired Crawford Carvallo in October 2020, recognized as the market leader in loss adjusting, claims management solutions and legal services in Chile • Identified synergies and regional business development opportunities which will further enhance Crawford’s client offerings and increase our technical expertise in Latin America • Crawford is now the largest loss adjusting company in Latin America Further extending our global footprint through a disciplined M&A strategy Reinvigorated M&A Pipeline HBA Group • Acquired HBA Group in November 2020, a legal services provider which will complement the Crawford TPA Solutions segment in Australia and the larger Asian region • The acquisition is anticipated to serve as a legal services growth platform • Positioned Crawford Legal Services to become a local leading legal services partner to clients across Australia

40 40 “Acquihire” Case Study: Penta Investment Thesis: To enhance the service scope and market position in an important Tier II country by ‘ acqui - hiring’ credible and experienced GTS adjuster talent • Solidify position in the competitor landscape comprised of three big players (Crawford, Sedgwick, DP Service) in a fragmented market Penetrate GTS Market in Belgium • With ten experienced GTS adjusters, Crawford will create an entry point into the GTS segment Onboard GTS Talent • Allows Crawford to provide a comprehensive service offering to carriers and corporations for their large and complex losses Provide Comprehensive Service Offering • Adding GTS services will diversify the TPA: Broadspire only offering in Belgium Adding Global Service Line

41 41 Financial Overview

42 Improvement in Quality of Earnings and Business Mix TPA: Broadspire segment loss - making post acquisition Significant operational improvements at TPA: Broadspire; Garden City Group (GCG) wind - down of highly profitable Deep Water Horizon contract GCG sold in 2018 to focus on core loss - adjusting and TPA businesses; TPA: Broadspire continues organic growth - 15% 28% 33% 63% 13% 52% 59% 67% -20% 0% 20% 40% 60% 80% 100% 2010 2015 2019 Crawford Operating Earnings Business Mix* (2010 - 2019) *Percentages based on sum of operating earnings from reporting segments, excluding corporate unallocated. Amounts are approx ima te.
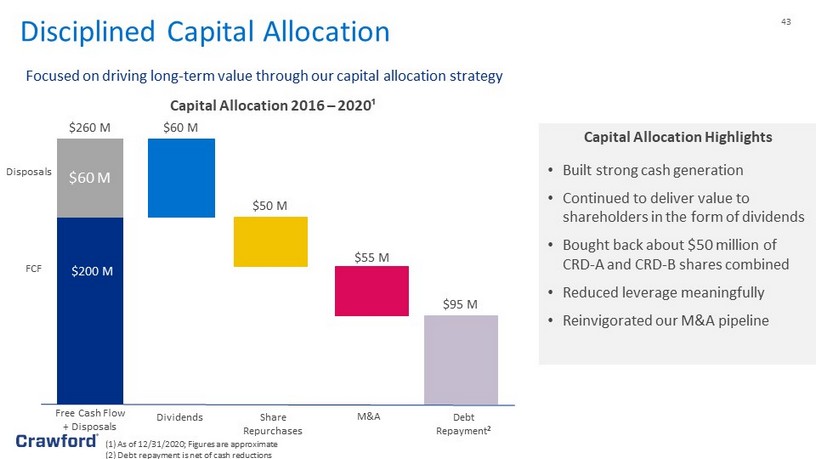
43 Disciplined Capital Allocation Capital Allocation 2016 – 2020¹ Focused on driving long - term value through our capital allocation strategy $260 M $60 M Free Cash Flow + Disposals Share Repurchases Debt Repayment 2 Dividends $50 M $95 M $55 M M&A Capital Allocation Highlights • Built strong cash generation • Continued to deliver value to shareholders in the form of dividends • Bought back about $50 million of CRD - A and CRD - B shares combined • Reduced leverage meaningfully • Reinvigorated our M&A pipeline (1) As of 12/31/2020; Figures are approximate (2) Debt repayment is net of cash reductions $200 M $63M FCF Disposals $60 M

44 44 (1) As of 12/31/2020 0 20,000 40,000 60,000 80,000 100,000 120,000 140,000 160,000 180,000 200,000 2015 2016 2017 2018 2019 2020 Net Debt ¹ 0 20,000 40,000 60,000 80,000 100,000 120,000 140,000 2015 2016 2017 2018 2019 2020 Pension Liability ¹ $68.9 million $53.9 million Net debt at $68.9 million, the lowest level since 2013 Pension liability at $53.9 million, the lowest level since before the Financial Crisis $171.2 million $121.7 million Net Debt and Pension Liability

45 Environmental, Social and Governance

46 46 Environmental, Social and Governance Crawford is committed to addressing those ESG factors most material to our operations Continuing to look for opportunities across our enterprise to become more socially responsible and are increasingly integrating ESG best practices into our operations Data Privacy & Security Human Capital Management & Diversity Professional Integrity & Corporate Governance Environmental Stewardship

47 47 Inclusion and Diversity Established Employee Resource Groups and an Employee Advisory Council aligned with our purpose to foster a safe and inclusive working environment, where employees can bring their authentic selves to work and offer unique experiences and perspectives Human Capital Development Promote an environment where employees are empowered to grow, emboldened to act, and inspired to innovate through internal programs and initiatives Environment Ensure processes are efficient and sustainable, and incorporate sustainability criteria into purchasing policies Community Involvement Give back to the communities we serve and responsibly steward our resources through donations to causes aligned with our purpose Corporate Governance Committed to good corporate governance and maintaining the trust of our investors and other stakeholders, including our employees, clients and vendors Environmental, Social and Governance Crawford believes in giving back to the communities we serve and responsibly stewarding our resources

48 48 Employee Advisory Council This council aligns with our mission to foster a safe and inclusive working environment where employees can bring their authentic selves to work and offer unique experiences and perspectives. Membership in the Business Insurance Diversity and Inclusion Institute The organisation is dedicated to promoting and advancing diversity and inclusion in every facet of the commercial insurance industry. Unconscious bias awareness We are committed to eliminating bias and enabling change within our workplace through a three - step approach to educate, empathise and engage. We have launched unconscious bias webinars for all managers and employees in the U.S. and U.K., as well as virtual training in Australia, and are planning for roll out in other regions. I&D in our communities To address our local geographies and communities, we have formed a Global Inclusion & Diversity Council by seeking nominations for representatives across our organisation to ensure I&D efforts are instituted. Inclusion and Diversity

49 49 Crawford employees across the globe receive benefit programs that support financial, physical and mental wellness. These programs may include: Free Membership to Headspace ( https://www.headspace.com/ ) which provides life changing skills of meditation and mindfulness through simple exercises and expert guidance. Compensation and incentive plans that recognise performance excellence. Employee Stock Purchase Plan (ESPP) for full time employees across the U.S., Canada, U.K. and Australia. Flexible working arrangements to support working parents and to help employees maintain a healthy work - life balance. In addition, the Crawford Cares, Inc. foundation lends support to Crawford employees affected by catastrophes or unexpected events or losses. Crawford has provided financial assistance to hundreds of employees affected by hurricanes and wildfires, suffering from catastrophic illnesses or injuries, coping with the loss of loved ones, and more. Using these funds, employees are able to offset many unexpected costs including property repair, food, clothing, temporary housing, and funeral expenses . Health and Wellness
50 50 Training and Engagement Training and Education From its inception, Crawford has led the industry in state - of - the - art training programs that continue to this day through Crawford Educational Services (CES). Crawford offers over 300 hours of courses through its online learning management platform, KMC OnDemand, in addition to in - person seminars, workshops, and even an annual leadership intensive through Emory University. Additionally, Crawford provides tuition reimbursement for those currently enrolled or planning to continue higher education. Employee Engagement To monitor employee satisfaction and engagement, Crawford conducts employee PULSE surveys twice (2x) per year. Out of the over 70% of employees who complete these surveys on average, the feedback received remains positive, further demonstrating our commitment to preserving the morale of our global workforce. 300 hours of online courses in - person seminars and workshops an annual leadership intensive tuition reimbursement

51 Global Service Lines: Loss Adjusting

52 *First Notice of Loss Crawford Loss Adjusting For clients seeking to increase policyholder satisfaction across the full spectrum of loss adjusting needs, Crawford is the one - stop - shop delivering efficiency and savings through unmatched experience, specialized expertise and digitally - enabled solutions. Property Casualty Catastrophe Equipment Inspections Subrogation Centralized Intake/FNOL* Cyber Forensic Accounting Energy Marine Global Admin (FNOL* to Final Payment) Field Adjusting Construction Clients Scope & Scale Strategy • Carriers of all sizes • MGAs • Lloyds • Brokers • Corporations • Claims sizes vary from $500 - $5B+ • ~315K Claims managed annually, $10B+ indemnity dollars • Nearly 2,500 claims professionals • 700+ executive general adjusters with an average of 25 years of experience Gain market share through digital simplification, setting quality benchmarks and investing in expertise

53 Complex Claims Loss Adjusting Expertise Focused Time & Expense Billing Model World’s Largest Technical Adjuster Network Recession - Resistant Complex Property Forensic Accounting CFAS Construction Marine Engineering Casualty Cyber & Technology Aviation Oil & Energy Agriculture Product Areas

54 54 Triage Model Reduces Adjusting Time and Costs Reduce cost and accelerate time in process with end - to - end handling of self - service, on - demand, and field adjusting needs Reduce time savings by 67% (Process claims in as little as 3.7 days) Reduce costs by up to 28% Claims Mix: 50% WeGoLook Users; 30% Self - Service Mobile App; 20% Traditional Field Adjusters

55 55 Outsourced Claims Advantage Case Study: A Vineyard impacted by the California wildfires Background o The 2017 California wildfires approached an unprecedented $12 billion of insured losses o A historic number of fires burned over 500,000 acres causing damage to almost 30 wineries in Napa, Sonoma and Mendocino The Value of Utilizing Crawford’s Methodology o In this case, a California vineyard initially claimed 60 acres as a total loss o While vineyards may appear damaged beyond salvageability, it takes time to determine whether grapes can grow from scorched vines o An expert from Crawford’s global network, a sought - after vineyard and soil science consultant, assisted with vine assessment and the determination of the vineyard’s damages o Through Crawford’s assistance, it was established that 69% of the vineyard was salvageable, with normal production and growth expected Savings for the Insurer o The average cost for this region to replant a vineyard acre is between $50,000 and $60,000 o With the initial assessment, the potential payout stood to be as high as $1.3 million o Crawford’s expert testing methodology unveiled a loss of only 31% of the initial claim — a payout of approximately $300,000, representing an approximate $1 million in savings

56 56 Belmond (UK) Limited Leveraging Crawford’s integrated solutions Background • Belmond La Samanna and Belmond Cap Juluca were left devastated by the powerful hurricanes of 2017 • Strong winds and sea surges caused significant property damage and interrupted business • As major employers in the local community, the resorts needed to be restored as soon as possible Identifying and Implementing a Solution • With a deep expertise in helping the hospitality industry and handling large - scale complex claims following weather - related catastrophes, Crawford Global Technical Services 䉼 introduced the specialist skills of Crawford Forensic Accounting Services and WeGoLook • During a time when communication was difficult, the drone capabilities of WeGoLook captured footage of the resort properties the day after they were struck by the hurricanes • Crawford’s findings made Belmond immediately aware of the scale of the losses and the resources needed to restore the properties Return to Business • Crawford’s Global Technical Services adjuster managed all the parties involved to provide support and guidance throughout the claim • With Crawford’s support, Belmond received a swift settlement of insurance claims • Both luxury resorts were able to re - open in 2018

57 Global Service Lines: Platform Solutions
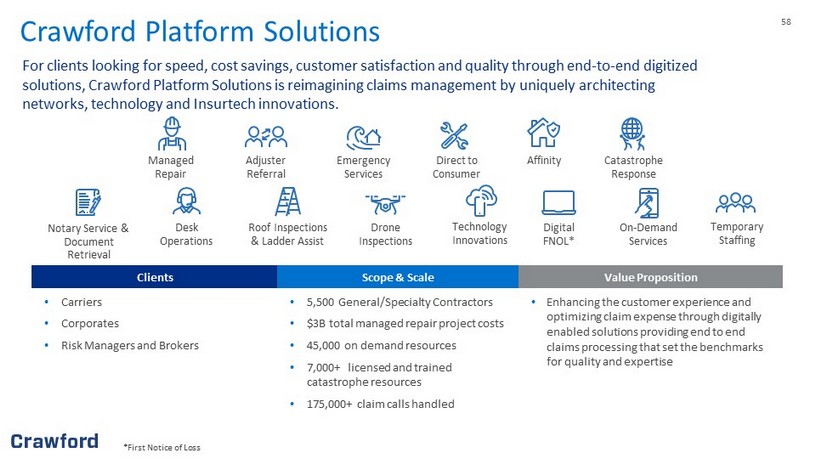
58 Crawford Platform Solutions For clients looking for speed, cost savings, customer satisfaction and quality through end - to - end digitized solutions, Crawford Platform Solutions is reimagining claims management by uniquely architecting networks, technology and Insurtech innovations. *First Notice of Loss Managed Repair Adjuster Referral Emergency Services Affinity Direct to Consumer Catastrophe Response Drone Inspections Desk Operations Roof Inspections & Ladder Assist On - Demand Services Digital FNOL* Technology Innovations Notary Service & Document Retrieval Temporary Staffing Clients Scope & Scale Value Proposition • Carriers • Corporates • Risk Managers and Brokers • 5,500 General/Specialty Contractors • $3B total managed repair project costs • 45,000 on demand resources • 7,000+ licensed and trained catastrophe resources • 175,000+ claim calls handled • Enhancing the customer experience and optimizing claim expense through digitally enabled solutions providing end to end claims processing that set the benchmarks for quality and expertise
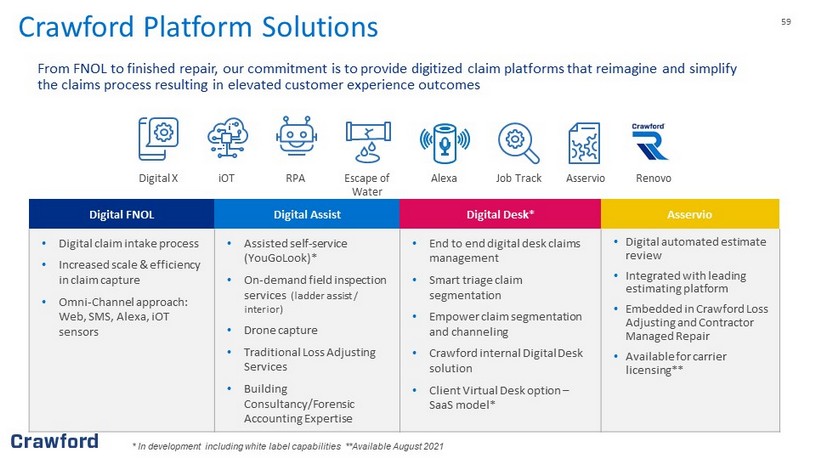
59 Digital FNOL Digital Assist Digital Desk* Asservio • Digital claim intake process • Increased scale & efficiency in claim capture • Omni - Channel approach: Web, SMS, Alexa, iOT sensors • Assisted self - service ( YouGoLook )* • On - demand field inspection services (ladder assist / interior) • Drone capture • Traditional Loss Adjusting Services • Building Consultancy/Forensic Accounting Expertise • End to end digital desk claims management • Smart triage claim segmentation • Empower claim segmentation and channeling • Crawford internal Digital Desk solution • Client Virtual Desk option – SaaS model* • Digital automated estimate review • Integrated with leading estimating platform • Embedded in Crawford Loss Adjusting and Contractor Managed Repair • Available for carrier licensing** From FNOL to finished repair, our commitment is to provide digitized claim platforms that reimagine and simplify the claims process resulting in elevated customer experience outcomes * In development including white label capabilities **Available August 2021 Digital X iOT RPA Escape of Water Alexa Asservio Renovo Job Track Crawford Platform Solutions

60 (1) Crawford internal estimates Contractor Connection: Total Addressable Market Market and Competitive Dynamics Carrier use of Managed Repair Program in North America could rise to above 50% in 10 years Increased interest in contractor managed repair for large, mid and small - sized carriers Success of Managed Repair Program attracting investment in network solutions Managed repair favorably addresses carrier loss ratio Rising customer experience expectations Demand for transparency and data analytics Managed Repair Has Significant Growth Headroom North America Managed Repair Penetration (1) North America represents >90% of Contractor Connection Revenue for FY20 20% 50% 0% 10% 20% 30% 40% 50% 60% Current Future Potential

61 Competitive Landscape

62 62 Contractor Connection Customer Experiences Improving the claims experience and delighting customers • Reduce time - in - process through innovative on - demand services and new technologies • Delight customers with an intuitive self - service experience with personal assistance when needed • Improve speed and efficiency through connected ordering platforms • Support customers all the way to finished repair • Improve transparency and job accountability Contractor Connection has been recognized by J.D. Power by providing "An Outstanding Customer Service Experience" for Phone support. J.D. Power 2020 Certified Customer Service Program recognition is based on successful completion of an evaluation and exceedi ng a customer satisfaction benchmark through a survey of recent servicing interactions. For more information, visit www.jdpower.com/ccc . • Deep engagement with JD Powers to continually innovate and improve customer satisfaction • Annual review of JD Powers claim study with entire business to evaluate areas for growth

63 Global Service Lines: TPA: Broadspire

64 Crawford TPA: Broadspire For companies looking to enhance the claims experience and drive quantifiable savings, TPA: Broadspire is the third party administrator that delivers client - centric integrated outsourced solutions powered by innovation and data science. Workers Compensation Auto/ Motor Accident & Health Affinity/ Warranty General Liability Product Liability & Recall Employers Liability Medical Management Legal Services/ Recoveries Disability & Leave Technology Solutions Clients Scope & Scale Strategy • Corporations, municipalities • MGAs, Program Managers, Captives • Carriers of all sizes • 50%+ U.S. Fortune 250 corporations served • $1.0B Managed medical spend • $3.3B Claims Paid • 813,000 Claims Managed Strengthen differentiation through product innovation, digitization and scaling

65 Strong Customer Relationships A recent study by Hynes Associates found that 95% of TPAs report client retention rates in excess of five years . Approximately 50% of those surveyed indicated the client tenure was five to nine years with the remainder of those ranging from 10 to 20 years. $15 $17 $17 $19 $22 $22 $22 $23 $23 $24 $25 $14 $17 $19 $22 $25 $26 $27 $28 $28 $29 $30 $0 $10 $20 $30 $40 $50 $60 2000 2002 2004 2006 2008 2010 2012 2014 2016 2018 2019P WC Lost - Time Claim Severity ($ in billions) ¹ Indemnity Medical Workers Comp Claim Severity Rising (1) Sources: IBISWorld, “Third Party Administrators – Insurance Claims Adjusters in the US Industry Report”, September 2020; NCCI, “2020 State of the Line Guide”, May 2020
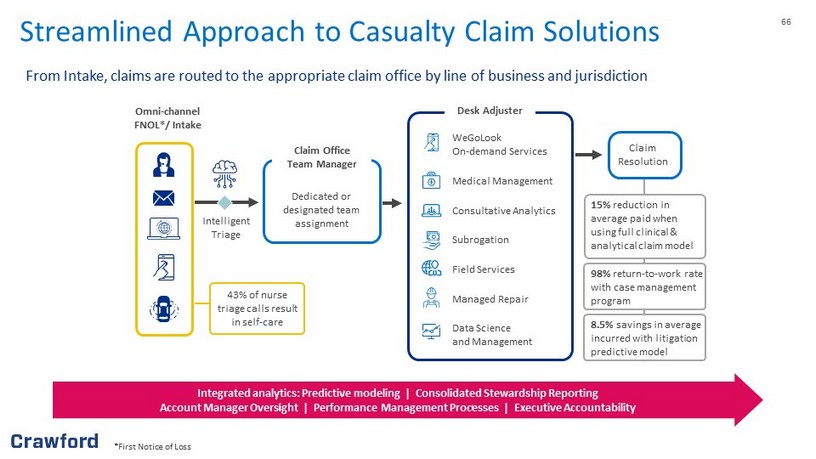
66 15% reduction in average paid when using full clinical & analytical claim model 98% return - to - work rate with case management program 8.5% savings in average incurred with litigation predictive model Claim Resolution Desk Adjuster Omni - channel FNOL*/ Intake Intelligent Triage WeGoLook On - demand Services Medical Management Consultative Analytics Subrogation Field Services Managed Repair Data Science and Management Dedicated or designated team assignment Claim Office Team Manager Integrated analytics: Predictive modeling | Consolidated Stewardship Reporting Account Manager Oversight | Performance Management Processes | Executive Accountability 43% of nurse triage calls result in self - care Streamlined Approach to Casualty Claim Solutions From Intake, claims are routed to the appropriate claim office by line of business and jurisdiction *First Notice of Loss
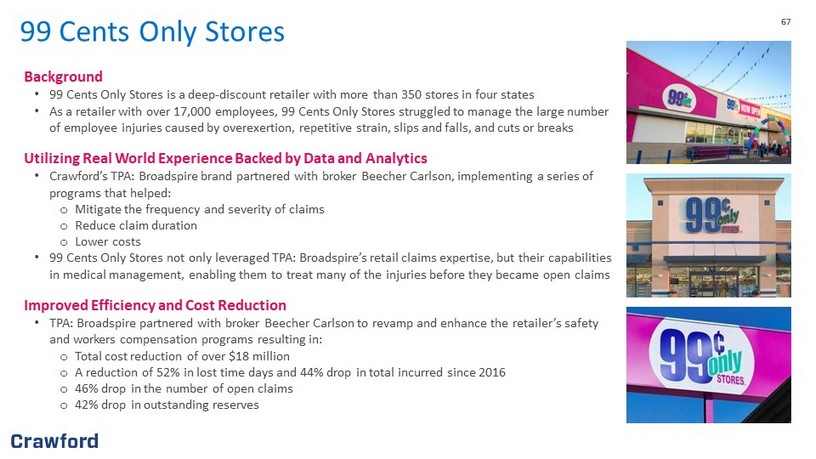
67 67 99 Cents Only Stores Background • 99 Cents Only Stores is a deep - discount retailer with more than 350 stores in four states • As a retailer with over 17,000 employees, 99 Cents Only Stores struggled to manage the large number of employee injuries caused by overexertion, repetitive strain, slips and falls, and cuts or breaks Utilizing Real World Experience Backed by Data and Analytics • Crawford’s TPA: Broadspire brand partnered with broker Beecher Carlson, implementing a series of programs that helped: o Mitigate the frequency and severity of claims o Reduce claim duration o Lower costs • 99 Cents Only Stores not only leveraged TPA: Broadspire’s retail claims expertise, but their capabilities in medical management, enabling them to treat many of the injuries before they became open claims Improved Efficiency and Cost Reduction • TPA: Broadspire partnered with broker Beecher Carlson to revamp and enhance the retailer’s safety and workers compensation programs resulting in: o Total cost reduction of over $18 million o A reduction of 52% in lost time days and 44% drop in total incurred since 2016 o 46% drop in the number of open claims o 42% drop in outstanding reserves

68 Conclusion

69 69 Experienced leadership team averaging 30 years of experience in our field Secular tailwinds provided from continued growth in large loss claims Investing in digitization as a point of differentiation and driver of growth Well - positioned to benefit from a fragmented and consolidating market Long - term commitment to generating shareholder value Balance sheet strength and stability provides strategic optionality Committed to the integration of ESG best practices across our operations Why Invest in Crawford? Crawford’s leading market position in an evolving landscape provides a compelling investment narrative

70 70 Employee Health & Safety Protect our workforce first and foremost Customer Excellence Provide best - in - class service to our clients regardless of the global environment Brands, Relationships & Differentiation Maintain industry leadership through our innovations and market leading solutions Future Growth Deliver superior results for our shareholders 2021 Priorities

71 Appendix A: Full Year 2020 Consolidated Financial Results

72 72 (1) See appendix for non - GAAP explanation and reconciliation of non - GAAP measures. 72 Year Ended December 31 , December 31 , ($ in millions, except per share amounts) 20 20 201 9 % Change Revenues $ 982.5 $ 1,005.8 (2%) Net Income Attributable to Shareholders of Crawford & Company $ 28.3 $12.5 127% Diluted Earnings per Share CRD - A $0. 54 $0.26 108% CRD - B $0. 52 $0. 19 174% Non - GAAP Diluted Earnings per Share 1 CRD - A $0. 86 $0. 87 (1%) CRD - B $0. 84 $0. 79 6% Adjusted Operating Earnings 1 $ 71.8 $ 77.6 (7%) Adjusted Operating Margin 1 7.3 % 7.7 % (40b ps ) Adjusted EBITDA 1 $ 104.8 $ 112.0 (6%) Adjusted EBITDA Margin 1 10.7 % 11.1 % (40bps) Full Year 2020 Financial Summary

73 73 (1) See Appendix for non - GAAP explanation and reconciliation 73 Unaudited ($ in thousands) December 31 , 20 20 December 31, 201 9 Change Cash and cash equivalents $ 44,656 $ 51,802 $ (7,146 ) Accounts receivable, net 123,060 128,217 ( 5,157 ) Unbilled revenues, net 103,528 103,894 (366) Total receivables 226,588 232,111 ( 5,523 ) Goodwill 66,537 80,642 ( 14,105 ) Intangible assets arising from business acquisitions, net 71,176 75,083 ( 3,907 ) Deferred revenues 51,369 5 2,368 (999 ) Pension liabilities 53,886 65,909 ( 12,023 ) Short - term borrowings and current portion of finance leases 1,837 28,546 (26,709 ) Long - term debt, less current portion 111,758 148,408 (36,650 ) Total debt 113,595 1 76,954 (63,359) Total stockholders' equity attributable to Crawford & Company 186,939 1 59,317 27,622 Net debt 1 68,939 1 25,152 (56,213 ) Balance Sheet Highlights

74 74 (1) See Appendix for non - GAAP explanation and reconciliation 74 Unaudited ($ in thousands) 20 20 201 9 Change Net Income Attributable to Shareholders of Crawford & Company $ 28,296 $ 12,485 $ 15,811 Goodwill Impairment 17,674 17,484 190 Gain on Disposition of Businesses, Net (13,763 ) — (13,763 ) Depreciation and Other Non - Cash Operating Items 34,269 44,703 (10,434 ) Billed Receivables Change 5,063 5,922 (859 ) Unbilled Receivables Change (3,762 ) 5,302 (9,064 ) Change in Accrued Compensation , 401K , and Other Payroll 8,295 1,656 6,639 Change in Accrued and Prepaid Income Taxes 9,311 ( 5,985 ) 15,296 Other Working Capital Changes 17,250 ( 5,627 ) 22,877 U.S. and U.K. Pension Contributions ( 9,455 ) ( 724 ) (8,731 ) Cash Flows from Operating Activities 93,178 75,216 17,962 Property & Equipment Purchases, net ( 14,226 ) ( 8,688 ) (5,538 ) Capitalized Software (internal and external costs) ( 23,154 ) (12,436 ) (10,718 ) Free Cash Flow 1 $ 55,798 $ 54,092 $ 1,706 For the year to date periods ended December 3 1, Operating and Free Cash Flow

75 Appendix B: Global Service Lines

76 76 76 Highlights • Launched new digital solutions across all our operations • Focused on expanding through recruitment of teams and M&A in GTS • Solid margin expansion during 2020 Operating Results (FY 2020 v. FY 2019) • Revenues of $438.5 million versus $457.5 million • Gross profit of $118.9 million versus 116.8 million • Gross profit margin of 27.1% versus 25.5% • Operating earnings of $41.1 million versus $30.1 million • Operating margin of 9.4% versus 6.6% Year ended (in thousands, except percentages) December 31, 2020 December 31 , 201 9 Variance Revenues $ 438,491 $ 457,484 (4.2%) Direct expenses 319,638 340,657 (6.2%) Gross profit 118,853 116,827 1.7 % Indirect expenses 77,749 86,702 (10.3 % ) Operating earnings $ 41,104 $30,125 36.4% Gross profit margin 27.1% 25.5% 1.6 % Operating margin 9.4% 6.6% 2.8 % Total cases received 337,937 354,852 (4.8%) Full time equivalent employees 3,327 3 , 429 (3.0%) Crawford Loss Adjusting

77 77 77 Highlights • Launched cutting - edge estimate review platform in Contractor Connection • Traction with new carrier clients in the US delivered the strongest second half in recent history for Contractor Connection • Highest ever look volume in 2020 for WeGoLook , driven by improved client uptake • Strong growth in the Networks business driven by weather activity and increased revenue from two of the top five U.S. insurance carriers Operating Results (FY 2020 v. FY 2019) • Revenues of $172.6 million versus $150.7 million • Gross profit of $43.6 million versus $41.9 million • Gross profit margin of 25.3% versus 27.8% • Operating earnings of $27.7 million versus $26.7 million • Operating margin of 16.0% versus 17.7% Year ended (in thousands, except percentages) December 31, 2020 December 31 , 201 9 Variance Revenues $ 172,609 $ 150,692 14.5 % Direct expenses 128,990 108,748 18.6 % Gross profit 43,619 41,944 4.0 % Indirect expenses 15,969 15,267 4.6% Operating earnings $ 27,650 $ 26,677 3.6 % Gross profit margin 25.3% 27.8% (2.5%) Operating margin 16.0% 17.7% (1.7%) Total cases received 444,633 422,233 5.3 % Full time equivalent employees 1,086 1,114 (2.5 % ) Crawford Platform Solutions

78 78 78 Highlights • Ongoing investment in new technologies and client service capabilities • US client retention for 2020 was 96% • Focused on digitization and developing integrated solutions for our global clients Operating Results (FY 2020 v. FY 2019) • Revenues of $371.4 million versus $397.6 million • Gross profit of $76.7 million versus $89.3 million • Gross profit margin of 20.6% versus 22.5% • Operating earnings of $20.5 million versus $28.5 million • Operating margin of 5.5% versus 7.2% Year ended (in thousands, except percentages) December 31, 2020 December 3 1 , 201 9 Variance Revenues $ 371,392 $ 397,626 ( 6.6 %) Direct expenses 294,727 308,350 (4.4 % ) Gross profit 76,665 89,276 (14.1%) Indirect expenses 56,158 60,770 (7.6 % ) Operating earnings $ 20,507 $ 28,506 (28.1%) Gross profit margin 20.6% 22.5% (1.9%) Operating margin 5.5% 7.2% (1.7%) Total cases received 779,123 822,691 (5.3%) Full time equivalent employees 3 , 128 3 , 156 ( 0.9 %) Crawford TPA: Broadspire

79 Appendix C: Non - GAAP Financial Information
80 80 Measurements of financial performance not calculated in accordance with GAAP should be considered as supplements to, and not sub stitutes for, performance measurements calculated or derived in accordance with GAAP. Any such measures are not necessarily comparable to other similar ly - titled measurements employed by other companies. Reimbursements for Out - of - Pocket Expenses In the normal course of our business, our operating segments incur certain out - of - pocket expenses that are thereafter reimbursed by our clients. Under GAAP, these out - of - pocket expenses and associated reimbursements are required to be included when reporting expenses and revenues, respectively, in our co nsolidated results of operations. In this presentation, we do not believe it is informative to include in reported revenues the amounts of reimbursed expenses and rela ted revenues, as they offset each other in our consolidated results of operations with no impact to our net income or operating earnings. As a result, unless noted in this pre sentation, revenue and expense amounts exclude reimbursements for out - of - pocket expenses. Net Debt Net debt is computed as the sum of long - term debt, capital leases and short - term borrowings less cash and cash equivalents. Man agement believes that net debt is useful because it provides investors with an estimate of what the Company's debt would be if all available cash was used to pay down the debt o f t he Company. The measure is not meant to imply that management plans to use all available cash to pay down debt . Free Cash Flow Management believes free cash flow is useful to investors as it presents the amount of cash the Company has generated that ca n b e used for other purposes, including additional contributions to the Company's defined benefit pension plans, discretionary prepayments of outstanding borrowings under our c red it agreement, and return of capital to shareholders, among other purposes. It does not represent the residual cash flow of the Company available for discretionary expenditures. Segment and Consolidated Operating Earnings Operating earnings is the primary financial performance measure used by our senior management and chief operating decision ma ker to evaluate the financial performance of our Company and operating segments, and make resource allocation and certain compensation decisions. Management believes operatin g e arnings is useful to others in that it allows them to evaluate segment and consolidated operating performance using the same criteria our management and chief operating decisio n m aker use. Consolidated operating earnings represent segment earnings including certain unallocated corporate and shared costs and credits, but before net corporate int ere st expense, stock option expense, amortization of customer - relationship intangible assets, goodwill impairment, certain tax valuation allowances, restructuring and other costs, a rbitration and claim settlements, gain on disposition of businesses, income taxes and net income or loss attributable to noncontrolling interests. Appendix: Non - GAAP Financial Information

81 81 Segment and Consolidated Gross Profit Gross profit is defined as revenues less direct expenses which exclude indirect overhead expenses allocated to the business. Ind irect expenses consist of centralized administrative support costs, regional and local shared services that are allocated to each segment based on usage. Adjusted EBITDA Adjusted EBITDA is used by management to evaluate, assess and benchmark our operational results and the Company believes that ad justed EBITDA is relevant and useful information widely used by analysts, investors and other interested parties. Adjusted EBITDA is defined as net income attributable to sh are holders of the Company with recurring adjustments for depreciation and amortization, net corporate interest expense, income taxes, stock - based compensation expense and foreign exchan ge fluctuations. Additionally, adjustments for non - recurring expenses for goodwill impairment, certain tax valuation allowances, restructuring and other costs, gain on disposit ion of businesses, and arbitration and claim settlements have been included in the calculation of adjusted EBITDA. Adjusted EBITDA is not a term defined by GAAP and as a result our m eas ure of adjusted EBITDA might not be comparable to similarly titled measures used by other companies. Adjusted Revenue, Operating Earnings, Pretax Earnings, Net Income, Diluted Earnings per Share and EBITDA Included in non - GAAP adjusted measurements as an add back or subtraction to GAAP measurements, are impacts of the goodwill impai rment, restructuring and other costs, gain on disposition of businesses, arbitration and claim settlements, and foreign exchange impacts, which arise from non - core items not directly related to our normal business or operations, or our future performance. Management believes it is useful to exclude these charges when comparing net income and diluted earni ngs per share across periods, as these charges are not from ordinary operations. Appendix: Non - GAAP Financial Information (cont.)
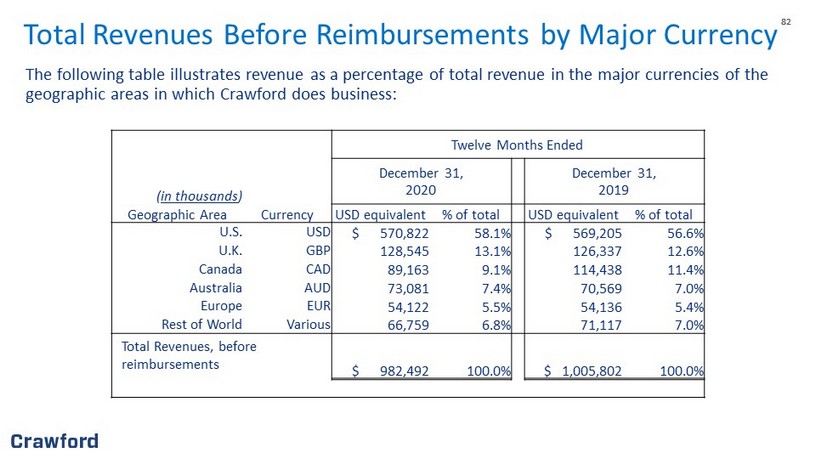
82 82 Total Revenues Before Reimbursements by Major Currency The following table illustrates revenue as a percentage of total revenue in the major currencies of the geographic areas in which Crawford does business: Twelve Months Ended ( in thousands ) December 31, 2020 December 31, 2019 Geographic Area Currency USD equivalent % of total USD equivalent % of total U.S. USD $ 570,822 58.1% $ 569,205 56.6% U.K. GBP 128,545 13.1% 126,337 12.6% Canada CAD 89,163 9.1% 114,438 11.4% Australia AUD 73,081 7.4% 70,569 7.0% Europe EUR 54,122 5.5% 54,136 5.4% Rest of World Various 66,759 6.8% 71,117 7.0% Total Revenues, before reimbursements $ 982,492 100.0% $ 1,005,802 100.0%
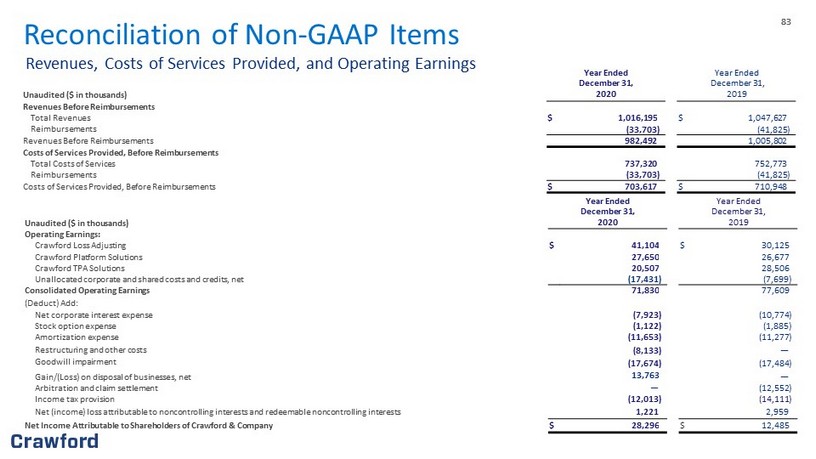
83 83 Year Ended Yea r Ended December 3 1 , December 31 , Unaudited ($ in thousands) 20 20 20 19 Revenues Before Reimbursements Total Revenues $ 1,016,195 $ 1,047,627 Reimbursements ( 33,703 ) ( 41,825 ) Revenues Before Reimbursements 982,492 1,005,802 Costs of Services Provided, Before Reimbursements Total Costs of Services 737,320 752,773 Reimbursements ( 33,703 ) ( 41,825 ) Costs of Services Provided, Before Reimbursements $ 703,617 $ 710,948 Year Ended Year Ended December 31 , December 3 1 , Unaudited ($ in thousands) 20 20 2 019 Operating Earnings: Crawford Loss Adjusting $ 41,104 $ 30,125 Crawford Platform Solutions 27,650 26,677 Crawford TPA Solutions 20,507 28,506 Unallocated corporate and shared costs and credits, net (17,431 ) (7,699 ) Consolidated Operating Earnings 71,830 77,609 (Deduct) Add: Net corporate interest expense ( 7 , 923 ) ( 10,774 ) Stock option expense ( 1,122 ) (1,885 ) Amortization expense ( 11,653 ) ( 11,277 ) Restructuring and other costs ( 8,133 ) — Goodwill impairment ( 17,674 ) ( 17,484 ) Gain/(Loss) on disposal of businesses, net 13,763 — Arbitration and claim settlement — ( 12,552 ) Income ta x provision (12,013 ) (14,111 ) Net (income) loss attributable to noncontrolling interests and redeemable noncontrolling interests 1,221 2,959 Net Income Attributable to Shareholders of Crawford & Company $ 28,296 $ 12,485 Reconciliation of Non - GAAP Items Revenues, Costs of Services Provided, and Operating Earnings

84 84 ) Year Ended December 31 , December 3 1 , Unaudited ($ in thousands) 20 20 201 9 Net income (loss) attributable to shareholders of Crawford & Company $ 28,296 $ 12,485 Add: Depreciation and amortization 40,111 40,513 Stock - based compensation 4,384 14,109 Net corporate interest expense 7 , 923 10,774 Restructuring and other costs 8,133 — Goodwill impairment 17,674 17,484 Arbitration and claim settlements — 12,552 Gain on disposition of businesses, net (13,763 ) — Tax valuation allowances — 1,991 Income tax provision 12,013 12,120 Adjusted EBITDA $ 104,771 $ 112,028 Reconciliation of Non - GAAP Items (cont.) Adjusted EBITDA

85 85 December 31 , December 31, Unaudited ($ in thousands) 20 20 201 9 Net Debt Short - term borrowings $ 1,570 $ 2 8,531 Current installments of finance leases and other obligations 267 15 Long - term debt and finance leases, less current installments 111,758 1 48 , 408 Total debt 113,595 1 76 , 954 Less: Cash and cash equivalents 44,656 51,802 Net debt $ 68,939 $ 125,152 Reconciliation of Non - GAAP Items (cont.) Net Debt

86 86 Year ended ( $ in thousands) December 31 , 20 20 December 31 , 20 29 Segment gross profit: Crawford Loss Adjusting $ 118,853 $ 116,827 Crawford Platform Solutions 43,619 41,944 Crawford TPA Solutions 76,665 89,276 Segment gross profit 239 , 137 248,047 Segment indirect costs: Crawford Loss Adjusting ( 77,749 ) ( 86 , 702 ) Crawford Platform Solutions ( 15 , 969 ) ( 15 , 267 ) Crawford TPA Solutions (56 , 158 ) ( 60 , 770 ) Unallocated corporate and shared costs, net (17,431 ) (7,699 ) Consolidated operating earnings 71,830 77,609 Net corporate interest expense ( 7 , 923 ) ( 10 , 774 ) Stock option expense ( 1,122 ) ( 1,885 ) Amortization expense ( 11 , 653 ) ( 11 , 277 ) Restructuring and other costs ( 8,133 ) — Goodwill impairment ( 17,674 ) ( 17,484 ) Arbitration and claim settlements — ( 12,552 ) Gain on disposition of businesses, net 13,763 — Income tax provision (12,013 ) (14,111 ) Net (income) loss attributable to noncontrolling interests and redeemable noncontrolling interests 1,221 2,959 Net income attributable to shareholders of Crawford & Company $ 28,296 $ 12,485 Reconciliation of Non - GAAP Items (cont.) Segment Gross Profit

87 87 Year Ended December 3 1 , 20 20 Unaudited ($ in thousands) Revenues Non - GAAP Operating Earnings Pretax Earnings Net Income Attributable to Crawford & Company Diluted Earnings per CRD - A Share Diluted Earnings per CRD - B Share GAAP $ 982,492 $ 71,830 $ 39,088 $ 28,296 $ 0. 54 $ 0. 52 Adjustments: Amortization of Intangible Assets — — 11,653 8,740 0.16 0.16 Goodwill impairment — — 17,674 14,209 0.27 0.27 Restructuring and other costs, net — — 8,133 4,927 0.09 0.09 Gain on disposition of businesses, net — — (13,763 ) (10,807 ) (0.20 ) (0.20 ) Non - GAAP Adjusted $ 982,492 $ 71,830 $ 62,785 $ 45,365 $ 0. 86 $ 0. 84 Year Ended December 3 1 , 201 9 Unaudited ($ in thousands) Revenues Non - GAAP Operating Earnings Pretax Earnings Net Income Attributable to Crawford & Company Diluted Earnings per CRD - A Share Diluted Earnings per CRD - B Share GAAP $ 1,005,802 $ 77,609 $ 23,637 $ 12,485 $ 0.26 $ 0.19 Adjustments: Amortization of Intangible Assets — — 11,277 8,459 0.16 0.15 Goodwill impairment — — 17,484 13,057 0.24 0.24 Arbitration and claim settlements — — 12,552 9,276 0.17 0.17 Tax valuation allowances — — — 1,991 0.04 0.04 Non - GAAP Adjusted $ 1,005,802 $ 77,609 $ 64,950 $ 45,268 $ 0. 87 $ 0.79 Reconciliation of Full Year Non - GAAP Results

88 Appendix D: Additional Case Studies

89 89 Quantifiable Impact on Savings & Policyholder Experience Case Study: Florida Carrier Claim Operations Takeover Carrier Requirements Self - Service On - Demand Managed Repair 3,500 hurricane claims taken over Reduced cycle time Florida, North Carolina & South Carolina 90% Claim Volume Reduced claim costs (LAE) $ Impact Drivers Results 27% Reduction in Cycle Time 23% Reduction in LAE 8% Estimate Accuracy Improvement 10 Approximate Days to Stand Up Solution

90 Challenge A large insurance carrier, facing strong regional competition, seeks to address quality issues prompted by depleted resources and disparate pricing. Solution Crawford established a remote office in proximity of the carrier, staffed by a dedicated workforce of adjusters and claims managers. This centralized team enhanced operating procedures, including implementing a central intake and communication channel, which ensured consistent work quality. Dedicated team eliminates quality concerns facing carrier Competition| Crawford Claims Solutions | HUB Results 4K+ claims processed three months after implementation 90% of Hurricane Florence claims closed within 60 days

91 Challenge A national staffing firm was experiencing long claim durations and high numbers of older, open claims. TPA: Broadspire and the client established goals including a 6% reduction in loss pick and a 15% reduction in open inventory. Solution TPA: Broadspire’s claims director worked with internal teams to implement predictive modeling as a way to identify claims for faster closure. As a result, the client saw earlier referrals to case management and even surpassed their original, aggressive goals. Expediting return - to - work with predictive analytics Workers Compensation | TPA: Broadspire | Data and Analytics Results 6% reduction in loss pick 22% reduction in open inventory

92 Challenge A national discount retailer was experiencing an unusually high rate of workers compensation claims. If not addressed immediately, the company would suffer significant financial losses putting the business as risk. Solution Crawford leveraged its TPA division, Broadspire, to implement our senior nurse review program to help direct effective medical management relief at key inflection points and identify similar patterns to avoid future injuries. Nurses heal financial burden Nationwide Network | Medical Bill Review | Return - to - Work Program Results 46% reduction in open claims 50% reduction in lost time days $30M in savings since partnering with Crawford

93 High - value quality and efficiency High Net Worth | Contractor Connection | Emergency Services Challenge An electrical fire caused more than $1M in damage to the home of a high - profile celebrity property owner. There was significant structural and smoke damage throughout the home, and high - value cars and auto lifts were destroyed. The insurance carrier needed a trusted partner to deliver speed, accuracy and world - class customer service from first - notice - of - loss to finished repair. Solution An emergency services contractor completed a site inspection and began work within one hour of receiving the claim. The services included air purification and pack - out of salvageable contents. The extensive cleaning process was completed in a month. Once cleaning was complete, a credentialed, trusted general contractor was assigned to complete repairs and restore the home to its original condition. A site inspection and estimate was completed the same day the assignment was received, and work to restore the property began within several days. Results $1M Total cost of repairs 1 Hour On - site emergency response time 1 day Estimate upload time
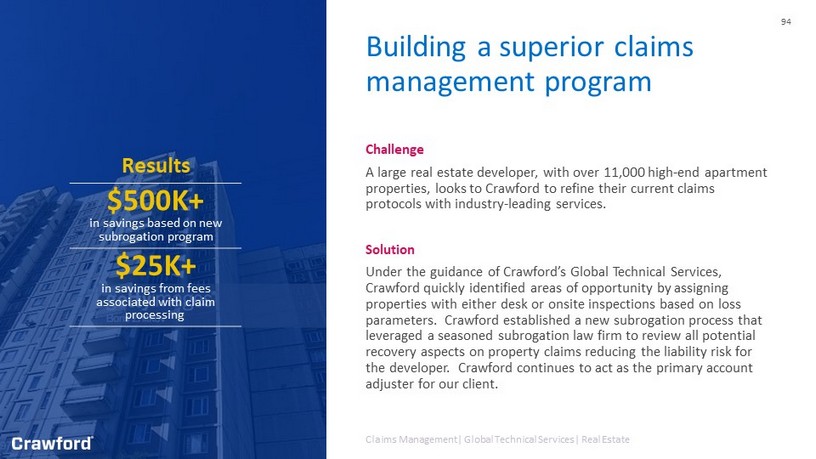
94 Challenge A large real estate developer, with over 11,000 high - end apartment properties, looks to Crawford to refine their current claims protocols with industry - leading services. Solution Under the guidance of Crawford’s Global Technical Services, Crawford quickly identified areas of opportunity by assigning properties with either desk or onsite inspections based on loss parameters. Crawford established a new subrogation process that leveraged a seasoned subrogation law firm to review all potential recovery aspects on property claims reducing the liability risk for the developer. Crawford continues to act as the primary account adjuster for our client. Building a superior claims management program Claims Management| Global Technical Services| Real Estate Results $500K+ in savings based on new subrogation program $25K+ in savings from fees associated with claim processing