Attached files
| file | filename |
|---|---|
| EX-99.1 - EX-99.1 - ZIONS BANCORPORATION, NATIONAL ASSOCIATION /UT/ | exh991earningsrelease20216.htm |
| 8-K - 8-K - ZIONS BANCORPORATION, NATIONAL ASSOCIATION /UT/ | zion-20210719.htm |

July 19, 2021 Second Quarter 2021 Financial Review

2 Forward-Looking Statements; Use of Non-GAAP Financial Measures Forward Looking Information This presentation includes “forward-looking statements” as that term is defined in the Private Securities Litigation Reform Act of 1995. These statements are based on management’s current expectations and assumptions regarding future events or determinations, all of which are subject to known and unknown risks, uncertainties and other factors that may cause our actual results, performance or achievements, market trends, industry results or regulatory outcomes to differ materially from those expressed or implied by such forward-looking statements. Forward-looking statements include, among others: ▪ statements with respect to the Bank’s beliefs, plans, objectives, goals, targets, commitments, designs, guidelines, expectations, anticipations, and future financial condition, results of operations and performance; and ▪ statements preceded by, followed by, or that include the words “may,” “might,” “can,” “continue,” “could,” “should,” “would,” “believe,” “anticipate,” “estimate,” “forecasts,” “expect,” “intend,” “target,” “commit,” “design,” “plan,” “projects,” “will,” and the negative thereof and similar words. Forward-looking statements are not guarantees of future performance, nor should they be relied upon as representing management’s views as of any subsequent date. Actual results and outcomes may differ materially from those presented. Important risk factors that may cause such material differences include changes in general economic, regulatory, and industry conditions; changes and uncertainties in fiscal, monetary, regulatory, trade and tax policies and legislative and regulatory changes; changes in interest rates and uncertainty regarding the transition away from the London Interbank Offered Rate ("LIBOR") toward other alternative reference rates; the quality and composition of our loan and securities portfolios; competitive pressures and other factors that may affect aspects of our business, such as pricing and demand for our products and services; our ability to execute our strategic plans, manage our risks, and achieve our business objectives; our ability to develop and maintain information security systems, technologies and controls designed to guard against fraud, cyber and privacy risks; and the effects of the COVID-19 pandemic or other national or international crises or conflicts that may occur in the future and governmental responses to such matters. These factors, among others, are discussed in the Bank’s most recent Annual Report on Form 10-K and Quarterly Report on Form 10-Q, filed with the Securities and Exchange Commission (SEC) and available at the SEC’s Internet site (https://www.sec.gov/). In addition, you may obtain documents filed with the SEC by the Bank free of charge by contacting: Investor Relations, Zions Bancorporation, N.A., One South Main Street, 11th Floor, Salt Lake City, Utah 84133, (801) 844-7637. We caution you against undue reliance on forward-looking statements, which reflect our views only as of the date they are made. Except as may be required by law, Zions Bancorporation, N.A. specifically disclaims any obligation to update any factors or to publicly announce the result of revisions to any of the forward-looking statements included herein to reflect future events or developments. Use of Non-GAAP Financial Measures: This document contains several references to non-GAAP measures, including pre-provision net revenue and the “efficiency ratio,” which are common industry terms used by investors and financial services analysts. Certain of these non-GAAP measures are key inputs into Zions’ management compensation and are used in Zions’ strategic goals that have been and may continue to be articulated to investors. Therefore, the use of such non-GAAP measures are believed by management to be of substantial interest to the consumers of these financial disclosures and are used prominently throughout the disclosures. A full reconciliation of the difference between such measures and GAAP financials is provided within the document, and users of this document are encouraged to carefully review this reconciliation.

✓ Earnings and Profitability: ▪ $2.08 diluted earnings/share compared to $1.90 ▪ $339 million Pre-Provision Net Revenue ▪ $290 million Adjusted PPNR(1) ▪ Includes adjustment for accruals for investment and advisory expenses related to the unrealized gain on an SBIC investment ▪ ($123) million provision for credit loss compared to ($132) million ▪ $345 million Net Income Applicable to Common, up from $314 million ✓ Credit quality (excluding PPP Loans): ▪ 0.67% of NPAs+90 days past due / non-PPP loans and leases and OREO, improved by 4 basis points, or 6% ▪ 2 basis points net recoveries (annualized) ▪ Decrease in the allowance for credit loss (“ACL”), to $574 million or 1.22% of non-PPP loans, reflecting the recent improvement in the economic outlook, and credit quality and composition of the loan portfolio 3 Second Quarter 2021 Financial Highlights Vs. 1Q21, improved earnings due to the net gain on an investment in the SBIC portfolio and the acceleration of PPP income recognition due to forgiveness lead to stronger capital ratios Note: For the purposes of comparison in this presentation, we generally use linked-quarter ("LQ"), due to that being the preferred comparison for professional investors and analysts. (1) Adjusted for items such as severance costs, restructuring costs, other real estate expense, pension termination-related expense, securities gains and losses, and accruals for investment and advisory expenses related to the unrealized gain on an SBIC investment. See Appendix for GAAP to non-GAAP reconciliation tables. ✓ Loans and Deposits: ▪ 3.9% decline in period-end loan balances ▪ 0.1% decline in period-end loan balances (excluding PPP loans) ▪ 3.0% period-end total deposit growth ▪ 6.3% period-end total noninterest-bearing deposit growth ▪ 68% period-end loan-to-deposit ratio ▪ 0.04% cost of total deposits ✓ Capital Strength: ▪ 11.3% Common Equity Tier 1 Ratio (CET1), up from 11.2% ▪ 12.3% (CET1+Allowance for Credit Losses) / Risk-Weighted Assets ▪ Repurchased $100 million of common stock during 2Q21 ▪ Called / redeemed Series H preferred shares ($126 million)

$0.34 $1.01 $1.66 $1.90 $2.08 2Q20 3Q20 4Q20 1Q21 2Q21 Diluted Earnings Per Share Notable Items: ▪ 2Q21: ▪ $0.25 per share benefit from IPO of an SBIC investment (Recursion Pharmaceuticals, Inc.) ▪ $0.02 per share adverse effect from a credit valuation adjustment on client-related interest rate swaps (“CVA”) ▪ 1Q21: ▪ $0.08 per share benefit from CVA ▪ $0.05 per share benefit from securities gains ▪ 4Q20: $0.09 per share benefit from securities gains and CVA ▪ 3Q20: ▪ $0.14 per share adverse impact from one-time charitable contribution related to PPP lending activity ▪ $0.06 per share benefit on CVA and securities gains ▪ 2Q20: ▪ $0.13 per share adverse impact from pension termination-related expense ▪ $0.07 per share adverse impact from CVA and securities losses 4 Vs. 1Q21, EPS positively impacted primarily by securities gains and accelerated recognition of PPP income Diluted Earnings per Share Note: EPS calculations assume a 24.5% statutory tax rate

0.35% 0.89% 1.41% 1.57% 1.65% 2Q20 3Q20 4Q20 1Q21 2Q21 3.81% 10.96% 17.80% 20.20% 21.60% 2Q20 3Q20 4Q20 1Q21 2Q21 Balance Sheet Profitability 5 Profitability in 2Q21 improved predominantly due to securities gains and accelerated recognition of PPP income Return on Assets Return on Tangible Common Equity

6 Credit Quality Ratios Credit quality continues to show improvement, with YTD annualized net charge-offs at just 0.03% of loans Key Credit Metrics: ▪ Classified loans/loans: 3.3% ▪ NPAs+90(1)/loans + OREO: 0.67% ▪ Annualized net loan losses (recoveries): ▪ (0.02)% of average loans in 2Q21 ▪ 0.15% net charge-offs of average loans over the last 12 months Allowance for credit losses: ▪ 1.22% of total loans and leases (1) Nonperforming assets plus accruing loans that were ≥ 90 days past due. Note: Net Charge-offs/Loans ratio is annualized for all periods shown. Credit Quality 0.0% 0.5% 1.0% 1.5% 2.0% 2.5% 3.0% 3.5% 4.0% 2Q20 3Q20 4Q20 1Q21 2Q21 Classified / Loans NPAs +90/ Loans + OREO ACL / Loans All Ratios Exclude PPP Loans 0.25% 0.43% 0.13% 0.07% -0.02% 1.36% 0.46% -0.56% -1.11% -1.05% NCOs / Loans (ann.) Provision/Avg Loans (ann.)
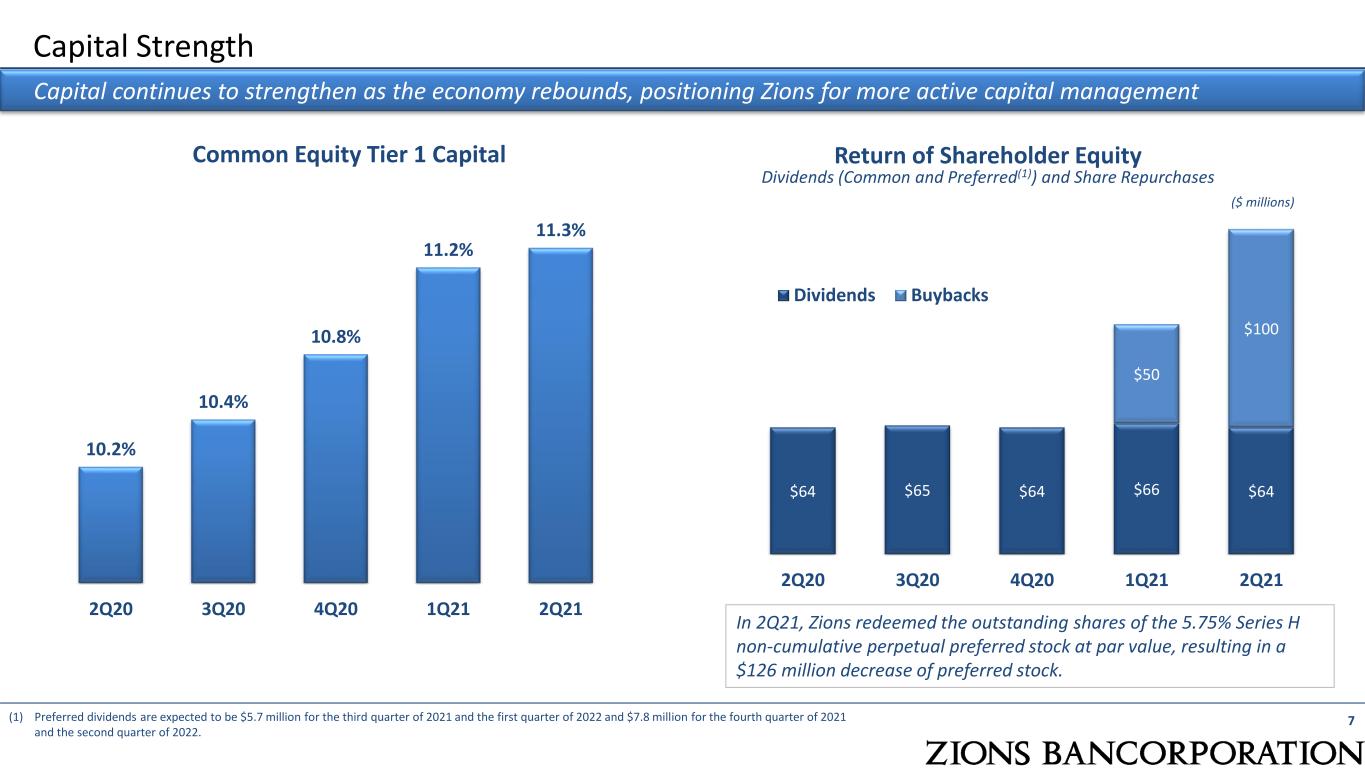
Capital Strength 7 Capital continues to strengthen as the economy rebounds, positioning Zions for more active capital management Common Equity Tier 1 Capital Return of Shareholder Equity Dividends (Common and Preferred(1)) and Share Repurchases 10.2% 10.4% 10.8% 11.2% 11.3% 2Q20 3Q20 4Q20 1Q21 2Q21 $64 $65 $64 $66 $64 $50 $100 2Q20 3Q20 4Q20 1Q21 2Q21 Dividends Buybacks ($ millions) (1) Preferred dividends are expected to be $5.7 million for the third quarter of 2021 and the first quarter of 2022 and $7.8 million for the fourth quarter of 2021 and the second quarter of 2022. In 2Q21, Zions redeemed the outstanding shares of the 5.75% Series H non-cumulative perpetual preferred stock at par value, resulting in a $126 million decrease of preferred stock.

Adjusted Pre-Provision Net Revenue 8 Adjusted PPNR aided by PPP related revenues (23% of adjusted PPNR) (1) Adjusted for items such as severance costs, restructuring costs, other real estate expense, pension termination-related expense, securities gains and losses, and accruals for investment and advisory expenses related to the unrealized gain on an SBIC investment. See Appendix for GAAP to non-GAAP reconciliation table. Notable Items: ▪ 2Q21 Adjusted PPNR excludes the net unrealized gain from the successful completion of an IPO of an SBIC investment ▪ Interest Income from PPP Loans net the professional services expense associated with PPP forgiveness: ▪ 2Q21: $67 million ($68 million income less $1 million professional service expense) ▪ 1Q21: $52 million ($60 million less $8 million) ▪ 4Q20: $52 million ($55 million less $3 million) ▪ 3Q20: $52 million ▪ 2Q20: $39 million ▪ 3Q20: $30 million adverse impact from a one-time charitable contribution related to PPP lending activity $39 $52 $52 $52 $67 $300 $267 $280 $253 $290 $0 $50 $100 $150 $200 $250 $300 $350 2Q20 3Q20 4Q20 1Q21 2Q21 Interest Income from PPP Loans net professional services expense associated with PPP forgiveness Adjusted PPNR (non-GAAP) Adjusted PPNR(1) ($ millions)

Success Story: Summary of Paycheck Protection Program Loans 9 PPP lending success from Zions’ ability to link front line bankers and borrowers with an agile technology deployment Zions PPP Loans Approved New-to- Bank Customers Forgiveness Applications Received(1) Forgiveness Applications Approved by SBA(1) ~77,000 loans ~20,000 ~40,700 ~37,500 $9.9 billion $6.0 billion $5.3 billion Source: SBA PPP Report and internal data. (1) As of June 30, 2021 $5,016 $6,771 $6,310 $6,135 $5,945 3.14% 3.03% 3.50% 3.98% 4.56% 2Q20 3Q20 4Q20 1Q21 2Q21 Average PPP Loans Loan Yields 10th Ranked 10th Nationally In PPP loan dollars originated of consolidated 2020 and 2021 SBA PPP loans

Success Story: Paycheck Protection Program Customers – Enhanced Relationships 10 Zions has focused on strengthening relationships and providing new services to customers New Services Utilized by PPP Customers 0 5,000 10,000 15,000 20,000 25,000 30,000 2Q20 3Q20 4Q20 1Q21 2Q21 New Customers - New Services Existing Customers - New Services New revenue generating services include: ▪ New accounts (checking or loan) ▪ Account analysis / Treasury Internet Banking ▪ ACH and wire transfers / Remote Deposit Capture ▪ Wealth Management / Credit Cards 20,000 57,000 New-to-Bank Customers Existing Customers PPP Loans (Prior to Forgiveness)
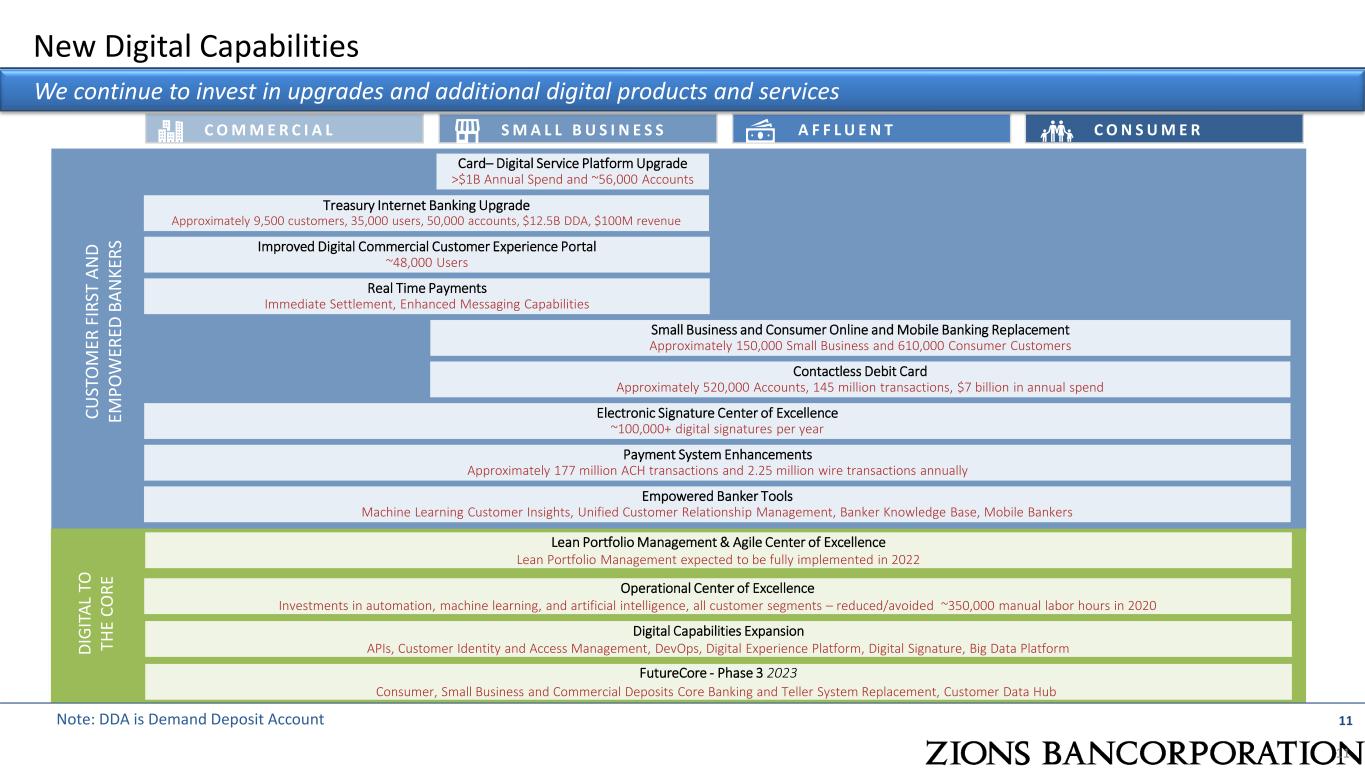
11 New Digital Capabilities C U ST O M ER F IR ST A N D EM P O W ER ED B A N K ER S A F F L U E N TC O M M E R C I A L S M A L L B U S I N E S S C O N S U M E R D IG IT A L TO TH E C O R E Real Time Payments Immediate Settlement, Enhanced Messaging Capabilities Payment System Enhancements Approximately 177 million ACH transactions and 2.25 million wire transactions annually Treasury Internet Banking Upgrade Approximately 9,500 customers, 35,000 users, 50,000 accounts, $12.5B DDA, $100M revenue Lean Portfolio Management & Agile Center of Excellence Lean Portfolio Management expected to be fully implemented in 2022 Contactless Debit Card Approximately 520,000 Accounts, 145 million transactions, $7 billion in annual spend Improved Digital Commercial Customer Experience Portal ~48,000 Users Digital Capabilities Expansion APIs, Customer Identity and Access Management, DevOps, Digital Experience Platform, Digital Signature, Big Data Platform FutureCore - Phase 3 2023 Consumer, Small Business and Commercial Deposits Core Banking and Teller System Replacement, Customer Data Hub Card– Digital Service Platform Upgrade >$1B Annual Spend and ~56,000 Accounts Operational Center of Excellence Investments in automation, machine learning, and artificial intelligence, all customer segments – reduced/avoided ~350,000 manual labor hours in 2020 Electronic Signature Center of Excellence ~100,000+ digital signatures per year Small Business and Consumer Online and Mobile Banking Replacement Approximately 150,000 Small Business and 610,000 Consumer Customers Empowered Banker Tools Machine Learning Customer Insights, Unified Customer Relationship Management, Banker Knowledge Base, Mobile Bankers 11 We continue to invest in upgrades and additional digital products and services Note: DDA is Demand Deposit Account

$49.3 $48.2 $47.7 $47.5 $46.8 $5.0 $6.8 $6.3 $6.1 $5.9 3.83% 3.68% 3.71% 3.73% 3.77% $0.0 $25.0 $50.0 $75.0 2Q20 3Q20 4Q20 1Q21 2Q21 Average Total Loans Excluding PPP Loans, Yield: 3.67% in 2Q21 Average PPP Loans, Yield: 4.56% in 2Q21 Average Loan and Deposit Growth Average Total Loans Loan Yields Average Total Deposits Cost of Total Deposits 12 Linked quarter average non-PPP loans declined 1.5% in 2Q21; average deposits increased 4.5% $33.9 $35.7 $36.2 $37.7 $38.1 $29.1 $30.8 $32.0 $33.7 $36.5 0.15% 0.11% 0.08% 0.05% 0.04% $0.0 $25.0 $50.0 $75.0 2Q20 3Q20 4Q20 1Q21 2Q21 Average Noninterest-bearing Deposits Average Interest-bearing Deposits ($ billions) ($ billions)
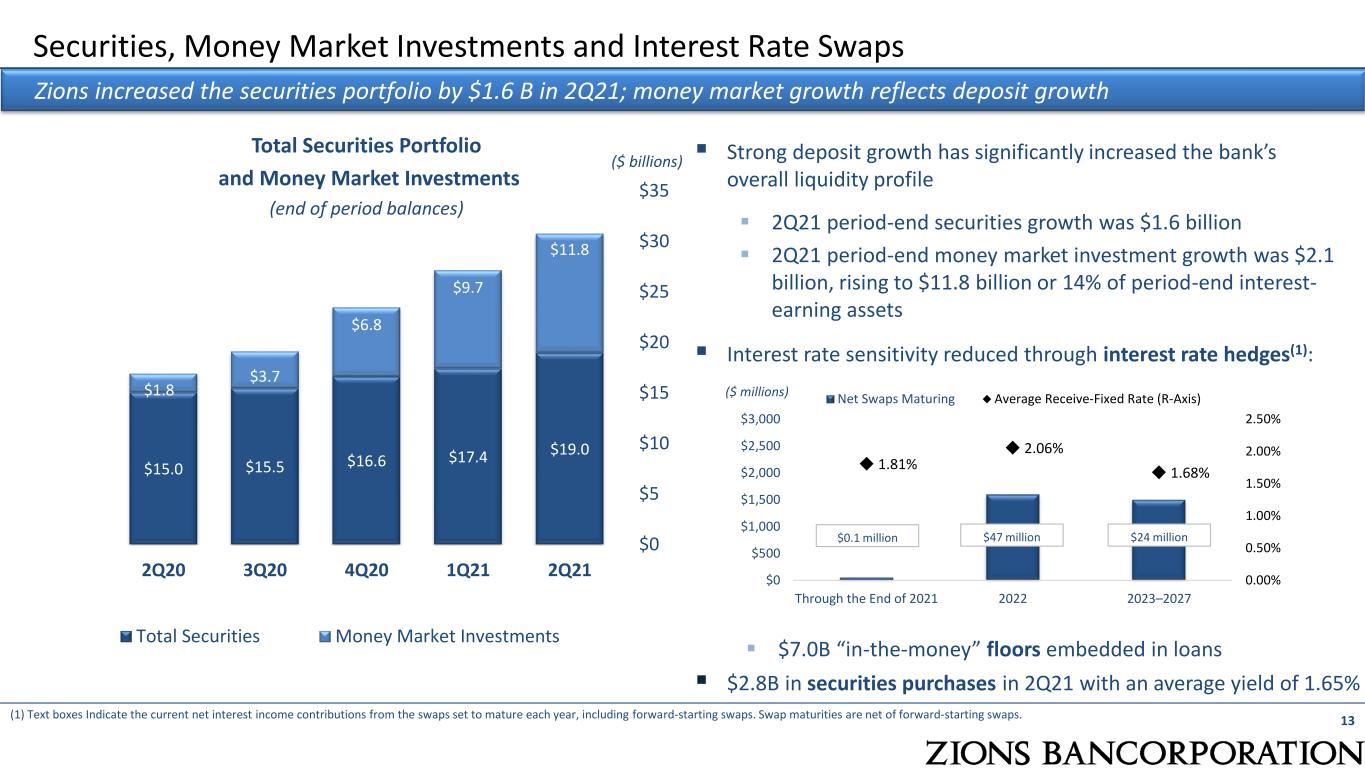
Securities, Money Market Investments and Interest Rate Swaps 13 Total Securities Portfolio and Money Market Investments (end of period balances) $15.0 $15.5 $16.6 $17.4 $19.0 $1.8 $3.7 $6.8 $9.7 $11.8 $0 $5 $10 $15 $20 $25 $30 $35 2Q20 3Q20 4Q20 1Q21 2Q21 Total Securities Money Market Investments ($ billions) Zions increased the securities portfolio by $1.6 B in 2Q21; money market growth reflects deposit growth ▪ Strong deposit growth has significantly increased the bank’s overall liquidity profile ▪ 2Q21 period-end securities growth was $1.6 billion ▪ 2Q21 period-end money market investment growth was $2.1 billion, rising to $11.8 billion or 14% of period-end interest- earning assets ▪ Interest rate sensitivity reduced through interest rate hedges(1): ▪ $7.0B “in-the-money” floors embedded in loans ▪ $2.8B in securities purchases in 2Q21 with an average yield of 1.65% 1.81% 2.06% 1.68% 0.00% 0.50% 1.00% 1.50% 2.00% 2.50% $0 $500 $1,000 $1,500 $2,000 $2,500 $3,000 Through the End of 2021 2022 2023–2027 Net Swaps Maturing Average Receive-Fixed Rate (R-Axis) $0.1 million $47 million $24 million ($ millions) (1) Text boxes Indicate the current net interest income contributions from the swaps set to mature each year, including forward-starting swaps. Swap maturities are net of forward-starting swaps.

$563 $555 $550 $545 $555 3.23% 3.06% 2.95% 2.86% 2.79% 2Q20 3Q20 4Q20 1Q21 2Q21 Net Interest Income Net Interest Income Net Interest Margin 14 Net interest income stability assisted by PPP success ($ millions) Net Interest Margin 1Q21 2Q21 Securities Loan Yields Interest Bearing Deposits As of June 30, 2021, unamortized net origination fees related to the PPP loans totaled approximately $137 million, to be amortized over the remaining life (4.5 years) or when loans pay down, pay off, or are forgiven by the SBA. Average money market investments increased to 12.7% of average interest-earning assets in 2Q21, compared with 10.0% in 1Q21, which had a seven-basis point linked quarter dilutive effect on the net interest margin. Money market invest- ments Strong deposit growth resulted in strong money market investment and securities portfolio growth

4 8 % 1 2 % 1 0 % 8 % 1 1 % 1 1 % 2 9 % 1 5 % 1 1 % 9 % 2 4 % 1 2 % ≤ 3m 4-12m 1-2 yrs 2-3 yrs 3-5 yrs > 5 yrs Pe rc en t o f Lo an s Loans: Rate Reset and Cash Flow Profile Loans After Hedging Interest Rate Sensitivity 15 The low interest rate environment and surge in deposits has resulted in increased asset sensitivity Source: Company filings and S&P Global; “Prior Fed Cycle” refers to 3Q15-2Q19, reflecting the lag effect of deposit pricing relative to Fed Funds rates. The “Current Fed Cycle” begins in 3Q19 to present. (1) 12-month simulated impact of an instantaneous and parallel change in interest rates. Loans are assumed to experience prepayments, amortization and maturity events, in addition to interest rate resets in chart on the right. The loan and securities portfolios have durations of 2.0 and 3.5 years, respectively. -5% 12% 24% −100 bps +100 bps +200 bps Net Interest Income Sensitivity (1) A ss u m ed H is to ri ca l In the down 100 scenario, models assume rates do not fall below zero 18% 21% 15% 14% 1% Prior Fed Cycle (+225 bps) Current Fed Cycle (-225 bps) +200 bps +100 bps −100 bps Total Deposit Betas

$130 $139 $139 $133 $139 2Q20 3Q20 4Q20 1Q21 2Q21 Customer-related fee income increased from the prior quarter due to: ▪ Increased card fee income, up $3 million (15%) due to increased customer spending ▪ Increased loan syndication income ▪ Partial offset to strengths from lower linked-quarter income from mortgage banking activity Over the longer term, customer-related fees are benefitting from improved mortgage banking, capital markets, and wealth management activity Noninterest Income 16 Customer-Related Fee Income (1) Total customer-related fee income increased 5% from 1Q21 primarily due to an increase in card fee income (1) Reflects total customer-related noninterest income, which excludes items such as fair value and non-hedge derivative income, securities gains (losses), and other items, as detailed in the Noninterest Income table located in the earnings release. ($ millions)

$ 4 3 0 $ 4 4 2 $ 4 2 4 $ 4 3 5 $ 4 2 8 $ 4 0 2 $ 4 4 0 $ 4 2 3 $ 4 4 0 $ 4 1 9 2Q20 3Q20 4Q20 1Q21 2Q21 NIE (GAAP) Adjusted NIE (Non-GAAP) ($ millions) Noninterest Expense 17 Decline in expense in 2Q21 reflects decreases in seasonal compensation and professional services ▪ Total noninterest expense decreased 2% over the prior quarter, primarily due to seasonally high levels in 1Q ▪ Total adjusted noninterest expense decreased 5% over the prior quarter, predominately due to: ▪ Reduced seasonal expense (payroll taxes, equity grant expense) ▪ Reduced professional services (lower third-party assistance assoc. with PPP loan forgiveness, see slide 8) ▪ Notable items in: ▪ 2Q21: $9 million success fee accrual related to the IPO of an SBIC investment ▪ 3Q20: $30 million from one-time charitable contribution related PPP lending activity (not reflected in Adjusted NIE) ▪ 2Q20: $28 million of expense from termination of the defined benefit pension plan (1) Adjusted for items such as severance, provision for unfunded lending commitments, securities gains and losses and investment, and accruals for investment and advisory expenses related to the unrealized gain on an SBIC investment. See Appendix for GAAP to non-GAAP reconciliation table. Noninterest Expense (NIE) (1)

18 Allowance for Credit Loss (“ACL”) Reserve decrease from 1Q21 reflects improvement in experienced and expected economic conditions $526 $777 $914 $917 $835 $695 $574 1.08 1.56 1.88 1.91 1.74 1.48 1.22 1/1/20 CECL 1Q20 2Q20 3Q20 4Q20 1Q21 2Q21 Allowance for Credit Loss ACL (%) ex-PPP The change in 2Q21 ACL from 1Q21 reflects: ▪ Continued improvement in economic outlook and credit quality ▪ Change in portfolio size, mix, and aging • Changes to economic forecasts • Economic uncertainty • New loans & renewals • Portfolio mix • Aging of existing loans • Draws, pay-offs, etc. • Other qualitative • Changes in credit quality • Changes in specific reserves CECL Economic Forecast Assumptions • Probability weighting of four economic scenarios • Reasonable and supportable forecast period: 12 months; reversion to long- term average: 12 months • Economic factors vary depending upon the type of loan, but include various combinations of national, state, and MSA-level forecasts for variables such as unemployment, real estate price indices, energy prices, GDP, etc. • Currently the Base scenario shows strong growth in 2021 and then steady economic improvement through 2022 and 2023 ($ millions) ($ millions)

Financial Outlook (2Q 2022E vs 2Q 2021A) 19 Outlook Comments Slightly to Moderately Increasing ▪ Slight to moderate growth in the next twelve months, excluding PPP loans Moderately Increasing ▪ Assumes benchmark rates generally consistent with the forward curve ▪ Excludes PPP loan income Moderately Increasing ▪ Customer-related fees excludes securities gains and dividends Slightly Increasing ▪ 2Q22 expected to be slightly higher than 2Q21’s $419 million adjusted NIE ▪ Improved confidence in the economic outlook combined with rising capital ratios expected to allow for more active capital management Customer-Related Fees Loan Balances Net Interest Income Capital Management Adjusted Noninterest Expense
▪ Financial Results Summary ▪ Loan Growth ▪ GAAP to Non-GAAP Reconciliation 20 Appendix

Financial Results Summary 21 Solid and improving fundamental performance Three Months Ended (Dollar amounts in millions, except per share data) June 30, 2021 March 31, 2021 December 31, 2020 Earnings Results: Diluted Earnings Per Share $ 2.08 $ 1.90 $ 1.66 Net Earnings Applicable to Common Shareholders 345 314 275 Net Interest Income 555 545 550 Noninterest Income 205 169 166 Noninterest Expense 428 435 424 Pre-Provision Net Revenue - Adjusted (1) 290 253 280 Provision for Credit Losses (123) (132) (67) Ratios: Return on Assets(2) 1.65 % 1.57 % 1.41 % Return on Common Equity(3) 18.6 % 17.4 % 15.3 % Return on Tangible Common Equity(3) 21.6 % 20.2 % 17.8 % Net Interest Margin 2.79 % 2.86 % 2.95 % Yield on Loans 3.77 % 3.73 % 3.71 % Yield on Securities 1.71 % 1.77 % 1.81 % Average Cost of Total Deposits(4) 0.04 % 0.05 % 0.08 % Efficiency Ratio (1) 59.1 % 63.5 % 60.2 % Effective Tax Rate 22.2 % 21.7 % 20.9 % Ratio of Nonperforming Assets to Loans, Leases and OREO 0.60 % 0.61 % 0.69 % Annualized Ratio of Net Loan and Lease Charge-offs to Average Loans (0.02) % 0.06 % 0.11 % Common Equity Tier 1 Capital Ratio(5) 11.3% 11.2% 10.8% (1) Adjusted for items such as severance costs, restructuring costs, other real estate expense, pension termination-related expense, securities gains and losses and investment and advisory expense related to the successful IPO of the SBIC investment. See Appendix for GAAP to non-GAAP reconciliation tables. (2) Net Income before Preferred Dividends or redemption costs used in the numerator; (3) Net Income Applicable to Common used in the numerator; (4) Includes noninterest-bearing deposits; (5) Current period ratios and amounts represent estimates
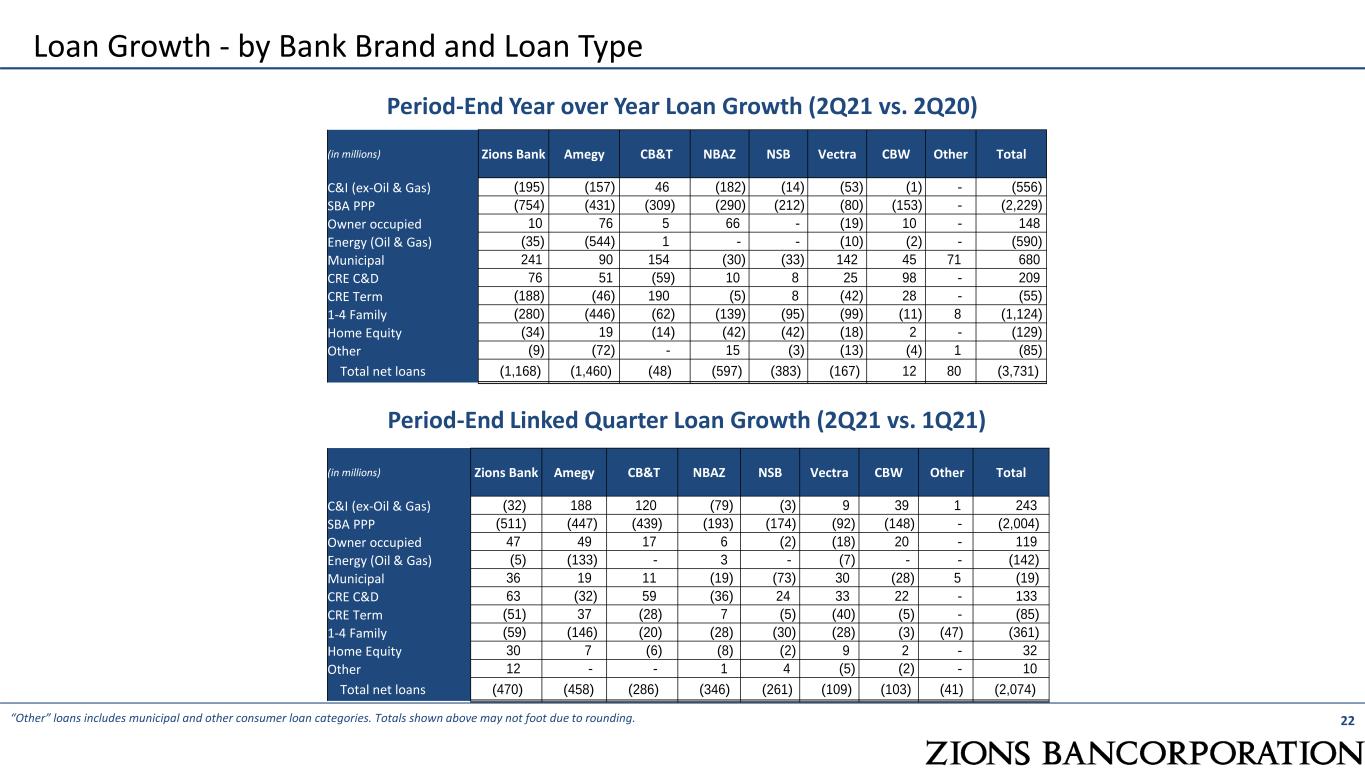
22 Loan Growth - by Bank Brand and Loan Type “Other” loans includes municipal and other consumer loan categories. Totals shown above may not foot due to rounding. Period-End Year over Year Loan Growth (2Q21 vs. 2Q20) Period-End Linked Quarter Loan Growth (2Q21 vs. 1Q21) (in millions) Zions Bank Amegy CB&T NBAZ NSB Vectra CBW Other Total C&I (ex-Oil & Gas) (32) 188 120 (79) (3) 9 39 1 243 SBA PPP (511) (447) (439) (193) (174) (92) (148) - (2,004) Owner occupied 47 49 17 6 (2) (18) 20 - 119 Energy (Oil & Gas) (5) (133) - 3 - (7) - - (142) Municipal 36 19 11 (19) (73) 30 (28) 5 (19) CRE C&D 63 (32) 59 (36) 24 33 22 - 133 CRE Term (51) 37 (28) 7 (5) (40) (5) - (85) 1-4 Family (59) (146) (20) (28) (30) (28) (3) (47) (361) Home Equity 30 7 (6) (8) (2) 9 2 - 32 Other 12 - - 1 4 (5) (2) - 10 Total net loans (470) (458) (286) (346) (261) (109) (103) (41) (2,074) (in millions) Zions Bank Amegy CB&T NBAZ NSB Vectra CBW Other Total C&I (ex-Oil & Gas) (195) (157) 46 (182) (14) (53) (1) - (556) SBA PPP (754) (431) (309) (290) (212) (80) (153) - (2,229) Owner occupied 10 76 5 66 - (19) 10 - 148 Energy (Oil & Gas) (35) (544) 1 - - (10) (2) - (590) Municipal 241 90 154 (30) (33) 142 45 71 680 CRE C&D 76 51 (59) 10 8 25 98 - 209 CRE Term (188) (46) 190 (5) 8 (42) 28 - (55) 1-4 Family (280) (446) (62) (139) (95) (99) (11) 8 (1,124) Home Equity (34) 19 (14) (42) (42) (18) 2 - (129) Other (9) (72) - 15 (3) (13) (4) 1 (85) Total net loans (1,168) (1,460) (48) (597) (383) (167) 12 80 (3,731)

23 GAAP to Non-GAAP Reconciliation (Amounts in millions) 2Q21 1Q21 4Q20 3Q20 2Q20 Efficiency Ratio Noninterest expense (GAAP) (1) (a) $ 428 $ 435 $ 424 $ 442 $ 430 Adjustments: Severance costs - - 1 1 - Other real estate expense - - 1 - - Debt extinguishment cost - - - - - Amortization of core deposit and other intangibles - - - - - Restructuring costs - - (1) 1 - Pension termination-related expense - (5) - - 28 SBIC Investment Success Fee Accrual 9 - - - - Total adjustments (b) 9 (5) 1 2 28 Adjusted noninterest expense (non-GAAP) (a) - (b) = (c) 419 440 423 440 402 Net Interest Income (GAAP) (d) 555 545 550 555 563 Fully taxable-equivalent adjustments (e) 7 8 7 7 6 Taxable-equivalent net interest income (non-GAAP) (d) + (e) = (f) 562 553 557 562 569 Noninterest income (GAAP) (1) (g) 205 169 166 157 117 Combined income (f) + (g) = (h) 767 722 723 719 686 Adjustments: Fair value and nonhedge derivative income (loss) (5) 18 8 8 (12) Equity securities gains (losses), net 63 11 12 4 (4) Total adjustments (i) 58 29 20 12 (16) Adjusted taxable-equivalent revenue (non-GAAP) (h) - (i) = (j) 709 693 703 707 702 Pre-provision net revenue (PPNR), as reported (h) – (a) $ 339 $ 287 $ 299 $ 277 $ 256 Adjusted pre-provision net revenue (PPNR) (j) - (c) $ 290 $ 253 $ 280 $ 267 $ 300 Efficiency Ratio (1) (c) / (j) 59.1 % 63.5 % 60.2 % 62.2 % 57.3 %

24 GAAP to Non-GAAP Reconciliation $ In millions except per share amounts 2Q21 1Q21 4Q20 3Q20 2Q20 Pre-Provision Net Revenue (PPNR) (a) Total noninterest expense $428 $435 $424 $442 $430 LESS adjustments: Severance costs - - 1 1 - Other real estate expense - - 1 - - Restructuring costs - - (1) 1 - Pension termination-related expense - (5) - - 28 SBIC investment success fee accrual 9 (b) Total adjustments 9 (5) 1 2 28 (a)-(b)=(c) Adjusted noninterest expense 419 440 423 440 402 (d) Net interest income 555 545 550 555 563 (e) Fully taxable-equivalent adjustments 7 8 7 7 6 (d)+(e)=(f) Taxable-equivalent net interest income (TENII) 562 553 557 562 569 (g) Noninterest Income 205 169 166 157 117 (f)+(g)=(h) Combined Income $767 $722 $723 $719 $686 LESS adjustments: Fair value and nonhedge derivative income (loss) (5) 18 8 8 (12) Securities gains (losses), net 63 11 12 4 (4) (i) Total adjustments 58 29 20 12 (16) (h)-(i)=(j) Adjusted revenue $709 $693 $703 $707 $702 (j)-(c) Adjusted pre-provision net revenue (PPNR) $290 $253 $280 $267 $300 Net Earnings Applicable to Common Shareholders (NEAC) (k) Net earnings applicable to common 345 314 275 167 57 (l) Diluted Shares 163,054 163,887 163,900 163,779 164,425 GAAP Diluted EPS 2.08 1.90 1.66 1.01 0.34 PLUS Adjustments: Adjustments to noninterest expense 9 (5) 1 2 28 Adjustments to revenue (58) (29) (20) (12) 16 Tax effect for adjustments 12 8 5 3 (12) Preferred stock redemption - - - - - (m) Total adjustments (37) (26) (14) (7) 32 (k)+(m)=(n) Adjusted net earnings applicable to common (NEAC) 308 288 261 160 89 (n)/(l) Adjusted EPS 1.89 1.76 1.59 0.98 0.54 (o) Average assets 85,957 83,080 80,060 77,983 75,914 (p) Average tangible common equity 6,421 6,317 6,150 6,063 6,016 Profitability (n)/(o) Adjusted Return on Assets (annualized) 1.44% 1.38% 1.30% 0.82% 0.47% (n)/(p) Adjusted Return on Tangible Common Equity (annualized) 19.2% 18.2% 16.9% 10.6% 5.9% (c)/(j) Efficiency Ratio 59.1% 63.5% 60.2% 62.2% 57.3%
