Attached files
| file | filename |
|---|---|
| EX-99.1 - EXHIBIT 99.1 - PACWEST BANCORP | tm2122480d1_ex99-1.htm |
| 8-K - FORM 8-K - PACWEST BANCORP | tm2122480d1_8k.htm |
Exhibit 99.2

2021 Second Quarter Results Earnings Release Presentation July 19, 2021

Second Quarter 2021 | PACW | p. 2 Second Quarter Highlights • CET1 ratio of 10.41% • Total capital ratio of 14.99% • ACL ratio of 1.54%; 1.59% excluding PPP loans • Classified loans to total loans of 0.75% • Net recoveries of $5.2 million • Net recoveries to average loans and leases of 11bps • Classified loans of $147.3mm, a decline of 50% from 2Q20 high • Special mention loans of $536.1mm, a decline of 40% from 1Q20 high • 91% of deposits are core deposits; 38% are noninterest - bearing • Loans to deposit ratio of 66% Strong Balance Sheet Profitability • Net earnings of $180.5mm, or $1.52 per diluted share • Pre - provision, pre - tax net revenues (“PPNR”) of $154.9mm (1) • ROAA of 2.11% • ROATE of 29.25% (1) • Net interest income increased $5mm or 7.6% annualized • Net interest margin of 3.40%; negative impact from excess liquidity of approximately 73bps • Loan and lease yield of 5.18% • Cost of deposits of 10 bps • Efficiency ratio of 47.9% • Provision for credit losses benefit of $88mm Growth • Loan production of $1.7bn at weighted average rate of 4.55% • Loan Growth of $997 million or 22.3% annualized (excluding $470 million reduction in PPP loans) • Total assets increased $2.0bn or 6% compared to 1Q21 • Core deposits increased $1.5bn or 22.9% annualized • Total deposits increased $1.4bn or 20.2% annualized • Received regulatory approvals for the pending purchase of the Homeowners Association Business from MUFG Union Bank, N.A. with approximately $4.0bn of low cost deposits; close expected in 4Q21 (1) See “Non - GAAP Measurements” slides starting on page 25.

Second Quarter 2021 | PACW | p. 3 $19.7bn $19.0bn $19.1bn $19.0bn $19.5bn 1.63% 1.94% 1.93% 1.63% 1.19% 2Q20 3Q20 4Q20 1Q21 2Q21 Loans & Leases HFI, Net (3) $22.9bn $24.0bn $24.9bn $28.2bn $29.6bn 0.25% 0.17% 0.14% 0.11% 0.10% 2Q20 3Q20 4Q20 1Q21 2Q21 Core and Total Deposits (1)(2) $3.9 $4.5 $5.2 $5.9 $7.2 2.87% 2.52% 2.50% 2.44% 2.23% 2Q20 3Q20 4Q20 1Q21 2Q21 Total Investments and Yield Balance Sheet Highlights $381.6mm $442.5mm $433.8mm $383.0mm $300.2mm 2.06% 2.49% 2.41% 2.14% 1.59% 2Q20 3Q20 4Q20 1Q21 2Q21 Allowance for Credit Losses (4) (1) ■ Core Deposits ■ Non - core Deposits (2) Line is cost of total deposits (3) Line is ALLL as % of loans and leases, excluding PPP loans (4) Line is ACL as % of loans and leases, excluding PPP loans

Second Quarter 2021 | PACW | p. 4 $120.0mm $133.4mm $135.7mm $150.1mm $151.8mm 42.9% 45.1% 43.6% 46.4% 47.9% 2Q20 3Q20 4Q20 1Q21 2Q21 Operating Expenses & Efficiency Ratio Profitability Highlights $33.2mm $45.5mm $116.8mm $150.4mm $180.5mm $0.28 $0.38 $0.99 $1.27 $1.52 2Q20 3Q20 4Q20 1Q21 2Q21 Net Earnings & EPS 0.50% 0.65% 1.58% 1.94% 2.11% 6.39% 8.20% 19.63% 25.67% 29.25% 2Q20 3Q20 4Q20 1Q21 2Q21 2Q20 3Q20 4Q20 1Q21 2Q21 ROAA ROATE (1) $166.2mm $156.2mm $163.4mm $156.0mm $154.9mm 2.51% 2.22% 2.22% 2.01% 1.81% 2Q20 3Q20 4Q20 1Q21 2Q21 PPNR & PPNR ROAA (1) (1) See “Non - GAAP Measurements” slides starting on page 25.

Second Quarter 2021 | PACW | p. 5 0.25% 0.17% 0.14% 0.11% 0.10% 0.40% 0.29% 0.23% 0.17% 2Q20 3Q20 4Q20 1Q21 2Q21 Cost of Total Deposits PACW Avg. Total Deposits Cost KRX Median Deposits Cost 5.01% 5.00% 5.15% 5.20% 5.18% 4.02% 3.89% 4.00% 3.94% 2Q20 3Q20 4Q20 1Q21 2Q21 Loan Yield (TE) PACW TE Avg. KRX Median 4.20% 3.90% 3.83% 3.69% 3.40% 3.13% 3.03% 3.12% 3.06% 2Q20 3Q20 4Q20 1Q21 2Q21 Net Interest Margin (TE) PACW Reported TE NIM KRX Median NIM $254.3mm $251.3mm $259.2mm $261.3mm $266.3mm 2Q20 3Q20 4Q20 1Q21 2Q21 Net Interest Income Industry Leading Tax Equivalent Net Interest Margin Source: S&P Global Market Intelligence. Peer data is through 1Q21. Peer group is banks in the KBW Nasdaq Regional Bank Index – “KRX”.

Second Quarter 2021 | PACW | p. 6 8.00% 6.00% 4.50% 10.50% 8.50% 7.00% 14.99% 10.41% 10.41% Total Capital Tier 1 capital CET1 Capital Minimum Capital Conservation Buffer PACW Strong Capital Position Robust Capital Levels Highlights ▪ Raised $400 million of 3.25% sub - debt at the Bank level in April 2021 increasing total capital ▪ 2Q21 dividend of $0.25 per share, consistent with previous four quarters ▪ Elected CECL transition for regulatory capital relief in 2020. Retains ~ 14bps of CET1 and Tier 1 capital ▪ Capital ratio decreases in 1Q21 due primarily to the cash purchase of Civic ▪ Building capital ahead of using cash for purchase of MUFG Union Bank HOA Business acquisition in 4Q21 ▪ Capital levels remain sufficient in a severely adverse economic scenario $828mm $464mm $1,327mm Capital in Excess of Conservation Buffer $19.80 $20.09 $21.06 $20.39 $21.95 9.97% 10.46% 10.53% 10.39% 10.41% 13.18% 13.74% 13.76% 13.60% 14.99% 2Q20 3Q20 4Q20 1Q21 2Q21 Tangible BV and Capital Ratios Tangible BV per Share CET1 Capital Total Capital

Second Quarter 2021 | PACW | p. 7 $ Digital Innovation CLIENT - CENTRIC DIGITAL EXPERIENCE Simplified Digital Account Opening • Reimagined Experience Leveraging Data - driven Insights • Electronic Signatures and Records • Digital Forms Stronger Client Relationships Increased Cross - Selling Opportunities Seamless and Contextual Client Experience Accelerated Innovation Streamlined API Connectivity provides Flexibility and Choice • Accounting and ERP Platform Connectivity • HOA Platform Connectivity Delivers Segment Depth • Enhanced Payment Capability via Connectivity Solutions Modernized and Intuitive Digital Experience Across the Client Journey • Online and Mobile Banking • Merchant Services • Virtual Cards • Foreign Exchange ONBOARD | CONNECT | TRANSACT Leverage FinTech Partnerships to Deliver Digital Solutions Across the Client Journey

Second Quarter 2021 | PACW | p. 8 Commercial mortgage 19% Income producing and other residential 24% Commercial construction 5% Residential construction 13% Asset - based 18% Venture capital 9% Other commercial 10% Consumer 2% As of June 30, 2021 ($ in millions) $ Mix $ Mix Real Estate Mortgage: Commercial 3,792$ 19% 4,222$ 22% Income producing and other residential 4,621 24% 3,734 19% Total Real Estate Mortgage 8,413 43% 7,956 41% RE Construction & Land: Commercial 931 5% 1,168 6% Residential 2,575 13% 2,173 11% Total RE Construction & Land 3,506 18% 3,341 17% Total Real Estate 11,919 61% 11,297 58% Commercial: Asset-based 3,551 18% 3,413 17% Venture capital 1,749 9% 1,814 9% Other commercial 1,922 10% 2,760 14% Total Commercial 7,222 37% 7,987 40% Consumer 365 2% 411 2% Total Loans HFI (1) 19,506$ 100% 19,695$ 100% Unfunded commitments 7,892$ 7,746$ 6/30/2021 6/30/2020 Diversified Loan and Lease Portfolio (1) Net of deferred fees and costs
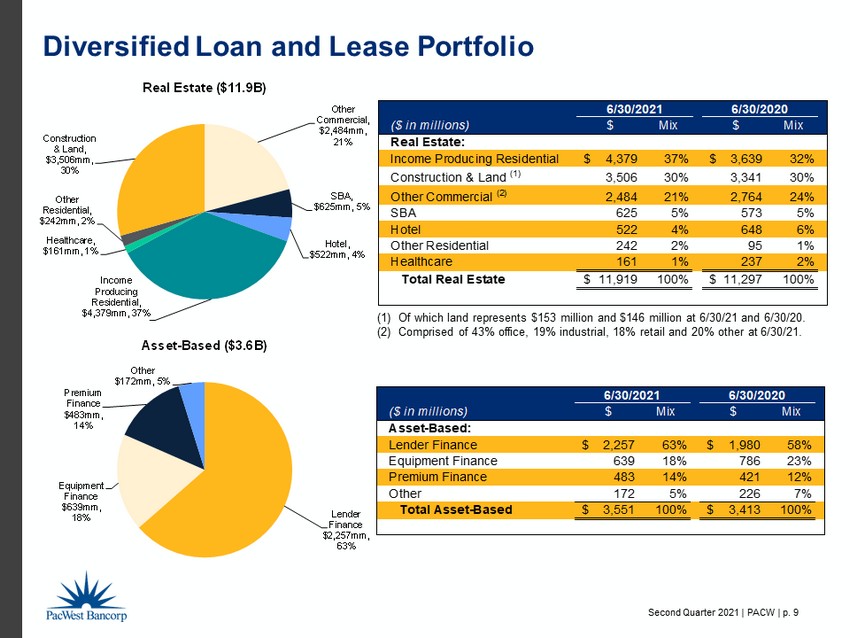
Second Quarter 2021 | PACW | p. 9 ($ in millions) $ Mix $ Mix Asset-Based: Lender Finance 2,257$ 63% 1,980$ 58% Equipment Finance 639 18% 786 23% Premium Finance 483 14% 421 12% Other 172 5% 226 7% Total Asset-Based 3,551$ 100% 3,413$ 100% 6/30/2021 6/30/2020 ($ in millions) $ Mix $ Mix Real Estate: Income Producing Residential 4,379$ 37% 3,639$ 32% Construction & Land (1) 3,506 30% 3,341 30% Other Commercial (2) 2,484 21% 2,764 24% SBA 625 5% 573 5% Hotel 522 4% 648 6% Other Residential 242 2% 95 1% Healthcare 161 1% 237 2% Total Real Estate 11,919$ 100% 11,297$ 100% 6/30/2021 6/30/2020 Other Commercial, $2,484mm, 21% SBA , $625mm , 5% Hotel , $522mm , 4% Income Producing Residential, $4,379mm, 37% Healthcare , $161mm , 1% Other Residential , $242mm , 2% Construction & Land , $3,506mm , 30% Real Estate ($11.9B) Lender Finance $2,257mm , 63% Equipment Finance $639mm , 18% Premium Finance $483mm , 14% Other $172mm , 5% Asset - Based ($3.6B) Diversified Loan and Lease Portfolio (1) Of which land represents $153 million and $146 million at 6/30/21 and 6/30/20. (2) Comprised of 43% office, 19% industrial, 18% retail and 20% other at 6/30/21.

Second Quarter 2021 | PACW | p. 10 ($ in millions) $ Mix $ Mix Venture Capital: Equity Fund Loans 1,245$ 71% 740$ 41% Venture Capital 504 29% 1,074 59% Total Venture Capital 1,749$ 100% 1,814$ 100% 6/30/2021 6/30/2020 ($ in millions) $ Mix $ Mix Other Commercial: Paycheck Protection Program 609$ 32% 1,211$ 44% Secured Business Loans 434 23% 502 18% Municipal 263 14% 154 6% Unsecured Business Loans 247 12% 213 8% Security Monitoring 207 11% 499 18% Other 162 8% 181 6% Total Other Commercial 1,922$ 100% 2,760$ 100% 6/30/2021 6/30/2020 Paycheck Protection Program , $609mm , 32% Secured Business Loans , $434mm , 23% Security Monitoring , $207mm , 11% Unsecured Business Loans , $247mm , 12% Municipal , $263mm , 14% Other , $162mm , 8% Other Commercial ($1.9B) Equity Fund Loans , $1,245mm , 71% Venture Capital , $504mm , 29% Venture Capital ($1.7B) Diversified Loan and Lease Portfolio

Second Quarter 2021 | PACW | p. 11 ($ in millions) Production/ Disbursements Payoffs/ Paydowns Net Difference Rate on Production (1) ($ in millions) Loans Beginning Balance (2) Loans Ending Balance (2) Quarterly Change (3) 2Q21 3,326$ 2,771$ 555$ 4.55% 2Q21 18,979$ 19,506$ 527$ 1Q21 2,636 2,702 (66) 4.36% 1Q21 19,083 18,979 (104) 4Q20 2,485 2,287 198 4.41% 4Q20 19,026 19,083 57 3Q20 1,528 2,144 (616) 4.95% 3Q20 19,695 19,026 (669) 2Q20 2,603 2,635 (32) 2.33% 2Q20 19,745 19,695 (50) $546 $520 $1,131 $1,232 $1,662 $800 $1,008 $1,354 $1,023 $1,664 $1,257 $0 $0 $381 $0 $613 $983 $1,330 $1,635 $1,969 $2,022 $1,161 $957 $1,067 $802 $2,603 $1,528 $2,485 $2,636 $3,326 $2,635 $2,144 $2,287 $2,702 $2,771 0.0% 1.0% 2.0% 3.0% 4.0% 5.0% 6.0% 7.0% $0 $500 $1,000 $1,500 $2,000 $2,500 $3,000 $3,500 2Q20 3Q20 4Q20 1Q21 2Q21 Avg. Rate on Production Millions Production Disbursements PPP Loans Payoffs Paydowns Rate on Production Loan and Lease Production of $1.7 Billion in 2Q21 (1) The weighted average TE rate on production presents contractual rates and does not include amortized fees. Amortized fees add ed approximately 41 basis points to loan yields in 2021 and 25 basis points in 2020. (2) Net of deferred fees and costs (3) “Quarterly Change” equals “Net Difference” plus transfers to loans held for sale, transfers to OREO, charge - offs and loan sales.

Second Quarter 2021 | PACW | p. 12 Multi - Family Apts, 57% Condominiums , 3% Hotel , 10% Office, 5% Industrial , 3% Retail , 1% Mixed - Use, 4% Land & Other, 7% SFR , 10% Commitments by Property Type Construction & Land Loans Nevada , 3% Other, 10% Florida, 6% Wash DC, 3% New York, 13% Colorado 7% Washington, 3% California , 50%% Georgia, 3% NJ, 2% Commitments by State Commitment Amount Count 6/30/21 Commitment 6/30/21 Outstanding 6/30/21 % of Tota l $0 ~ $10mm 104 $ 1,072mm $ 906mm 16% $10mm ~ $25mm 64 987mm 560mm 15% $25mm ~ $50mm 43 1,616mm 852mm 25% $50mm ~ $100mm 29 1,928mm 772mm 29% $100mm ~ $150mm 8 965mm 416mm 15% Total 248 $ 6,568mm $ 3,506mm LTC < 40 %, 4% LTC 40% - 50%, 9% LTC 50% - 60%, 47% LTC 60% - 70%, 25% LTC > 70%, 15% (2) Commitments By Loan - To - Cost Range (1) Risk Rating Count 6/30/21 Tota l Pass/Watch 234 $ 3,428mm Special Mention 7 76mm Classified 7 2mm Total 248 $ 3,506mm (1) Excludes $861mm of land and Civic commitments. (2) 62% of loans with LTC > 70% are for low income housing projects.

Second Quarter 2021 | PACW | p. 13 California, 49% Colorado , 9% Florida , 7% Washington , 5% Oregon , 3% New York , 8% Wash. DC , 3% Others , 16% $3.8bn (1) MF Construction Commitments Multi - Family Loans Principal Balance Amount Count 6/30/21 Tota l 6/30/21 % of Tota l $0 ~ $5mm 2,419 2,051mm 47% $5mm ~ $10mm 142 949mm 22% $10mm ~ $30mm 49 727mm 17% $30mm ~ $154mm 7 652mm 14% Total 2,617 $ 4,379mm California, 68% Washington , 6% Florida , 6% Oregon , 3% Virginia , 3% Colorado , 3% Others , 11% $4.4bn (2) Income Producing Residential Portfolio By State Income Producing Residential (1) MF construction commitments have an average loan - to - cost ratio of 62% as of June 30, 2021. (2) $1.8bn, or approximately 41%, of MF portfolio is 50% risk - weighted. (3) Included in MF construction commitments are $881mm of commitments to build low income housing MF projects with a weighted average LTC of 71%. LTC > 70% , 20% LTC 20% - 50% , 5% LTC 50% - 60% , 51% LTC 60% - 70% , 24% MF Construction Commitments By Loan - To - Cost Range (3) Risk Rating Count 6/30/21 Tota l Pass/Watch 2,583 $ 4,308mm Special Mention 14 61mm Classified 20 10mm Total 2,617 $ 4,379mm
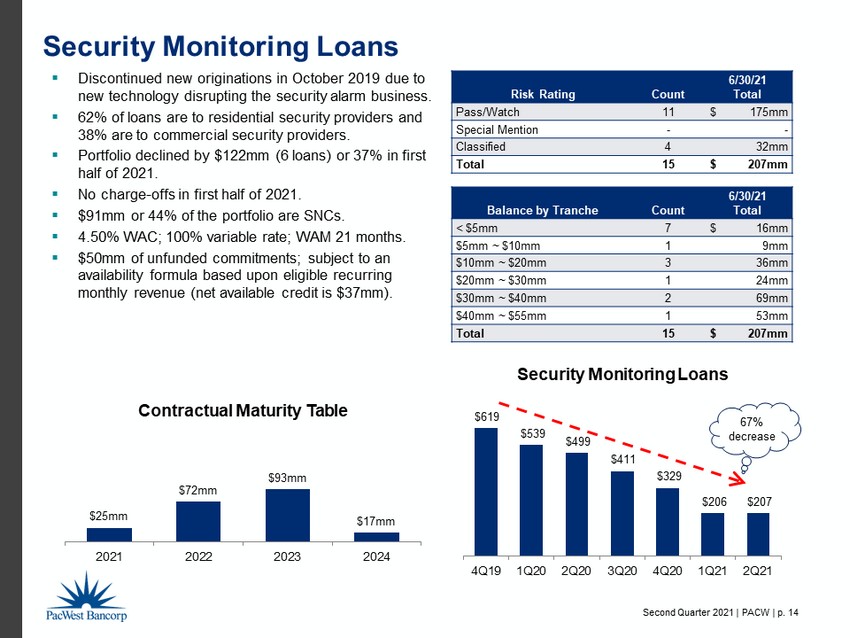
Second Quarter 2021 | PACW | p. 14 Security Monitoring Loans ▪ Discontinued new originations in October 2019 due to new technology disrupting the security alarm business. ▪ 62% of loans are to residential security providers and 38% are to commercial security providers. ▪ Portfolio declined by $122mm (6 loans) or 37% in first half of 2021. ▪ No charge - offs in first half of 2021. ▪ $91mm or 44% of the portfolio are SNCs. ▪ 4.50% WAC; 100% variable rate; WAM 21 months. ▪ $50mm of unfunded commitments; subject to an availability formula based upon eligible recurring monthly revenue (net available credit is $37mm). Risk Rating Count 6/30/21 Tota l Pass/Watch 11 $ 175mm Special Mention - - Classified 4 32mm Total 15 $ 207mm Balance by Tranche Count 6/30/21 Tota l < $5mm 7 $ 16mm $5mm ~ $10mm 1 9mm $10mm ~ $20mm 3 36mm $20mm ~ $30mm 1 24mm $30mm ~ $40mm 2 69mm $40mm ~ $55mm 1 53mm Total 15 $ 207mm $25mm $72mm $93mm $ 17mm 2021 2022 2023 2024 Contractual Maturity Table $619 $539 $499 $411 $329 $206 $207 4Q19 1Q20 2Q20 3Q20 4Q20 1Q21 2Q21 Security Monitoring Loans 67% decrease

Second Quarter 2021 | PACW | p. 15 COVID - Sensitive Portfolios Amounts in 000s Portfolio Classified Special Mention Pass Total % of Total Loans and Leases Hotel (1) $ 16,678 $ 224,812 $ 792,773 $ 1,034,264 5.3% Retail Commercial RE 233 1,449 432,533 434,215 2.2% Commercial Aviation 19,248 77,236 89,410 185,894 0.9% Restaurant 5,090 28,883 121,672 155,645 0.8% Total $ 41,249 $ 332,380 $ 1,436,388 $ 1,810,018 9.3% 2.3% 18.4% 79.3% Office Portfolio ▪ Monitoring this portfolio closely given the potential future implications of changes in the demand for office space due to remote/hybrid working arrangements; no impacts to date. ▪ Total office portfolio at June 30, 2021 is $1.3 billion (CRE, Construction, SBA) or 6.5% of total loans and leases. 65% of office portfolio is located in California. ▪ 99.8% of the portfolio is pass rated; $1.0 million of classified loans and $1.0 million of special mention loans at June 30, 2021. ▪ Weighted average loan - to - cost for office construction loans is 54.7%. ▪ Despite sensitivity to the COVID pandemic, these portfolios have performed better than expected but we continue to monitor closely. ▪ Total net charge - offs on these portfolios since 1Q20 have amounted to $1.2 million. (1) Includes Hotel CRE of $522 million, Hotel Construction of $483 million and Hotel SBA of $29 million .
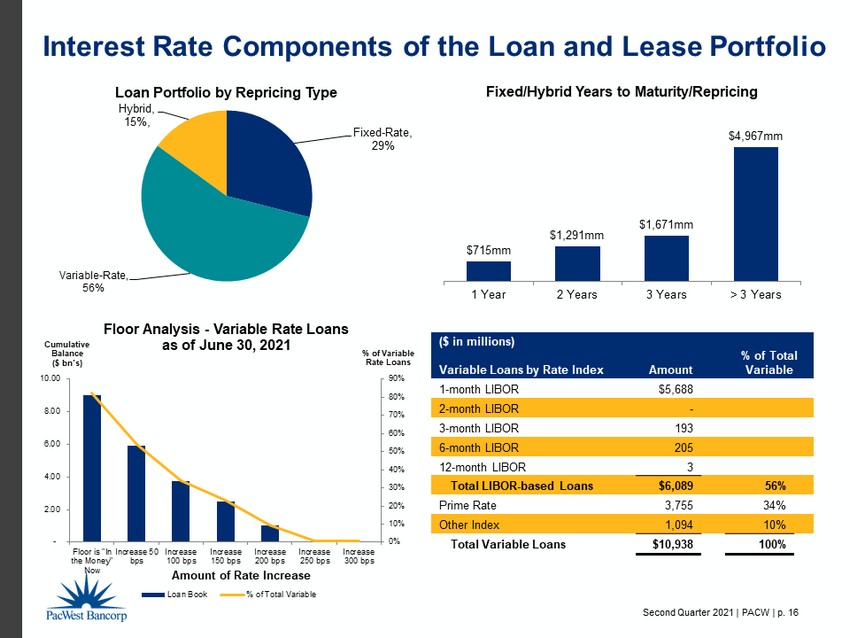
Second Quarter 2021 | PACW | p. 16 ($ in millions) Variable Loans by Rate Index Amount % of Total Variable 1 - month LIBOR $5,688 2 - month LIBOR - 3 - month LIBOR 193 6 - month LIBOR 205 12 - month LIBOR 3 Total LIBOR - based Loans $6,089 56% Prime Rate 3,755 34% Other Index 1,094 10% Total Variable Loans $10,938 100% Interest Rate Components of the Loan and Lease Portfolio Fixed - Rate , 29% Variable - Rate, 56% Hybrid , 15%, Loan Portfolio by Repricing Type 0% 10% 20% 30% 40% 50% 60% 70% 80% 90% - 2.00 4.00 6.00 8.00 10.00 Floor is "In the Money" Now Increase 50 bps Increase 100 bps Increase 150 bps Increase 200 bps Increase 250 bps Increase 300 bps % of Variable Rate Loans Cumulative Balance ($ bn’s ) Billions Amount of Rate Increase Floor Analysis - Variable Rate Loans as of June 30, 2021 Loan Book % of Total Variable $715mm $1,291mm $1,671mm $4,967mm 1 Year 2 Years 3 Years > 3 Years Fixed/Hybrid Years to Maturity/Repricing
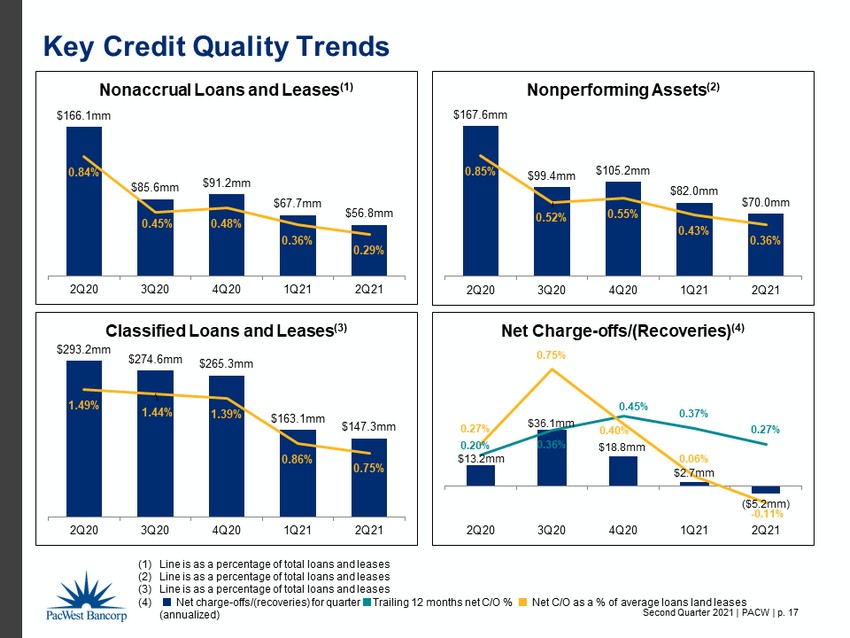
Second Quarter 2021 | PACW | p. 17 $13.2mm $36.1mm $18.8mm $2.7mm ($5.2mm) 0.20% 0.36% 0.45% 0.37% 0.27% 0.27% 0.75% 0.40% 0.06% - 0.11% 2Q20 3Q20 4Q20 1Q21 2Q21 Net Charge - offs/(Recoveries) (4) Key Credit Quality Trends $166.1mm $85.6mm $91.2mm $67.7mm $56.8mm 0.84% 0.45% 0.48% 0.36% 0.29% 2Q20 3Q20 4Q20 1Q21 2Q21 Nonaccrual Loans and Leases (1) (1) Line is as a percentage of total loans and leases (2) Line is as a percentage of total loans and leases (3) Line is as a percentage of total loans and leases (4) ■ Net charge - offs/(recoveries) for quarter ■ Trailing 12 months net C/O % ■ Net C/O as a % of average loans land leases (annualized) $167.6mm $99.4mm $105.2mm $82.0mm $70.0mm 0.85% 0.52% 0.55% 0.43% 0.36% 2Q20 3Q20 4Q20 1Q21 2Q21 Nonperforming Assets (2) $293.2mm $274.6mm $265.3mm $163.1mm $147.3mm 1.49% 1.44% 1.39% 0.86% 0.75% 2Q20 3Q20 4Q20 1Q21 2Q21 Classified Loans and Leases (3)

Second Quarter 2021 | PACW | p. 18 $182 $434 $300 $166 $84 $84 $(87) $5 $(118) $(3) $9 $2 $(24) 1/1/2020 Economic Forecast Individually Evaluated Loan Downgrades Net Charge- offs Other, net 12/31/2020 Economic Forecast Individually Evaluated Loan Downgrades Net Recoveries Other, net 6/30/2021 Changes in the Allowance for Credit Losses (ACL) (in millions) Current Expected Credit Losses (CECL) ▪ Provision benefit driven by improved economic forecast and improving credit quality metrics. ▪ Used the Moody’s Consensus Scenario Forecast dated June 2021 for 2Q21. ▪ No significant changes to CECL model or process. ▪ Decline in ACL ratio trending with continuing improvement in credit quality metrics. ▪ Trending back to pre - pandemic levels ▪ ACL and ALLL ratios were 0.97% and 0.70% at adoption of CECL on 1/1/20. Twelve Months of 2020 First Six Months of 2021 (1) Line is ACL as a % of loans and leases, excluding PPP loans (2) Other, net includes loan upgrades, loan balance changes and qualitative adjustments. (2) (2) $112.0mm $120.0mm $97.0mm $10.0mm - $48.0mm - $88.0mm 1.63% 2.06% 2.49% 2.41% 2.14% 1.59% 1Q20 2Q20 3Q20 4Q20 1Q21 2Q21 Provision for Credit Losses (1)

Second Quarter 2021 | PACW | p. 19 ($ in millions) Deposit Category Average $ Quarter-End $ Mix Average $ Quarter-End $ Mix Noninterest-bearing demand 11,305$ 11,252$ 38% 8,292$ 8,630$ 38% Interest checking 7,166 7,395 25% 3,899 4,858 21% Money market 7,423 7,777 26% 5,153 5,498 24% Savings 598 614 2% 524 550 2% Total core deposits 26,492 27,038 91% 17,868 19,536 85% Non-core non-maturity deposits 1,132 1,123 4% 1,064 1,217 5% Total non-maturity deposits 27,624 28,161 95% 18,932 20,753 90% Time deposits $250,000 and under 930 913 3% 1,843 1,523 7% Time deposits over $250,000 568 573 2% 633 653 3% Total time deposits 1,498 1,486 5% 2,476 2,176 10% Total deposits (1) 29,122$ 29,647$ 100% 21,408$ 22,929$ 100% At or For the Quarter Ended June 30, 2021 At or For the Quarter Ended June 30, 2020 Noninterest - bearing demand Interest checking Money market Savings deposits Non - core non - maturity deposits Time deposits $250,000 and under Time deposits over $250,000 June 30, 2021 Noninterest - bearing demand Interest checking Money market Savings deposits Non - core non - maturity deposits Time deposits $250,000 and under Time deposits over $250,000 June 30, 2020 Deposit Detail (1) Does not include $1.3 billion and $1.4 billion of client investment funds held at June 30, 2021 and June 30, 2020, respectively. Core: 91% Core: 85%
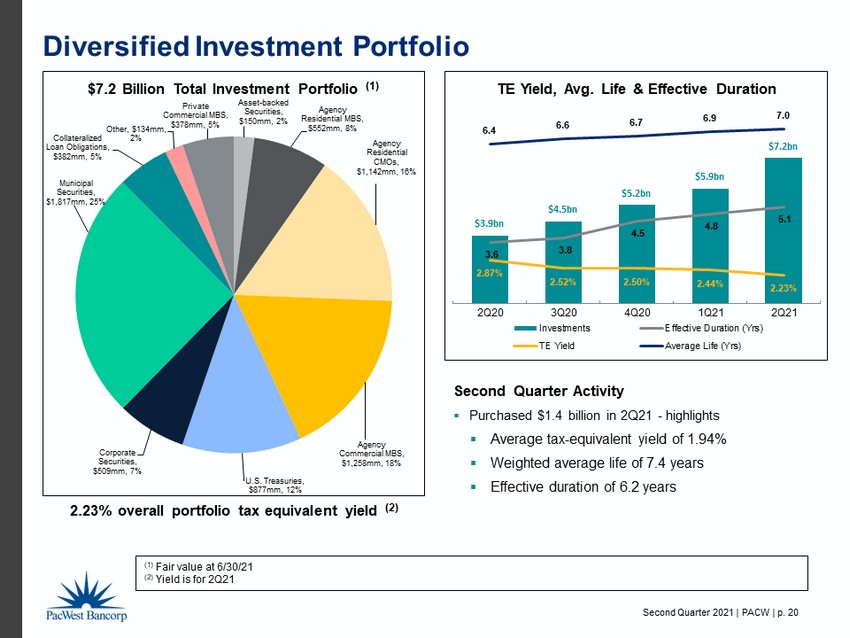
Second Quarter 2021 | PACW | p. 20 $3.9bn $4.5bn $5.2bn $5.9bn $7.2bn 3.6 3.8 4.5 4.8 5.1 2.87% 2.52% 2.50% 2.44% 2.23% 6.4 6.6 6.7 6.9 7.0 2Q20 3Q20 4Q20 1Q21 2Q21 TE Yield, Avg. Life & Effective Duration Investments Effective Duration (Yrs) TE Yield Average Life (Yrs) Diversified Investment Portfolio (1) Fair value at 6/30/21 (2) Yield is for 2Q21 Asset - backed Securities , $150mm , 2% Agency Residential MBS , $552mm , 8% Agency Residential CMOs , $1,142mm , 16% Agency Commercial MBS , $1,258mm , 18% U.S. Treasuries , $877mm , 12% Corporate Securities , $509mm , 7% Municipal Securities , $1,817mm , 25% Collateralized Loan Obligations , $382mm , 5% Other, $134mm , 2% Private Commercial MBS , $378mm , 5% $7.2 Billion Total Investment Portfolio (1) 2.23% overall portfolio tax equivalent yield (2) Second Quarter Activity ▪ Purchased $1.4 billion in 2Q21 - highlights ▪ Average tax - equivalent yield of 1.94% ▪ Weighted average life of 7.4 years ▪ Effective duration of 6.2 years

Second Quarter 2021 | PACW | p. 21 $12.5bn $15.9bn $16.3bn $16.2bn $22.3bn $27.0bn $15.9bn $18.9bn $18.9bn $19.2bn $24.9bn $29.6bn 2016 2017 2018 2019 2020 2Q21 Core and Total Deposits (2) Historical Financial Trends $21.9bn $25.0bn $25.7bn $26.8bn $29.5bn $34.9bn 2016 2017 2018 2019 2020 2Q21 Total Assets 12.31% 10.91% 10.01% 9.78% 10.53% 10.41% 15.56% 13.75% 12.72% 12.41% 13.76% 14.99% 2016 2017 2018 2019 2020 2Q21 Tier 1 & Total Risk Based Capital Ratios (1) $365.0mm $358.0mm $465.0mm $469.0mm $232.0mm $331.0mm 2016 2017 2018 2019 2020 1H21 Net Earnings (3) (1) ■ Tier 1 capital ratio (2) ■ Core deposits (3) 2020 amount excludes goodwill impairment of $1.47 billion in 1Q20

Second Quarter 2021 | PACW | p. 22 Product Offerings Community Banking Products National Lending Products Venture Banking Products • Attractive branch network with 70 full service branches in California and one in Denver, Colorado • Offers a full suite of deposit products and services, including on - line banking • Business lending products: includes secured business, asset - based and tax - exempt loans • Real estate lending products: includes multifamily, commercial real estate and construction loans • Limited consumer loan offerings • Borrower relationships generally include a deposit relationship • Diversified by loan and lease type, geography and industry o Asset - Based Lending (ABL) ▪ Lender Finance, Equipment Financing and Premium Finance o Commercial Real Estate ▪ Multifamily, Hotel, Office, Retail, Industrial, SBA and Construction • Focus on small to middle - market businesses • Expertise in niche segments (aviation lending and corporate finance) limits new competitors • Borrower relationships may include deposit accounts and treasury services • Four product offerings: Technology, Life Sciences, Fund Finance, Structured Finance • Offices located in key innovative hubs across the United States • Offers a comprehensive suite of financial services for venture - backed companies and their venture capital and private equity investors • Provides comprehensive treasury management solutions, including credit cards, international - related products and asset management services to clients • Borrower relationships almost always include a deposit relationship • Branch office in Durham, North Carolina Civic Products • Four product offerings: Construction – Renovation, Construction – Bridge, SFR For - Rent, Multi - family • Lends to investors who want to renovate and “flip” property or rent property • Offices located across the United States • Headquartered in Redondo Beach, CA • Subsidiary of Pacific Western Bank

Second Quarter 2021 | PACW | p. 23 Durham, NC Los Angeles, CA Nationwide Lender Combined with California Branch Network Chevy Chase, MD Chicago, IL Denver, CO New York, NY Boston, MA Minneapolis, MN Austin, TX Campbell, CA Menlo Park, CA San Francisco, CA National Lending office Venture Banking office Community Banking branch Primary offices in 14 states San Diego, CA

Second Quarter 2021 | PACW | p. 24 Balancing Quality Growth with Our Credit De - Risking Strategy 2014 2015 2016 2017 2018 2019 Sold PWEF Leasing Growth Initiatives De - Risking Initiatives New National Construction Lending Team New Multi - Family Lending Team Square 1 Acquisition CapitalSource Acquisition New Tax - Exempt Lending Team CUB Acquisition Colorado Market Expansion Strengthened construction lending criteria - lower loan - to - cost ratio Began to reduce exposure to Healthcare Real Estate Sold $1.5bn of Cash Flow Loans Began to emphasize Equity Fund Loans in Venture Banking Sold Celtic Capital Discontinued originating Security Monitoring and NL Healthcare RE loans 2020 2021 Civic Acquisition 2/01/21 Pandemic – intensely managed loan portfolio HOA Business Acquisition (Close in 4Q21)
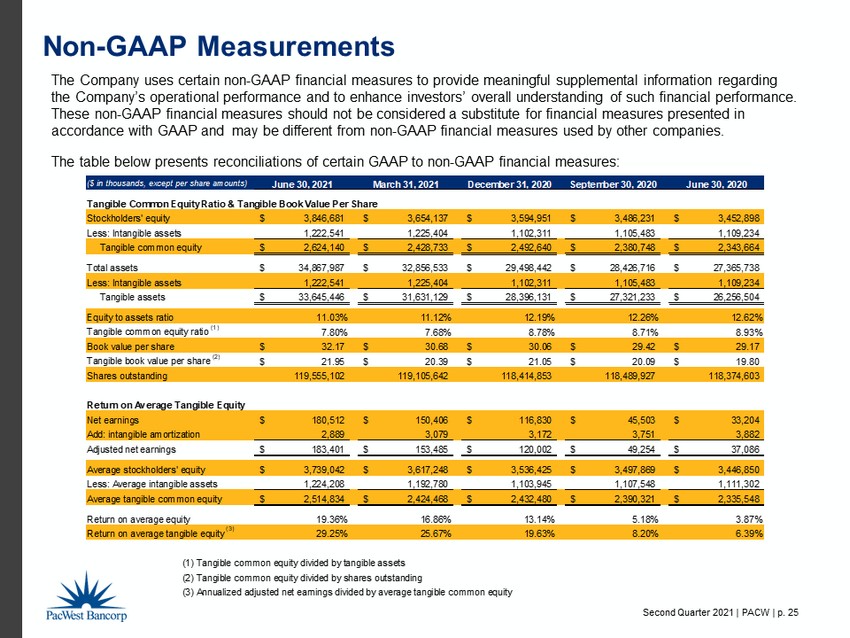
Second Quarter 2021 | PACW | p. 25 Non - GAAP Measurements The Company uses certain non - GAAP financial measures to provide meaningful supplemental information regarding the Company’s operational performance and to enhance investors’ overall understanding of such financial performance. These non - GAAP financial measures should not be considered a substitute for financial measures presented in accordance with GAAP and may be different from non - GAAP financial measures used by other companies. The table below presents reconciliations of certain GAAP to non - GAAP financial measures: ($ in thousands, except per share amounts) June 30, 2021 March 31, 2021 December 31, 2020 September 30, 2020 June 30, 2020 Tangible Common Equity Ratio & Tangible Book Value Per Share Stockholders' equity 3,846,681$ 3,654,137$ 3,594,951$ 3,486,231$ 3,452,898$ Less: Intangible assets 1,222,541 1,225,404 1,102,311 1,105,483 1,109,234 Tangible common equity 2,624,140$ 2,428,733$ 2,492,640$ 2,380,748$ 2,343,664$ Total assets 34,867,987$ 32,856,533$ 29,498,442$ 28,426,716$ 27,365,738$ Less: Intangible assets 1,222,541 1,225,404 1,102,311 1,105,483 1,109,234 Tangible assets 33,645,446$ 31,631,129$ 28,396,131$ 27,321,233$ 26,256,504$ Equity to assets ratio 11.03% 11.12% 12.19% 12.26% 12.62% Tangible common equity ratio (1) 7.80% 7.68% 8.78% 8.71% 8.93% Book value per share 32.17$ 30.68$ 30.06$ 29.42$ 29.17$ Tangible book value per share (2) 21.95$ 20.39$ 21.05$ 20.09$ 19.80$ Shares outstanding 119,555,102 119,105,642 118,414,853 118,489,927 118,374,603 Return on Average Tangible Equity Net earnings 180,512$ 150,406$ 116,830$ 45,503$ 33,204$ Add: intangible amortization 2,889 3,079 3,172 3,751 3,882 Adjusted net earnings 183,401$ 153,485$ 120,002$ 49,254$ 37,086$ Average stockholders' equity 3,739,042$ 3,617,248$ 3,536,425$ 3,497,869$ 3,446,850$ Less: Average intangible assets 1,224,208 1,192,780 1,103,945 1,107,548 1,111,302 Average tangible common equity 2,514,834$ 2,424,468$ 2,432,480$ 2,390,321$ 2,335,548$ Return on average equity 19.36% 16.86% 13.14% 5.18% 3.87% Return on average tangible equity (3) 29.25% 25.67% 19.63% 8.20% 6.39% (1) Tangible common equity divided by tangible assets (2) Tangible common equity divided by shares outstanding (3) Annualized adjusted net earnings divided by average tangible common equity

Second Quarter 2021 | PACW | p. 26 Non - GAAP Measurements The table below presents reconciliations of certain GAAP to non - GAAP financial measures. PPNR represents pre - provision, pre - tax net revenues and excludes goodwill impairment. ($ in thousands) June 30, 2021 March 31, 2021 December 31, 2020 September 30, 2020 June 30, 2020 PPNR and PPNR Return on Average Assets Net earnings 180,512$ 150,406$ 116,830$ 45,503$ 33,204$ Add: Provision for credit losses (88,000) (48,000) 10,000 97,000 120,000 Add: Income tax expense 62,417 53,556 36,546 13,671 12,968 Pre-provision, pre-goodwill impairment, pre-tax revenue ("PPNR") 154,929$ 155,962$ 163,376$ 156,174$ 166,172$ Average assets 34,326,113$ 31,415,882$ 29,334,789$ 27,935,193$ 26,621,227$ Return on average assets (1) 2.11% 1.94% 1.58% 0.65% 0.50% PPNR return on average assets (2) 1.81% 2.01% 2.22% 2.22% 2.51% (1) Annualized net earnings (loss) divided by average assets (2) Annualized PPNR divided by average asets Three Months Ended
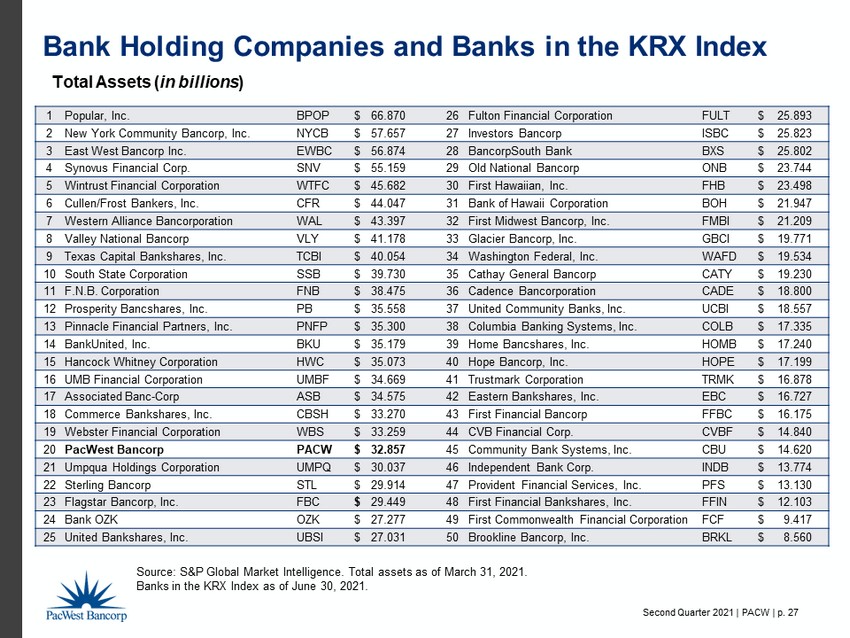
Second Quarter 2021 | PACW | p. 27 Bank Holding Companies and Banks in the KRX Index Total Assets ( in billions ) Source: S&P Global Market Intelligence. Total assets as of March 31, 2021. Banks in the KRX Index as of June 30, 2021. 1 Popular, Inc. BPOP $ 66.870 26 Fulton Financial Corporation FULT $ 25.893 2 New York Community Bancorp, Inc. NYCB $ 57.657 27 Investors Bancorp ISBC $ 25.823 3 East West Bancorp Inc. EWBC $ 56.874 28 BancorpSouth Bank BXS $ 25.802 4 Synovus Financial Corp. SNV $ 55.159 29 Old National Bancorp ONB $ 23.744 5 Wintrust Financial Corporation WTFC $ 45.682 30 First Hawaiian, Inc. FHB $ 23.498 6 Cullen/Frost Bankers, Inc. CFR $ 44.047 31 Bank of Hawaii Corporation BOH $ 21.947 7 Western Alliance Bancorporation WAL $ 43.397 32 First Midwest Bancorp, Inc. FMBI $ 21.209 8 Valley National Bancorp VLY $ 41.178 33 Glacier Bancorp, Inc. GBCI $ 19.771 9 Texas Capital Bankshares , Inc. TCBI $ 40.054 34 Washington Federal, Inc. WAFD $ 19.534 10 South State Corporation SSB $ 39.730 35 Cathay General Bancorp CATY $ 19.230 11 F.N.B. Corporation FNB $ 38.475 36 Cadence Bancorporation CADE $ 18.800 12 Prosperity Bancshares, Inc. PB $ 35.558 37 United Community Banks, Inc. UCBI $ 18.557 13 Pinnacle Financial Partners, Inc. PNFP $ 35.300 38 Columbia Banking Systems, Inc. COLB $ 17.335 14 BankUnited , Inc. BKU $ 35.179 39 Home Bancshares, Inc. HOMB $ 17.240 15 Hancock Whitney Corporation HWC $ 35.073 40 Hope Bancorp, Inc. HOPE $ 17.199 16 UMB Financial Corporation UMBF $ 34.669 41 Trustmark Corporation TRMK $ 16.878 17 Associated Banc - Corp ASB $ 34.575 42 Eastern Bankshares , Inc. EBC $ 16.727 18 Commerce Bankshares , Inc. CBSH $ 33.270 43 First Financial Bancorp FFBC $ 16.175 19 Webster Financial Corporation WBS $ 33.259 44 CVB Financial Corp. CVBF $ 14.840 20 PacWest Bancorp PACW $ 32.857 45 Community Bank Systems, Inc. CBU $ 14.620 21 Umpqua Holdings Corporation UMPQ $ 30.037 46 Independent Bank Corp. INDB $ 13.774 22 Sterling Bancorp STL $ 29.914 47 Provident Financial Services, Inc. PFS $ 13.130 23 Flagstar Bancorp, Inc. FBC $ 29.449 48 First Financial Bankshares , Inc. FFIN $ 12.103 24 Bank OZK OZK $ 27.277 49 First Commonwealth Financial Corporation FCF $ 9.417 25 United Bankshares , Inc. UBSI $ 27.031 50 Brookline Bancorp, Inc. BRKL $ 8.560

Second Quarter 2021 | PACW | p. 28 This communication contains certain forward - looking information about PacWest Bancorp that is intended to be covered by the safe harbor for “forward - looking statements” provided by the Private Securities Litigation Reform Act of 1995. Statements that are not historical or current facts, including statements about future financial and operational results, expectations, or intentions are forward - looking statements. Such statements are based on information available at the time of the communication and are based on current beliefs and expectations of the Company’s management and are subject to significant risks, uncertainties and contingencies, many of which are beyond our control. The COVID - 19 pandemic has adversely affected PacWest Bancorp, its employees, customers and third - party service providers, and the ultimate extent of the impacts on its business, financial position, results of operations, liquidity and prospects is uncertain. The risks from the COVID - 19 pandemic have decreased as the pandemic subsides, however, new variants may continue to impact key macro - economic indicators such as unemployment and GDP and may have a material impact on our allowance for credit losses and related provision for credit losses. Continued deterioration in general business and economic conditions could adversely affect PacWest Bancorp’s revenues and the values of its assets and liabilities, including goodwill, lead to a tightening of credit and increase stock price volatility. In addition, PacWest Bancorp’s results could be adversely affected by changes in interest rates, sustained high unemployment rates, deterioration in the credit quality of its loan portfolio or in the value of the collateral securing those loans, deterioration in the value of its investment securities and legal and regulatory developments. Actual results may differ materially from those set forth or implied in the forward - looking statements due to a variety of factors, including the risk factors described in documents filed by the Company with the U.S. Securities and Exchange Commission. We are under no obligation (and expressly disclaim any such obligation) to update or alter our forward - looking statements, whether as a result of new information, future events or otherwise, except as required by law . Forward - Looking Statements
