Attached files
| file | filename |
|---|---|
| 8-K - FORM 8-K - Simulations Plus, Inc. | simulations_8k.htm |
| EX-99.1 - PRESS RELEASE ISSUED ON JULY 12, 2021 - Simulations Plus, Inc. | simulations_ex9901.htm |
Exhibit 99.2

1 | NASDAQ: SLP Earnings Call – Q3 FY21 July 12, 2021

2 | NASDAQ: SLP With the exception of historical information, the matters discussed in this presentation are forward - looking statements that involve a number of risks and uncertainties . The actual results of the Company could differ significantly from those statements . Factors that could cause or contribute to such differences include, but are not limited to : continuing demand for the Company’s products, competitive factors, the Company’s ability to finance future growth, the Company’s ability to produce and market new products in a timely fashion, the general economics of the pharmaceutical industry, the Company’s ability to continue to attract and retain skilled personnel, and the Company’s ability to sustain or improve current levels of productivity . Further information on the Company’s risk factors is contained in the Company’s quarterly and annual reports and filed with the Securities and Exchange Commission . Safe Harbor Statement

3 | NASDAQ: SLP » Strong Software Performance ▪ Greater than historical growth rates - contributed to improved margins/profitability ▪ Delivery of new technology ▪ Business development investment driving cross - selling » Challenging Service Performance ▪ Bookings were good; backlog grew ▪ Mixture of project delays, holds and drug development program cancellations ▪ Reflective of Covid impacted bookings late last year (lower backlog level) and churn in terms of client projects – faster cancelation decisions on drug development programs » Profitability Improved ▪ Favorable revenue mix ▪ YTD F21 > Full - year FY20 3 rd Quarter Highlights

4 | NASDAQ: SLP GastroPlus® » Several new licenses to biologics development companies » New DDI functionality » Cross - selling success Q3 Software Highlights +64% Monolix® YOY Growth +114% DDI Module YOY Growth +58% HTPK Simulation Module YOY Growth 5 New $100k+ customers 23 Upsells MonolixSuite TM » Growth included some early renewals » Better than expected performance YTD » Completed training of new China distributor ADMET Predictor® » Released new ADMET Predictor modules » New HTPK functionality
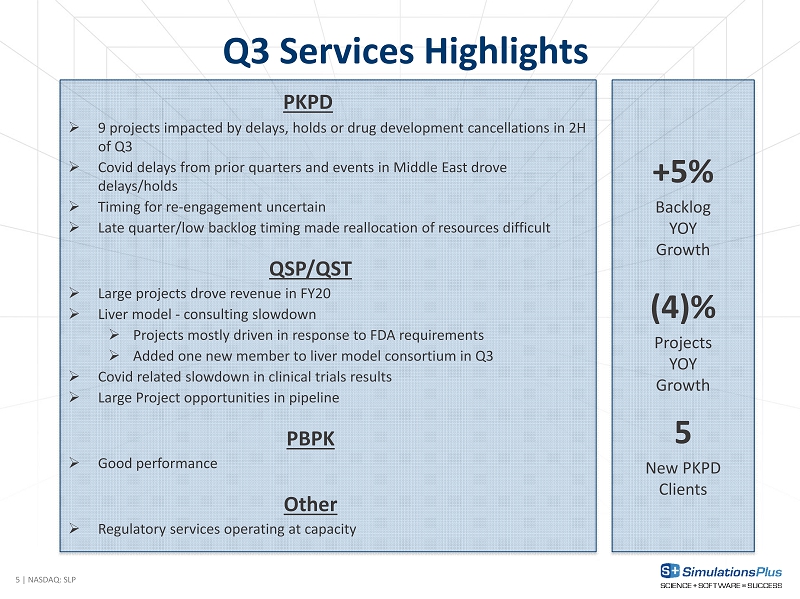
5 | NASDAQ: SLP Q3 Services Highlights PKPD » 9 projects impacted by delays, holds or drug development cancellations in 2H of Q3 » Covid delays from prior quarters and events in Middle East drove delays/holds » Timing for re - engagement uncertain » Late quarter/low backlog timing made reallocation of resources difficult QSP/QST » Large projects drove revenue in FY20 » Liver model - consulting slowdown » Projects mostly driven in response to FDA requirements » Added one new member to liver model consortium in Q3 » Covid related slowdown in clinical trials results » Large Project opportunities in pipeline PBPK » Good performance Other » Regulatory services operating at capacity +5% Backlog YOY Growth 5 New PKPD Clients (4)% Projects YOY Growth

6 | NASDAQ: SLP Updated FY21 Outlook Growth Targets: 5 to 10% Total Revenue Growth 20 to 25% Software Revenue Growth (7 - 12)% Service Revenue Growth Q4 Commentary: » Anticipate continued software performance in historically seasonally lower software revenue quarter » Monolix likely flat due to early renewals » Service project delays, holds and drug development program cancellations will impact quarter

7 | NASDAQ: SLP Financial Results

8 | NASDAQ: SLP Q3 Revenue (in millions) +4% Total Revenue $5.8 $6.8 $8.3 $4.1 $5.5 $4.5 $9.9 $12.3 $12.8 3Q19 3Q20 3Q21 Software Services 56% 44% 3Q20 Mix Software Services 65% 35% 3Q21 Mix Software Services +21% Software Revenue (18)% Services Revenue

9 | NASDAQ: SLP YTD Revenue (in millions) $14.6 $16.8 $22.3 $11.3 $15.3 $14.3 $25.9 $32.1 $36.6 FY19 FY20 FY21 Software Services +14% Total Revenue +32% Software Revenue (6)% Services Revenue 53% 47% YTD FY20 Mix Software Services 61% 39% YTD FY21 Mix Software Services

10 | NASDAQ: SLP Gross Margin Trend – Q3 86% 90% 90% 63% 63% 63% 77% 78% 81% 3Q19 3Q20 3Q21 Software Services Total
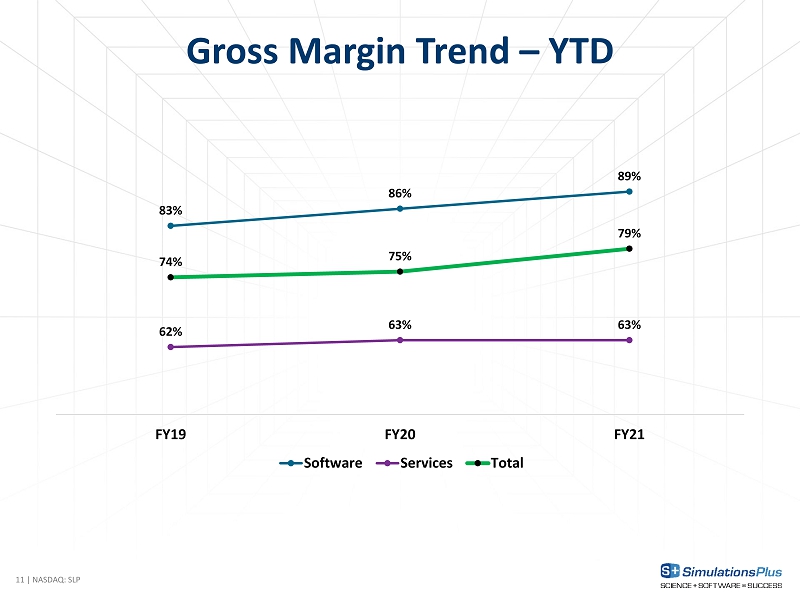
11 | NASDAQ: SLP Gross Margin Trend – YTD 83% 86% 89% 62% 63% 63% 74% 75% 79% FY19 FY20 FY21 Software Services Total

12 | NASDAQ: SLP Software Revenue by Product 65% 18% 11% 6% GastroPlus ADMET Predictor Monolix Suite Other Software Q3 FY21 Software Product as % of Software Revenue 60% 17% 16% 7% GastroPlus ADMET Predictor Monolix Suite Other Software YTD FY21

13 | NASDAQ: SLP Software Performance Metrics – Q3 Avg. Revenue per Customer (in thousands) $57 $66 $71 $79 $89 $98 FY19 FY20 FY21 All Companies Commercial Companies Renewal Rates 93% 93% 91% 85% 89% 83% FY19 FY20 FY21 Fees Accounts

14 | NASDAQ: SLP Software Performance Metrics – YTD Avg. Revenue per Customer (in thousands) $57 $63 $81 $77 $85 $112 FY19 FY20 FY21 All Companies Commercial Companies Renewal Rates 93% 94% 91% 85% 87% 84% FY19 FY20 FY21 Fees Accounts

15 | NASDAQ: SLP Services Revenue by Type 13% 17% 27% 43% Other PBPK QSP/QST PKPD Q3 FY21 Services Types as % of Service Revenue 14% 14% 29% 43% Other PBPK QSP/QST PKPD YTD FY21
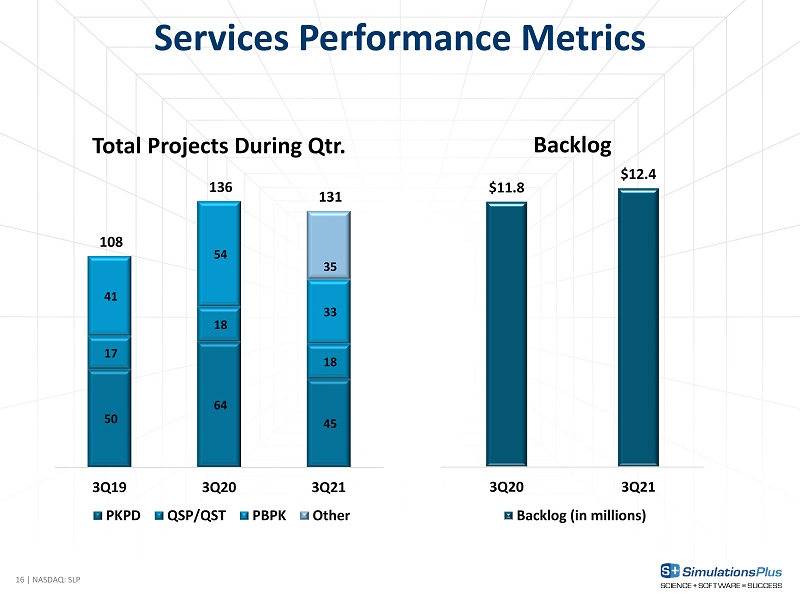
16 | NASDAQ: SLP Services Performance Metrics $11.8 $12.4 3Q20 3Q21 Backlog (in millions) 50 64 45 17 18 18 41 54 33 35 108 136 131 3Q19 3Q20 3Q21 Total Projects During Qtr. PKPD QSP/QST PBPK Other Backlog

17 | NASDAQ: SLP Income Statement Summary – Q3 (in millions) FY21 % of Rev FY20 % of Rev Revenues $ 12.8 100% $ 12.3 100% Revenue Growth 4% 24% Gross profit 10.3 81% $ 9.6 78% SG&A $ 5.1 40% $ 5.0 41% R&D 0.7 5% 0.8 6% Total operating exp 5.8 45% 5.8 47% Income from operations 4.5 36% 3.9 31% Other income (expense) (0.1) (0)% (0.1) (1)% Income before income taxes 4.5 35% 3.8 31% Income taxes 0.7 6% 0.8 7% Effective tax rate 16% 22% Net income 3.8 30% 2.9 24% Diluted earnings per share (in dollars) $ 0.18 $ 0.16 EBITDA $ 5.3 42% $ 4.6 37%

18 | NASDAQ: SLP Income Statement Summary – YTD (in millions) FY21 % of Rev FY20 % of Rev Revenues $ 36.6 100% $ 32.0 100% Revenue Growth 14% 24% Gross profit 28.8 79% 24.1 75% SG&A $ 15.0 41% 12.6 39% R&D 2.8 8% 2.0 6% Total operating exp 17.7 48% 14.7 46% Income from operations 11.1 30% 9.4 29% Other income (expense) (0.2) (0)% (0.1) (0)% Income before income taxes 10.9 30% 9.3 29% Income taxes 1.4 4% 2.3 7% Effective tax rate 13% 24% Net income $ 9.5 26% $ 7.1 22% Diluted earnings per share (in dollars) $ 0.46 $ 0.39 EBITDA $ 13.4 37% $ 11.5 36%

19 | NASDAQ: SLP Balance Sheet Summary (in millions, except where indicated) May 31, 2021 Aug. 31, 2020 Cash and short - term investments $119.8 $116.0 Total current assets 138.7 129.1 Total assets 179.1 168.4 Current liabilities 7.3 5.5 Long - term liabilities 6.3 6.9 Total liabilities 13.7 12.4 Shareholders’ equity 165.4 156.0 Total liabilities and shareholders’ equity 179.1 168.4

20 | NASDAQ: SLP » Higher software growth rates and richer mix of software revenue are enhancing profitability metrics » Near - term service project delays, holds or drug development program cancellations will reduce FY21 growth » Reinforcing our biosimulation leadership ▪ Good market momentum with the close of new business, renewal and growth of existing relationships, key collaborations and grants ▪ Successful conference sponsorship Conclusion Mid to long - term outloo k remains unchanged