Attached files
| file | filename |
|---|---|
| EX-99.1 - EXHIBIT 99.1 - RITE AID CORP | tm2120403d1_ex99-1.htm |
| 8-K - FORM 8-K - RITE AID CORP | tm2120403d1_8k.htm |
Exhibit 99.2
FIRST QUARTER FISCAL 2022 6/24/21

2 2 EARNINGS CONFERENCE CALL Heyward Donigan Chief Executive Officer Jim Peters Chief Operating Officer Matt Schroeder Chief Financial Officer
Cautionary Statement Regarding Forward Looking Statements Statements in this presentation that are not historical, are forward - looking statements made pursuant to the safe harbor provisions of the Private Securities Litigation Reform Act of 1995 . Such statements include, but are not limited to, statements regarding Rite Aid Corporation’s (the “Company”) outlook and guidance for fiscal 2022 ; the continued impact of the global coronavirus (COVID - 19 ) pandemic on the Company’s business ; and any assumptions underlying any of the foregoing . Words such as "anticipate," "believe," "continue," "could," "estimate," "expect," "intend," "may," "plan," "predict," "project," "should," and "will" and variations of such words and similar expressions are intended to identify such forward - looking statements . These forward - looking statements are not guarantees of future performance and involve risks, assumptions and uncertainties, including, but not limited to : risks related to the impact of the COVID - 19 global pandemic, such as the scope and duration of the outbreak, government actions and restrictive measures implemented in response, and other impacts to the business, or on the Company’s ability to execute business continuity plans, as a result of the COVID - 19 pandemic ; the impact of COVID - 19 on the Company’s workforce, operations, stores, expenses, and supply chain, and the operations or behaviors of the Company’s customers, suppliers and business partners ; the Company’s ability to successfully implement the Company’s RxEvolution and other strategies ; the impact of the Company’s high level of indebtedness, the ability to refinance such indebtedness on acceptable terms and the Company’s ability to satisfy its obligations and the other covenants contained in the Company’s debt agreements ; outcome of pending or new litigation including related to Opioids, “usual and customary” pricing or other matters ; the Company’s ability to monetize the CMS receivable created in the Company’s Part D business ; general competitive, economic, industry, market, political (including healthcare reform) and regulatory conditions (including changes to laws or regulations relating to labor or wages), civil unrest (including any resulting store closures, damage, or loss of inventory), as well as other factors that impact the markets in which we operate ; the impact of private and public third - party payers continued reduction in prescription drug reimbursements and efforts to encourage mail order ; the Company’s ability to manage expenses and its investments in working capital ; the Company’s ability to achieve the benefits of the Company’s efforts to reduce the costs of its generic and other drugs ; the Company’s ability to achieve cost savings and other benefits of its organizational restructuring within its anticipated timeframe, if at all ; the outcome of the Company’s continuing efforts to monitor and comply with applicable laws, regulations, policies and procedures ; and the Company’s ability to partner and have relationships with health plans and health systems . These and other risks, assumptions and uncertainties are more fully described in Item 1 A (Risk Factors) of the Company’s most recent Annual Report on Form 10 - K and in other documents that it files or furnishes with the Securities and Exchange Commission (the “SEC”), which you are encouraged to read . To the extent that COVID - 19 adversely affects the Company’s business and financial results, it may also have the effect of heightening many of such risk factors . Should one or more of these risks or uncertainties materialize, or should underlying assumptions prove incorrect, actual results may vary materially from those indicated or anticipated by such forward - looking statements . Accordingly, you are cautioned not to rely on these forward - looking statements, which speak only as of the date they are made . The degree to which COVID - 19 may adversely affect The Company’s results and operations, including its ability to achieve its outlook for fiscal 2022 guidance, will depend on numerous evolving factors and future developments, which are highly uncertain, including, but not limited to, the duration and spread of the COVID - 19 outbreak, its severity, the actions to contain the virus or treat its impact, including the reinstitution of more stringent regulations (including mandatory stay at home orders), and how quickly and to what extent normal economic and operating conditions can resume . As a result, the impact on the Company’s financial and operating results cannot be reasonably estimated with specificity at this time, but the impact could be material . The Company expressly disclaims any current intention, and assumes no duty, to update publicly any forward - looking statement after the distribution of this presentation, whether as a result of new information, future events, changes in assumptions or otherwise . 3
Non - GAAP Financial Measures The following presentation includes the non - GAAP financial measures Adjusted Net Income (Loss), Adjusted Net Income (Loss) per Diluted Share, Adjusted EBITDA, Adjusted EBITDA Gross Profit and Adjusted EBITDA SG&A, which are non - GAAP financial measures . See the attached tables for a reconciliation of Adjusted Net Income (Loss), Adjusted Net Income (Loss) per Diluted Share and Adjusted EBITDA to net income (loss), and net income (loss) per diluted share, which are the most directly comparable GAAP financial measures . Adjusted Net Income (Loss) and Adjusted Net Income (Loss) per Diluted Share exclude amortization expense, merger and acquisition - related costs, non - recurring litigation settlements, gains or losses on debt modifications and retirements, LIFO adjustments, goodwill and intangible asset impairment charges, and restructuring - related costs . The Company believes Adjusted Net Income (Loss) and Adjusted Net Income (Loss) per Diluted Share serve as appropriate measures to be used in evaluating the performance of its business and help its investors better compare its operating performance over multiple periods . Adjusted EBITDA is defined as net income (loss) excluding the impact of income taxes, interest expense, depreciation and amortization, LIFO adjustments, charges or credits for facility closing and impairment, goodwill and intangible asset impairment charges, inventory write - downs related to store closings, gains or losses on debt modifications and retirements, and other items (including stock - based compensation expense, merger and acquisition - related costs, non - recurring litigation settlements, severance, restructuring - related costs, costs related to facility closures, and gain or loss on sale of assets) . The add back of LIFO (credit) charge when calculating Adjusted EBITDA, Adjusted Net Income (Loss) and Adjusted Net Income (Loss) per Diluted Share removes the entire impact of LIFO (credits) charges, and effectively reflects the Company's results as if the company was on a FIFO inventory basis . The Company believes Adjusted EBITDA serves as an appropriate measure in evaluating the performance of its business and helps its investors better compare its operating performance with its competitors . Adjusted EBITDA Gross Profit includes LIFO adjustments, depreciation and amortization (COGS portion only) and other items . See the attached tables for a reconciliation of Adjusted EBITDA Gross Profit to Revenue, which is the most directly comparable GAAP financial measure . Adjusted EBITDA SG&A excludes depreciation and amortization (SG&A portion only), stock - based compensation expense, merger and acquisition - related costs, litigation settlements and other items . See the attached tables for a reconciliation of Adjusted EBITDA SG&A to Revenue, which is the most directly comparable GAAP financial measure . The Company believes Adjusted EBITDA Gross Profit and Adjusted EBITDA SG&A serve as appropriate measures in evaluating the performance of its business and helps its investors better compare its operating performance with its competitors . 4

5 Q1 FY2022 FINANCIAL REVIEW
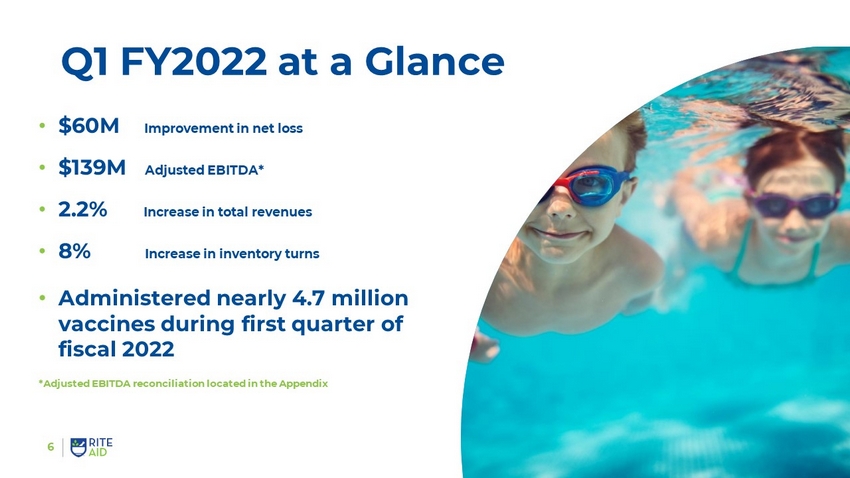
Q1 FY2022 at a Glance • $60M Improvement in n et loss • $139M Adjusted EBITDA* • 2.2% Increase in total revenues • 8% Increase in inventory turns • Administered nearly 4.7 million vaccines during first quarter of fiscal 2022 6 *Adjusted EBITDA reconciliation located in the Appendix
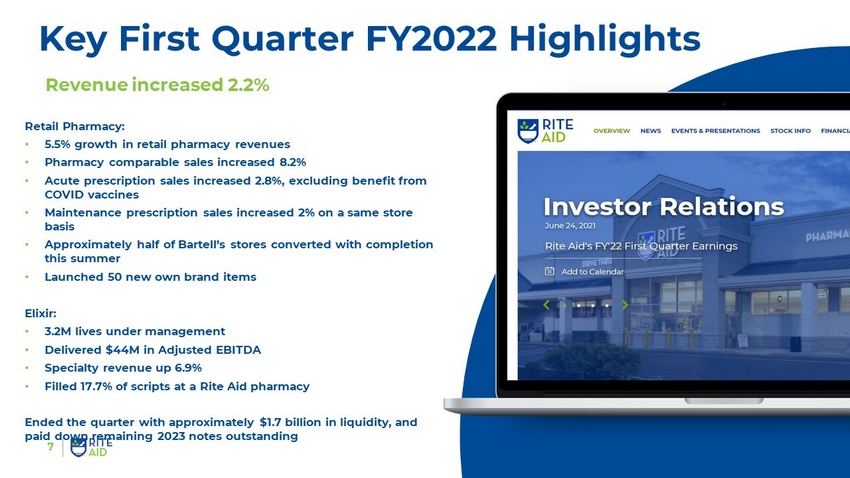
Key First Quarter FY2022 Highlights Revenue increased 2.2% Retail Pharmacy: • 5.5% growth in retail pharmacy revenues • Pharmacy comparable sales increased 8.2% • Acute prescription sales increased 2.8%, excluding benefit from COVID vaccines • Maintenance prescription sales increased 2% on a same store basis • Approximately half of Bartell’s stores converted with completion this summer • Launched 50 new own brand items Elixir: • 3.2M lives under management • Delivered $44M in Adjusted EBITDA • Specialty revenue up 6.9% • Filled 17.7% of scripts at a Rite Aid pharmacy Ended the quarter with approximately $1.7 billion in liquidity, and paid down remaining 2023 notes outstanding 7
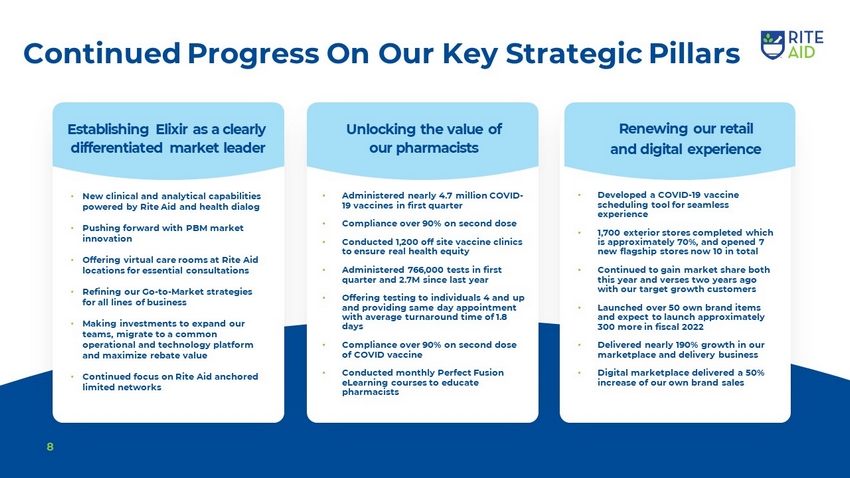
Continued Progress On Our Key Strategic Pillars • New clinical and analytical capabilities powered by Rite Aid and health dialog • Pushing forward with PBM market innovation • Offering virtual care rooms at Rite Aid locations for essential consultations • Refining our Go - to - Market strategies for all lines of business • Making investments to expand our teams, migrate to a common operational and technology platform and maximize rebate value • Continued focus on Rite Aid anchored limited networks • Administered nearly 4.7 million COVID - 19 vaccines in first quarter • Compliance over 90% on second dose • Conducted 1,200 off site vaccine clinics to ensure real health equity • Administered 766,000 tests in first quarter and 2.7M since last year • Offering testing to individuals 4 and up and providing same day appointment with average turnaround time of 1.8 days • Compliance over 90% on second dose of COVID vaccine • Conducted monthly Perfect Fusion eLearning courses to educate pharmacists • Developed a COVID - 19 vaccine scheduling tool for seamless experience • 1,700 exterior stores completed which is approximately 70%, and opened 7 new flagship stores now 10 in total • Continued to gain market share both this year and verses two years ago with our target growth customers • Launched over 50 own brand items and expect to launch approximately 300 more in fiscal 2022 • Delivered nearly 190 % growth in our marketplace and delivery business • Digital marketplace delivered a 50% increase of our own brand sales 8 Establishing Elixir as a clearly differentiated market leader Unlocking the value of our pharmacists Renewing our retail and digital experience
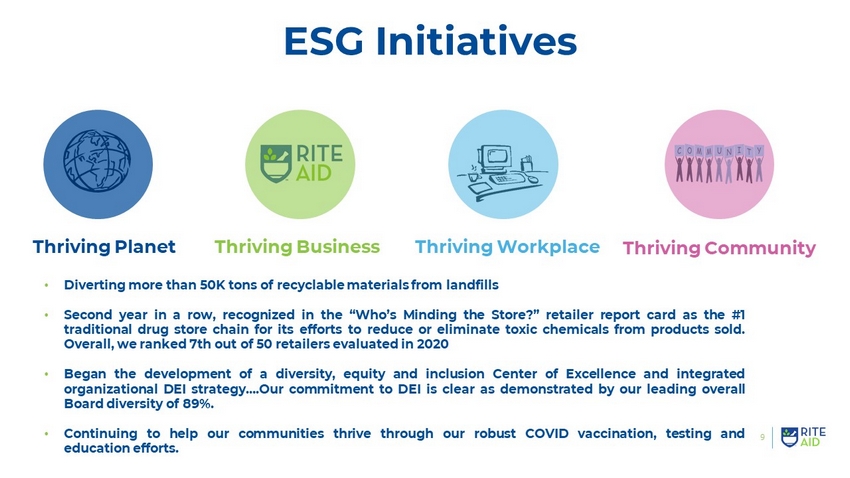
9 ESG Initiatives Thriving Community • Diverting more than 50 K tons of recyclable materials from landfills • Second year in a row, recognized in the “Who’s Minding the Store?” retailer report card as the # 1 traditional drug store chain for its efforts to reduce or eliminate toxic chemicals from products sold . Overall , we ranked 7 th out of 50 retailers evaluated in 2020 • Began the development of a diversity, equity and inclusion Center of Excellence and integrated organizational DEI strategy … . Our commitment to DEI is clear as demonstrated by our leading overall Board diversity of 89 % . • Continuing to help our communities thrive through our robust COVID vaccination, testing and education efforts . Thriving Planet Thriving Business Thriving Workplace
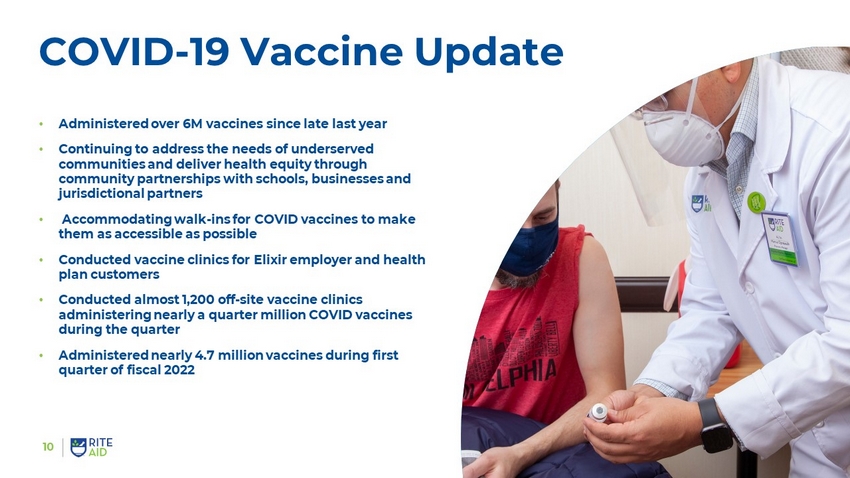
10 COVID - 19 Vaccine Update • Administered over 6M vaccines since late last year • Continuing to address the needs of underserved communities and deliver health equity through community partnerships with schools, businesses and jurisdictional partners • Accommodating walk - ins for COVID vaccines to make them as accessible as possible • Conducted vaccine clinics for Elixir employer and health plan customers • Conducted almost 1,200 off - site vaccine clinics administering nearly a quarter million COVID vaccines during the quarter • Administered nearly 4.7 million vaccines during first quarter of fiscal 2022
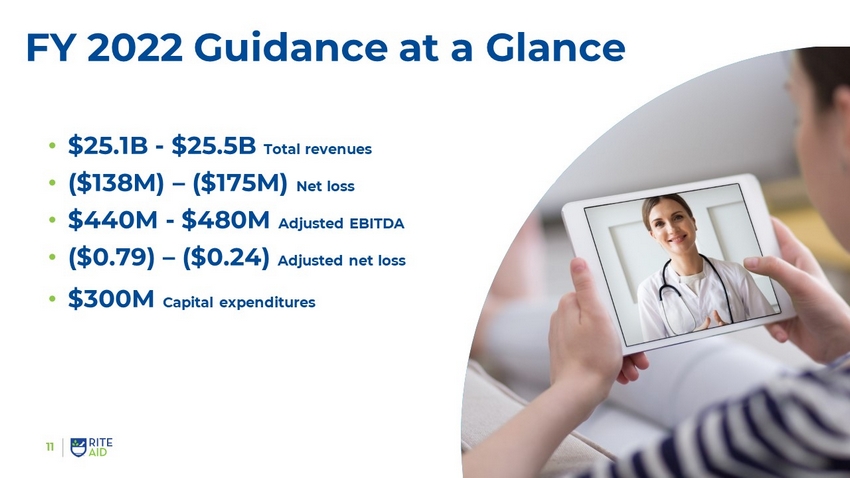
FY 2022 Guidance at a Glance • $ 25.1B - $25.5B Total revenues • ($138M ) – ($ 175M ) Net loss • $440M - $480M Adjusted EBITDA • ($0.79) – ($0.24) Adjusted net loss • $ 300M Capital expenditures 11
APPENDIX
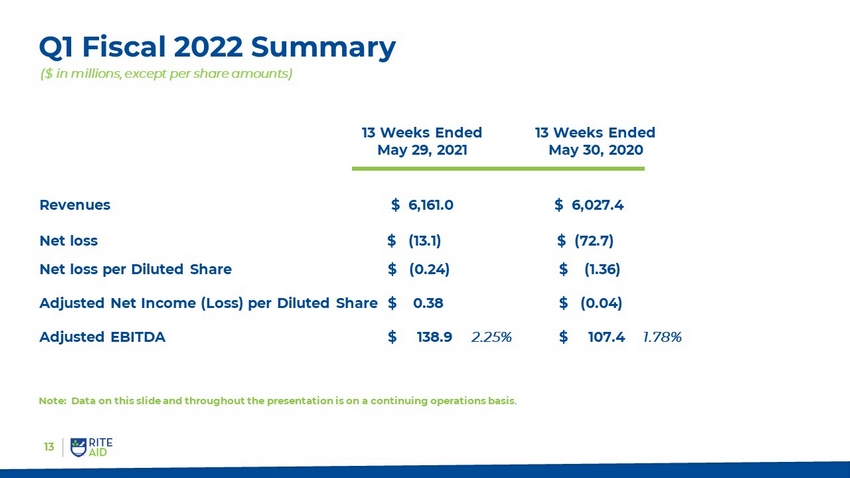
13 Q1 Fiscal 2022 Summary ($ in millions, except per share amounts) 13 Weeks Ended May 29, 2021 13 Weeks Ended May 30, 2020 Revenues $ 6,161.0 $ 6,027.4 Net loss $ (13.1) $ (72.7) Net loss per Diluted Share $ ( 0.24) $ (1.36) Adjusted Net Income (Loss) per Diluted Share $ 0 .38 $ (0 .04) Adjusted EBITDA $ 138.9 2.25% $ 107.4 1.78% Note: Data on this slide and throughout the presentation is on a continuing operations basis .
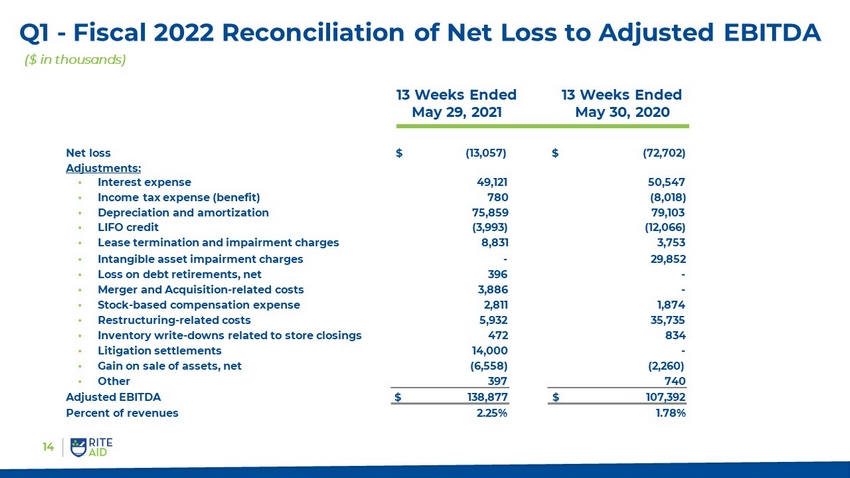
14 13 Weeks Ended May 29, 2021 13 Weeks Ended May 30, 2020 Net loss $ (13,057) $ (72,702) Adjustments: • Interest expense 49,121 50,547 • Income tax expense (benefit) 780 (8,018) • Depreciation and amortization 75,859 79,103 • LIFO credit (3,993) (12,066) • Lease termination and impairment charges 8,831 3,753 • Intangible asset impairment charges - 29,852 • Loss on debt retirements, net 396 - • Merger and Acquisition - related costs 3,886 - • Stock - based compensation expense 2,811 1,874 • Restructuring - related costs 5,932 35,735 • Inventory write - downs related to store closings 472 834 • Litigation settlements 14,000 - • Gain on sale of assets, net (6 ,558) (2,260) • Other 397 740 Adjusted EBITDA $ 138,877 $ 107,392 Percent of revenues 2.25% 1.78% Q1 - Fiscal 2022 Reconciliation of Net Loss to Adjusted EBITDA ($ in thousands)
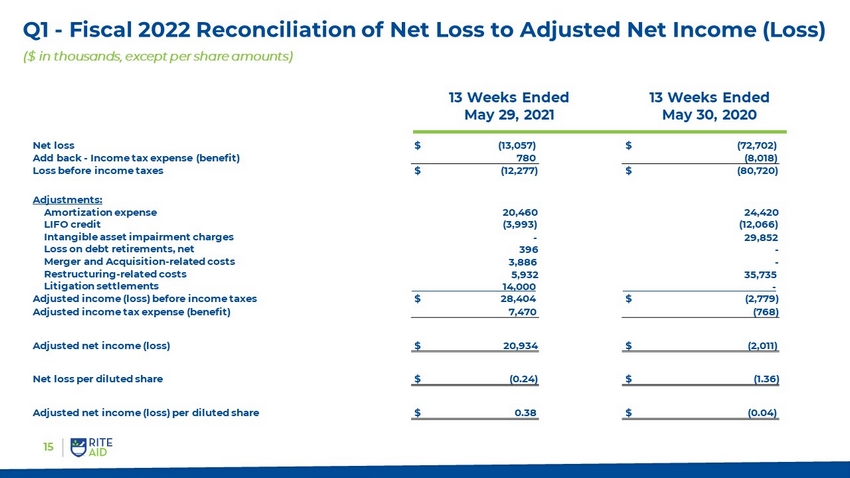
15 13 Weeks Ended May 29, 2021 13 Weeks Ended May 30, 2020 Net loss $ (13,057) $ (72 ,702) Add back - Income tax expense ( benefit ) 780 (8,018) Loss before income taxes $ (12,277) $ (80,720) Adjustments: Amortization expense 20,460 24,420 LIFO credit (3,993) (12,066) Intangible asset impairment charges - 29,852 Loss on debt retirements, net 396 - Merger and Acquisition - related costs 3,886 - Restructuring - related costs 5,932 35,735 Litigation settlements 14,000 - . Adjusted income (loss) before income taxes $ 28,404 $ (2,779) Adjusted income tax expense (benefit) 7,470 (76 8 ) Adjusted net income (loss) $ 20,934 $ (2 ,011) Net loss per diluted share $ (0.24) $ (1.36) Adjusted net income (loss) per diluted share $ 0.38 $ ( 0.04) Q1 - Fiscal 2022 Reconciliation of Net Loss to Adjusted Net Income (Loss) ($ in thousands, except per share amounts)
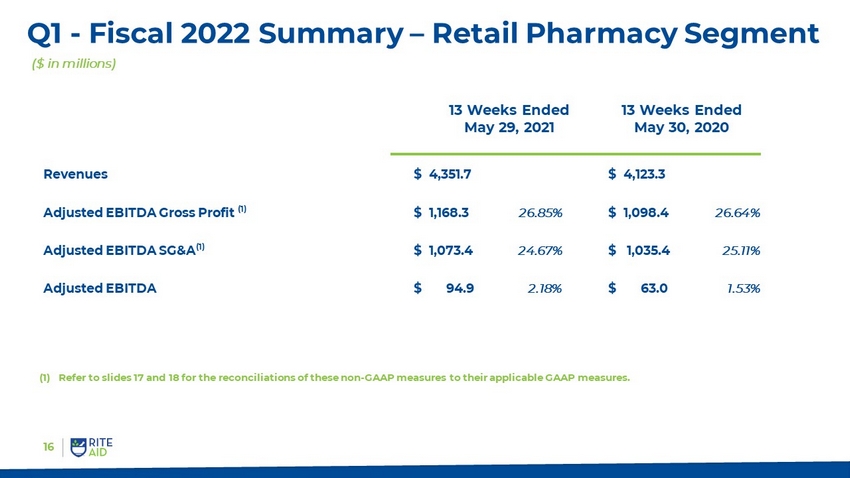
16 Revenues $ 4,351.7 $ 4,123.3 Adjusted EBITDA Gross Profit (1) $ 1,168.3 26.85% $ 1,098.4 26.64% Adjusted EBITDA SG&A (1) $ 1,073 .4 24.67% $ 1,035.4 25.11% Adjusted EBITDA $ 94.9 2.18% $ 63.0 1.53 % Q1 - Fiscal 2022 Summary – Retail Pharmacy Segment ($ in millions) (1) Refer to slides 17 and 18 for the reconciliations of these non - GAAP measures to their applicable GAAP measures. 13 Weeks Ended May 29, 2021 13 Weeks Ended May 30, 2020
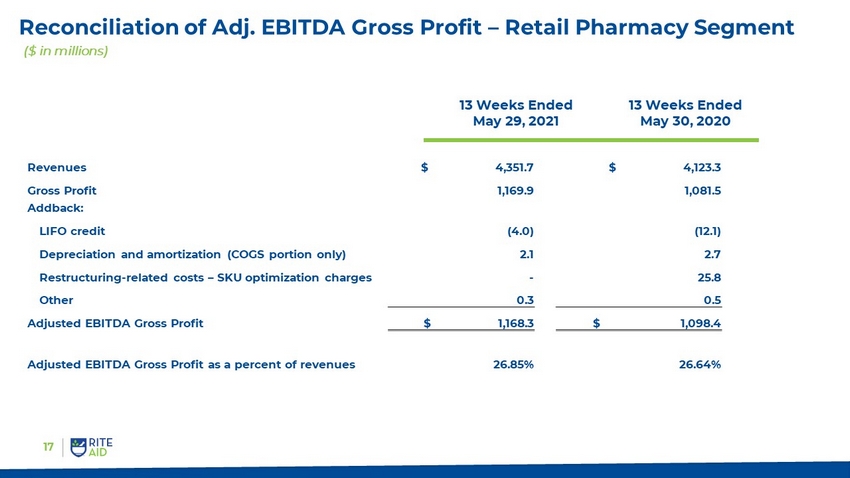
17 Reconciliation of Adj. EBITDA Gross Profit – Retail Pharmacy Segment ($ in millions) 13 Weeks Ended May 29, 2021 13 Weeks Ended May 30, 2020 Revenues $ 4,351.7 $ 4,123.3 Gross Profit 1,169.9 1,081.5 Addback: LIFO credit (4.0) (12.1) Depreciation and amortization (COGS portion only) 2.1 2.7 Restructuring - related costs – SKU optimization charges - 25.8 Other 0.3 0.5 Adjusted EBITDA Gross Profit $ 1,168.3 $ 1,098.4 Adjusted EBITDA Gross Profit as a percent of revenues 26.85% 26.64%
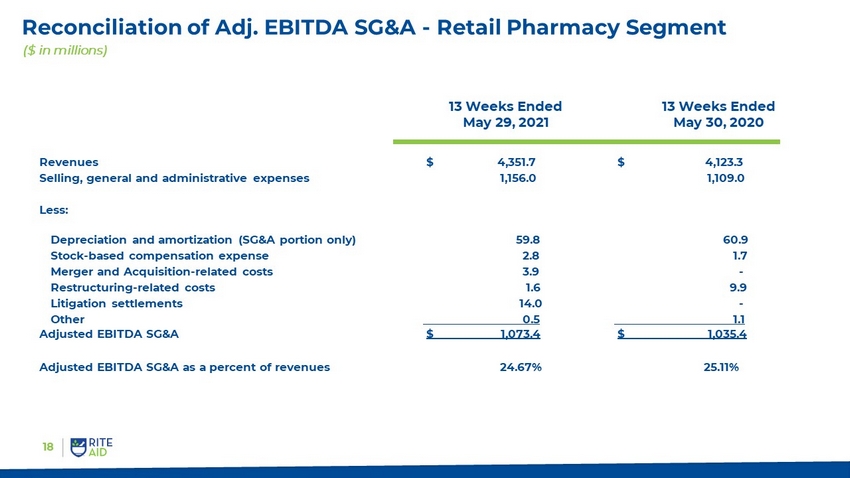
18 Reconciliation of Adj. EBITDA SG&A - Retail Pharmacy Segment ($ in millions) 13 Weeks Ended May 29, 2021 13 Weeks Ended May 30, 2020 Revenues $ 4,351.7 $ 4,123.3 Selling, general and administrative expenses 1,156.0 1,109.0 Less: Depreciation and amortization (SG&A portion only) 59.8 60.9 Stock - based compensation expense 2.8 1.7 Merger and Acquisition - related costs 3.9 - Restructuring - related costs 1 .6 9.9 Litigation settlements 14.0 - Other 0.5 1.1 Adjusted EBITDA SG&A $ 1,073.4 $ 1,035.4 Adjusted EBITDA SG&A as a percent of revenues 24.67% 25.11%
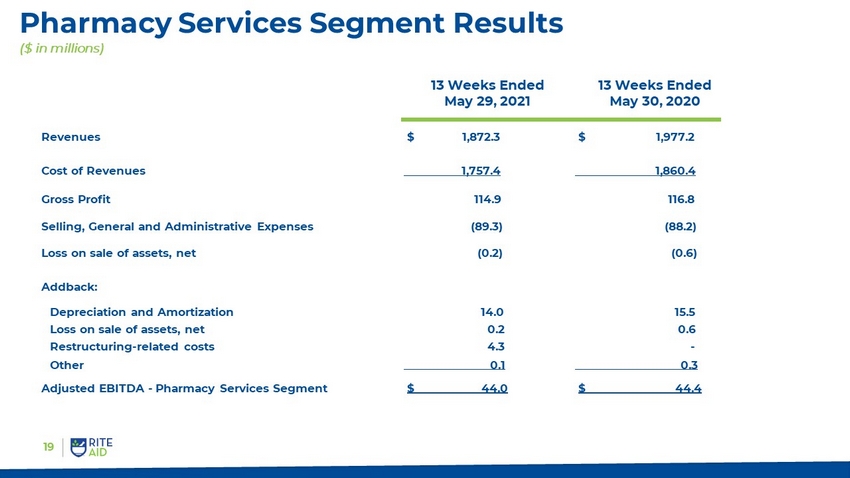
Revenues $ 1,872.3 $ 1,977.2 Cost of Revenues 1,757.4 1,860.4 Gross Profit 114 .9 116.8 Selling, General and Administrative Expenses (89.3) (88.2) Loss on sale of assets, net (0.2) (0.6) Addback: Depreciation and Amortization 14.0 15.5 Loss on sale of assets, net 0.2 0.6 Restructuring - related costs 4.3 - Other 0.1 0.3 Adjusted EBITDA - Pharmacy Services Segment $ 44.0 $ 44.4 13 Weeks Ended May 29, 2021 13 Weeks Ended May 30, 2020 19 Pharmacy Services Segment Results ($ in millions)
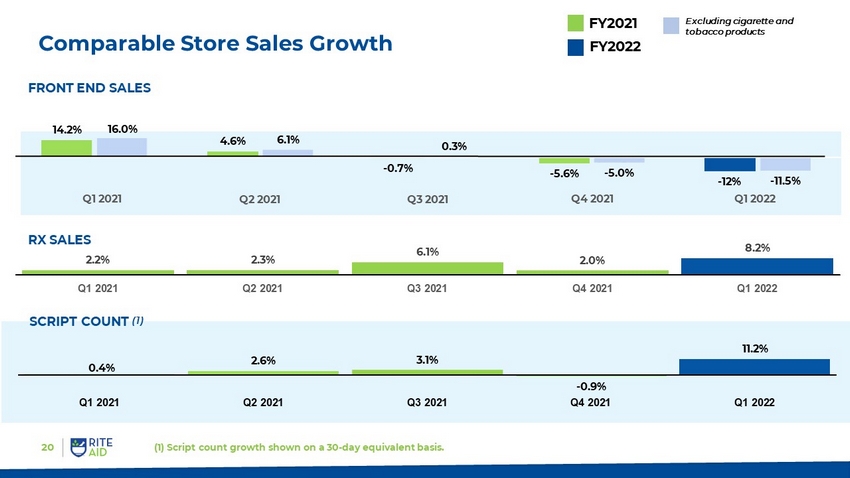
20 Comparable Store Sales Growth 0.4% 2.6% 3.1% - 0.9% 11.2% Q1 2021 Q2 2021 Q3 2021 Q4 2021 Q1 2022 SCRIPT COUNT (1) Q1 2021 Q2 2021 Q3 2021 2.2% 2.3% 6.1% 2.0% 8.2% Q1 2021 Q2 2021 Q3 2021 Q4 2021 Q1 2022 RX SALES 14.2% 4.6% - 0.7% - 5.6% - 12% 16.0% 6.1% 0.3% - 5.0% - 11.5% Q4 2021 FY2021 FY2022 Excluding cigarette and tobacco products (1) Script count growth shown on a 30 - day equivalent basis. FRONT END SALES Q1 2022
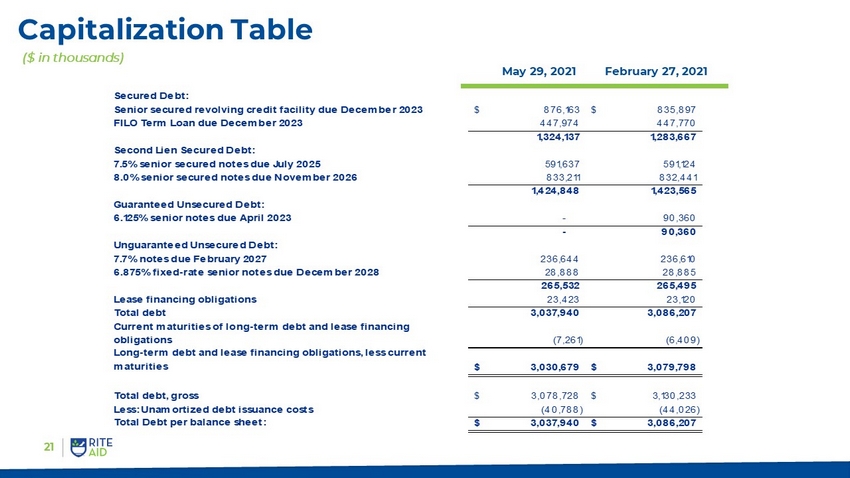
Capitalization Table 21 ($ in thousands) May 29, 2021 February 27, 2021 Secured Debt: Senior secured revolving credit facility due December 2023 876,163$ 835,897$ FILO Term Loan due December 2023 447,974 447,770 1,324,137 1,283,667 Second Lien Secured Debt: 7.5% senior secured notes due July 2025 591,637 591,124 8.0% senior secured notes due November 2026 833,211 832,441 1,424,848 1,423,565 Guaranteed Unsecured Debt: 6.125% senior notes due April 2023 - 90,360 - 90,360 Unguaranteed Unsecured Debt: 7.7% notes due February 2027 236,644 236,610 6.875% fixed-rate senior notes due December 2028 28,888 28,885 265,532 265,495 Lease financing obligations 23,423 23,120 Total debt 3,037,940 3,086,207 Current maturities of long-term debt and lease financing obligations (7,261) (6,409) Long-term debt and lease financing obligations, less current maturities 3,030,679$ 3,079,798$ Total debt, gross 3,078,728$ 3,130,233$ Less: Unamortized debt issuance costs (40,788) (44,026) Total Debt per balance sheet: 3,037,940$ 3,086,207$
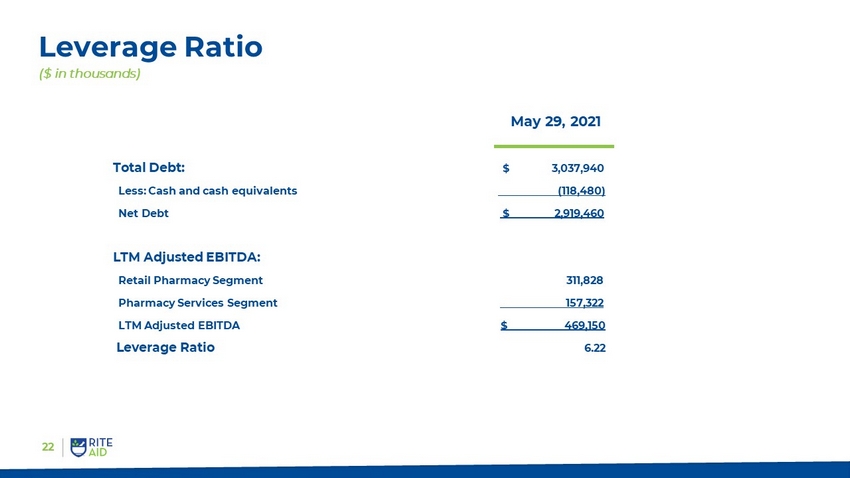
22 Leverage Ratio ($ in thousands) Total Debt: $ 3,037,940 Less: Cash and cash equivalents ( 118,480) Net Debt $ 2,919,460 LTM Adjusted EBITDA: Retail Pharmacy Segment 311,828 Pharmacy Services Segment 157,322 LTM Adjusted EBITDA $ 469,150 Leverage Ratio 6.22 May 29, 2021
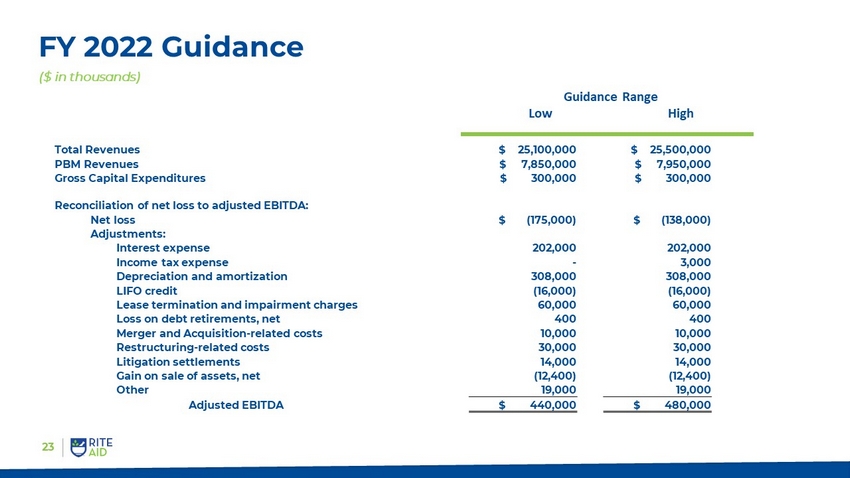
23 FY 2022 Guidance ($ in thousands) Total Revenues $ 25,100,000 $ 25,500,000 PBM Revenues $ 7,850,000 $ 7,950,000 Gross Capital Expenditures $ 300,000 $ 300,000 Reconciliation of net loss to adjusted EBITDA: Net loss $ ( 175,000 ) $ (138,000 ) Adjustments: Interest expense 202,000 202,000 Income tax expense - 3,000 Depreciation and amortization 308,000 308,000 LIFO credit (16,000 ) (16,000 ) Lease termination and impairment charges 60,000 60,000 Loss on debt retirements, net 400 400 Merger and Acquisition - related costs 10,000 10,000 Restructuring - related costs 30,000 30,000 Litigation settlements 14,000 14,000 Gain on sale of assets, net (12,400) (12,400) Other 19,000 19,000 Adjusted EBITDA $ 440,000 $ 480,000 Guidance Range Low High
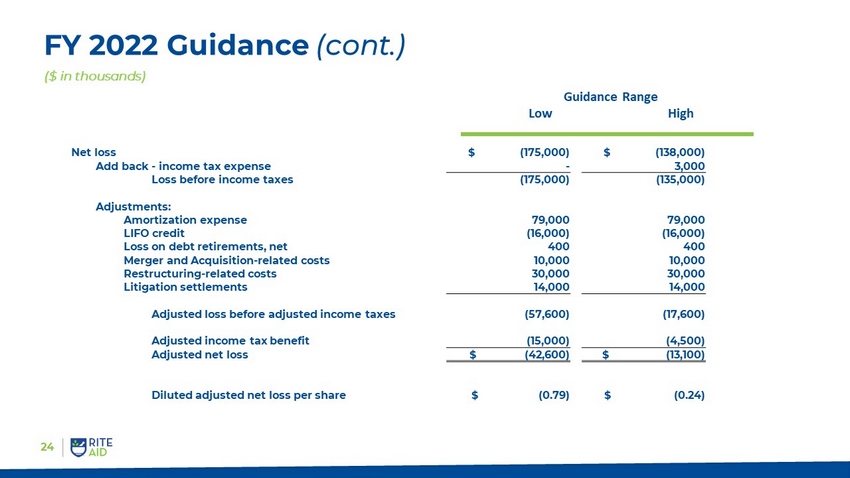
24 FY 2022 Guidance (cont.) ($ in thousands) Guidance Range Low High Net loss $ ( 175,000 ) $ (138,000 ) Add back - income tax expense - 3,000 Loss before income taxes (175,000 ) (135,000 ) Adjustments: Amortization expense 79,000 79,000 LIFO credit (16,000 ) (16,000 ) Loss on debt retirements, net 400 400 Merger and Acquisition - related costs 10,000 10,000 Restructuring - related costs 30,000 30,000 Litigation settlements 14,000 14,000 Adjusted loss before adjusted income taxes (57,600) (17,600) Adjusted income tax benefit (15,000) (4,500) Adjusted net loss $ (42,600) $ (13,100) Diluted adjusted net loss per share $ (0.79) $ (0.24)