Attached files
| file | filename |
|---|---|
| 8-K - 8-K - AGILYSYS INC | agys-8k_20210623.htm |
INVESTOR PRESENTATION June 2021 Exhibit 99.1 Agilysys
Forward-looking Statements & Non-GAAP Financial Information Forward-Looking Language This presentation contains “forward-looking statements” within the meaning of the safe harbor provisions of the U.S. Private Securities Litigation Reform Act of 1995. Forward-looking statements can be identified by words such as: “anticipate,” “intend,” “plan,” “goal,” “seek,” “believe,” “project,” “estimate,” “expect,” “strategy,” “future,” “likely,” “may,” “should,” “will” and similar references to future periods. Examples of forward-looking statements include, among others, our revenue and Adjusted EBITDA guidance for the second quarter, statements we make regarding our ability to improve our competitive positioning and improvement of our business momentum and business health over time once the industry begins to recover. Forward-looking statements are neither historical facts nor assurances of future performance. Instead, they are based only on our current beliefs, expectations and assumptions regarding the future of our business, future plans and strategies, projections, anticipated events and trends, the economy and other future conditions. Because forward-looking statements relate to the future, they are subject to inherent uncertainties, risks and changes in circumstances that are difficult to predict and many of which are outside of our control. Our actual results and financial condition may differ materially from those indicated in the forward-looking statements. Therefore, you should not rely on any of these forward-looking statements. Important factors that could cause our actual results and financial condition to differ materially from those indicated in the forward-looking statements include, among others, the effect of the COVID-19 pandemic on our business and the success of any measures we have taken or may take in the future in response thereto; and the risks described in the Company’s filings with the Securities and Exchange Commission, including the Company’s reports on Form 10-K and Form 10-Q. Any forward-looking statement made by us in this press release is based only on information currently available to us and speaks only as of the date on which it is made. We undertake no obligation to publicly update any forward-looking statement that may be made from time to time, whether written or oral, whether as a result of new information, future developments or otherwise. Use of Non-GAAP Financial Information To supplement the unaudited consolidated financial statements presented in accordance with U.S. GAAP in this press release, certain non-GAAP financial measures as defined by the SEC rules are used. These non-GAAP financial measures include EBITDA, Adjusted EBITDA, adjusted net income, adjusted basic earnings per share, adjusted diluted earnings per share and free cash flow. Management believes that such information can enhance investors’ understanding of the Company’s ongoing operations. Agilysys
The Business We Are In We Are in the Business of Providing A Fully Integrated Suite of Software Solutions to Enterprise Food & Beverage and Lodging Operators in the Hospitality Space that Enable Memorable Experiences Across All Channels of Guest Engagement Agilysys
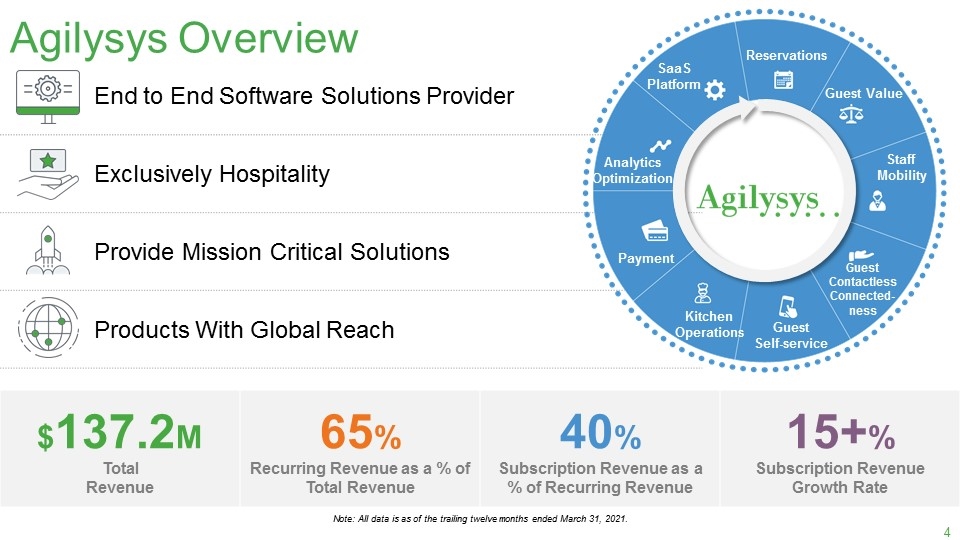
End to End Software Solutions Provider Exclusively Hospitality Provide Mission Critical Solutions Products With Global Reach Agilysys Overview Reservations Guest Value Staff Mobility Guest Contactless Connected- ness Guest Self-service Kitchen Operations Payment Analytics Optimization SaaS Platform $137.2M Total Revenue 65% Recurring Revenue as a % of Total Revenue 40% Subscription Revenue as a % of Recurring Revenue 15+% Subscription Revenue Growth Rate Note: All data is as of the trailing twelve months ended March 31, 2021. End to End Software Solutions Provider Exclusively Hospitality Provide Mission Critical Solutions Products With Global Reach Reservations SaaS Platform Analytics Optimization Payment Kitchen Operations Guest Self-service Guest Contactless Connected-ness Staff Mobility Guest Value Agilysys $137.2M Total Revenue 65% Recurring Revenue as a % of Total Revenue 40% Subscription Revenue as a % of Recurring Revenue 15+% Subscription Revenue Growth Rate Agilysys
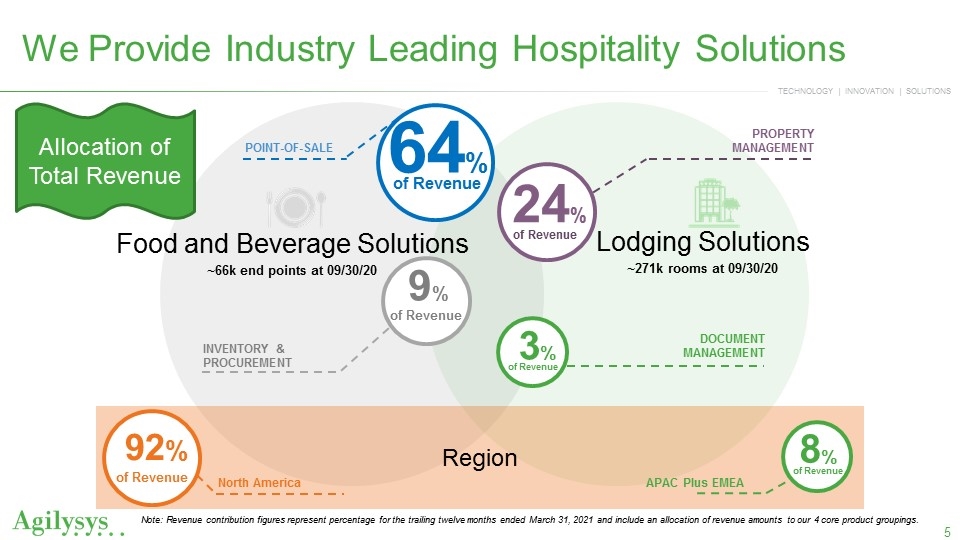
We Provide Industry Leading Hospitality Solutions Lodging Solutions ~271k rooms at 09/30/20 Food and Beverage Solutions ~66k end points at 09/30/20 64% of Revenue 24% of Revenue 9% of Revenue INVENTORY & PROCUREMENT 3% of Revenue DOCUMENT MANAGEMENT PROPERTY MANAGEMENT Note: Revenue contribution figures represent percentage for the trailing twelve months ended March 31, 2021 and include an allocation of revenue amounts to our 4 core product groupings. POINT-OF-SALE Region 92% of Revenue North America 8% of Revenue APAC Plus EMEA Allocation of Total Revenue 64% of Revenue 24% of Revenue 9% of Revenue 3% of Revenue 8% of Revenue 92% of Revenue 8% of Revenue Agilysys
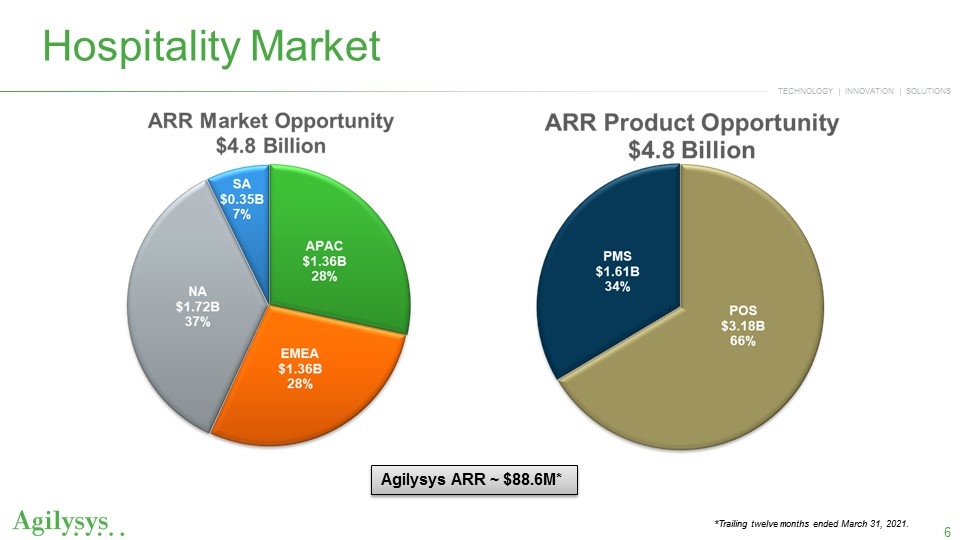
Agilysys ARR ~ $88.6M* *Trailing twelve months ended March 31, 2021. Hospitality Market ARP Market Opportunity $4.8 Billion SA $0.35B 7% NA $1.72B 37% EMEA $1.36B 28% APAC $1.36B 28% ARP Product Opportunity $4.8 Billion PMS $1.61B 34% POS $3.18B 66% Agilysys
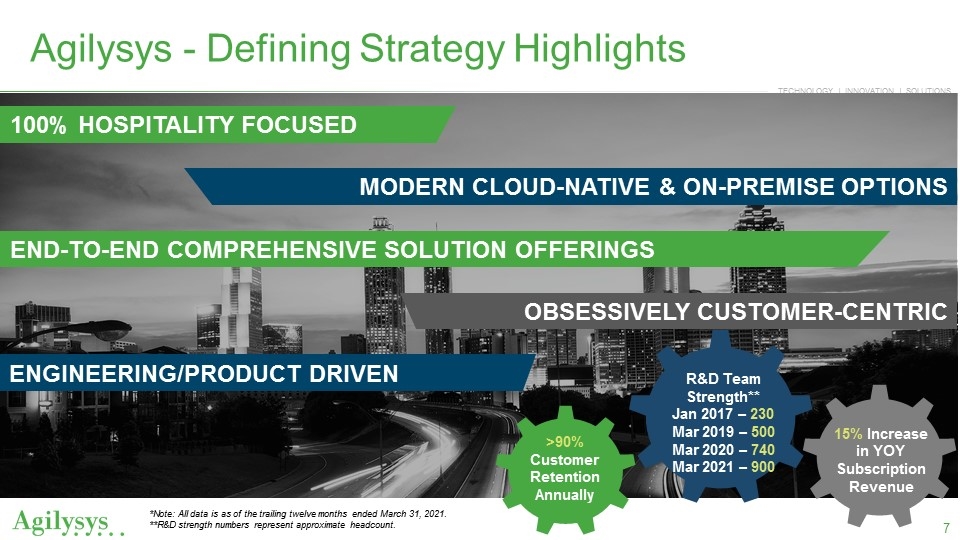
Agilysys - Defining Strategy Highlights 100% HOSPITALITY FOCUSED OBSESSIVELY CUSTOMER-CENTRIC END-TO-END COMPREHENSIVE SOLUTION OFFERINGS MODERN CLOUD-NATIVE & ON-PREMISE OPTIONS ENGINEERING/PRODUCT DRIVEN R&D Team Strength** Jan 2017 – 230 Mar 2019 – 500 Mar 2020 – 740 Mar 2021 – 900 >90% Customer Retention Annually 15% Increase in YOY Subscription Revenue *Note: All data is as of the trailing twelve months ended March 31, 2021. **R&D strength numbers represent approximate headcount. Agilysys
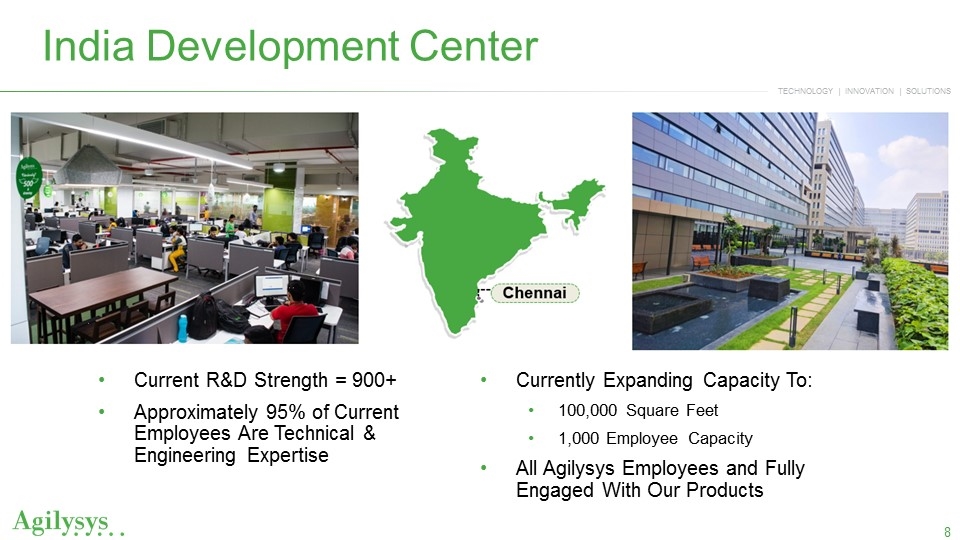
India Development Center Current R&D Strength = 900+ Approximately 95% of Current Employees Are Technical & Engineering Expertise Currently Expanding Capacity To: 100,000 Square Feet 1,000 Employee Capacity All Agilysys Employees and Fully Engaged With Our Products Chennai Agilysys
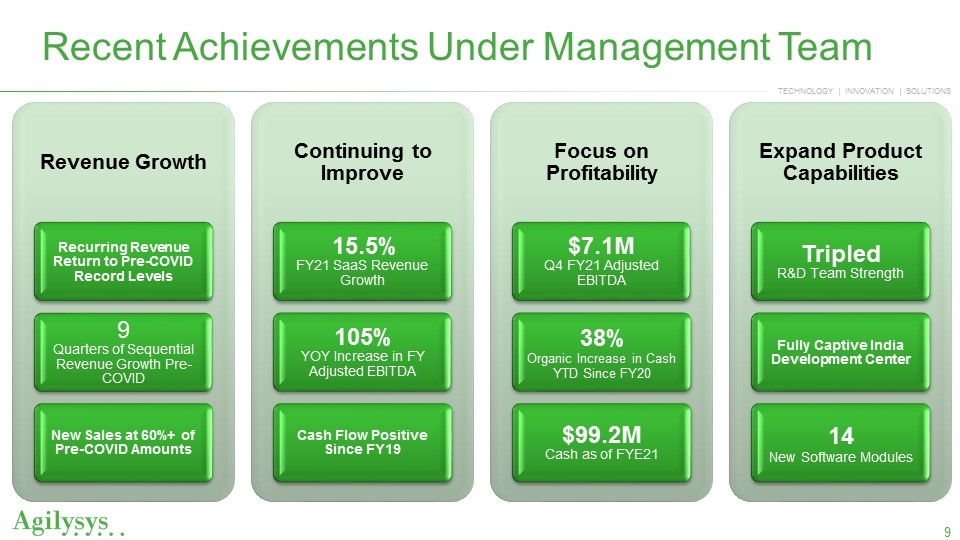
Recent Achievements Under Management Team Revenue Growth Recurring Revenue Return to Pre-COVID Record Levels 9 Quarters of Sequential Revenue Growth Pre-COVID New Sales at 60%+ of Pre-COVID Amounts Continuing to Improve 15.5% FY21 SaaS Revenue Growth 105% OY Increase in FY Adjusted EBITDA Cash Flow Positive Since FY19 Focus on Profitability $7.1M Q4 FY21 Adjusted EBITDA 38% Organic Increase in Cash YTD Since FY20 $99.2M Cash as of FYE21 Expand Product Capabilities Tripled R&D Team Strength Fully Captive India Development Center 14 New Software Modules Agilysys Revenue Growth Focus on Profitability Expand Product Capabilities 9 Quarters of Sequential Revenue Growth Pre-COVID Recurring Revenue Return to Pre-COVID Record Levels $7.1M Q4 FY21 Adjusted EBITDA Tripled R&D Team Strength 38% Organic Increase in Cash YTD Since FY20 15.5% FY21 SaaS Revenue Growth 105% YOY Increase in FY Adjusted EBITDA Fully Captive India Development Center New Sales at 60%+ of Pre-COVID Amounts Cash Flow Positive Since FY19 14 New Software Modules $99.2M Cash as of FYE21 Continuing to Improve
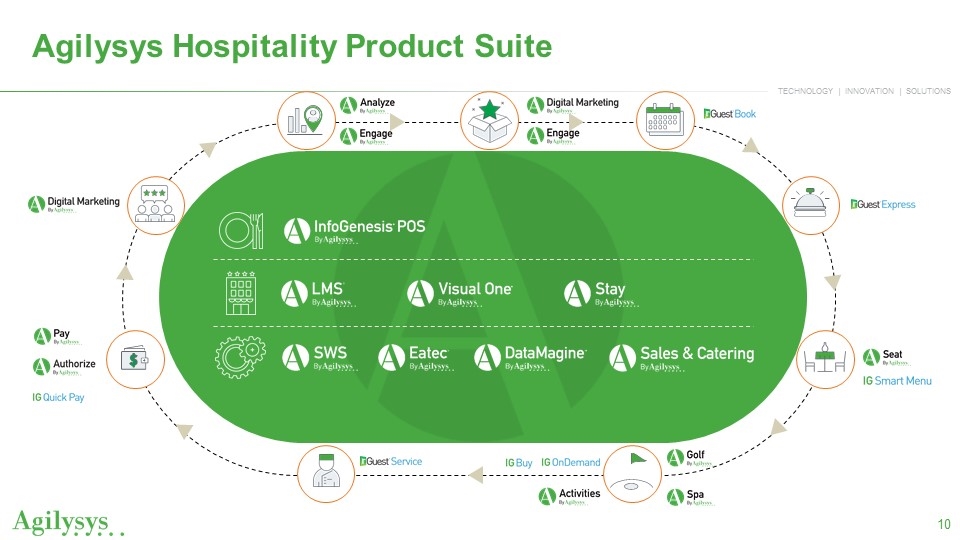
Agilysys Hospitality Product Suite Agilysys
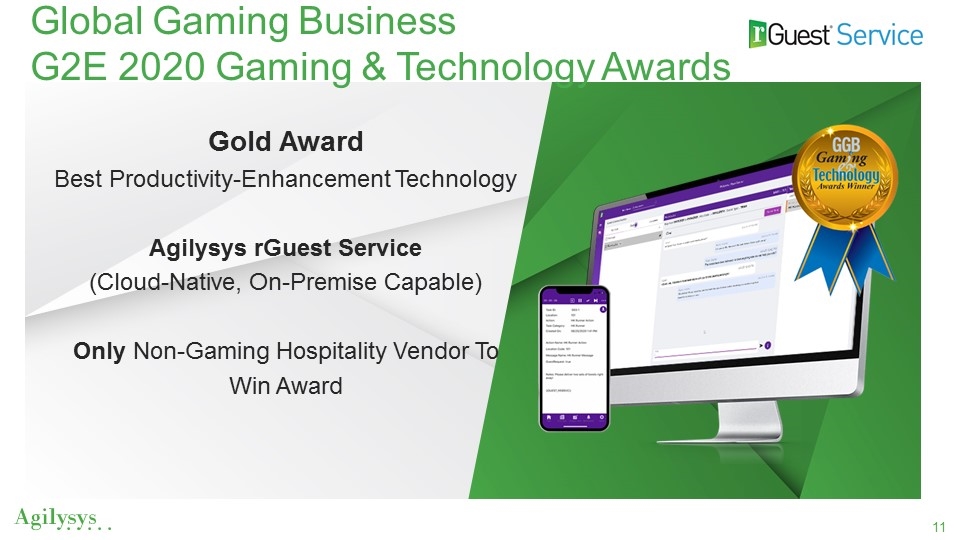
Gold Award Best Productivity-Enhancement Technology Agilysys rGuest Service (Cloud-Native, On-Premise Capable) Only Non-Gaming Hospitality Vendor To Win Award Global Gaming Business G2E 2020 Gaming & Technology Awards Guest Services Agilysys
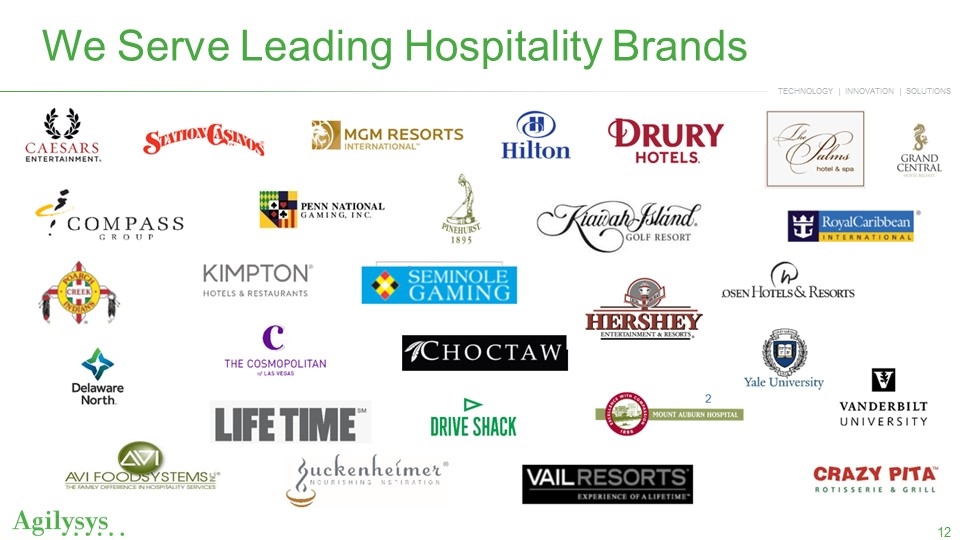
We Serve Leading Hospitality Brands Agilysys
FINANCIAL OVERVIEW Agilysys
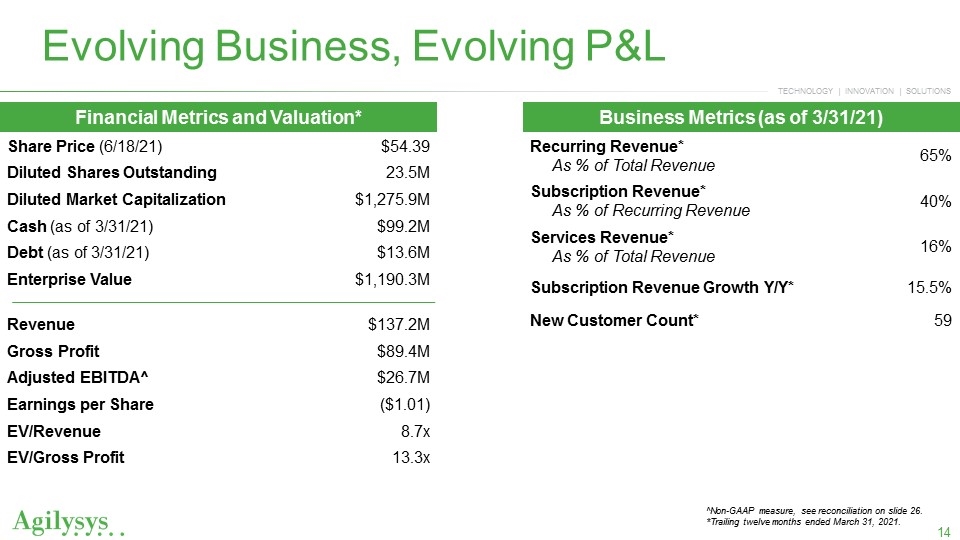
Evolving Business, Evolving P&L Financial Metrics and Valuation* Share Price (6/18/21) $54.39 Diluted Shares Outstanding 23.5M Diluted Market Capitalization $1,275.9M Cash (as of 3/31/21) $99.2M Debt (as of 3/31/21) $13.6M Enterprise Value $1,190.3M Revenue $137.2M Gross Profit $89.4M Adjusted EBITDA^ $26.7M Earnings per Share ($1.01) EV/Revenue 8.7x EV/Gross Profit 13.3x Business Metrics (as of 3/31/21) Recurring Revenue* As % of Total Revenue 65% Subscription Revenue* As % of Recurring Revenue 40% Services Revenue* As % of Total Revenue 16% Subscription Revenue Growth Y/Y* 15.5% New Customer Count* 59 ^Non-GAAP measure, see reconciliation on slide 26. *Trailing twelve months ended March 31, 2021. Financial Metrics and Valuation* Share Price (6/18/21) $54.39 Diluted Shares Outstanding 23.5M Diluted Market Capitalization $1,275.9M Cash (as of 3/31/21) $99.2M Debt (as of 3/31/21) $13.6M Enterprise Value $1,190.3M Revenue $137.2M Gross Profit $89.4M Adjusted EBITDA^ $26.7M Earnings per Share ($1.01) EV/Revenue 8.7x EV/Gross Profit 13.3x Business Metrics (as of 3/31/21) Recurring Revenue* As % of Total Revenue 65% Subscription Revenue* As % of Recurring Revenue 40% Services Revenue* As % of Total Revenue 16% Subscription Revenue Growth Y/Y* 15.5% New Customer Count* 59 Agilysys
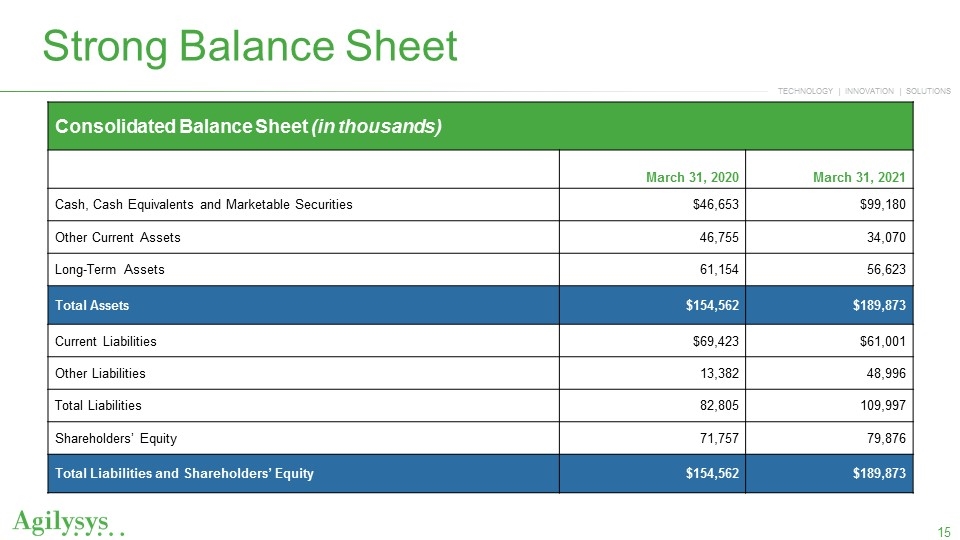
Consolidated Balance Sheet (in thousands) March 31, 2020 March 31, 2021 Cash, Cash Equivalents and Marketable Securities $46,653 $99,180 Other Current Assets 46,755 34,070 Long-Term Assets 61,154 56,623 Total Assets $154,562 $189,873 Current Liabilities $69,423 $61,001 Other Liabilities 13,382 48,996 Total Liabilities 82,805 109,997 Shareholders’ Equity 71,757 79,876 Total Liabilities and Shareholders’ Equity $154,562 $189,873 Strong Balance Sheet Consolidated Balance Sheet (in thousands) March 31, 2020 March 31, 2021 Cash, Cash Equivalents and Marketable Securities $46,653 $99,180 Other Current Assets 46,755 34,070 Long-Term Assets 61,154 56,623 Total Assets $154,562 $189,873 Current Liabilities $69,423 $61,001 Other Liabilities 13,382 48,996 Total Liabilities 82,805 109,997 Shareholders’ Equity 71,757 79,876 Total Liabilities and Shareholders’ Equity $154,562 $189,873 Agilysys
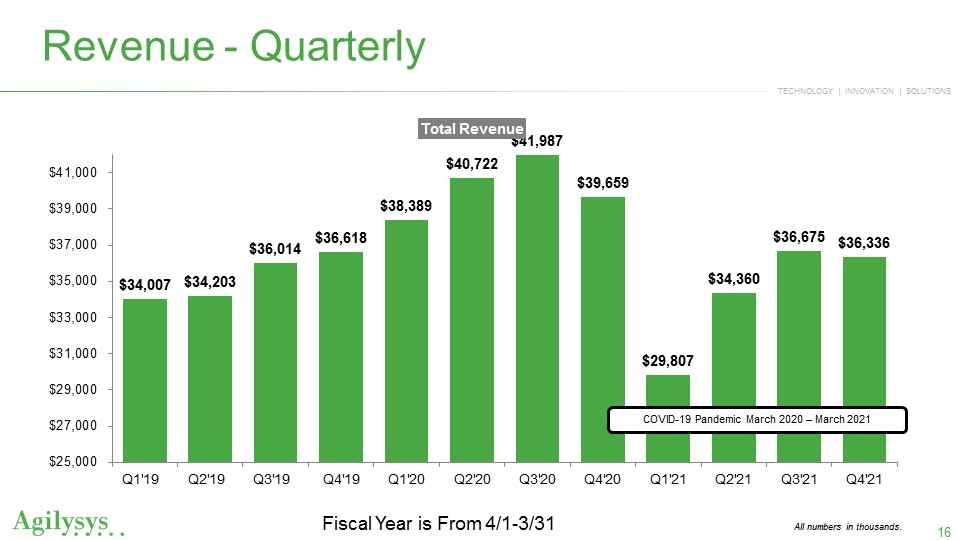
All numbers in thousands. Revenue - Quarterly Fiscal Year is From 4/1-3/31 COVID-19 Pandemic March 2020 – March 2021 Total Revenue $41,000 $39,000 $37,000 $35,000 $33,000 $31,000 $29,000 $27,000 $25,000 Q1’19 $34,007 Q2’19 $34,203 Q3 $36,014 Q4’19 $36,618 Q1’20 $38,389 Q2’20 $40,722 Q3’20 $41,987 Q4’20 $39,659 Q1’21 $29,807 Q2’21 $34,360 Q3’21 $36,675 Q4’21 $36,336 Agilysys
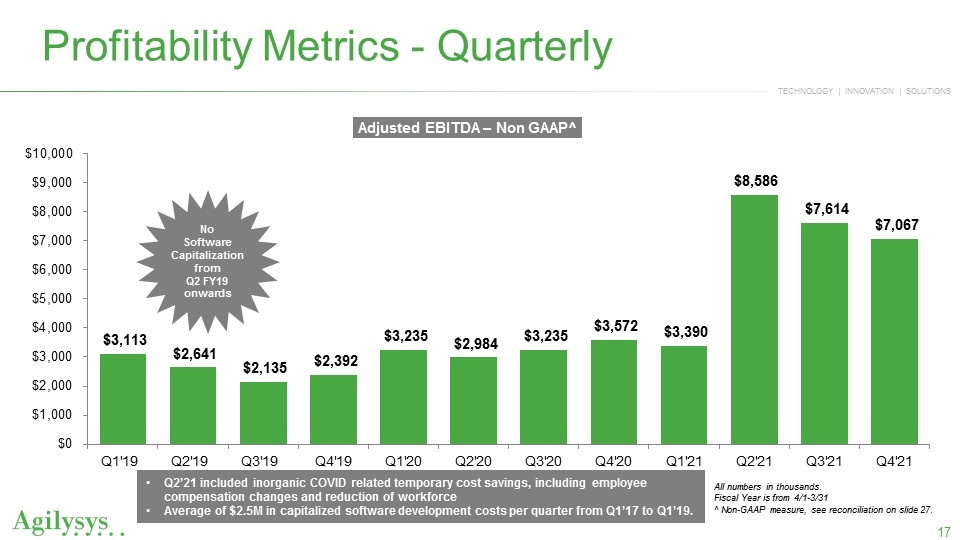
Profitability Metrics - Quarterly All numbers in thousands. Fiscal Year is from 4/1-3/31 ^ Non-GAAP measure, see reconciliation on slide 27. No Software Capitalization from Q2 FY19 onwards Q2’21 included inorganic COVID related temporary cost savings, including employee compensation changes and reduction of workforce Average of $2.5M in capitalized software development costs per quarter from Q1’17 to Q1’19.
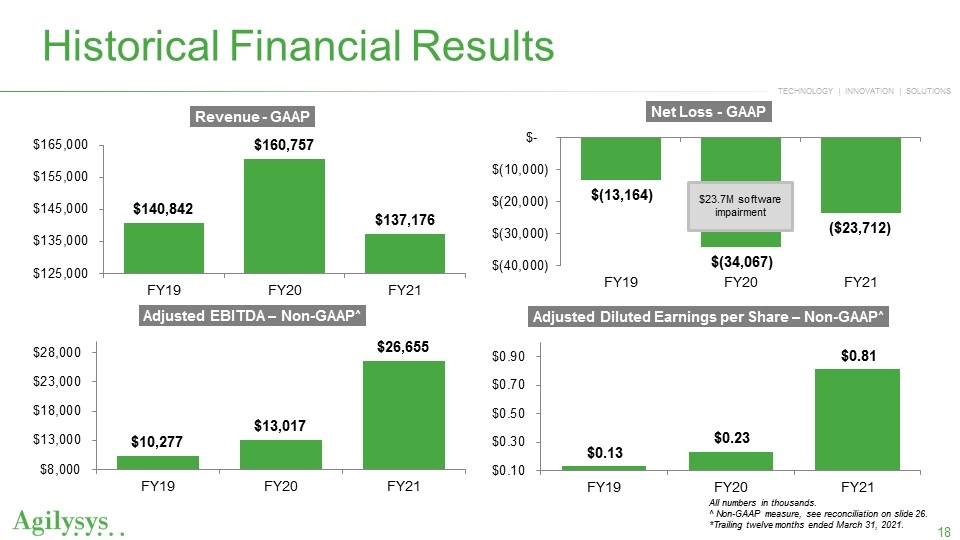
Historical Financial Results $23.7M software impairment All numbers in thousands. ^ Non-GAAP measure, see reconciliation on slide 26. *Trailing twelve months ended March 31, 2021. Revenue – GAAP $165,000 $155,000 $145,000 $135,000 $125,000 FY19 $140,842 FY20 $160,757 FY21 $137,176 Adjusted EBITDA – Non-GAAP^ $28,000 $23,000 $18,000 $13,000 $8,000 FY19 $10,277 FY20 $13,017 FY21 $26,655 Net Loss – GAAP $- $(10,000) $(20,000) $(30,000) $(40,000) FY19 $(13,164) FY20 $(34,067) FY21 ($23,712) Adjusted Diluted Earnings per Share – Non-GAAP^ $0.90 $0.70 $0.50 $0.30 $0.10 FY19 $0.13 FY20 $0.23 FY21 $0.81 Agilysys
APPENDIX Agilysys
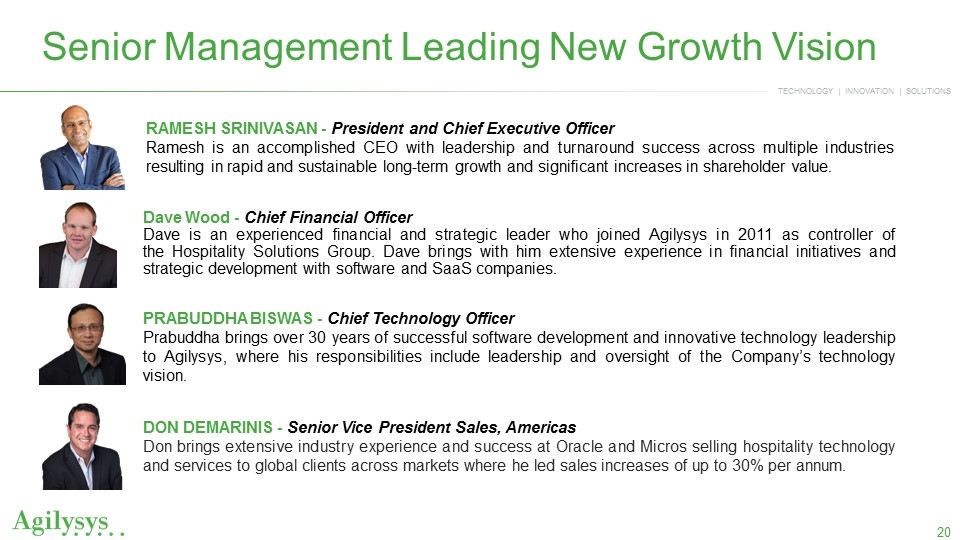
Dave Wood - Chief Financial Officer Dave is an experienced financial and strategic leader who joined Agilysys in 2011 as controller of the Hospitality Solutions Group. Dave brings with him extensive experience in financial initiatives and strategic development with software and SaaS companies. RAMESH SRINIVASAN - President and Chief Executive Officer Ramesh is an accomplished CEO with leadership and turnaround success across multiple industries resulting in rapid and sustainable long-term growth and significant increases in shareholder value. PRABUDDHA BISWAS - Chief Technology Officer Prabuddha brings over 30 years of successful software development and innovative technology leadership to Agilysys, where his responsibilities include leadership and oversight of the Company’s technology vision. DON DEMARINIS - Senior Vice President Sales, Americas Don brings extensive industry experience and success at Oracle and Micros selling hospitality technology and services to global clients across markets where he led sales increases of up to 30% per annum. Senior Management Leading New Growth Vision Agilysys
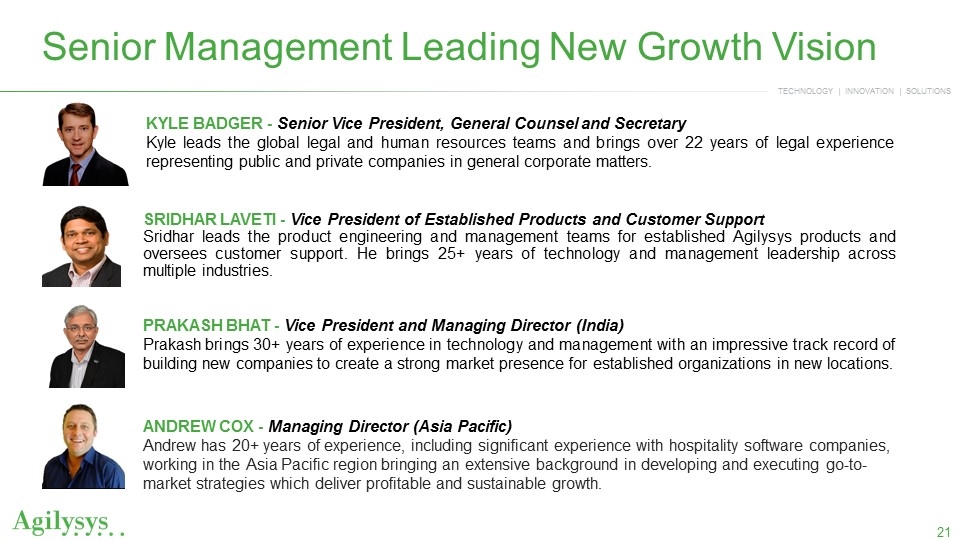
SRIDHAR LAVETI - Vice President of Established Products and Customer Support Sridhar leads the product engineering and management teams for established Agilysys products and oversees customer support. He brings 25+ years of technology and management leadership across multiple industries. KYLE BADGER - Senior Vice President, General Counsel and Secretary Kyle leads the global legal and human resources teams and brings over 22 years of legal experience representing public and private companies in general corporate matters. PRAKASH BHAT - Vice President and Managing Director (India) Prakash brings 30+ years of experience in technology and management with an impressive track record of building new companies to create a strong market presence for established organizations in new locations. ANDREW COX - Managing Director (Asia Pacific) Andrew has 20+ years of experience, including significant experience with hospitality software companies, working in the Asia Pacific region bringing an extensive background in developing and executing go-to-market strategies which deliver profitable and sustainable growth. Senior Management Leading New Growth Vision Agilysys
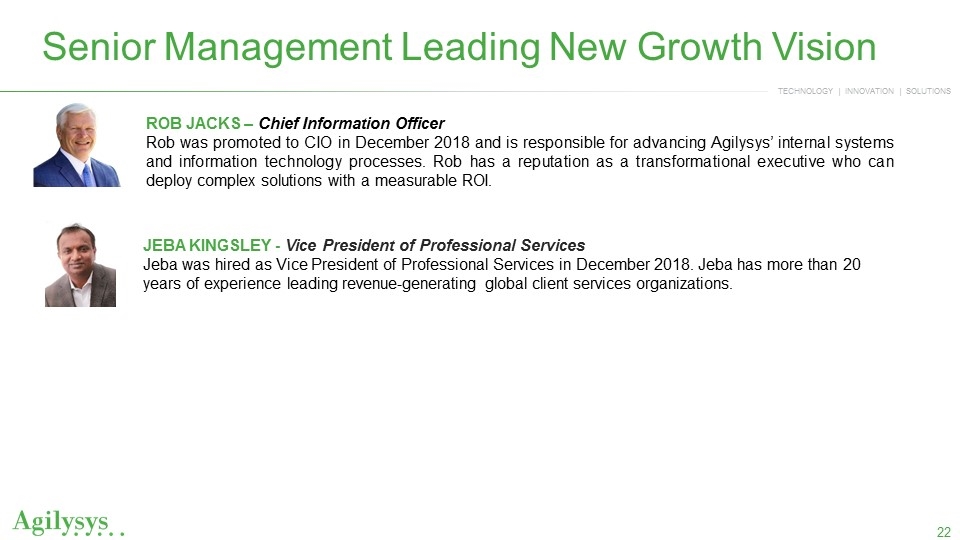
ROB JACKS – Chief Information Officer Rob was promoted to CIO in December 2018 and is responsible for advancing Agilysys’ internal systems and information technology processes. Rob has a reputation as a transformational executive who can deploy complex solutions with a measurable ROI. JEBA KINGSLEY - Vice President of Professional Services Jeba was hired as Vice President of Professional Services in December 2018. Jeba has more than 20 years of experience leading revenue-generating global client services organizations. Senior Management Leading New Growth Vision Agilysys
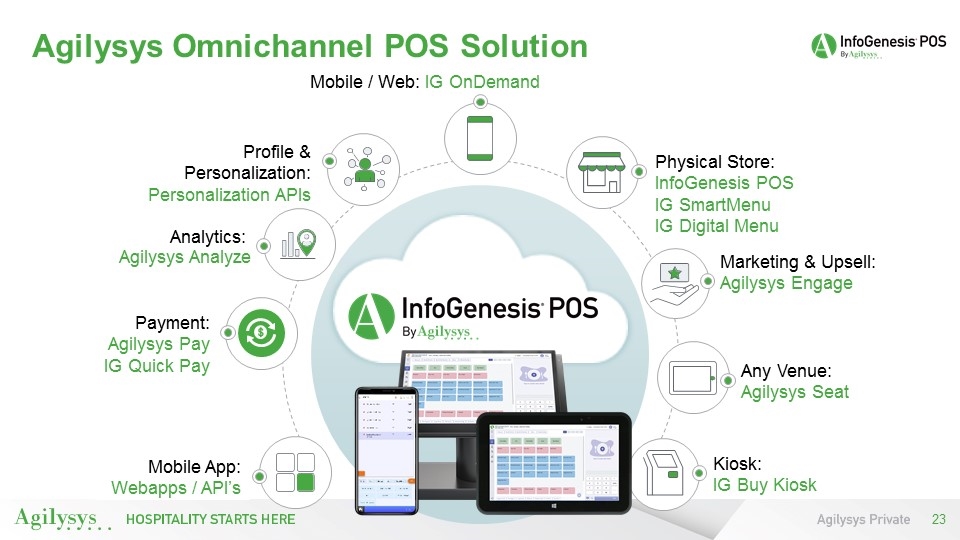
Agilysys Omnichannel POS Solution Mobile / Web: IG OnDemand Physical Store: InfoGenesis POS IG SmartMenu IG Digital Menu Profile & Personalization: Personalization APIs Payment: Agilysys Pay IG Quick Pay Mobile App: Webapps / API’s Analytics: Marketing & Upsell: Agilysys Engage Agilysys Analyze Any Venue: Agilysys Seat Kiosk: IG Buy Kiosk Physical Store: InfoGenesis POS IG Smart Menu IG Digital Menu Profile & Personalization: Personalization APIs Analytics: Payment: Agilysys Pay IG Quick Pay Mobile App: Webapps / API’s Agilysys HOSPITALITY STARTS HARE Agilysys Private InfoGenesis POP By Agilysys
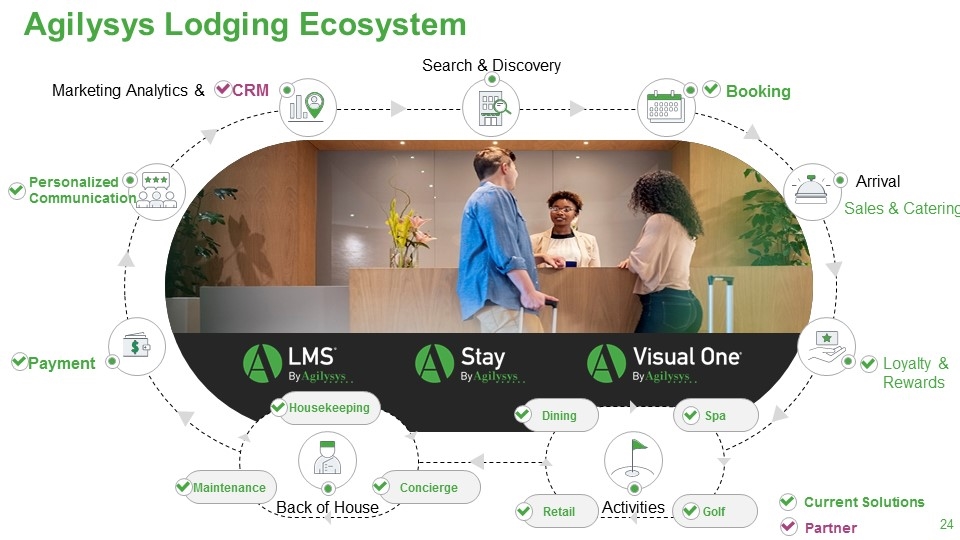
Search & Discovery Back of House Marketing Analytics & CRM Personalized Communication Payment Booking Arrival Loyalty & Rewards Maintenance Concierge Housekeeping Activities Retail Golf Dining Spa Agilysys Lodging Ecosystem Partner Current Solutions Sales & Catering Loyalty & Rewards Arriva Booking Activities Back of House Marketing Analytics & CRM Personalized Communication Payment LMS By Agilysys Stay By Agilysys Visual One By Agilysys
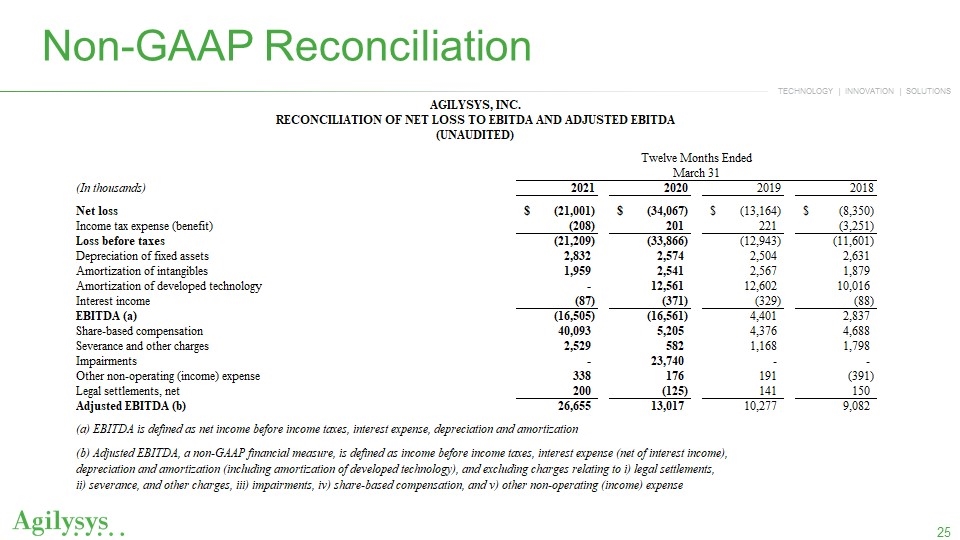
Non-GAAP Reconciliation AGILYSYS, INC. RECONCILIATION OF NET LOSS TO EBITDA AND ADJUSTED EBITDA (UNAUDITED) Twelve Months Ended (In thousands) March 31 2021 2020 2019 2018 Net loss $(21,001) $(34,067) $(13,164) $(8,350) Income tax expense (benefit) (208) 201 221 (3,251) Loss before taxes (21,209) (33,866) (12,943) (11,601) Depreciation of fixed assets 2,832 2,504 2,631 Amortization of intangibles 1,959 2,541 2,567 1,879 Amortization of developed technology - 12,561 12,602 10,016 Interest income (87) (371) (329) (88) EBITDA (a) (16,505) (16,561) 4,401 2,837 Share-based compensation 40,093 5,205 4,376 4,688 Severance and other charges 2,529 582 1,168 1,798 Impairments - 23,740 - - Other non-operating (income) expense 338 176 191 (391) Legal settlements, net 200 (125) 141 150 Adjusted EBITDA (b) 26,655 13,017 10,277 9,082 (a) EBITDA is defined as net income before income taxes, interest expense, depreciation and amortization (b) Adjusted EBITDA, a non-GAAP financial measure, is defined as income before income taxes, interest expense (net of interest income), depreciation and amortization (including amortization of developed technology), and excluding charges relating to i) legal settlements, ii) severance, and other charges, iii) impairments, iv) share-based compensation, and v) other non-operating (income) expense Agilysys
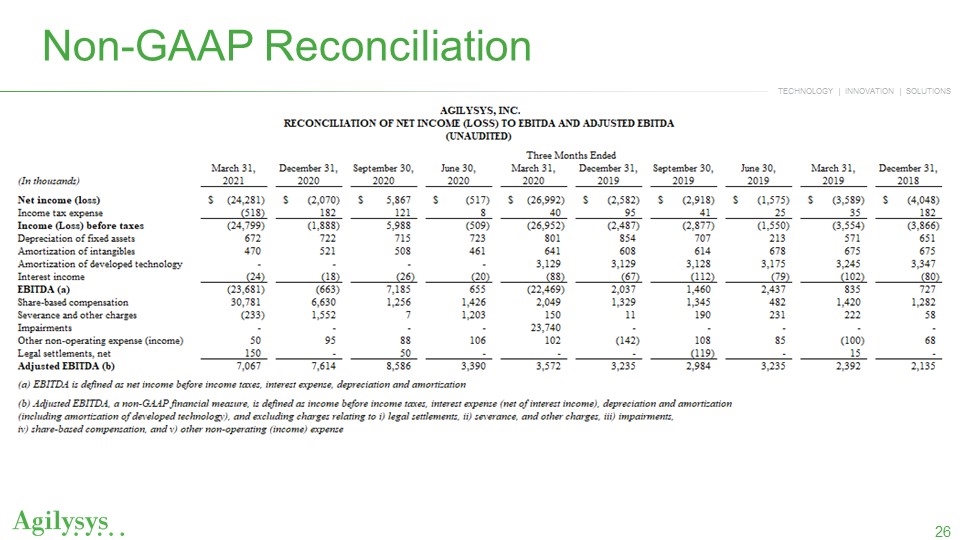
Non-GAAP Reconciliation AGILYSYS, INC. RECONCILIATION OF NET INCOME (LOSS) TO EBITDA AND ADJUSTED EBITDA (UNAUDITED) Three Months Ended (In thousands) March 31, December 31, September 30, June 30, March 31, December 31, September 30, June 30, March 31, December 31, 2021 2020 2020 2020 2020 2019 2019 2019 2019 2018 Net income (loss) $(24,281) $(2,070) $5,867 $(517) $(26,992) $(2,582) $(2,918) $(1,575) $(3,589) $(4,048) Income tax expense (518) 182 121 8 40 95 41 25 35 182 Income (Loss) before taxes (24,799) (1,888) 5,988 (509) (26,952) (2,487) (2,877) (1,550) (3,554) (3,866) Depreciation of fixed assets 672 722 715 723 801 854 707 213 571 651 Amortization of intangibles 470 521 508 461 641 608 614 678 675 675 Amortization of developed technology - - - - 3,129 3,129 3,128 3,175 3,245 3,347 Interest income (24) (18) (26) (20) (88) (67) (112) (79) (102) (80) EBITDA (a) (23,681) (663) 7,185 655 (22,469) 2,037 1,460 2,437 835 727 Share-based compensation 30,781 6,630 1,256 1,426 2,049 1,329 1,345 482 1,420 1,282 Severance and other charges (233) 1,552 7 1,203 150 11 190 231 222 58 Impairments - - - - 23,740 - - - - - Other non-operating expense (income) 50 95 88 106 102 (142) 108 85 (100) 68 Legal settlements, net 150 - 50 - - - (119) - 15 - Adjusted EBITDA (b) 7,067 7,614 8,586 3,390 3,572 3,235 2,984 3,235 2,392 2,135 (a) EBITDA is defined as net income before income taxes, interest expense, depreciation and amortization (b) Adjusted EBITDA, a non-GAAP financial measure, is defined as income before income taxes, interest expense (net of interest income), depreciation and amortization (including amortization of developed technology), and excluding charges relating to i) legal settlements, ii) severance, and other charges, iii) impairments, iv) share-based compensation, and v) other non-operating (income) expense Agilysys
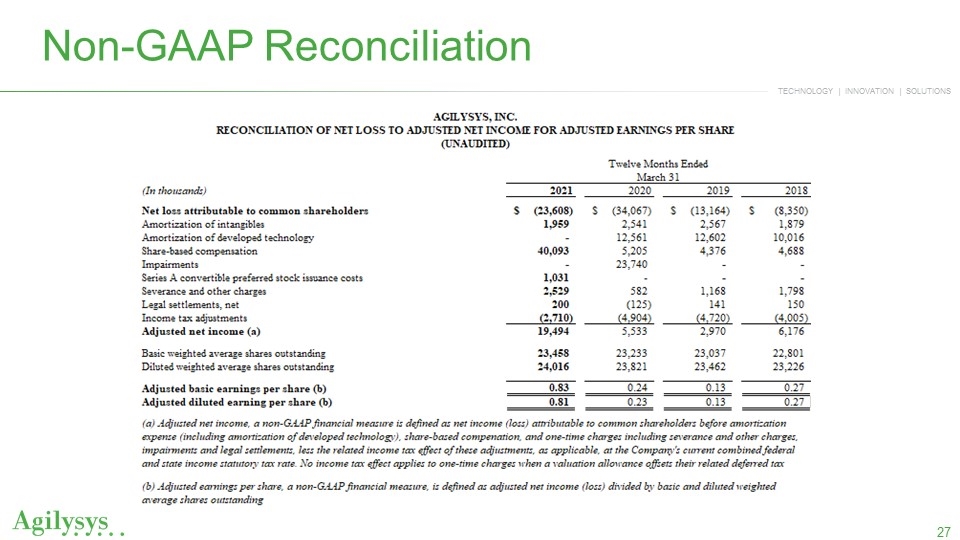
Non-GAAP Reconciliation AGILYSYS, INC. RECONCILIATION OF NET LOSS TO ADJUSTED NET INCOME FOR ADJUSTED EARNINGS PER SHARE (UNAUDITED) Twelve Months Ended (In thousands) March 31 2021 2020 2019 2018 Net loss attributable to common shareholders $(23,608) $(34,067) $(13,164) $(8,350) Amortization of intangibles 1,959 2,541 2,567 1,879 Amortization of developed technology - 12,561 12,602 10,016 Share-based compensation 40,093 5,205 4,376 4,688 Impairments - 23,740 - - Series A convertible preferred stock issuance costs 1,031 - - - Severance and other charges 2,529 582 1,168 1,798 Legal settlements, net 200 (125) 141 150 Income tax adjustments (2,710) (4,904) (4,720) (4,005) Adjusted net income (a) 19,494 5,533 2,970 6,176 Basic weighted average shares outstanding 23,458 23,233 23,037 22,801 Diluted weighted average shares outstanding 24,016 23,821 23,462 23,226 Adjusted basic earnings per share (b) 0.83 0.24 0.13 0.27 Adjusted diluted earning per share (b) 0.81 0.23 0.13 0.27 (a) Adjusted net income, a non-GAAP financial measure is defined as net income (loss) attributable to common shareholders before amortization expense (including amortization of developed technology), share-based compenation, and one-time charges including severance and other charges, impairments and legal settlements, less the related income tax effect of these adjustments, as applicable, at the Company's current combined federal and state income statutory tax rate. No income tax effect applies to one-time charges when a valuation allowance offsets their related deferred tax assets (b) Adjusted earnings per share, a non-GAAP financial measure, is defined as adjusted net income (loss) divided by basic and diluted weighted average shares outstanding Agilysys
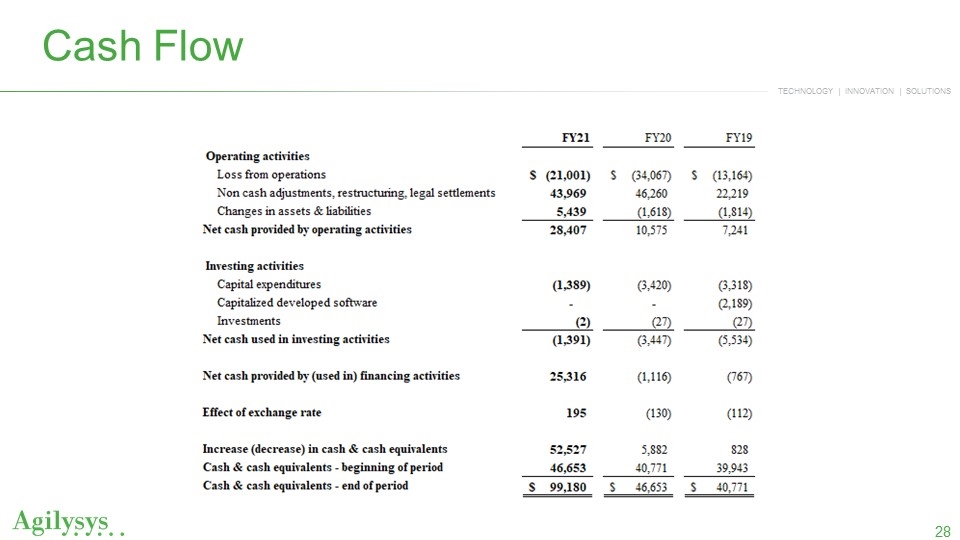
Cash Flow FY21 FY20 FY19 Operating activities Loss from operations $(21,001) $(34,067) $(13,164) Non cash adjustments, restructuring, legal settlements 43,969 46,260 22,219 Changes in assets & liabilities 5,439 (1,618) (1,814) Net cash provided by operating activities 28,407 10,575 7,241 Investing activities Capital expenditures (1,389) (3,420) (3,318) Capitalized developed software - - (2,189) Investments (2) (27) (27) Net cash used in investing activities (1,391) (3,447) (5,534) Net cash provided by (used in) financing activities 25,316 (1,116) (767) Effect of exchange rate 195 (130) (112) Increase (decrease) in cash & cash equivalents 52,527 5,882 828 Cash & cash equivalents - beginning of period 46,653 40,771 39,943 Cash & cash equivalents - end of period $99,180 $46,653 $40,771 Agilysys
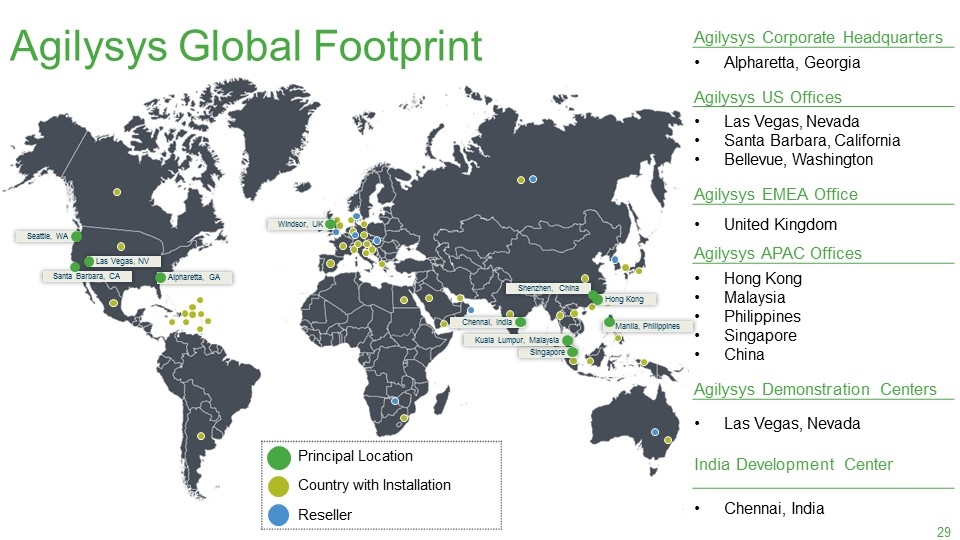
Principal Location Country with Installation Reseller Santa Barbara, CA Seattle, WA Las Vegas, NV Alpharetta, GA Windsor, UK Hong Kong Manila, Philippines Singapore Kuala Lumpur, Malaysia Chennai, India Agilysys Corporate Headquarters Alpharetta, Georgia Agilysys US Offices Las Vegas, Nevada Santa Barbara, California Bellevue, Washington Agilysys EMEA Office United Kingdom Agilysys APAC Offices Hong Kong Malaysia Philippines Singapore China Agilysys Demonstration Centers Las Vegas, Nevada India Development Center Chennai, India Shenzhen, China Agilysys Global Footprint Principal Location Country with Installation Reseller Agilysys Corporate Headquarters Alpharetta, Georgia Agilysys US Offices Las Vegas, Nevada Santa Barbara, California Bellevue, Washington Agilysys EMEA Office United Kingdom Agilysys APAC Offices Hong Kong Malaysia Philippines Singapore China Agilysys Demonstration Centers Las Vegas, Nevada India Development Center Chennai, India

Contact: Jessica Hennessy Sr. Manager Corporate Strategy and Investor Relations (770) 810-6116 InvestorRelations@agilysys.com
