Attached files
| file | filename |
|---|---|
| 8-K - CURRENT REPORT - Greenrose Acquisition Corp. | ea142849-8k_greenrose.htm |
Exhibit 99.1
1 1 1 Business Combination Summary June 2021

2 2 2 Disclaimer This Presentation (together with oral statements made in connection herewith, this “Presentation”) contains selected confidential information about Greenrose Acquisition Corp . (“GREENROSE”) and information relating to GREENROSE’S potential business combination transactions with the companies for which summary overview information is provided herein . By receiving and participating in this Presentation, you expressly agree to keep confidential all otherwise non - public information disclosed in the Presentation, whether orally or in writing . You also agree not to distribute, disclose, or use such information for any purpose, other than for the purpose of you or your firm’s participation in this Presentation and to return to GREENROSE, delete or destroy this Presentation upon GREENROSE’s request . You are advised that the United States securities laws restrict persons in possession of material non - public information relating to a company whose securities are publicly traded – whether such material non - public information is obtained directly or indirectly from that company, its representatives or any party under a duty of confidentiality -- from purchasing or selling securities of such company, or from communicating such information to any other person under circumstances in which it is reasonably foreseeable that such person is likely to purchase or sell such securities on the basis of such information . NEITHER THE SECURITIES AND EXCHANGE COMMISSION NOR ANY STATE SECURITIES COMMISSION HAS APPROVED OR DISAPPROVED OF THE SECURITIES OR DETERMINED IF THIS PRESENTATION IS TRUTHFUL OR COMPLETE . This Presentation contains financial forecasts with respect to GREENROSE’s projected Revenues, EBITDA, and Net Income . GREENROSE’s independent auditors have not audited, reviewed, compiled, or performed any procedures with respect to the projections for the purpose of their inclusion in this Presentation and accordingly, they have not expressed an opinion or provided any other form of assurance with respect thereto for the purpose of this Presentation . These projections should not be relied upon as being necessarily indicative of future results . The assumptions and estimates underlying the prospective financial information are inherently uncertain and are subject to a wide variety of significant business, economic and competitive risks and uncertainties that could cause such estimates to change and actual results to differ materially from those contained in the forward - looking financial information . Accordingly, there can be no assurance that forward - looking statements or projections are indicative of the future performance of GREENROSE, or that actual results will not differ materially from those presented in the prospective or projected financial information . Inclusion of any projection, prospective information, or forward - looking statement in this Presentation should not be regarded as a representation by any person that the projections contained in the prospective financial information will be achieved . Neither GREENROSE, nor any of its respective affiliates or advisors have any obligation to update this Presentation . Although all information and opinions expressed in this Presentation were obtained in good faith from sources believed to be reliable, independent verification has not been made by GREENROSE and no representation or warranty, express or implied, is made as to its accuracy or completeness . This Presentation contains preliminary information only, is subject to change at any time and is not, and should not be assumed to be, complete or to constitute all the information necessary to adequately make an informed decision regarding your evaluation of your possible engagement with GREENROSE . Forward - Looking Statements . Statements made in this presentation that are not historical facts are “forward - looking statements” within the meaning of Section 21 E of the Securities Exchange Act of 1934 , as amended, and the Private Securities Litigation Reform Act of 1995 . Forward - looking statements may relate to the business combination and any other statements relating to future results, strategy and plans of GREENROSE (including certain projections and business trends, and statements which may be identified by the use of the words “plans”, “expects” or “does not expect”, “estimated”, “is expected”, “budget”, “scheduled”, “estimates”, “forecasts”, “intends”, “anticipates” or “does not anticipate”, or “believes”, or variations of such words and phrases or state that certain actions, events or results “may”, “could”, “would”, “might”, “projects”, “will” or “will be taken”, “occur” or “be achieved”) . Such statements are provided for illustrative purposes only and are not to be relied upon as predictions or any assurance or guarantee by any party of actual performance of GREENROSE and the proposed acquisitions . Forward - looking statements are based on the opinions and estimates of management of GREENROSE and/or the estimates of management of the companies GREENROSE proposes to acquire, as the case may be, as of the date such statements are made, and they are subject to known and unknown risks, uncertainties, assumptions and other factors that may cause the actual results, level of activity, performance or achievements to be materially different from those expressed or implied by such forward - looking statements . These risks and uncertainties include, but are not limited to, the occurrence of any event, change or other circumstances that could give rise to a delay in or the failure to close any business combination ; the amount of any redemptions ; the ability to attract and retain key personnel ; the ability to achieve timely stockholder and regulatory approvals ; prevailing industry trends including consumer spending as well as in cannabis markets ; legislation or regulatory requirements and developments in the global economy in general and the regulation of cannabis in particular ; the public health crisis related to the coronavirus (COVID - 19 ) pandemic and resulting significant negative effects to the global economy ; disruption of global supply chains and distribution channels ; as well as significant volatility in and possible disruption of financial markets ; increased operating costs, decreased ability to profitably develop and operate cultivation and processing facilities as well as retail points of sale ; competition in the US cannabis markets ; and the impact of government shutdowns or other limitations impacting business activity generally . This Presentation also contains estimates, projections and other information concerning our industry, our business, and the markets for our products and services . Some data and other information related to our businesses are based on internal estimates and calculations that are derived from research we conducted and budgetary information, estimates and projections of management of the companies GREENROSE seeks to acquire . You are cautioned not to give undue weight to any such estimates, projections and other forward - looking information . Use of Projections . This Presentation contains projected financial information with respect to the companies GREENROSE proposes to acquire as well as GREENROSE as a combined operating entity assuming the proposed acquisitions are completed . Such projected financial information constitutes forward - looking information, is for illustrative purposes only and should not be relied upon as being indictive of future results . The assumptions and estimates underlying such projections are inherently uncertain, subject to a wide variety of significant business, economic, competitive and other risks and uncertainties as noted above in “Forward - looking statements” . Actual results may differ materially from financial forecasts contained in this Presentation, and the inclusion of such projections in this Presentation shall not constitute, and should not be regarded as, a representation by any person that such forecasts will be achieved . This Presentation also contains trademarks, service marks and trade names of third parties, which are the property of their respective owners . The use or display of third parties’ trademarks, service marks, trade names or products in this Presentation is not intended to, and does not imply, any relationship with GREENROSE, or an endorsement or sponsorship by or of GREENROSE . Solely for convenience, the trademarks, service marks and trade names referred to in this Presentation may appear without the ®, TM or SM symbols, but such references are not intended to indicate, in any way, that GREENROSE will not assert, to the fullest extent under applicable law, their rights or the right of the applicable licensor to these trademarks, service marks and trade names . Nothing herein should be construed as legal, financial, tax, investment management or other advice . You should consult your own advisers concerning any legal, financial, tax, investment management or other considerations concerning the opportunity described herein . The general explanations included in this Presentation cannot address, and are not intended to address, your specific investment objectives, financial situation or financial needs . This Presentation relates to the prospective acquisition by GREENROSE of several companies and may be deemed to be solicitation material in respect of the prospective business combinations . The business proposed combinations will be submitted to the stockholders of GREENROSE and the respective target companies for their approval . This Presentation is for informational purposes only and is neither an offer to sell or purchase, nor the solicitation of an offer to buy or sell any securities, nor is it a solicitation of any vote, consent, or approval in any jurisdiction pursuant to or in connection with the business combination or otherwise, nor shall there be any sale, issuance or transfer of securities in any jurisdiction in contravention of applicable law .

3 3 3 Table of Contents I. Executive Summary of Business Combination (“BC”)………………………………………………4 II. Combined Company Overview…………………………………………………………………….. 10 III. Financial Overview and Valuation…………………….………………………………………….... 18 IV. Appendix ............................................................................................................................. ... 26 A. Market Overview…………………………………………………………………………………… 27 B. Target Company Detail …………………………………………………………………………… 31 This Company presentation dated June 2021 and the financial information and projections reflected herein replace and supersede in all respects the presentation filed by the Company as an exhibit to the Company’s Form 8 - K filed with the SEC on March 18, 2021. The March 2021 Presentation should no longer be relied upon by investors, potential investors or other third parties. SC5

4 4 4 I. Executive Summary of Business Combination

5 5 5 Overview of the Business Combination 9 Dispensaries 7 States with operations 300k+ Square Feet of Cultivation 9 Cultivation Facilities 6 Processing Facilities 120K+ lbs. Annual Yield Cannabis Flower $ 83M 2020A Revenue $ 32M 2020A Adj. EBITDA (1) $ 115M - $135M 2021P Revenue (2) $ 45M - $55M 2021P Adj. EBITDA (1,2) $ 230M 2022P Revenue $ 90M 2022P Adj. EBITDA (1) (1) Adjusted EBITDA: Represents EBITDA adjusted to (i) eliminate certain non - operating income or expense items, (ii) eliminate the i mpact of certain non - cash and other items that are included in profit or loss for the period, and (iii) eliminate certain unusual items impacting results in a particular period. (2) Includes actual results for the period ended March 31, 2021, and projected amounts for the remainder of 2021
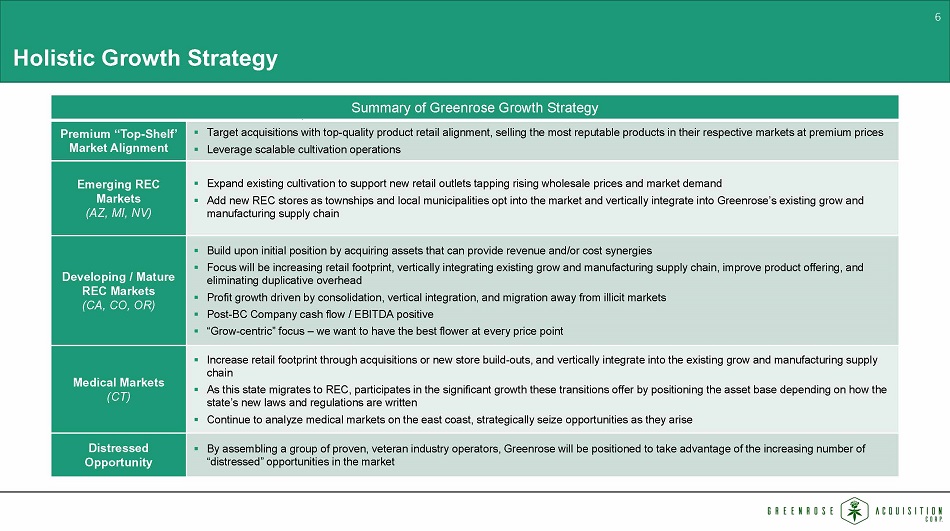
6 6 6 Summary of Greenrose Growth Strategy Premium “Top - Shelf’ Market Alignment ▪ Target acquisitions with top - quality product retail alignment, selling the most reputable products in their respective markets a t premium prices ▪ Leverage scalable cultivation operations Emerging REC Markets ( AZ, MI, NV) ▪ Expand existing cultivation to support new retail outlets tapping rising wholesale prices and market demand ▪ Add new REC stores as townships and local municipalities opt into the market and vertically integrate into Greenrose’s existi ng grow and manufacturing supply chain Developing / Mature REC Markets (CA, CO, OR) ▪ Build upon initial position by acquiring assets that can provide revenue and/or cost synergies ▪ Focus will be increasing retail footprint, vertically integrating existing grow and manufacturing supply chain, improve produ ct offering, and eliminating duplicative overhead ▪ Profit growth driven by consolidation, vertical integration, and migration away from illicit markets ▪ Post - BC Company cash flow / EBITDA positive ▪ “Grow - centric” focus – we want to have the best flower at every price point Medical Markets ( CT) ▪ Increase retail footprint through acquisitions or new store build - outs, and vertically integrate into the existing grow and manu facturing supply chain ▪ As this state migrates to REC, participates in the significant growth these transitions offer by positioning the asset base d epe nding on how the state’s new laws and regulations are written ▪ Continue to analyze medical markets on the east coast, strategically seize opportunities as they arise Distressed Opportunity ▪ By assembling a group of proven, veteran industry operators, Greenrose will be positioned to take advantage of the increasing nu mber of “distressed” opportunities in the market Holistic Growth Strategy

7 7 7 Mickey Harley CEO, Director ▪ 25 - year career on Wall street ▪ 10 - year career in agricultural investments, start - ups, and operations 35 - year career driving innovation and growth through operational management, business consulting and venture capital 35 - year career in commercial banking and acquisition integration 30 - year career in human resources and career development ▪ 30 - year career in financial technology ▪ Seasoned experience in cannabis start - ups 35 years of experience in investment management, corporate finance, and investment banking 50 - year career of business leadership and operational management Bio Experience Greenrose Management Team Paul Otto Wimer President Jack Falcon Chairman Jeffrey Stegner CFO Nicole Conboy Chief Admin Officer Brendan Sheehan EVP Corp. Strat., Director Daniel Harley EVP IR Director Allen & Co Allen & Co

8 8 8 Shango Founder, CEO Gary “Brandon” Rexroad Theraplant Co - Founder, CEO/COO & Managing Member Daniel Emmans Co - Founder Futureworks , LLC Chris Schonbachler • Expected to become Regional President of Greenrose • Expected to become Chief Operating Officer of Greenrose • Expected to become Regional President of Greenrose Greenrose Management Team Continued Involvement of Senior Management

9 9 9 The contemplated acquisition price for the four targets is $210.3 ( i ) million at closing consisting of: ▪ $170.3 million in cash ▪ $25 million in seller notes ▪ $15 million in equity Contingent on operating performance, Greenrose has agreed to pay an additional earn - out sum not to exceed $110 million (in the form of seller notes and equity) from 2022 through 2024 depending upon certain revenue and EBITDA targets Greenrose expects that it will complete the Theraplant and True Harvest acquisitions prior to the Shango and THC acquisitions due to the time it is expected to take to obtain state regulatory approvals (ii) Greenrose’s board of directors has concluded that the Theraplant and True Harvest acquisitions taken together meet all of the requirements for the De - SPACing transaction Greenrose has signed definitive agreements with all 4 target, that will make up the BC Portfolio’s vertically integrated oper ati ons, pending regulatory approval Transaction Overview Transaction Overview Company Upon Closing Future Consideration Total Theraplant ▪ Cash: $100M ▪ N/A ▪ Cash: $100M True Harvest ▪ Debt: $25M ▪ Cash: $21.8M ▪ Debt: $35M ▪ Debt: $60M ▪ Cash: $21.8M The Health Center (THC) ▪ Stock: $15M ▪ Cash: $17.5M ▪ Stock: $10M ▪ Stock: $25M ▪ Cash: $17.5M Shango ▪ Cash: $31M ▪ Stock: $65M ▪ Stock: $65M ▪ Cash: $31M Total: ▪ Stock: $15M ▪ Cash: $170.3M ▪ Debt: $25M ▪ Stock: $75M ▪ Debt: $35M The consideration for each target is as follows: De - SPACing Transaction Expected to close later (i) Discussion of aggregate consideration does not include any assumption of debt which will be known at the time of closing (ii) After completion of the De - SPAC transaction, Greenrose anticipates completing the acquisitions of Futureworks and Shango on a timetable complying with applicable state law regulations governing license transfers.

10 10 10 Transaction Overview Notes: ( i ) Represents total sources & uses required to close each of the four acquisitions even though two of the four acquisitions ar e l ikely to close before the others, as noted on slide 9, (ii) Assumes GNRS raises $75 million in a PIPE at $10 per share, $50 million in senior secured debt and $50 million convertible notes, (iii) Equity consideration to se lli ng shareholders based on $10 per share, (iv) Purchase price for each year includes initial purchase consideration plus earn - out amount associated with the performance targets for the expected year, (v) 2021 utilizes a midpoint o f the range of PF Revenue of $115mm - $135mm and PF EBITDA of $45mm - $55m (vi) Assumes no redemptions, (vii) Assuming full amount of earn - outs are paid through 2024 Greenrose is targeting to raise $50 million through a senior secured loan, $50 million through a placement of convertible notes and $75 million through a PIPE Sources and Uses ($mm) Cumulative Purchase Consideration ($mm) Pro - Forma Equity Ownership (mm) Sources Uses At Close (i) At Close (i) Cash in Trust 172.5$ Cash to Sellers 170.3$ Senior Secured Debt Proceeds (ii) 50.0 Seller Notes 25.0 Convertible Notes Proceeds (ii) 50.0 Equity to Sellers 15.0 PIPE (ii) 75.0 Cash to Balance Sheet 164.2 Seller Notes 25.0 Deal Expenses 13.0 Equity Issued (iii) 15.0 Total Sources At Close 387.5$ Total Uses At Close 387.5$ 2022 - 2024 2022 - 2024 Equity Issued (2022-2024) 75.0$ Earn-Out 110.0$ Debt Issued (2024) 35.0 Total Sources (2022 - 2024) 110.0$ Total Uses (2022 - 2024) 110.0$ Total Sources 497.5$ Total Uses 497.5$ Year 2021 2022 2023 2024 Purchase Consideration: Stock 15.0$ 15.0$ 15.0$ 15.0$ Cash 170.3$ 192.1 218.5 218.5 Debt 25.0$ 33.9 42.8 42.8 Purchase Price (iv) 210.3$ 241.0$ 276.3$ 276.3$ PF Revenue (v) 125.0$ 229.7$ n/a n/a Purchase Price / PF Revenue 1.7x 1.0x n/a n/a PF EBITDA (v) 50.0$ 90.3$ n/a n/a Purchase Price / PF EBITDA 4.2x 2.7x n/a n/a Year PF Shares Ownership % PF Shares Ownership % Current Holders of GNRS (vi) 17.3 56.4% 17.3 41.5% Sponsor Shares 4.3 14.1% 4.3 10.4% Shares issued in PIPE 7.5 24.5% 7.5 18.0% Shares issued to Shango 0.0 0.0% 8.5 20.5% Shares issued to Theraplant 0.0 0.0% 0.0 0.0% Shares issued to The Health Center 1.5 4.9% 4.0 9.6% Shares issued to True Harvest 0.0 0.0% 0.0 0.0% Total Shares Outstanding 30.6 100.0% 41.6 100.0% At Close Full Earn-Out (vii)

11 11 11 Proven success in operating “grow centric” vertically integrated businesses Vertical operations in Oregon, Nevada, Colorado, and Michigan Experience in limited license medical markets and recreational use markets Best practices / standard operating procedures will be applied across markets and utilized as medical only states adopt recre ati onal use and/or hybrid regulations Cash flow positive Will have liquidity needed to execute strategic objectives with additional financing to effect future acquisitions Comprehensive management team in place Greenrose brings “Corporate - level” operational, financial, legal and public company experience along with key managers of cultiv ation, product development and retail from the target companies Optimal time to pursue growth strategy in cannabis industry Market is enjoying strong growth but attractively priced assets remain due to capital constraints and companies with non - core as sets Key Investment Highlights

12 12 12 II. Combined Company Overview

13 13 13 Company Status Key Geography & Assets Summary The Health Center (THC) ▪ Entered into Futureworks Merger Agreement ▪ Colorado ▪ 3 dispensaries ▪ 3 cultivation and 1 processing facility ▪ Vertically integrated in Colorado with three dispensaries and three cultivation facilities totaling 58,500 ft 2 ▪ Focus on the Denver metro market place ▪ High - end products at affordable prices Shango ▪ Entered into Shango Merger Agreement ▪ Oregon, California, Michigan, Nevada, Arizona ▪ 6 dispensaries and 1 additional Oregon license ▪ 4 cultivation and 3 processing facilities ▪ Vertically integrated in Oregon with one dispensary and two cultivation facilities with total cultivation capacity of 30,000 ft 2 ▪ 1 dispensary and distribution company in California ▪ Vertically integrated in Nevada with one dispensary, one 40,000 ft 2 cultivation facility, with room to expand to 75,000 ft 2 , and one processing facility ▪ Vertically integrated in Michigan with three dispensaries, one 35,000 ft 2 cultivation facility and two processing facilities ▪ High - end flower and concentrates that command premium prices Theraplant ▪ Entered into Theraplant Merger Agreement ▪ Connecticut ▪ 1 cultivation and 1 processing facility ▪ 1 of 4 cultivators in Connecticut ▪ Cultivation facility with 65,000 ft² of capacity currently under expansion to double capacity ▪ High barriers to entry ▪ Room to expand facility ▪ Looking to acquire a dispensary to begin vertically integrating True Harvest ▪ Entered into Asset Purchase Agreement ▪ Arizona ▪ 1 cultivation and 1 processing facility ▪ Large 74,000 ft² wholesale cultivation facility currently under expansion to double capacity, run by Shango growers ▪ Expands Shango footprint into Arizona ▪ Anticipated expansion of demand in new REC market ▪ Room to expand facility Overview of BC Companies / Assets

14 14 14 Robust Pipeline of Opportunities Signed definitive agreements with 4 target entities Est. Total 2021P EBITDA range of $45mm - $55mm, 2022P EBITDA of $90mm 9 Dispensaries 7 States with operations 300k+ Square Feet of Cultivation 9 Cultivation Facilities 6 Processing Facilities 120K+ lbs. Annual Yield Cannabis Flower Immediate BC Pipeline Post - BC Pipeline Addressable Acquisition Market Post - BC discussions to identify suitable additional companies and select premier retail assets Experienced team with industry knowledge and M&A experience Discussions with companies in emerging REC and MED markets Pipeline expected to expand as recreational legalization has expanded as a result of the 2020 elections Assessing opportunities to enter new states as well as discussions with targets to expand in current states

15 15 15 Select Portfolio Brands and Products

16 16 16 Select Portfolio Flower Product

17 17 17 Retail and Facilities

18 18 18 Geographic Footprint 9 Dispensaries across 7 states | 300k+ square feet in Cultivation | Extraction / Processing facilities in 5 states | Over 120k+ lbs. flower per year Sources: Marijuana and the Law as of June 16, 2021 Target Company Operations Recreational and Medical Use Comprehensive Medical Cannabis Program CBD/Low THC Program No Recreational or Medical

19 19 19 Mickey Harley CEO Paul Otto Wimer President Daniel Harley EVP IR Director Brendan Sheehan EVP Corp. Strat., Director Jeffrey Stegner CFO Nicole Conboy CAO Projected Post - BC Organization Create Operating Council consisting of the Operating Heads for each regional operating division Sub - committees for each of the major operating functions Operating Council to coordinate and execute integration activities Implementation of standard operating procedures across the organization Implement marketing / retail best practice Planned Management Structure Cultivation Marijuana Infused Products Retail Technology COO West Coast Rocky Mountain Northeast Regional Operating Divisions

20 20 20 III. Financial Overview and Valuation

21 21 21 Greenrose 2020A (2) 2021P (3) 2022P (3) Revenue $ 82,928 $ 115,000 – $ 135,000 $ 229,701 EBITDA (4) $ 25,447 $ 45,000 - $ 55,000 $ 89,594 Adj. EBITDA (4),(5) $ 31,988 $ 45,000 - $ 55,000 $ 89,594 Pro Forma Combined Operations (1) Pro Forma Combined Financial Summary ($000s) (1) Represents combined financials for all four targets even though two of the four acquisitions are likely to close before the o the rs, as noted on slide 9 (2) Based upon audited amounts (3) Based upon target management’s projected amounts, with 2021 including actual results for the period ended March 31, 2021 (4) EBITDA and Adjusted EBITDA for the combined entity includes Corporate Overhead expenses of $1.75mm in 2021E and $10mm in 2022 E. These do not tie to the summation of the individual target EBITDAs; (5) Adjusted EBITDA numbers provided by management. Adjusted for transaction related expenses and non - recurring expenses

22 22 22 2020A (1) 2021P (2) 2022P (2) Revenue $28,375 $30,000 - $35,000 $53,203 EBITDA (3) $16,669 $17,000 - $21,000 $36,059 Adj. EBITDA (3),(4) $18,806 $17,000 - $21,000 $36,059 2020A (1) 2021P (2) 2022P (2) Revenue $21,474 $20,000 - $25,000 $35,777 EBITDA (3) $5,266 $4,000 - $5,000 $8,910 Adj. EBITDA (3),(4) $5,531 $4,000 - $5,000 $8,910 2020A (1) 2021P (2) 2022P (2) Revenue $8,036 $25,000 - $30,000 $48,048 EBITDA (3) $1,096 $15,000 - $17,000 $32,829 Adj. EBITDA (3),(4) $1,355 $15,000 - $17,000 $32,829 2020A (1) 2021P (2) 2022P (2) Revenue $25,042 $40,000 - $45,000 $92,674 EBITDA (3) $2,417 $9,000 - $12,000 $21,795 Adj. EBITDA (3),(4) $6,296 $9,000 - $12,000 $21,795 THC Shango Theraplant True Harvest Financial Summary – BC Transactions ($000s) (1) Based upon audited amounts (2) Based upon target management’s projected amounts, with 2021 including actual results for the period ended March 31, 2021 (3) EBITDA and Adjusted EBITDA for the combined entity includes $1.75mm of expenses in 2021E, and $10mm in 2022E. These do not tie to the summation of the individual target EBITDAs (4) Adjusted EBITDA numbers provided by management
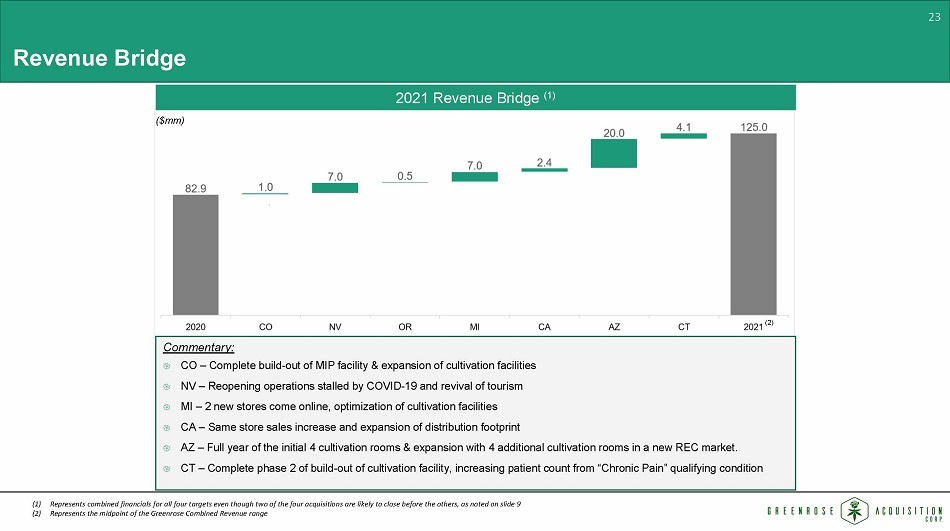
23 23 23 Revenue Bridge ($mm) Commentary: CO – Complete build - out of MIP facility & expansion of cultivation facilities NV – Reopening operations stalled by COVID - 19 and revival of tourism MI – 2 new stores come online, optimization of cultivation facilities CA – Same store sales increase and expansion of distribution footprint AZ – Full year of the initial 4 cultivation rooms & expansion with 4 additional cultivation rooms in a new REC market. CT – Complete phase 2 of build - out of cultivation facility, increasing patient count from “Chronic Pain” qualifying condition 2021 Revenue Bridge (1) (2) (1) Represents combined financials for all four targets even though two of the four acquisitions are likely to close before the o the rs, as noted on slide 9 (2) Represents the midpoint of the Greenrose Combined Revenue range

24 24 24 Comparable Company Summary ($mm) Source: Capital IQ as of June 14, 2021. Comparable Company Analysis Price Market Enterprise Revenue EBITDA Enterprise Value / Company Name 6/14/2021 Cap Value 2020 2021 2022 2020 2021 2022 2020 Revenue 2021 Revenue 2022 Revenue 2020 EBITDA 2021 EBITDA 2022 EBITDA Curaleaf Holdings, Inc. 14.53$ 10,216.8$ 10,539.8$ 634.6$ 1,299.0$ 1,876.8$ 141.6$ 372.3$ 638.4$ 16.6x 8.1x 5.6x 74.4x 28.3x 16.5x Green Thumb Industries Inc. 30.48 6,766.9 6,749.1 547.8 874.5 1,157.9 173.3 321.1 442.8 12.3x 7.7x 5.8x 38.9x 21.0x 15.2x Trulieve Cannabis Corp. 36.83 4,644.5 4,781.5 515.5 872.8 1,124.8 252.7 392.2 500.5 9.3x 5.5x 4.3x 18.9x 12.2x 9.6x Cresco Labs Inc. 11.45 3,806.7 4,035.6 475.3 842.0 1,230.1 110.0 213.4 397.7 8.5x 4.8x 3.3x 36.7x 18.9x 10.1x Harvest Health & Recreation Inc. 4.05 1,696.4 1,975.7 228.0 403.8 524.8 18.9 103.2 167.6 8.7x 4.9x 3.8x 104.5x 19.1x 11.8x TerrAscend Corp. 10.46 1,924.4 1,908.9 155.1 302.3 458.7 45.1 130.0 212.1 12.3x 6.3x 4.2x 42.3x 14.7x 9.0x Columbia Care Inc. 5.56 1,749.3 1,857.7 182.8 512.0 782.7 (5.9) 100.9 222.5 10.2x 3.6x 2.4x n/a 18.4x 8.4x Ayr Wellness Inc. 28.01 1,648.6 1,717.9 155.6 388.8 716.6 56.6 129.1 293.9 11.0x 4.4x 2.4x 30.3x 13.3x 5.8x Planet 13 Holdings Inc. 6.99 1,372.1 1,250.0 73.1 139.2 206.3 14.0 39.3 70.5 17.1x 9.0x 6.1x 89.6x 31.8x 17.7x Jushi Holdings Inc. 5.72 886.2 822.0 80.8 226.7 408.0 (2.2) 37.4 126.3 10.2x 3.6x 2.0x n/a 22.0x 6.5x Average 10.6x 5.6x 3.1x 44.5x 19.0x 10.7x Median 10.6x 5.2x 4.0x 38.9x 19.0x 9.9x
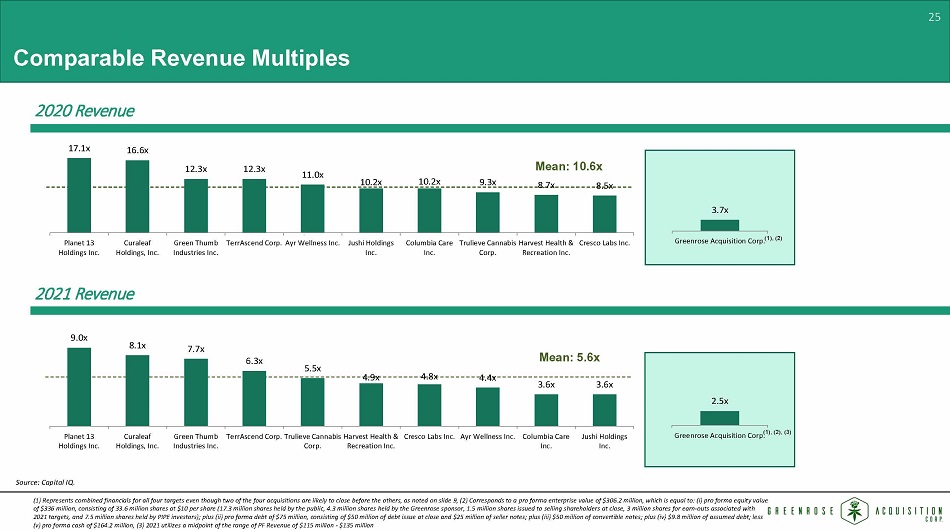
25 25 25 Mean: 10.6x Comparable Revenue Multiples 2020 Revenue 3.7x Greenrose Acquisition Corp. Mean: 5.6x 2021 Revenue 2.5x Greenrose Acquisition Corp. (1), (2) (1), (2), (3) Source: Capital IQ. (1) Represents combined financials for all four targets even though two of the four acquisitions are likely to close before t he others, as noted on slide 9, (2) Corresponds to a pro forma enterprise value of $306.2 million, which is equal to: ( i ) pro forma equity value of $336 million, consisting of 33.6 million shares at $10 per share (17.3 million shares held by the public, 4.3 million shar es held by the Greenrose sponsor, 1.5 million shares issued to selling shareholders at close, 3 million shares for earn - outs associated with 2021 targets, and 7.5 million shares held by PIPE investors); plus (ii) pro forma debt of $75 million, consisting of $50 mill ion of debt issue at close and $25 million of seller notes; plus (iii) $50 million of convertible notes; plus (iv) $9.8 million o f assumed debt; less (v) pro forma cash of $164.2 million, (3) 2021 utilizes a midpoint of the range of PF Revenue of $115 million - $135 million 17.1x 16.6x 12.3x 12.3x 11.0x 10.2x 10.2x 9.3x 8.7x 8.5x Planet 13 Holdings Inc. Curaleaf Holdings, Inc. Green Thumb Industries Inc. TerrAscend Corp. Ayr Wellness Inc. Jushi Holdings Inc. Columbia Care Inc. Trulieve Cannabis Corp. Harvest Health & Recreation Inc. Cresco Labs Inc. 9.0x 8.1x 7.7x 6.3x 5.5x 4.9x 4.8x 4.4x 3.6x 3.6x Planet 13 Holdings Inc. Curaleaf Holdings, Inc. Green Thumb Industries Inc. TerrAscend Corp. Trulieve Cannabis Corp. Harvest Health & Recreation Inc. Cresco Labs Inc. Ayr Wellness Inc. Columbia Care Inc. Jushi Holdings Inc.

26 26 26 Mean: 44.5x Comparable EBITDA Multiples 2020 EBITDA 9.6x Greenrose Acquisition Corp. 2021 EBITDA Mean: 19.0x (1), (2) (1), (2), (3) Source: Capital IQ. 6.9x Greenrose Acquisition Corp. 104.5x 89.6x 74.4x 42.3x 38.9x 36.7x 30.3x 18.9x Harvest Health & Recreation Inc. Planet 13 Holdings Inc. Curaleaf Holdings, Inc. TerrAscend Corp. Green Thumb Industries Inc. Cresco Labs Inc. Ayr Wellness Inc. Trulieve Cannabis Corp. 31.8x 28.3x 22.0x 21.0x 19.1x 18.9x 18.4x 14.7x 13.3x 12.2x Planet 13 Holdings Inc. Curaleaf Holdings, Inc. Jushi Holdings Inc. Green Thumb Industries Inc. Harvest Health & Recreation Inc. Cresco Labs Inc. Columbia Care Inc. TerrAscend Corp. Ayr Wellness Inc. Trulieve Cannabis Corp. (1) Represents combined financials for all four targets even though two of the four acquisitions are likely to close before t he others, as noted on slide 9, (2) Corresponds to a pro forma enterprise value of $306.2 million, which is equal to: ( i ) pro forma equity value of $336 million, consisting of 33.6 million shares at $10 per share (17.3 million shares held by the public, 4.3 million shar es held by the Greenrose sponsor, 1.5 million shares issued to selling shareholders at close, 3 million shares for earn - outs associated with 2021 targets, and 7.5 million shares held by PIPE investors); plus (ii) pro forma debt of $75 million, consisting of $50 mill ion of debt issue at close and $25 million of seller notes; plus (iii) $50 million of convertible notes; plus (iv) $9.8 million o f assumed debt; less (v) pro forma cash of $164.2 million, (3) ) 2021 utilizes a midpoint of the range of PF EBITDA of $45 million - $55 million

27 27 27 IV. Appendix

28 28 28 A. Market Overview

29 29 29 Medical marijuana 36 is legal in states 17 of states 36 have also legalized recreational marijuana (“REC”) use including; Arizona, California, Colorado, Michigan, New York, New Jersey, Nevada and Oregon Legalized medical use (“MED”) states include: Connecticut, Florida, New Mexico, Pennsylvania, Mississippi, Delaware, Hawaii, Louisiana, Maryland, Minnesota, Missouri, New Hampshire, North Dakota, Ohio, Oklahoma, and Rhode Island 11 other states allow for CBD, which have limited THC content Legal Status of Marijuana Geographic Opportunity Sources: Oberk , Disa , Marijuanaseo , Marijuana and the Law as of June 16, 2021

30 30 30 Recreational markets are projected to grow 15.3% from 2021 to 2022 Medical markets are projected to grow 14.2% from 2021 to 2022 Interest in illicit markets are projected to continue to decline as medical markets and recreational markets grow General Market Growth Market Statistics 3.1 3.7 4.2 4.6 4.4 6.0 7.7 9.1 10.4 11.5 12.3 13.1 0.4 1.1 2.2 3.3 5.9 7.6 9.3 11.1 12.8 14.0 14.8 16.6 3.5 4.8 6.4 7.9 10.3 13.6 17.0 20.2 23.2 25.5 27.1 29.7 0.0 10.0 20.0 30.0 40.0 50.0 60.0 70.0 2014 2015 2016 2017 2018 2019 2020 2021 2022 2023 2024 2025 MED REC Illicit Market Source: New Frontier Data, Pre - 2020 Election Projected Cannabis Market Growth in the U.S. ($bn)

31 31 31 Arizona : $770 - 910 million California : $3.8 billion Colorado : $1.82 billion Connecticut : $130 - 160 million Michigan : $1 billion Nevada : $600 - 675 million Oregon : $1.11 billion Sources: Cannabis Business Plan, Marijuana Business Daily, Marijuana Business Factbook, Portland Business Journal, Colorado D epa rtment of Revenue, Arcview Market Research and BDS Analytics, Headset Data, Oregon Liquor Control Commission Market Leading States Applicable Market Size (Estimated 2020) CA 31.7% CO 15.0% WA 9.2% FL 8.3% MI 8.3% NV 5.0% OR 9.3% AZ 5.9% MA 4.0% PA 2.5% Other 0.9% Market Share by State, Medical and Recreational (2019) Greenrose will have operations in states that capture about 2/3 of the addressable national market

32 32 32 B. Target Company Detail
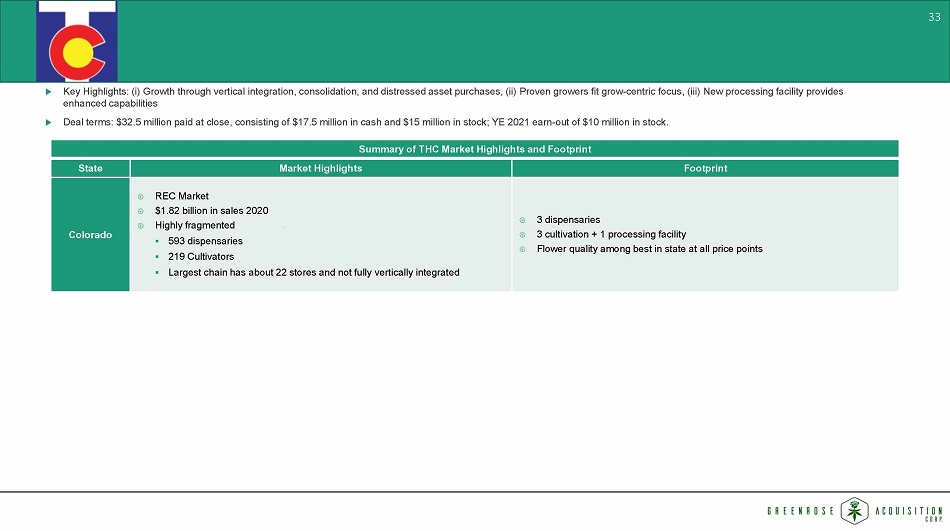
33 33 33 Summary of THC Market Highlights and Footprint State Market Highlights Footprint Colorado REC Market $1.82 billion in sales 2020 Highly fragmented ▪ 593 dispensaries ▪ 219 Cultivators ▪ Largest chain has about 22 stores and not fully vertically integrated 3 dispensaries 3 cultivation + 1 processing facility Flower quality among best in state at all price points Key Highlights: (i) Growth through vertical integration, consolidation, and distressed asset purchases, (ii) Proven growers f it grow - centric focus, (iii) New processing facility provides enhanced capabilities Deal terms: $32.5 million paid at close, consisting of $17.5 million in cash and $15 million in stock; YE 2021 earn - out of $10 m illion in stock.

34 34 34 Summary of Shango Market Highlights and Footprint State Market Highlights Footprint Oregon REC market with estimated $1.11 billion 2020 sales Highly fragmented market Over 1,800 cultivator/processor licenses and over 900 dispensaries Largest retail chain has only 24 dispensaries 1 operational dispensary 2 cultivation facilities Second retail license Michigan REC Launched 2019 with estimated $1 billion 2020 sales 47 REC Dispensaries, ~50 MED dispensaries About 300 active MED&REC grower licenses Cultivators/Dispensaries can’t keep up with high demand for product Vertically integrated license 1 cultivation facility, 2 processing facilities, and 3 dispensaries Nevada REC Market with estimated $600 - $675 million in sales 2020 About 75 dispensaries 160 production licenses Vertically integrated dispensary with cultivation and processing facility Off - strip location serves Vegas locals ▪ More frequent/consistent buyers than tourists California REC Market with estimated total REC Cannabis sales of $3.8 billion Highly fragmented market No recognizable retail chains, thousands of brands Significant black market competes with legal market 1 retail location + distribution business Distribution business one of the safest and most profitable positions in CA Market ▪ Distribution businesses package (white label) and distribute for the thousands of growers and brands ▪ Brands / growers will pay top - dollar for retail space Arizona MED Market poised to go REC this year with estimated $770 - 910 million 2020 sales 123 dispensaries and 130 production licenses Operates a grow (which we are also buying) in return for a management fee Key Highlights: (i) Proven cultivators/processors – distressed asset opportunities, (ii) Grow - centric focus in each state (excep t California), (iii) Growth through consolidation in Oregon, Nevada, and Arizona, (iv) Growth in California through vertical integration, (v) “early - bird” position in Michigan Deal terms: At close: $31 million paid at close, consisting of $31 million cash; YE 2021 earn - out of $20 million in stock; YE 2 022 earn - out of $25 million in stock; YE 2023 earn - out of $20 million in stock

35 35 35 Key Highlights: (i) Proven cultivators/processors, (ii) Growth coming from “chronic pain” being added as an acceptable condit ion for MED marijuana patients, (iii) Opportunity to vertically integrate through dispensary acquisitions, (iv) Growth from the introduction of REC in coming years Deal terms: $100 million cash at close, no earn - out Summary of Theraplant Market Highlights and Footprint State Market Highlights Footprint Connecticut Limited license medical market ▪ 4 cultivators (which Greenrose is also acquiring) ▪ 19 dispensaries ▪ Estimated $130 - $160 million in sales 2020 ▪ Likely to remain medical for the next couple of years – will likely add cultivation and dispensary licenses to current MED program before going REC ▪ CT Governor is making cannabis legalization a priority Biggest cultivation + processing facility in state 1 of 4 cultivators Targeting dispensary acquisition to begin vertically integrating

36 36 36 Key Highlights: Adds large - scale cultivation and expands Greenrose footprint into Arizona Deal terms: $46.8 million paid at close, consisting of $21.8 million in cash and $25 million in notes (3 year, interest only, 6% ); YE 2024 earn - out of $35 million in notes (3 year, interest only, 6%) Summary of True Harvest Market Highlights and Footprint State Market Highlights Footprint Arizona Estimated $770 - 910 million in sales by end of year (2020) Newly REC market Easy access to med card with “chronic pain” driving an increase in patient numbers Increased REC demand and constrained supply due to introduction of first time standardized testing ▪ Large - scale cultivation ▪ 15 - 20k pounds flower per year ▪ Expands Shango footprint to Arizona