Attached files
| file | filename |
|---|---|
| 8-K - 8-K - Embassy Bancorp, Inc. | emyb-20210617x8k.htm |
Exhibit 99.1
Embassy Bank for

2021 Annual
Meeting of Shareholders
2021 Annual
Meeting of Shareholders
June 17, 2021 embassy bank for the lehigh valley embassy bank.com member FDIC Equal Housing Lender
1
Exhibit 99.1

Welcome & Introductions
- Lynne Neel
Please: No Video / Audio Recording No Photography
2
Exhibit 99.1
Caution on Forward Looking Statements
This presentation may contain forward-looking statements, including statements of goals, intentions, and expectations as to future trends, plans, events or results of Embassy Bancorp, Inc.’s (“Company”) operations and policies and regarding general economic conditions. These forward-looking statements are intended to be covered by the safe harbor for forward-looking statements provided by the Private Securities Litigation Reform Act of 1995. These statements are based upon current and anticipated economic conditions, nationally and in the Company’s market, interest rates and interest rate policy, competitive factors and other conditions that, by their nature, are not susceptible to accurate forecast, and are subject to significant uncertainty.
Such forward-looking statements can be identified by the use of forward-looking terminology such as “believes”, “expects”, “may”, “intends”, “will”, “should”, “anticipates”, or the negative of any of the foregoing or other variations thereon or comparable terminology, or by discussion of strategy.
No assurance can be given that the future results covered by forward-looking statements will be achieved. Such statements are subject to risks, uncertainties, and other factors that could cause actual results to differ materially from future results expressed or implied by such forward-looking statements. Important factors that could impact the Company’s operating results include, but are not limited to, (i) the effects of changing economic conditions in the Company’s market areas and nationally, (ii) credit risks of commercial, real estate, consumer and other lending activities, (iii) significant changes in interest rates, (iv) changes in federal and state banking laws and regulations which could impact the Company’s operations, (v) changes in accounting policies or procedures as may be required by FASB or regulatory agencies, (vi) risks and uncertainties related to the COVID-19 pandemic and resulting governmental and societal responses, and (vii) other external developments which could materially affect the Company’s business and operations, as well as the risks described in the Company’s Form 10-K for the year ended December 31, 2020, the March 31, 2021 Quarterly Report on Form 10-Q, and subsequent filings with the SEC.
3
Exhibit 99.1
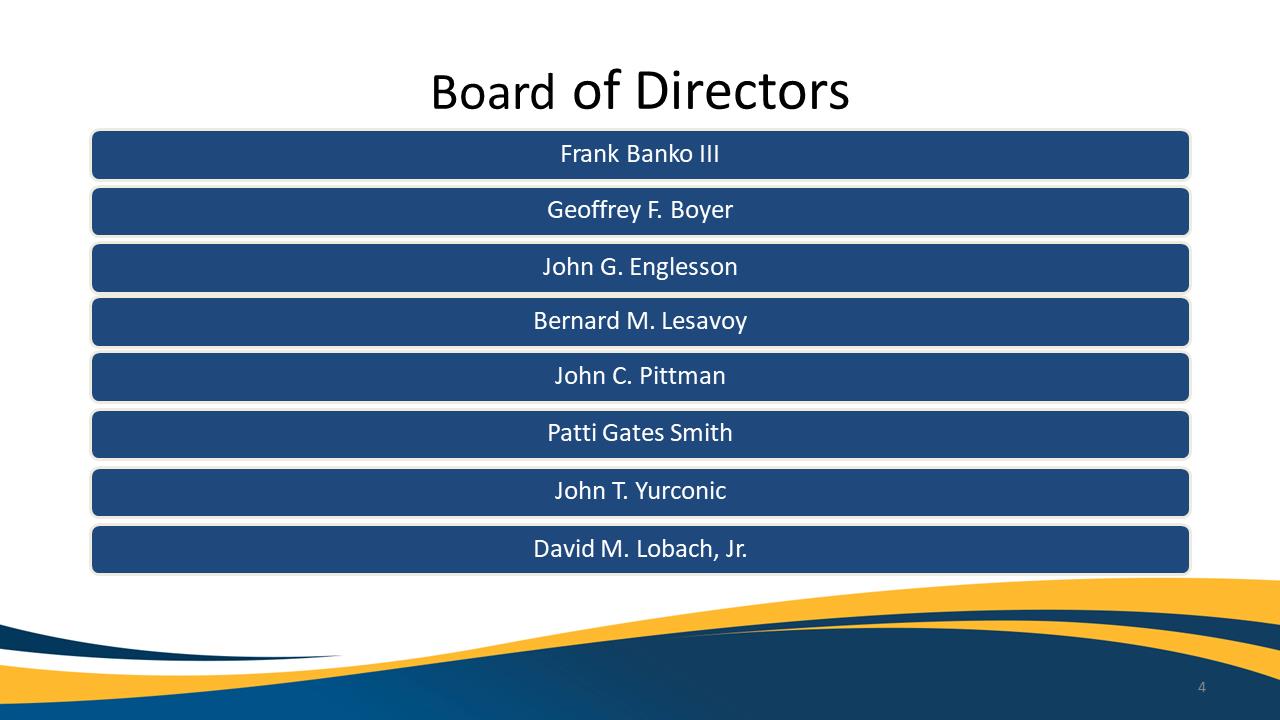
Board of Directors
Frank Banko III Geoffrey F. Boyer John G. Englesson Bernard M. Lesavoy John C. Pittman Patti Gates Smith John T. Yurconic David M. Lobach, Jr.
4
Exhibit 99.1
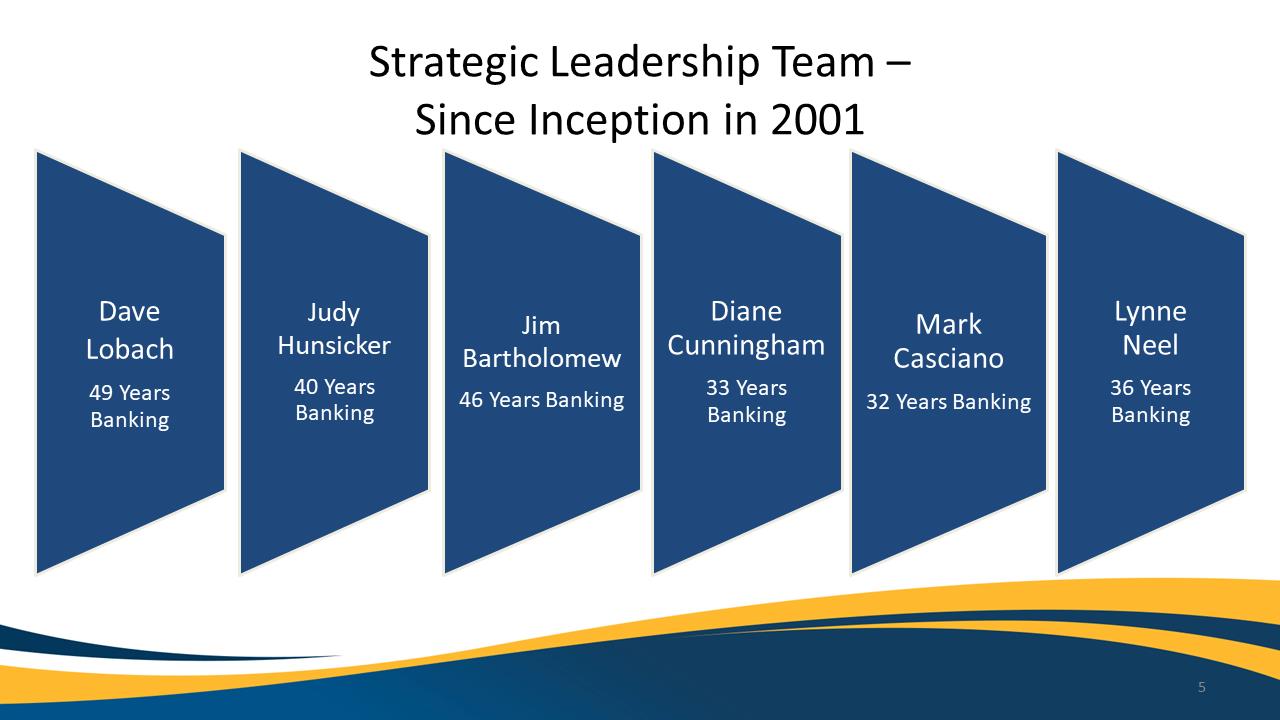
Strategic Leadership Team –
Since Inception in 2001
Dave Lobach 49 Years Banking Judy Hunsicker 40 Years Banking Jim Bartholomew 46 Years Banking Diane Cunningham 33 Years Banking Mark Casciano 32 Years Banking Lynne Neel 36 Years Banking 5
Exhibit 99.1

Business Meeting
- Dave Lobach & Judy Hunsicker 6
Exhibit 99.1

Business Meeting
Proposals
Proposal No. 1 - Election of Directors
John G. Englesson
Patti Gates Smith
Proposal No. 2 – Ratification of Independent Registered Public Accounting Firm
Baker Tilly US, LLP 7
7
Exhibit 99.1
Management Presentation Agenda
2020 Year in Review
1Q2021 Update
Economic Update
Shareholder Value
8
Exhibit 99.1

2020 Year in Review
Responsible Growth
- Diane Cunningham 9
Exhibit 99.1
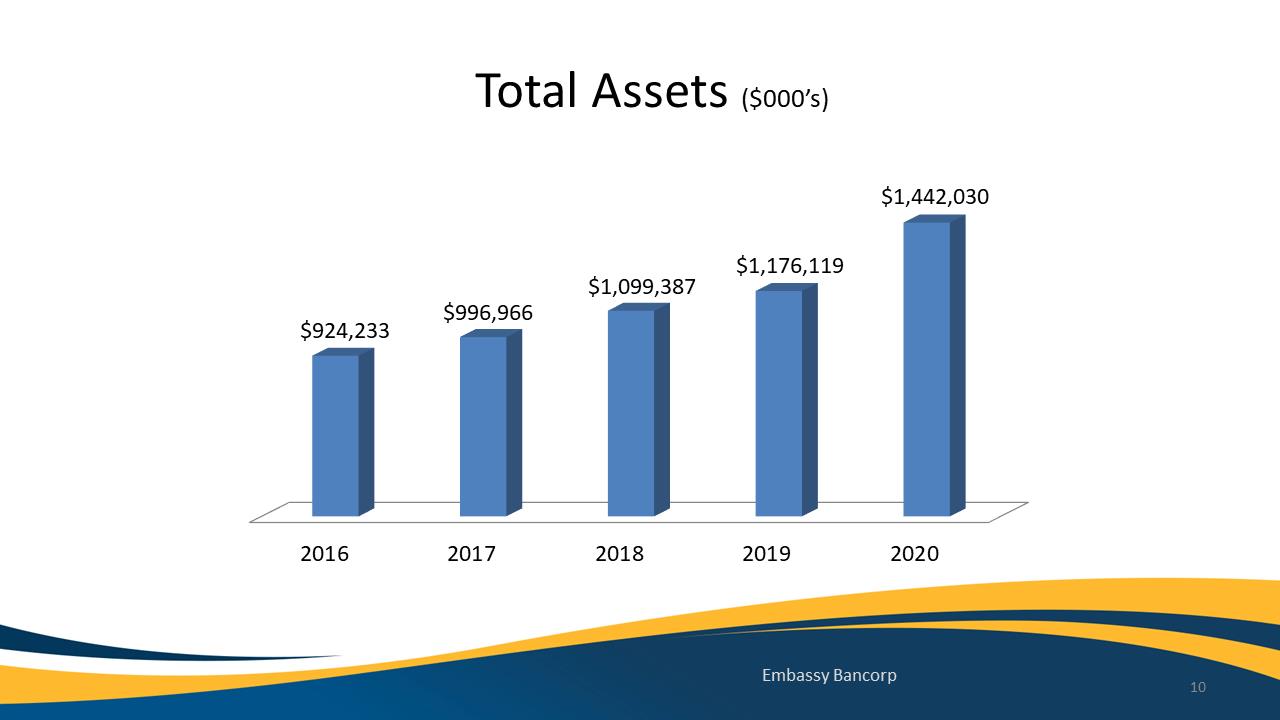
Total Assets ($000’s) $1,442,030 $924,233 $996,966 $1,099,387 $1,176,119 2016 2017 2018 2019 2020
Embassy Bancorp
10
Exhibit 99.1
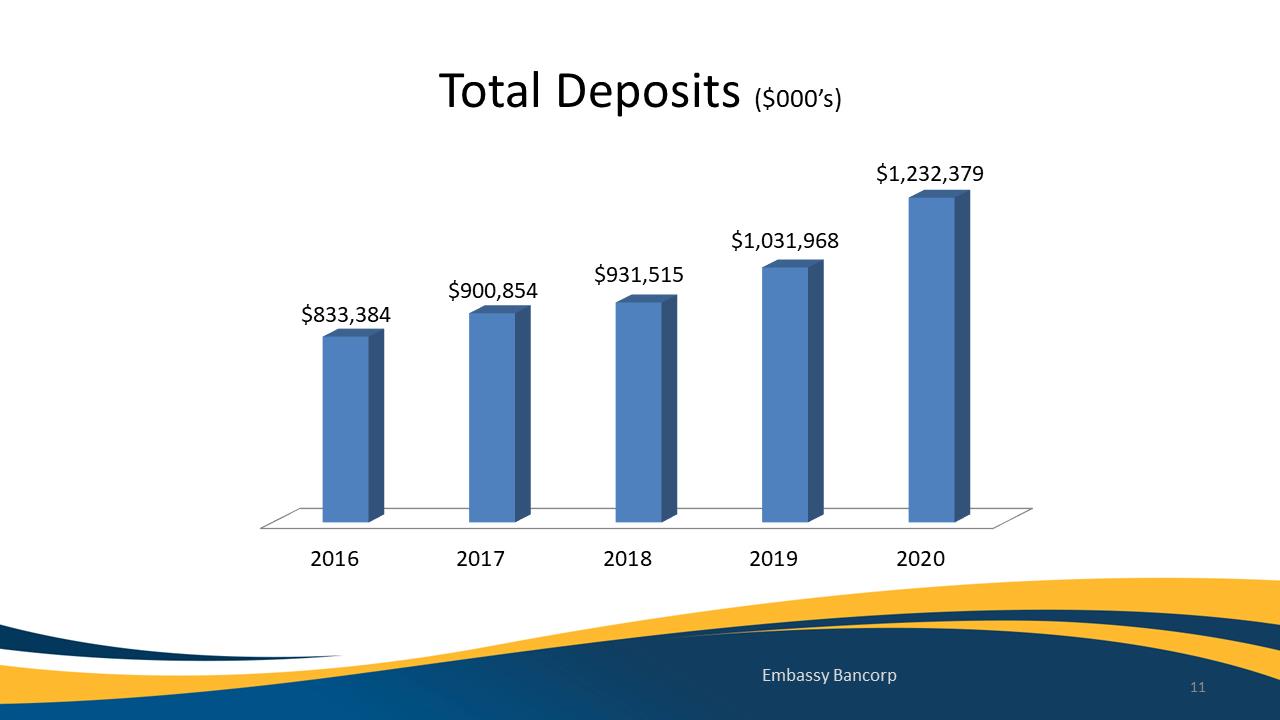
Total Deposits($000’s)
20162017201820192020$833,384$900,854$931,515$1,031,968$1,232,379EmbassyBancorp11TotalDeposits($000’s)
20162017201820192020$833,384$900,854$931,515$1,031,968$1,232,379EmbassyBancorp11
Exhibit 99.1
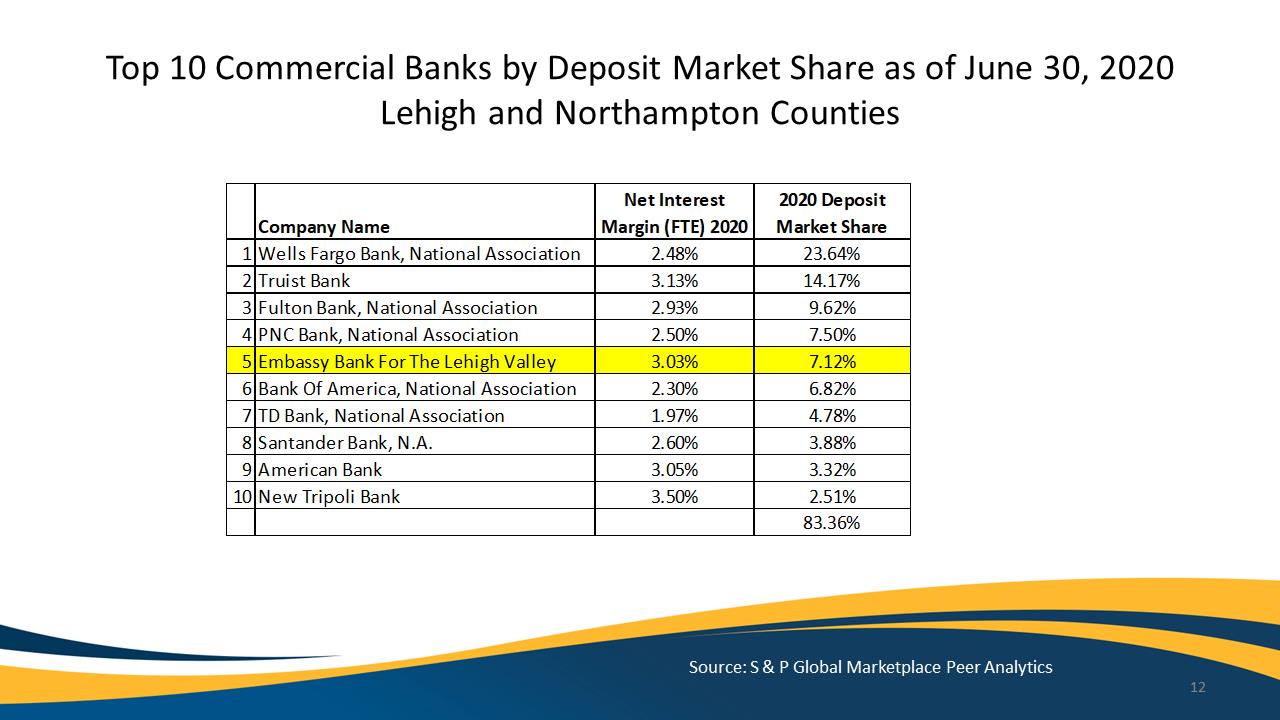
Top 10 Commercial Banks by Deposit Market Share as of June 30, 2020 Lehigh and Northampton CountiesCompanyNameNetInterestMargin(FTE)20202020DepositMarketShare1WellsFargoBank,NationalAssociation2.48%23.64% 2TruistBank3.13%14.17% 3FultonBank,NationalAssociation2.93%9.62% 4PNCBank,NationalAssociation2.50%7.50% 5EmbassyBankForTheLehighValley3.03%7.12% 6BankOfAmerica,NationalAssociation2.30%6.82% 7TDBank,NationalAssociation1.97%4.78% 8SantanderBank,N.A.2.60%3.88% 9AmericanBank3.05%3.32% 10NewTripoliBank3.50%2.51% 83.36%
Source: S & P Global Marketplace Peer Analytics 12
Exhibit 99.1
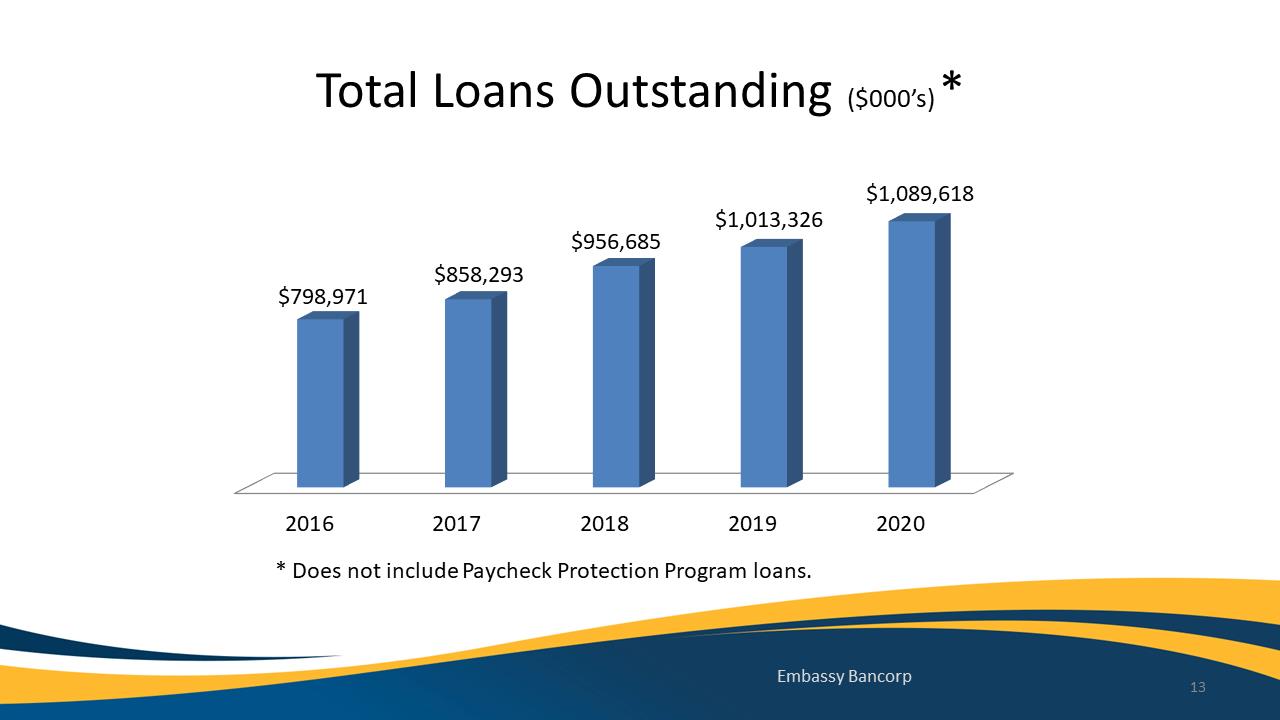
Total Loans Outstanding($000’s)*
20162017201820192020$798,971$858,293$956,685$1,013,326$1,089,618EmbassyBancorp13*DoesnotincludePaycheckProtectionProgramloans.
Total Loans Outstanding($000’s)*
20162017201820192020$798,971$858,293$956,685$1,013,326$1,089,618EmbassyBancorp13*DoesnotincludePaycheckProtectionProgramloans.
Exhibit 99.1
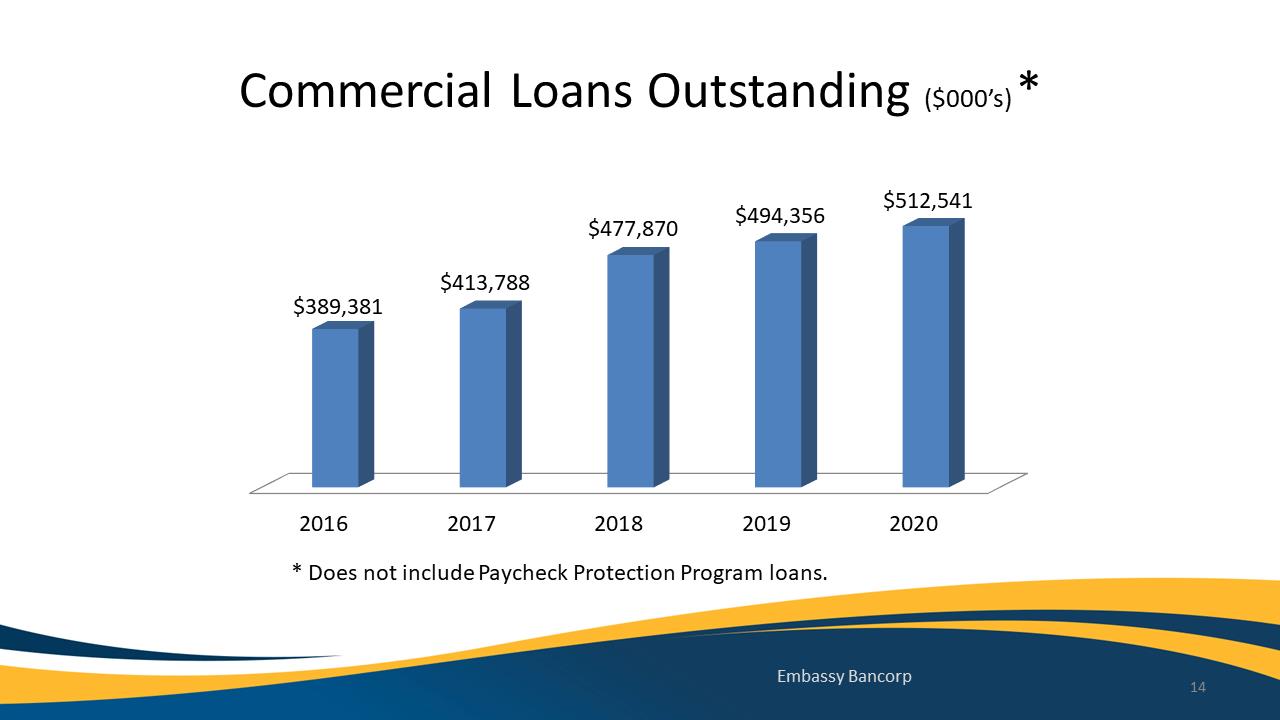
Commercial Loans Outstanding($000’s)*
20162017201820192020$389,381$413,788$477,870$494,356$512,541EmbassyBancorp14*DoesnotincludePaycheckProtectionProgramloans.
Commercial Loans Outstanding($000’s)*
20162017201820192020$389,381$413,788$477,870$494,356$512,541EmbassyBancorp14*DoesnotincludePaycheckProtectionProgramloans.
Exhibit 99.1
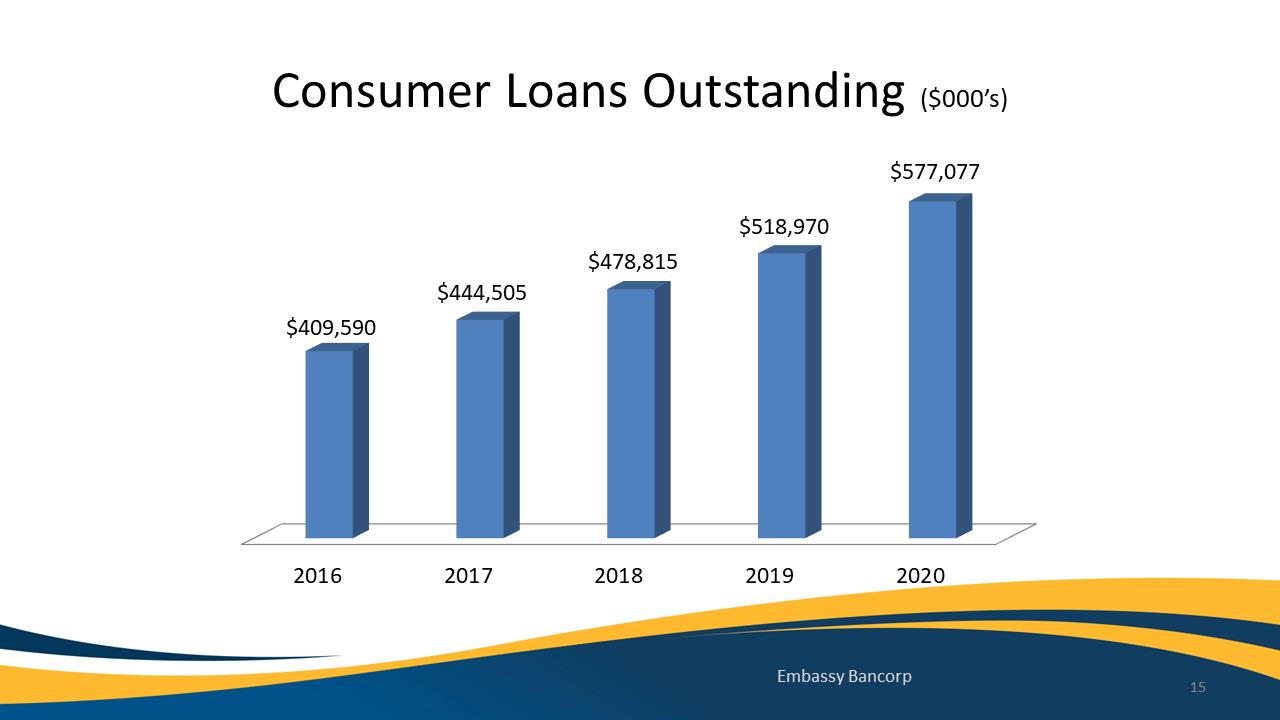
Consumer Loans Outstanding($000’s)
20162017201820192020$409,590$444,505$478,815$518,970$577,077EmbassyBancorp15ConsumerLoansOutstanding($000’s)
20162017201820192020$409,590$444,505$478,815$518,970$577,077EmbassyBancorp15
Exhibit 99.1
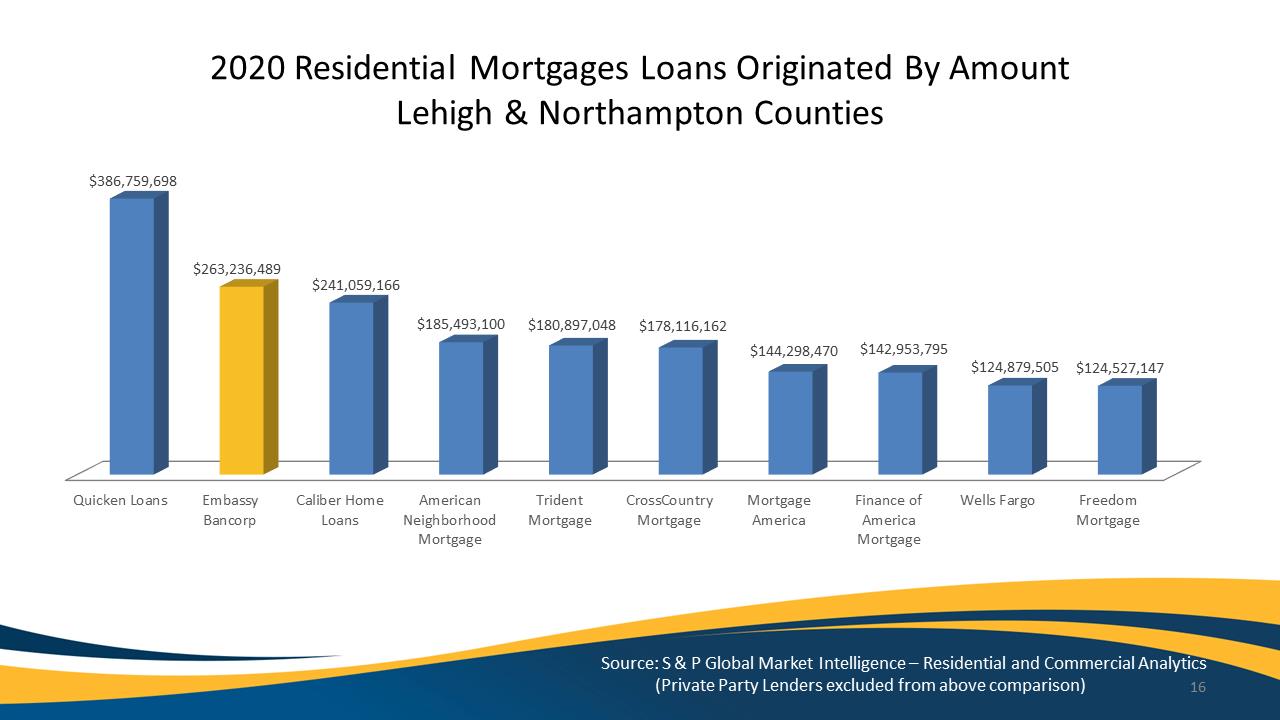
2020 Residential Mortgages Loans Originated By Amount Lehigh & Northampton Counties $386,759,698 $263,236,489 $241,059,166 $185,493,100 $180,897,048 $178,116,162 $144,298,470 $142,953,795 $124,879,505 $124,527,147 Quicken Loans Embassy Caliber Home American Trident Cross Country Mortgage Finance of Wells Fargo Freedom Bancorp Loans Neighborhood Mortgage Mortgage America America Mortgage Mortgage Mortgage Source: S & P Global Market Intelligence Residential and Commercial Analytics (Private Party Lenders excluded from above comparison) 16
Exhibit 99.1

MarketExpansion&NewProductOfferings17MarketExpansion&NewProductOfferings17
Exhibit 99.1
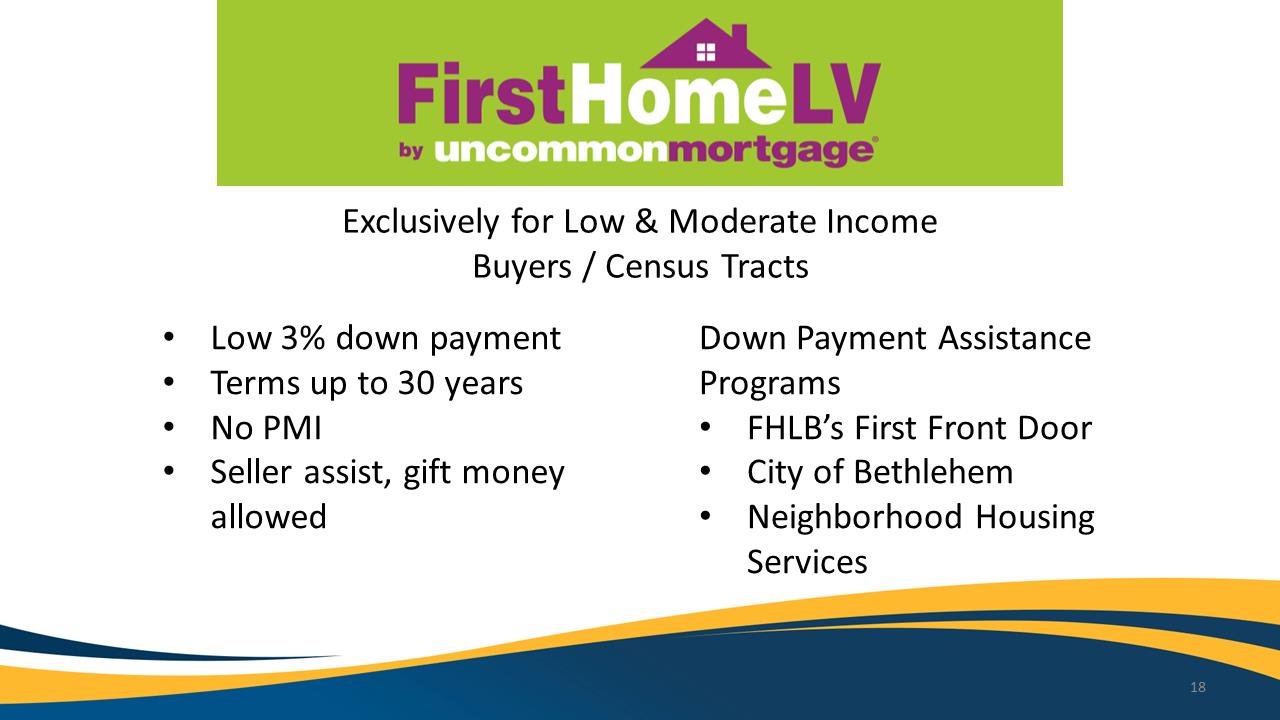
FirstHomeLV by uncommonmortgage NeighborhoodHousingServicesallowed18 NeighborhoodHousingServicesallowed18 Exclusively for Low & Moderate Income Buyers / Census Tracts • Low 3% down payment Down Payment Assistance • Terms up to 30 years Programs • No PMI • FHLB’s First Front Door • Seller assist, gift money • City of Bethlehem
Exhibit 99.1
Additional Product Offerings • Teen Checking Account • Clover Suite of Merchant Processing Products • ACH Positive Pay for Businesses • Consumer Credit Cards 19
Exhibit 99.1
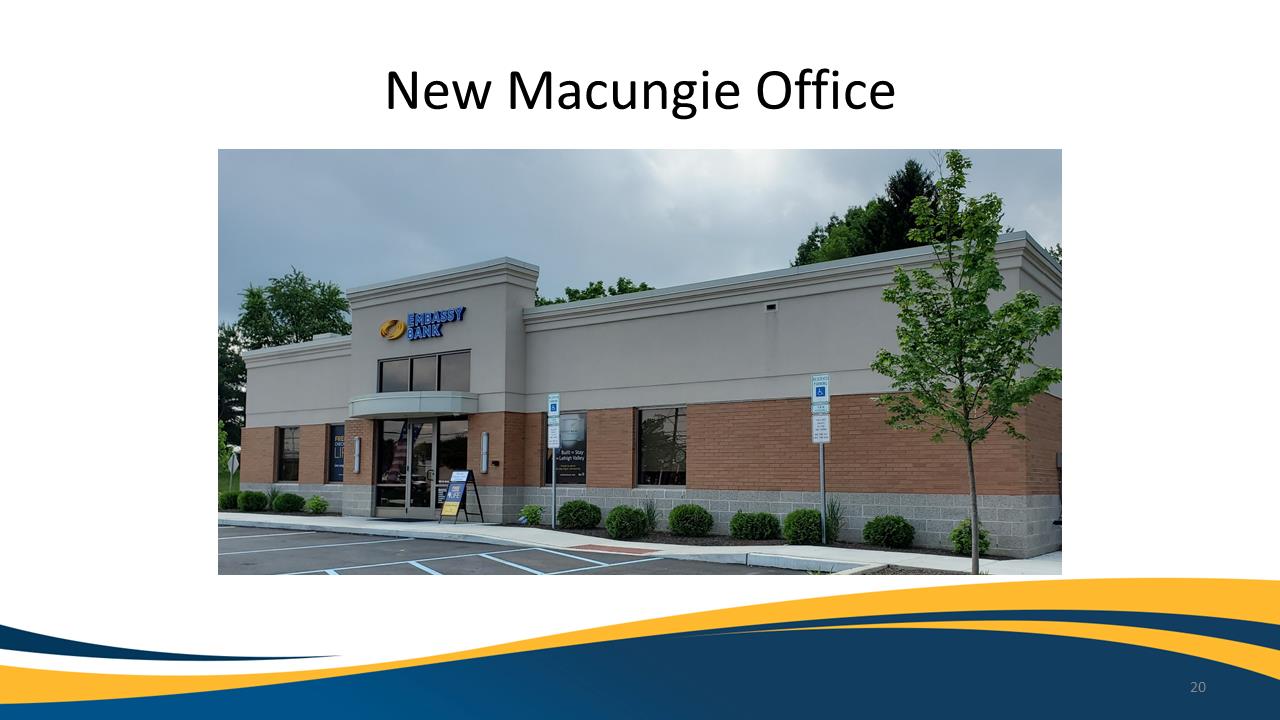
New Macungie Office 20
Exhibit 99.1
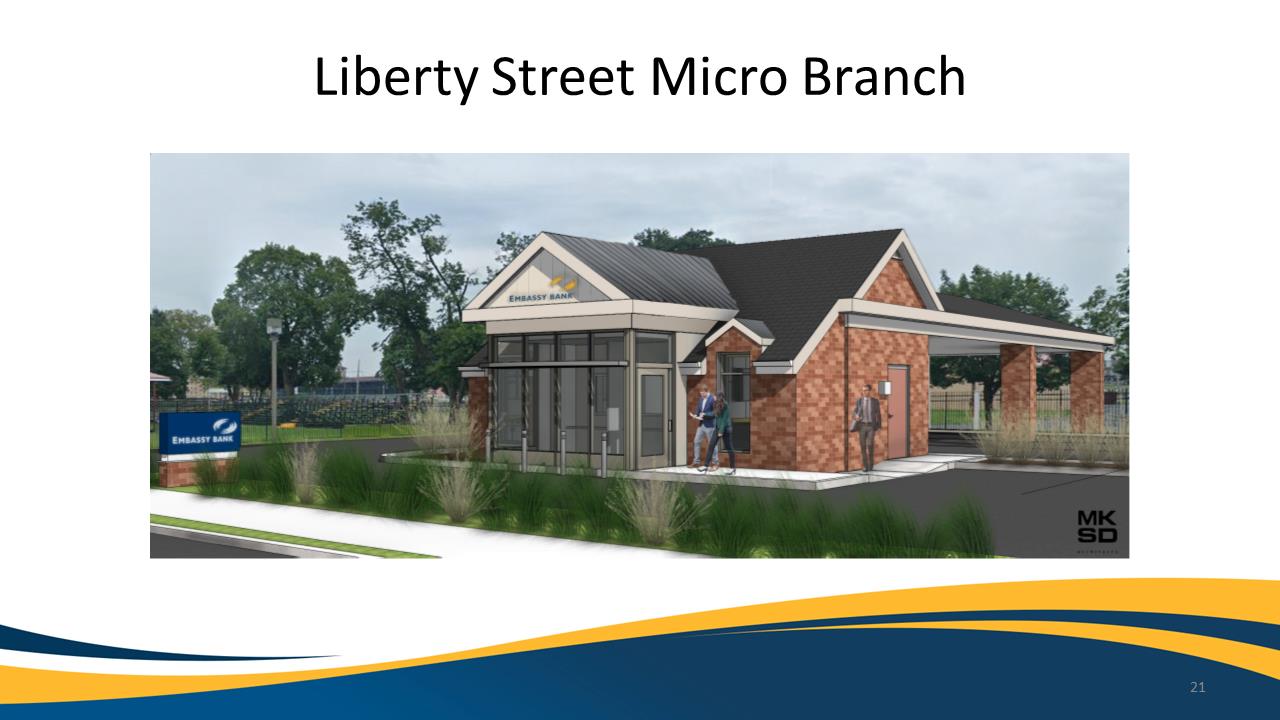
Liberty Street Micro Branch 21
Exhibit 99.1

Our Digital Bank – Lynne Neel 22
Exhibit 99.1
Our Digital Bank Embassy Bank Online smart secure local support member fdic equal housing lender 23
Exhibit 99.1
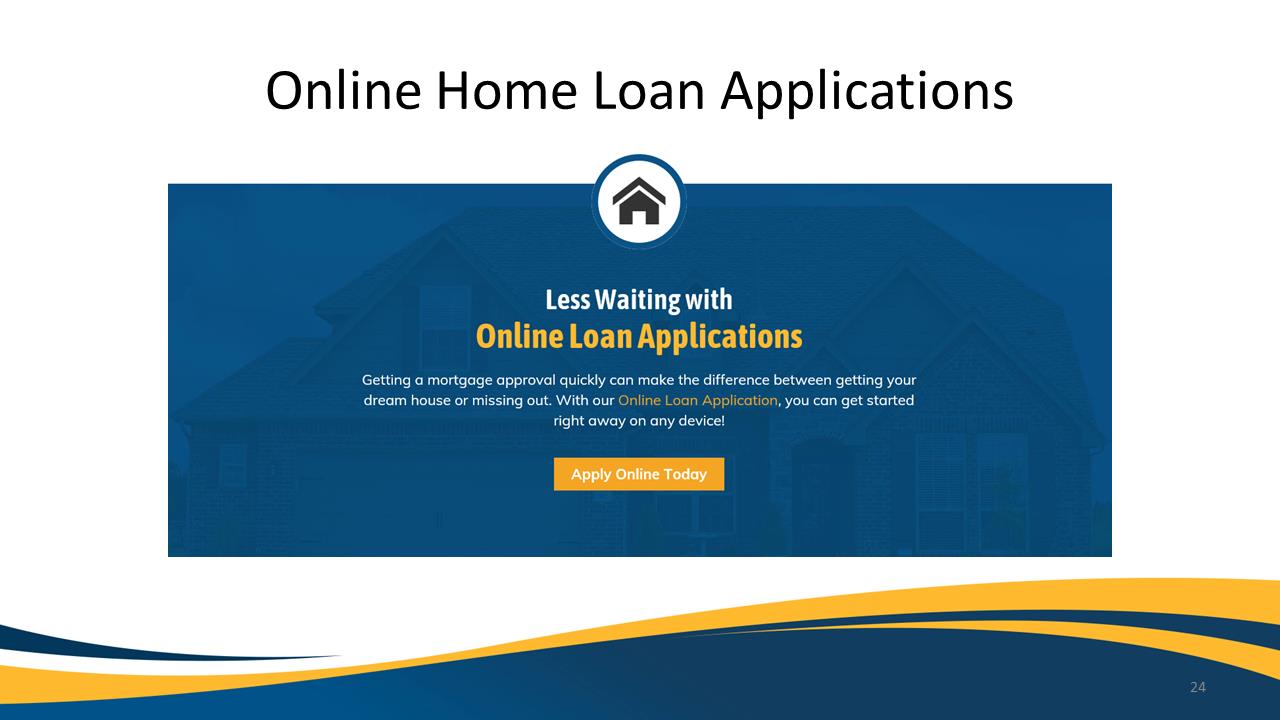
Online Home Loan Applications Less Waiting with Online Loan Applications Getting a mortgage approved quickly can make the difference between getting your dream house or missing out. With our Online Loan Application, you can get started right away on any device. Apply Online Today 24
Exhibit 99.1
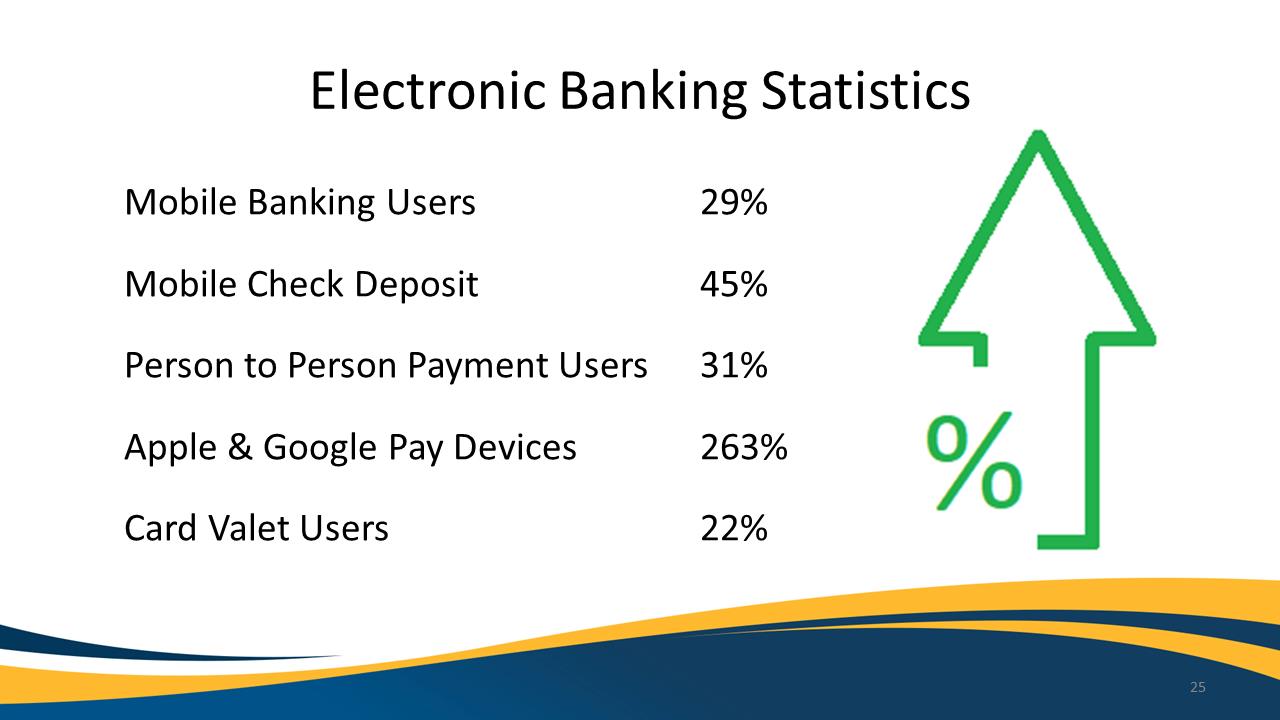
ElectronicBankingStatisticsMobileBankingUsers29%
MobileCheckDeposit45%
PersontoPersonPaymentUsers31%
Apple&GooglePayDevices263%
CardValetUsers22%
25ElectronicBankingStatisticsMobileBankingUsers29%
MobileCheckDeposit45%
PersontoPersonPaymentUsers31%
Apple&GooglePayDevices263%
CardValetUsers22%
25
Exhibit 99.1

New and Expanded Online Experience 26
Exhibit 99.1

COVID‐19Response‐JimBartholomew27
Exhibit 99.1
Embassy Team • Remote work / staffing rotations • PTO buyback • Policy • Hardship loans • FCRA/CARES Act participation • Culture and team morale 28
Exhibit 99.1
Our Community and Customers Physical Accommodations • Implemented physical safeguards at all office locations • Amended operating hours • Drive‐up and appointment banking • 24/7 Online and ATM availability • Multi‐phase re‐opening plan 29
Exhibit 99.1
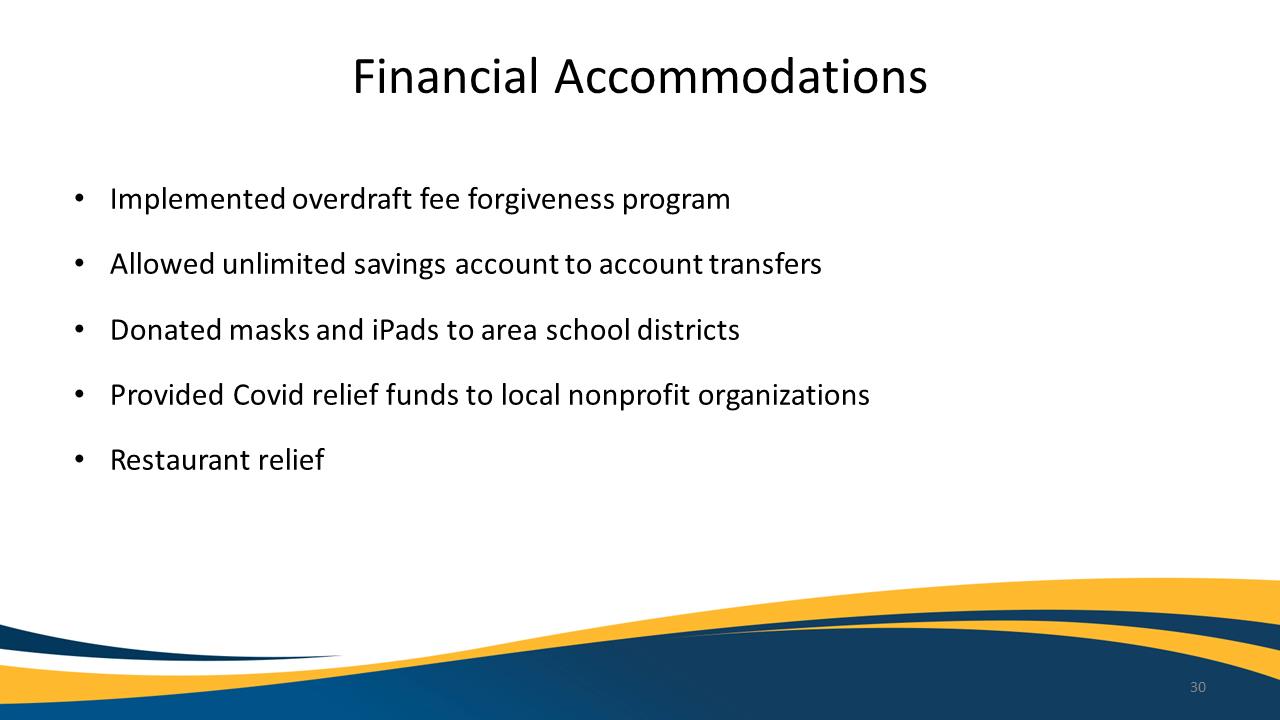
Financial Accommodations • Implemented overdraft fee forgiveness program • Allowed unlimited savings account to account transfers • Donated masks and iPads to area school districts • Provided Covid relief funds to local nonprofit organizations • Restaurant relief 30
Exhibit 99.1
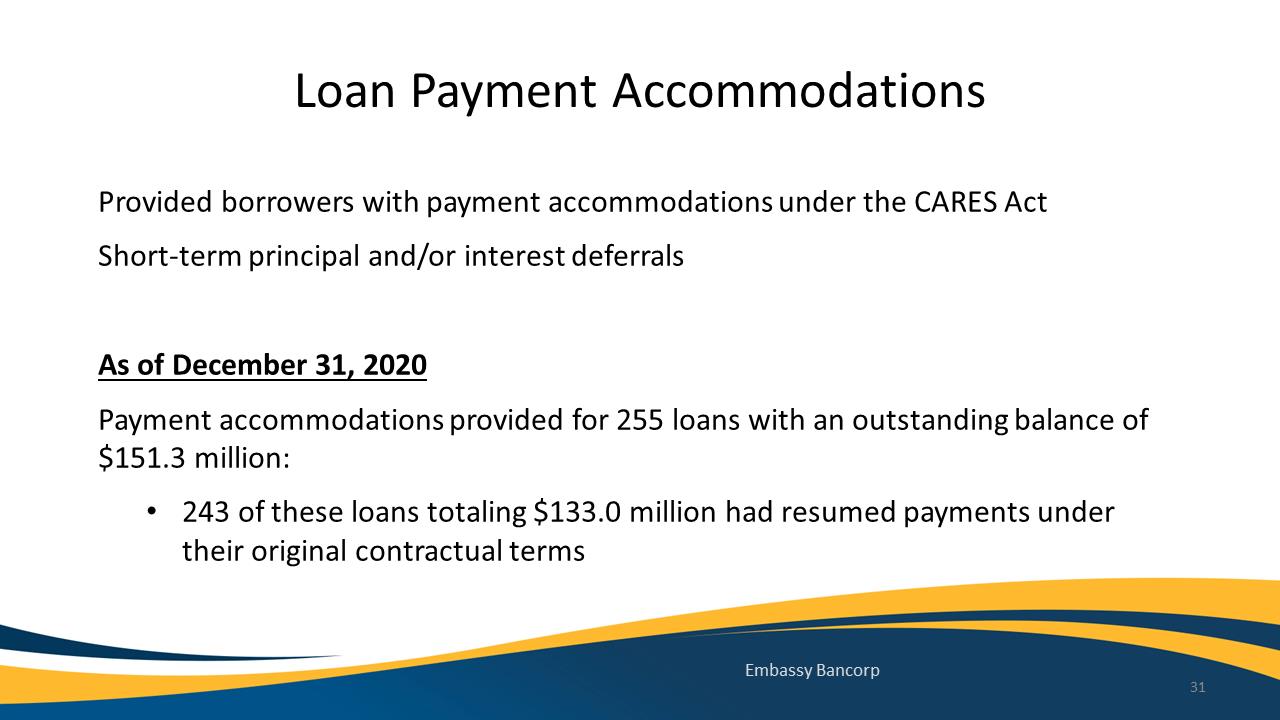
Loan Payment Accommodations Provided borrowers with payment accommodations under the CARES Act Short‐term principal and/or interest deferrals As of December 31, 2020 Payment accommodations provided for 255 loans with an outstanding balance of $151.3 million: • 243 of these loans totaling $133.0 million had resumed payments under their original contractual terms Embassy Bancorp 31
Exhibit 99.1
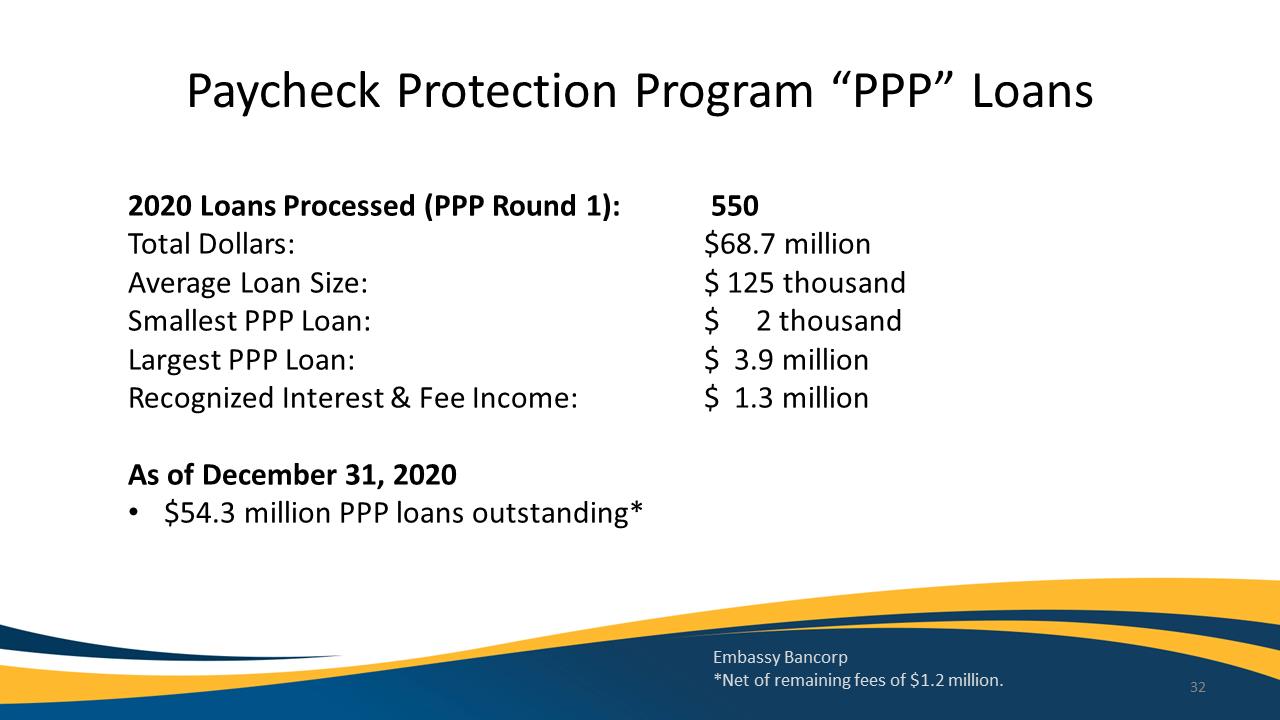
Embassy Bancorp*Netofremainingfeesof$1.2million.32• $54.3millionPPPloansoutstanding* Paycheck Protection Program “PPP” Loans 2020 Loans Processed (PPP Round 1): 550 Total Dollars: $68.7 million Average Loan Size: $ 125 thousand Smallest PPP Loan: $ 2 thousand Largest PPP Loan: $ 3.9 million Recognized Interest & Fee Income: $ 1.3 million As of December 31, 2020
Exhibit 99.1
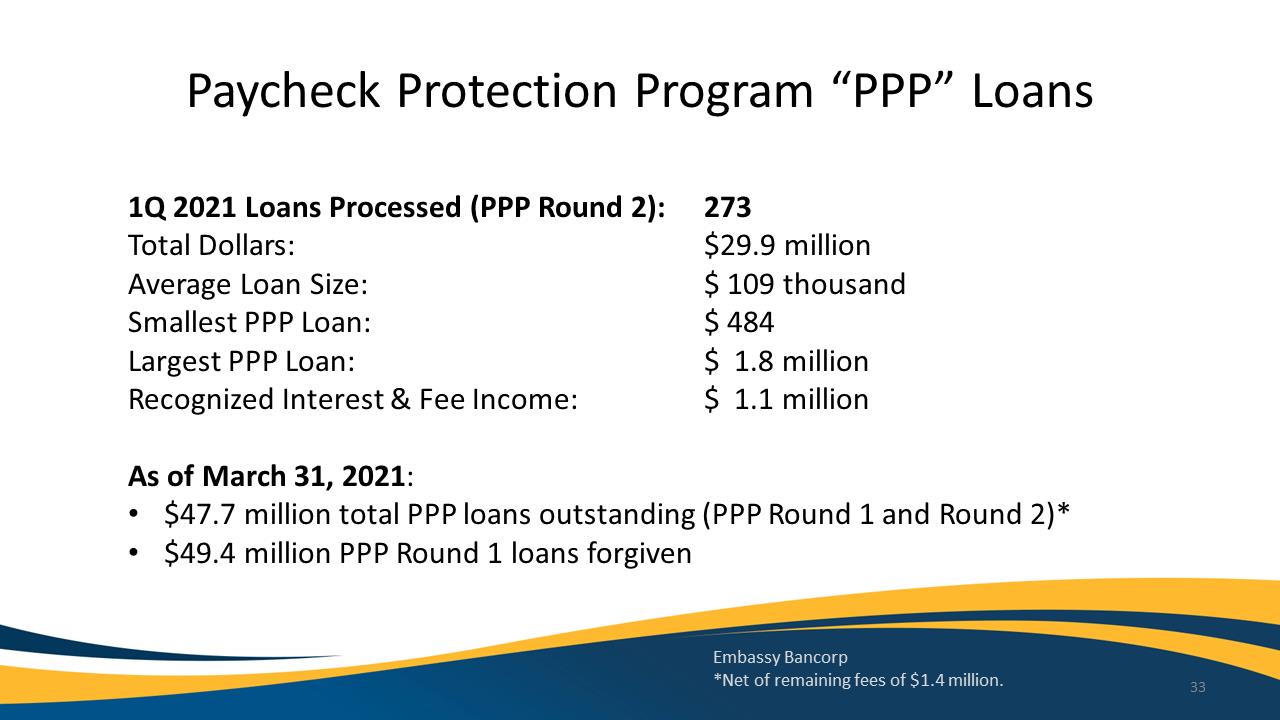
Paycheck Protection Program “PPP” Loans 1Q 2021 Loans Processed (PPP Round 2): 273 Total Dollars: $29.9 million Average Loan Size: $ 109 thousand Smallest PPP Loan: $ 484 Largest PPP Loan: $ 1.8 million Recognized Interest & Fee Income: $ 1.1 million As of March 31, 2021: • $47.7 million total PPP loans outstanding (PPP Round 1 and Round 2)• $49.4 million PPP Round 1 loans forgiven Embassy Bancorp *Net of remaining fees of $1.4 million. 33
Exhibit 99.1

Giving‐JudyHunsicker34Giving
Exhibit 99.1
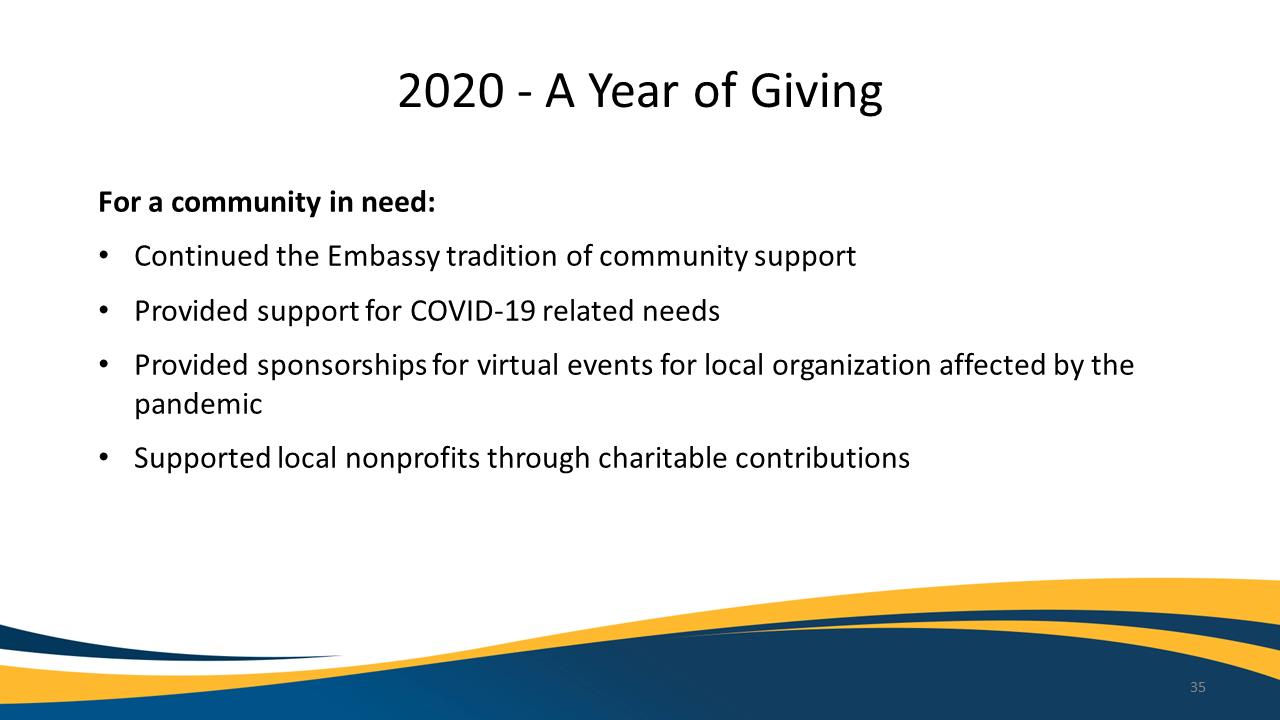
2020 ‐A Year of Giving For a community in need: • Continued the Embassy tradition of community support • Provided support for COVID‐19 related needs • Provided sponsorships for virtual events for local organization affected by the pandemic • Supported local nonprofits through charitable contributions 35
Exhibit 99.1
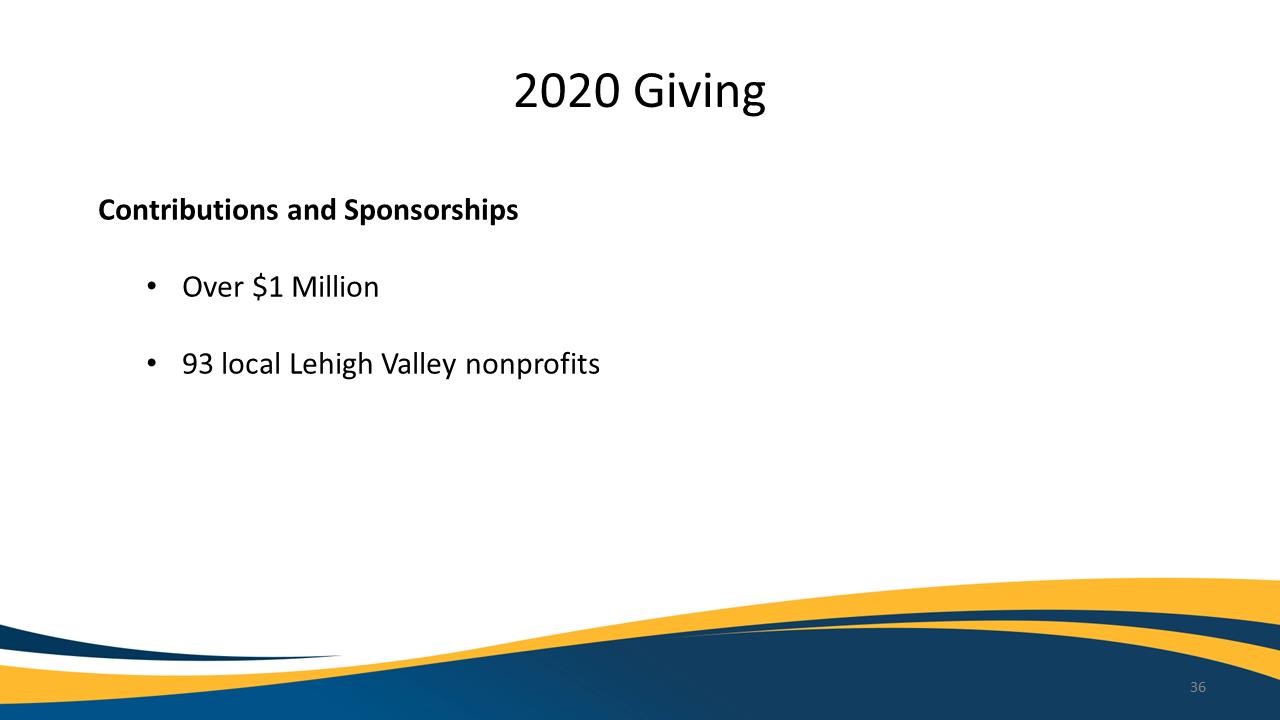
2020Giving36ContributionsandSponsorships• Over$1Million• 93localLehighValleynonprofits
Exhibit 99.1

2020Giving37VolunteerismandService• 110teammember&directorvolunteers• 93leadershippositionsinnonprofits
Exhibit 99.1
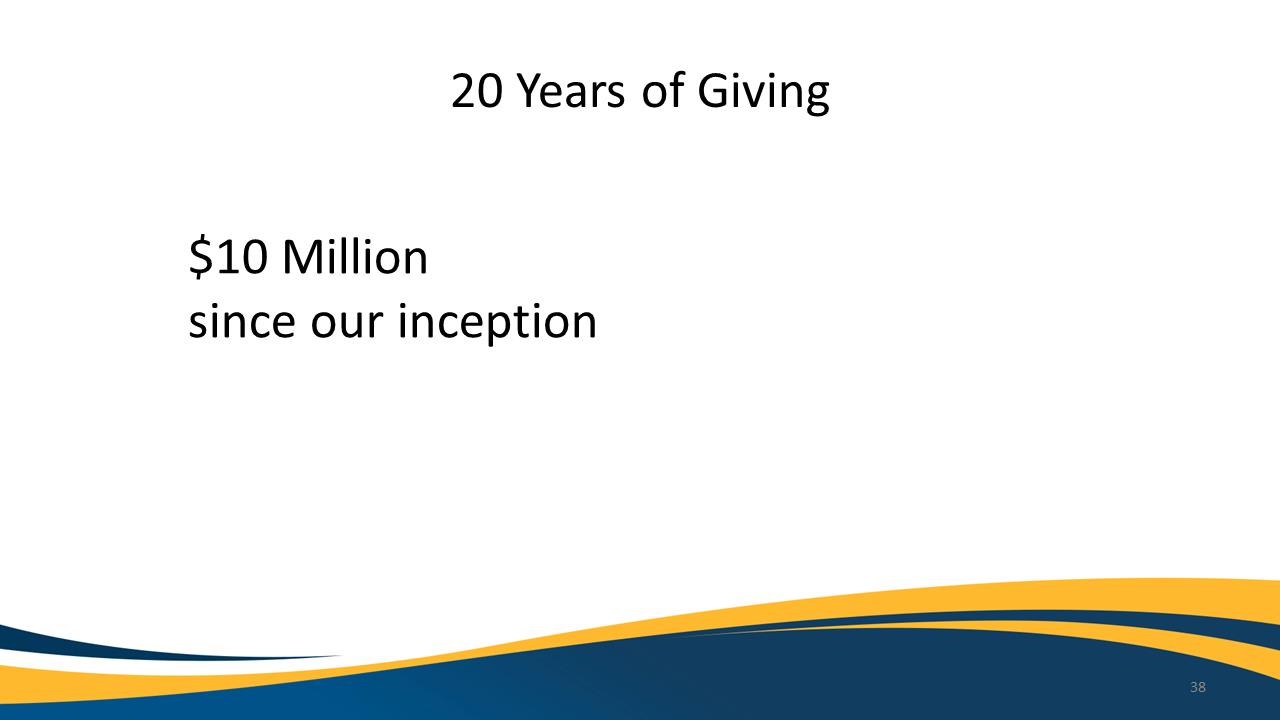
20YearsofGiving38$10Millionsinceourinception
Exhibit 99.1

Quality&Efficiency‐DaveLobach39
Exhibit 99.1
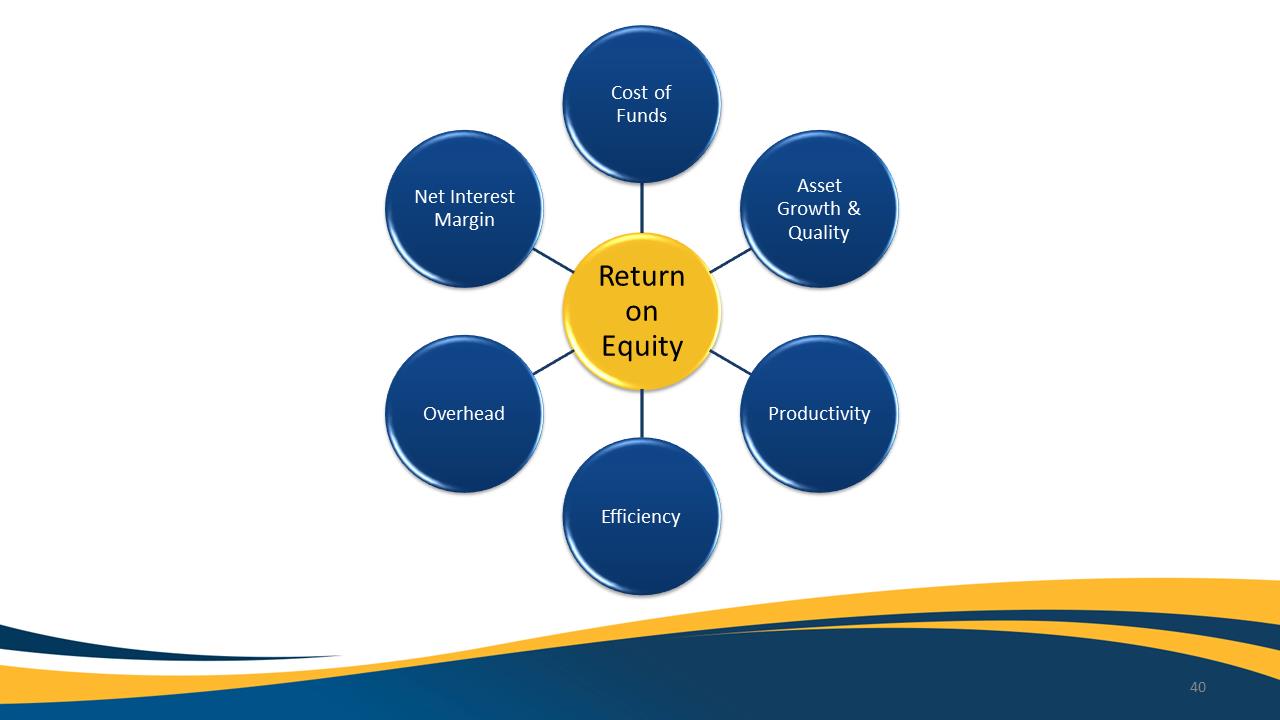
ReturnonEquityCostofFundsAssetGrowth&
QualityProductivityEfficiencyOverheadNetInterestMargin40
Exhibit 99.1
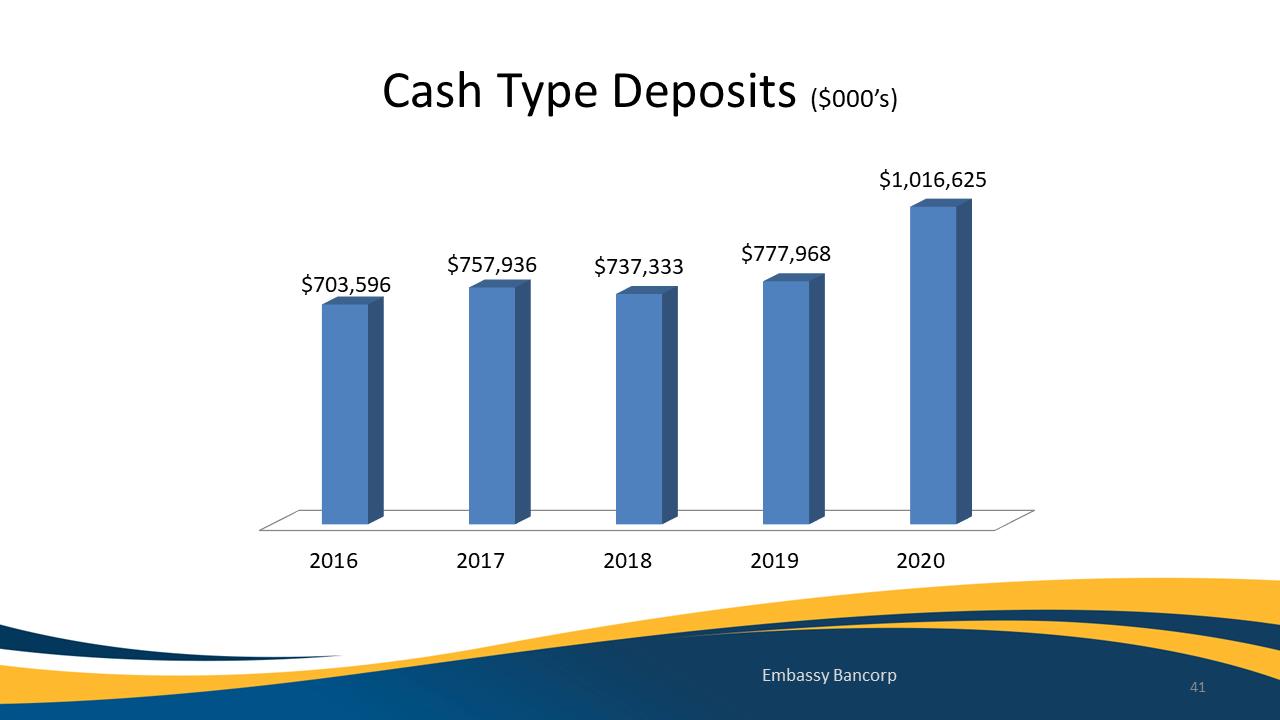
CashTypeDeposits($000’s)
20162017201820192020$703,596$757,936$737,333$777,968$1,016,625EmbassyBancorp41
Exhibit 99.1
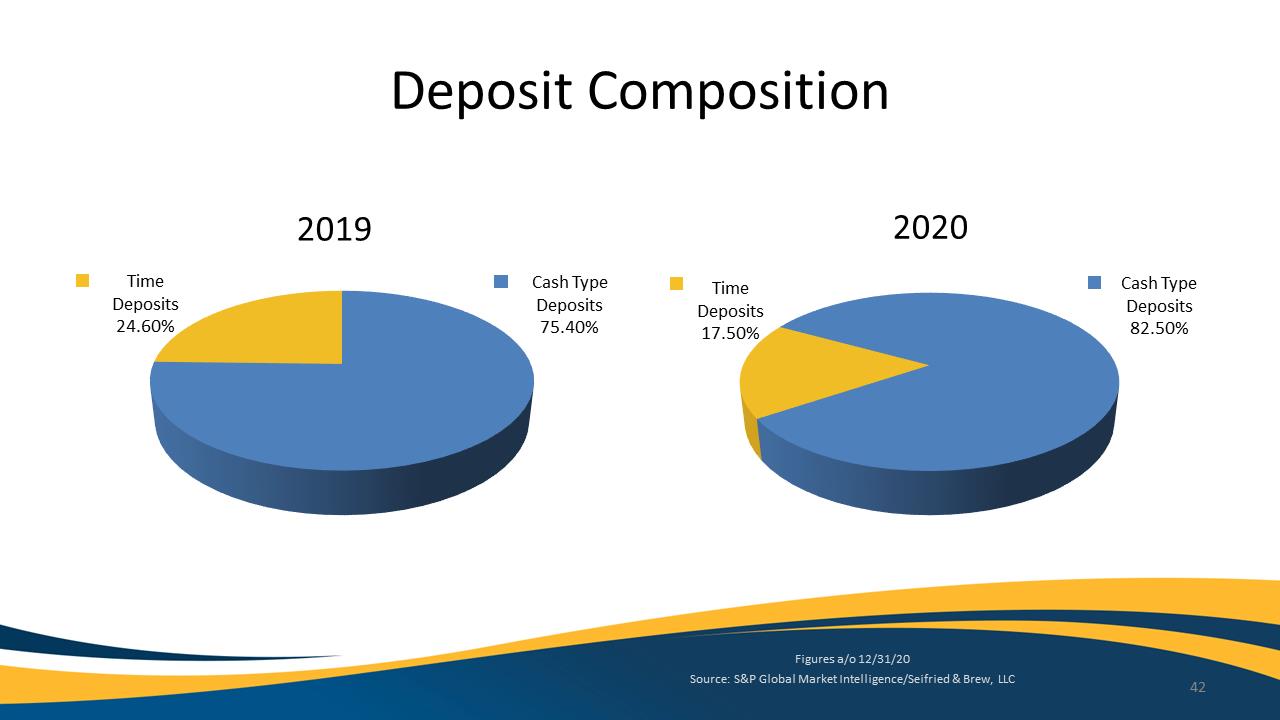
Deposits82.50% Deposit
Composition
2019
2020
TimeDeposits17.50%
Figuresa/o12/31/20Source:S&PGlobalMarketIntelligence/Seifried&Brew, LLC42Deposits75.40%
Deposits24.60%
Deposits82.50%
TimeDeposits17.50%
Exhibit 99.1
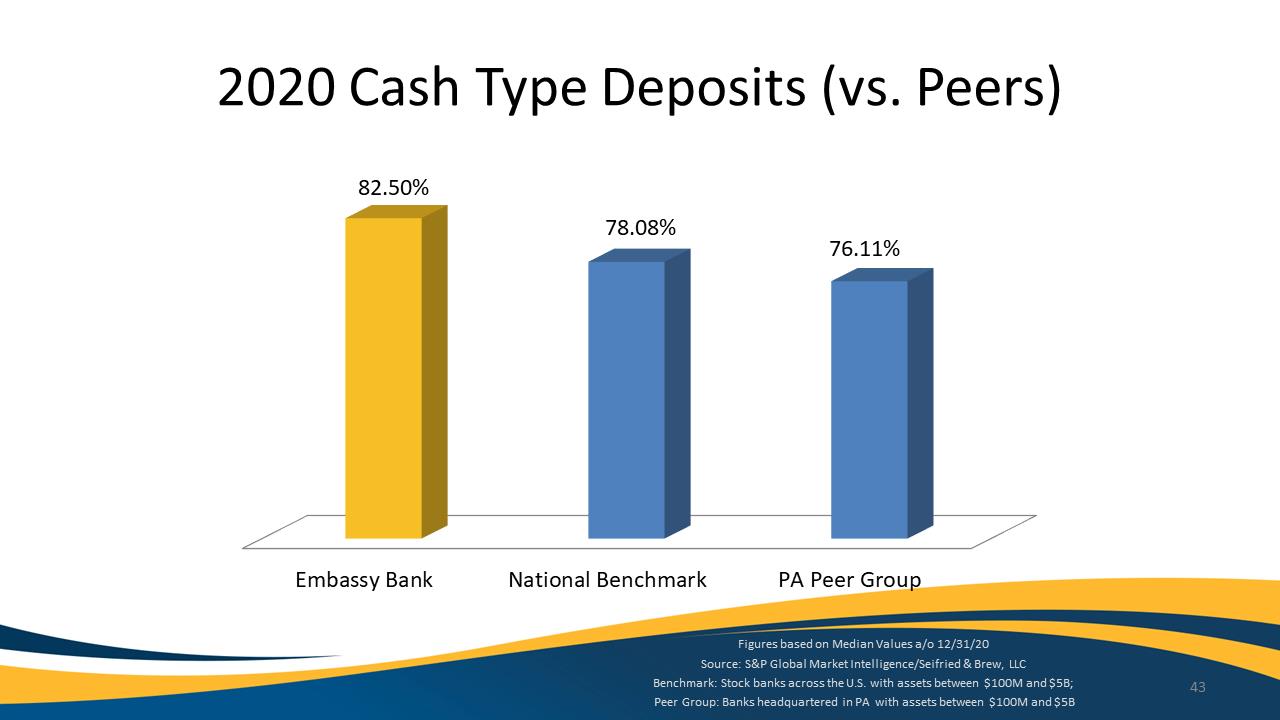
2020CashTypeDeposits(vs.Peers)82.50% 78.08% 76.11% 2020CashTypeDeposits(vs.Peers) 82.50% 78.08% 76.11% Embassy Bank National Benchmark PA Peer Group Figures based on Median Values a/o 12/31/20 Source: S&P Global Market Intelligence/Seifried & Brew, LLC Benchmark: Stock banks across the U.S. with assets between $100M and $5B; 43 Peer Group: Banks headquartered in PA with assets between $100M and $5B
Exhibit 99.1
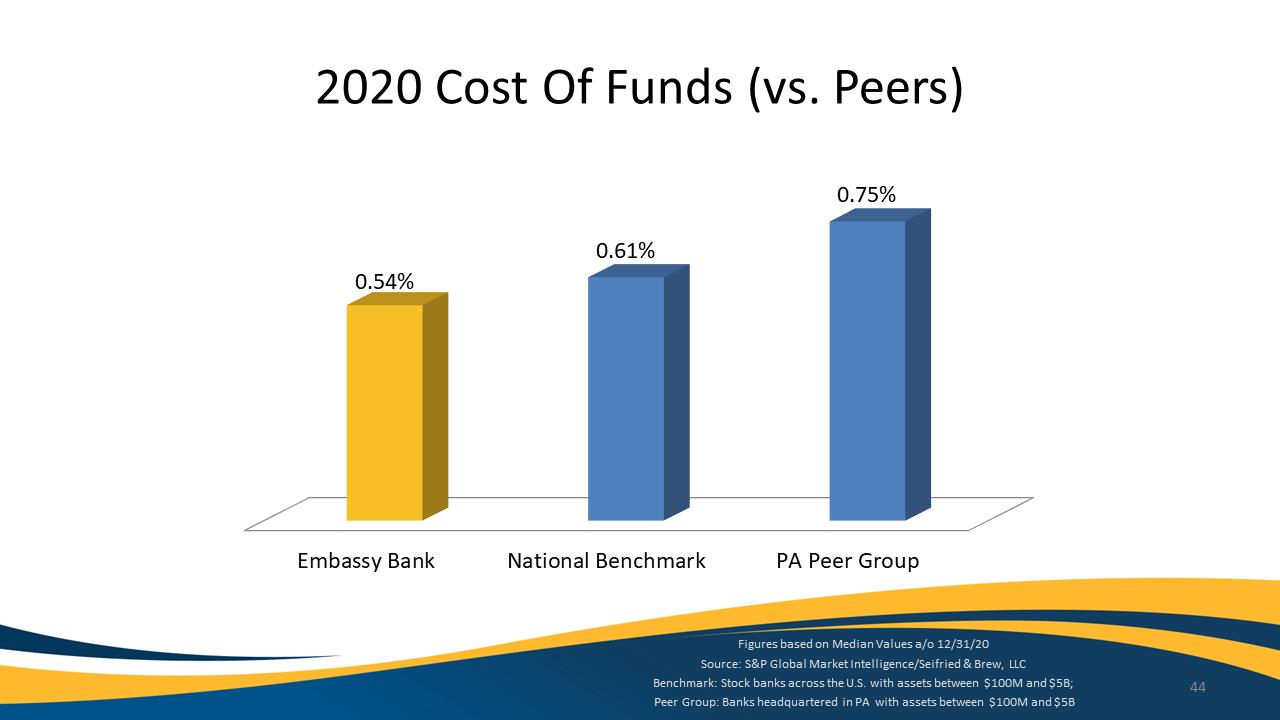
2020 Cost Of Funds (vs. Peers)
0.75%
0.61%
0.54%
Embassy Bank National Benchmark PA Peer Group
Figures based on Median Values a/o 12/31/20 Source: S&P Global Market Intelligence/Seifried & Brew, LLC
Benchmark: Stock banks across the U.S. with assets between $100M and $5B; 44
Peer Group: Banks headquartered in PA with assets between $100M and $5B
Exhibit 99.1
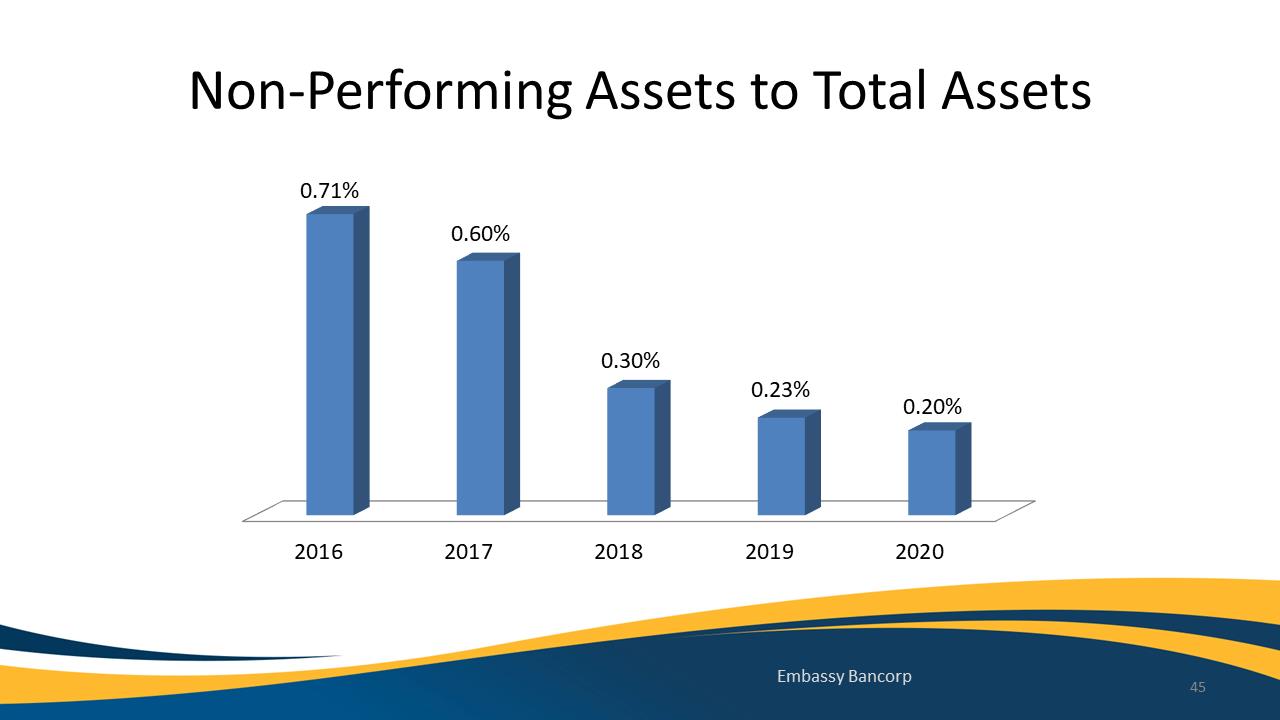
Non-Performing Assets to Total Assets
0.71%
0.60%
0.30%
0.23%
0.20%
2016 2017 2018 2019 2020
Embassy Bancorp 45
Exhibit 99.1
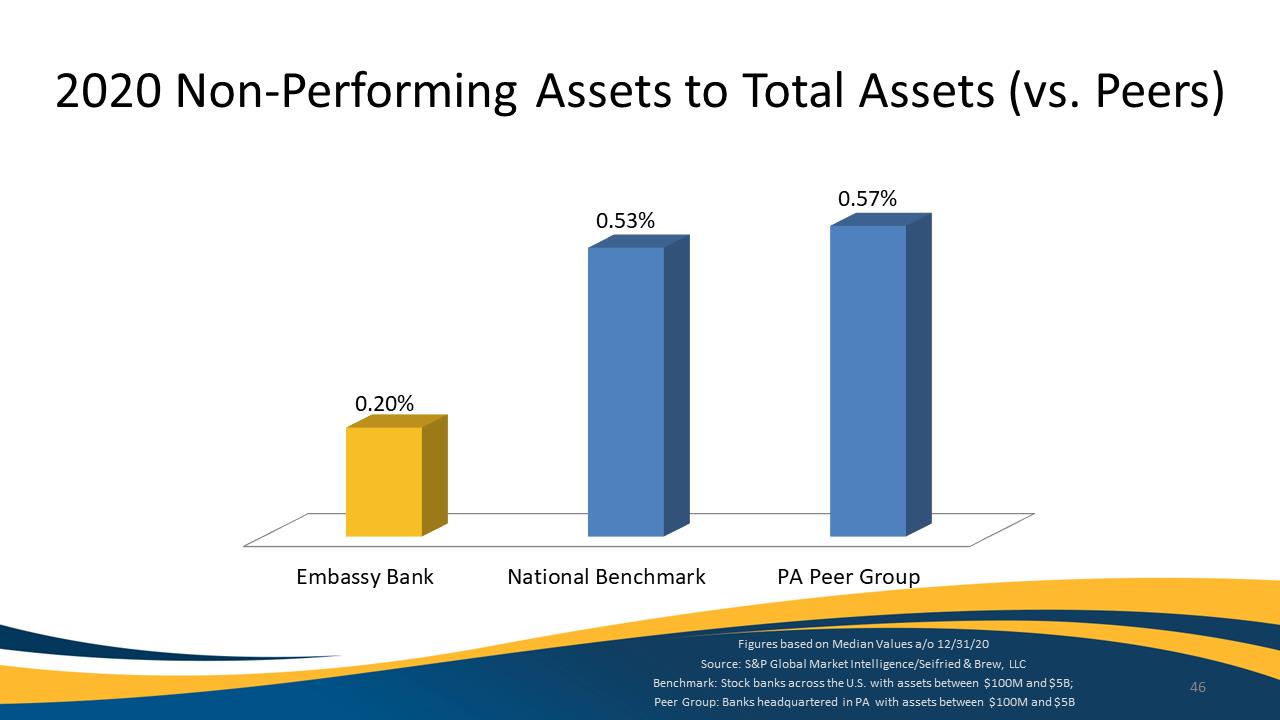
2020 Non‐Performing Assets to Total Assets (vs. Peers)
0.53%
0.57%
0.20%
Embassy Bank National Benchmark PA Peer Group
Figures based on Median Values a/o 12/31/20 Source: S&P Global Market Intelligence/Seifried & Brew, LLC
Benchmark: Stock banks across the U.S. with assets between $100M and $5B; 46
Peer Group: Banks headquartered in PA with assets between $100M and $5B
Exhibit 99.1
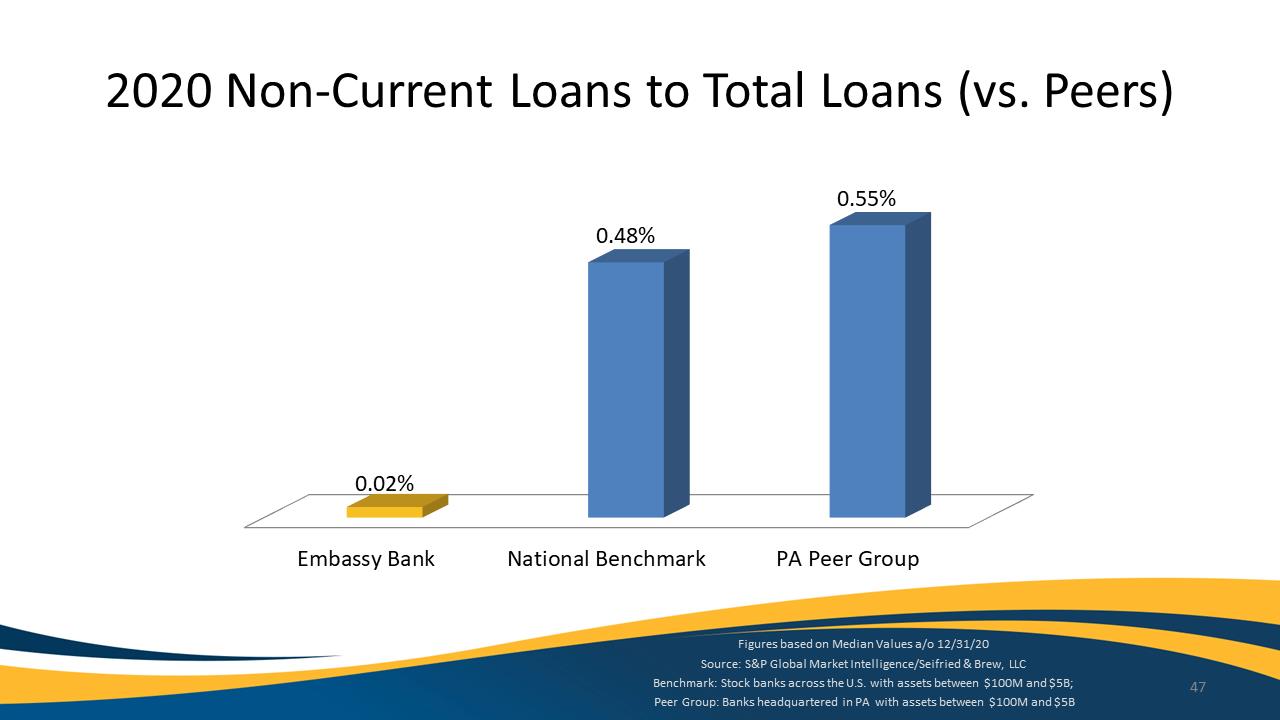
2020 Non‐Current Loans to Total Loans (vs. Peers)
0.55%
0.48%
0.02%
Embassy Bank National Benchmark PA Peer Group
Figures based on Median Values a/o 12/31/20 Source: S&P Global Market Intelligence/Seifried & Brew, LLC
Benchmark: Stock banks across the U.S. with assets between $100M and $5B; 47
Peer Group: Banks headquartered in PA with assets between $100M and $5B
Exhibit 99.1
Number of Bank‐Owned Properties in 2020 Zero
Exhibit 99.1
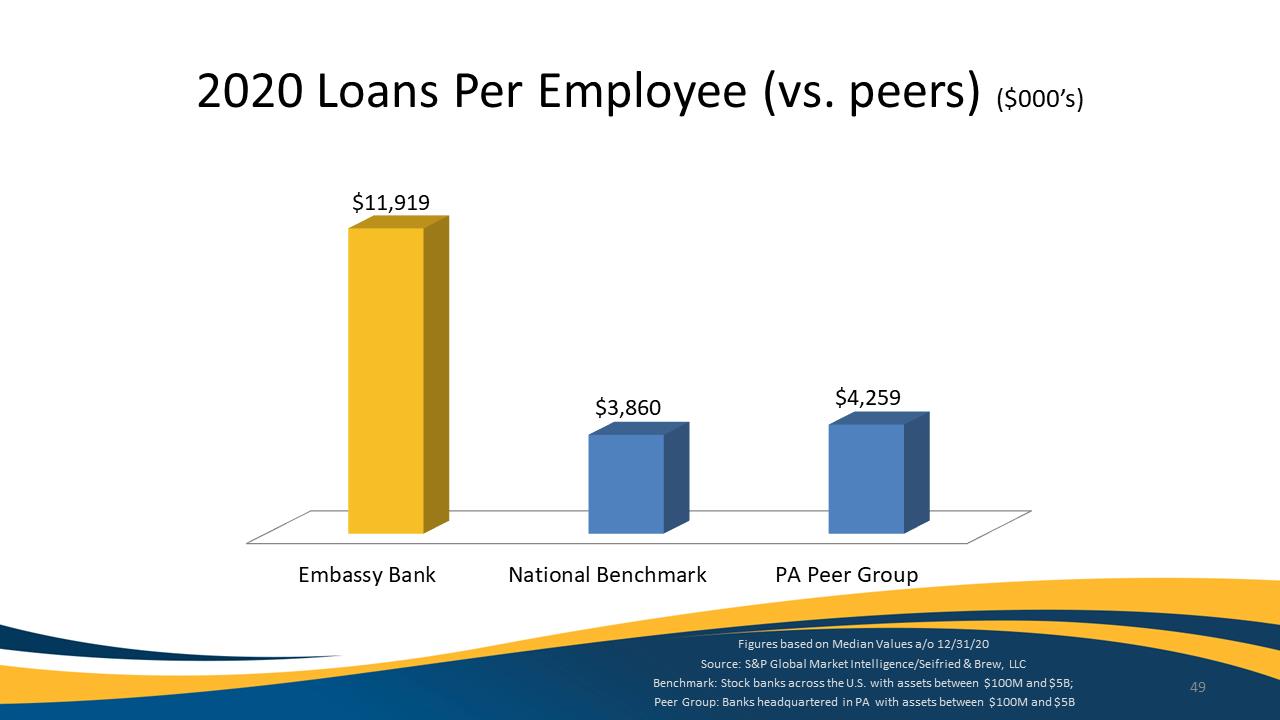
2020 Loans Per Employee (vs. peers) ($000’s)
$11,919
$3,860 $4,259
Embassy Bank National Benchmark PA Peer Group
Figures based on Median Values a/o 12/31/20 Source: S&P Global Market Intelligence/Seifried & Brew, LLC
Benchmark: Stock banks across the U.S. with assets between $100M and $5B; 49
Peer Group: Banks headquartered in PA with assets between $100M and $5B
Exhibit 99.1
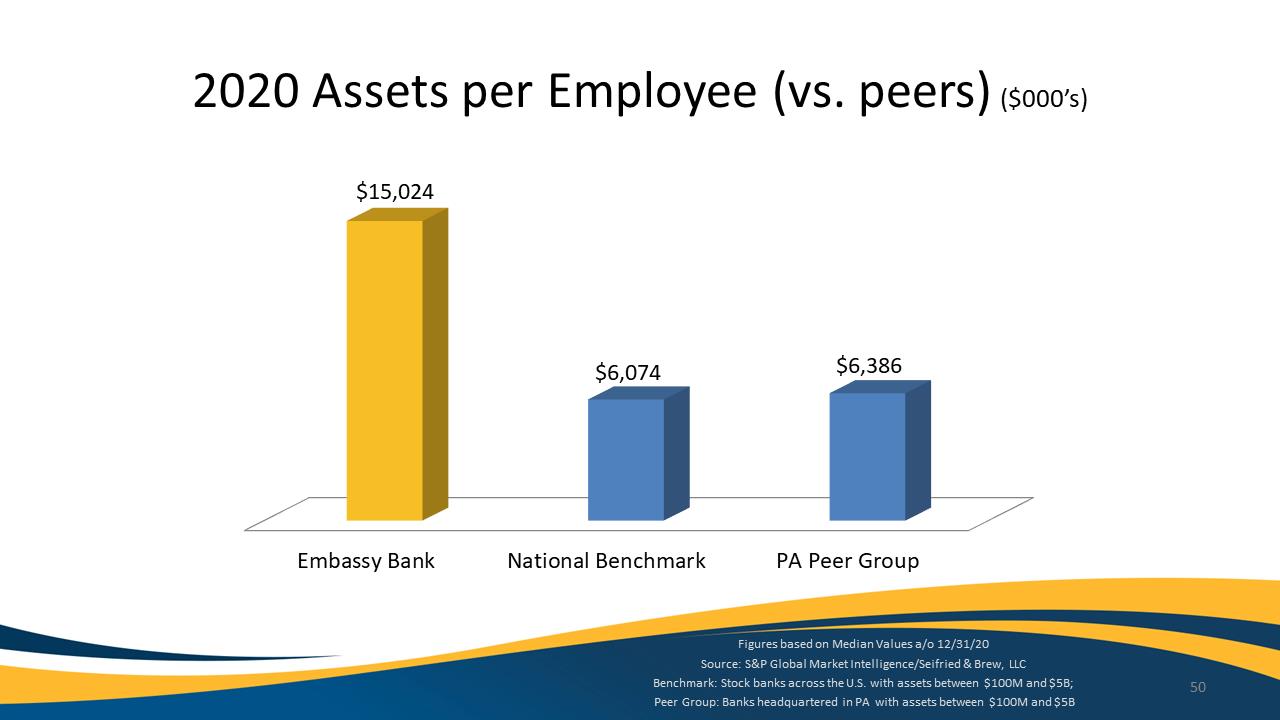
2020 Assets per Employee (vs. peers) ($000’s)
$15,024
$6,074 $6,386
Embassy Bank National Benchmark PA Peer Group
Figures based on Median Values a/o 12/31/20 Source: S&P Global Market Intelligence/Seifried & Brew, LLC
Benchmark: Stock banks across the U.S. with assets between $100M and $5B; 50
Peer Group: Banks headquartered in PA with assets between $100M and $5B
Exhibit 99.1
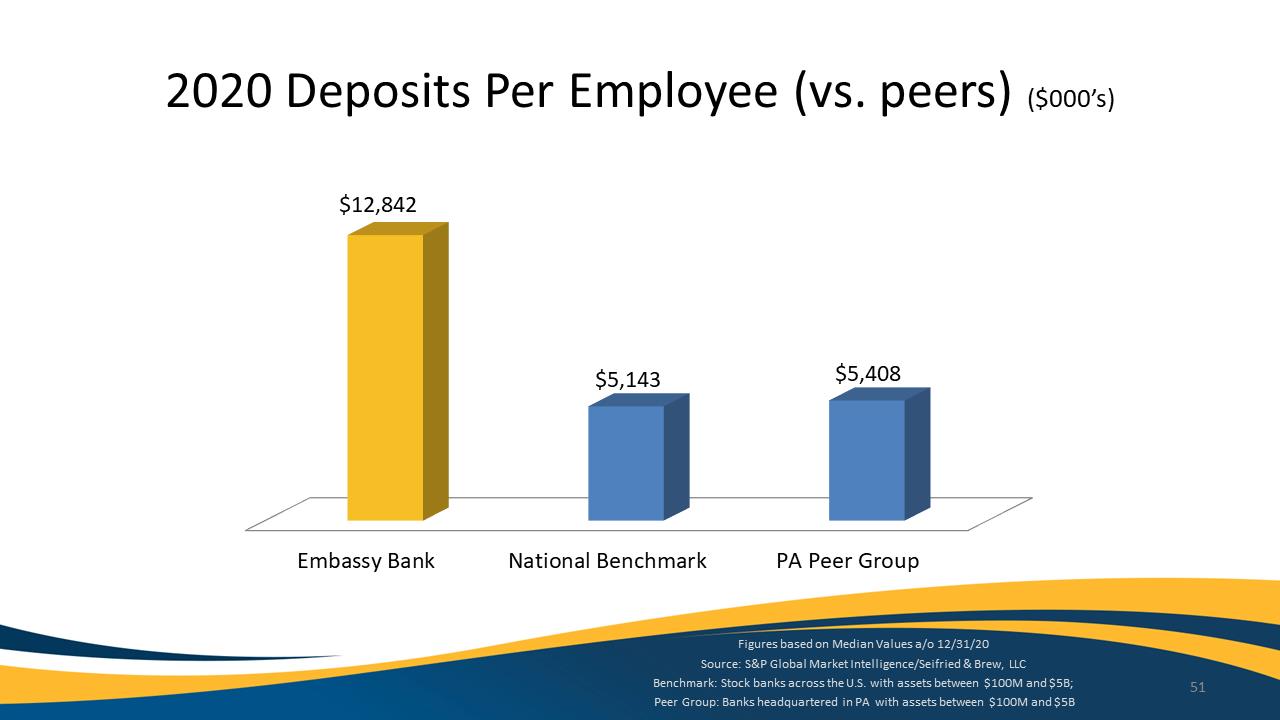
2020 Deposits Per Employee (vs. peers) ($000’s)
$12,842
$5,143 $5,408
Embassy Bank National Benchmark PA Peer Group
Figures based on Median Values a/o 12/31/20 Source: S&P Global Market Intelligence/Seifried & Brew, LLC
Benchmark: Stock banks across the U.S. with assets between $100M and $5B; 51
Peer Group: Banks headquartered in PA with assets between $100M and $5B
Exhibit 99.1
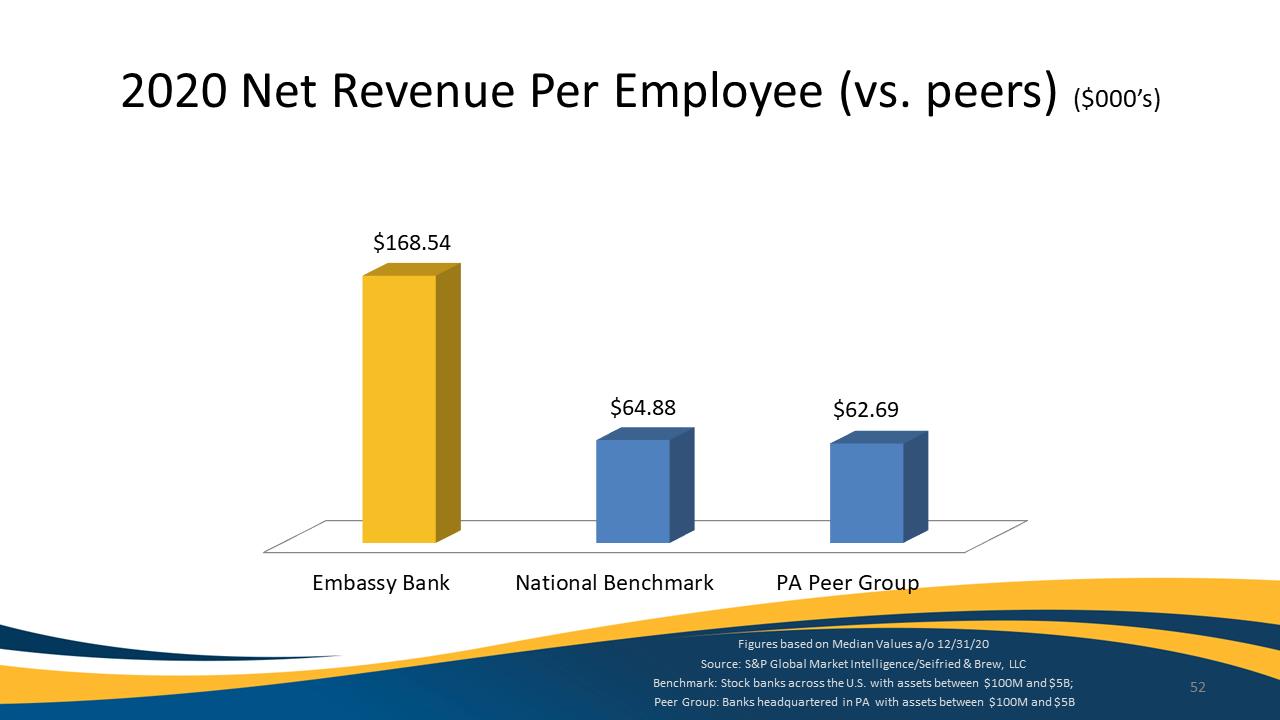
2020 Net Revenue Per Employee (vs. peers) ($000’s)
$168.54
$64.88 $62.69
Embassy Bank National Benchmark PA Peer Group
Figures based on Median Values a/o 12/31/20 Source: S&P Global Market Intelligence/Seifried & Brew, LLC
Benchmark: Stock banks across the U.S. with assets between $100M and $5B; 52
Peer Group: Banks headquartered in PA with assets between $100M and $5B
Exhibit 99.1
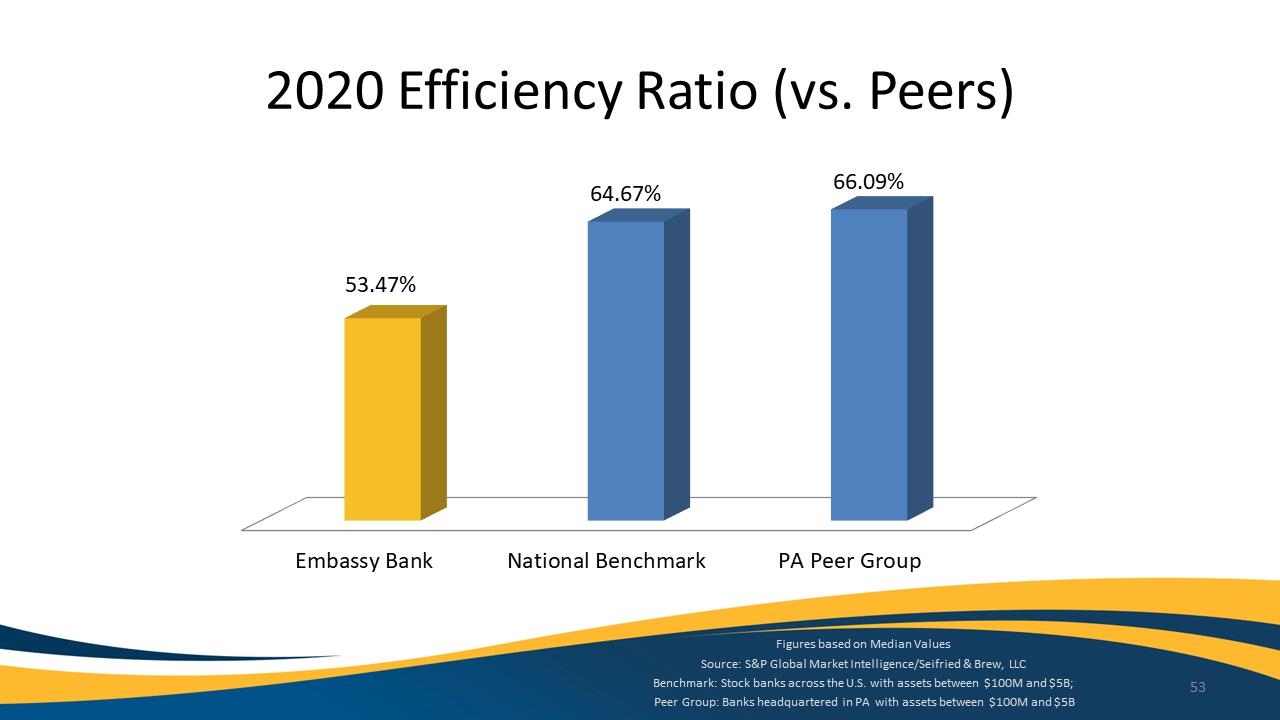
2020 Efficiency Ratio (vs. Peers)
64.67% 66.09%
53.47%
Embassy Bank National Benchmark PA Peer Group
Figures based on Median Values
Source: S&P Global Market Intelligence/Seifried & Brew, LLC
Benchmark: Stock banks across the U.S. with assets between $100M and $5B; 53
Peer Group: Banks headquartered in PA with assets between $100M and $5B
Exhibit 99.1
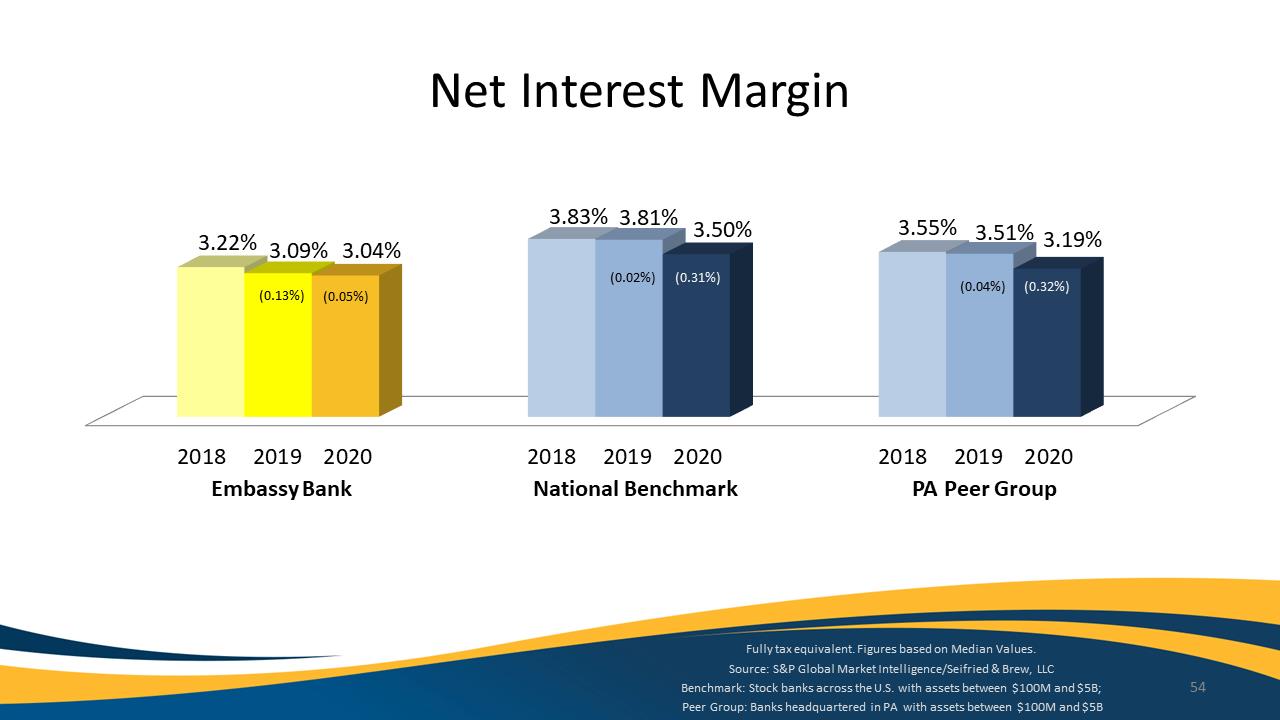
Net Interest Margin 3.22% 3.09% 3.04% 3.83% 3.81% 3.50% 3.55% 3.51% 3.19% (0.13%) (0.05%) (0.02%) (0.31%) (0.04%) (0.32%) 2018 2019 2020 2018 2019 2020 2018 2019 2020
Embassy Bank National Benchmark PA Peer Group
Fully tax equivalent. Figures based on Median Values.
Source: S&P Global Market Intelligence/Seifried & Brew, LLC
Benchmark: Stock banks across the U.S. with assets between $100M and $5B; 54
Peer Group: Banks headquartered in PA with assets between $100M and $5B
Exhibit 99.1
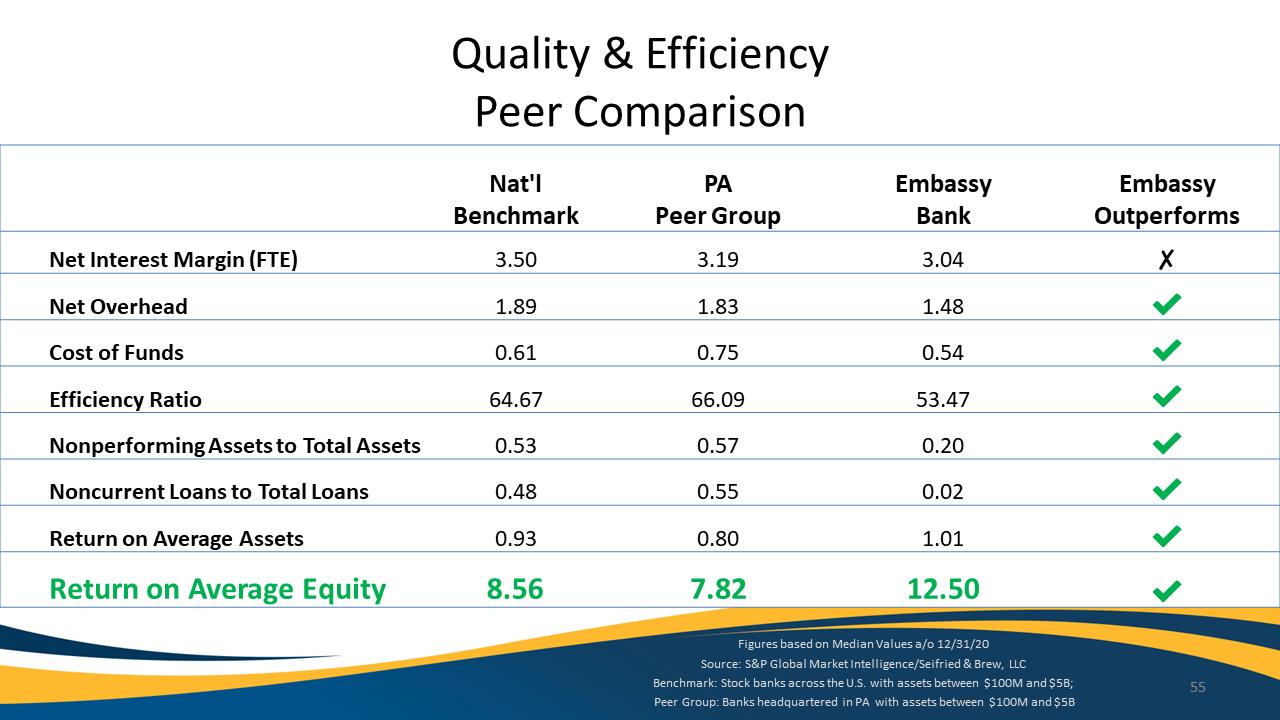
Nat'l PA Embassy Embassy Benchmark Peer Group Bank Outperforms Net Interest Margin (FTE) 3.50 3.19 3.04 Net Overhead 1.89 1.83 1.48 Cost of Funds 0.61 0.75 0.54 Efficiency Ratio
64.67 66.09 53.47 Nonperforming Assets to Total Assets 0.53 0.57 0.20 Noncurrent Loans to Total Loans 0.48 0.55 0.02 Return on Average Assets 0.93 0.80 1.01 Return on Average Equity
8.56 7.82 12.50 Quality & Efficiency Peer Comparison Figures based on Median Values a/o 12/31/20 Source: S&P Global Market Intelligence/Seifried & Brew, LLC Benchmark: Stock banks across the U.S. with assets between $100M and $5B; 55
Peer Group: Banks headquartered in PA with assets between $100M and $5B
Exhibit 99.1
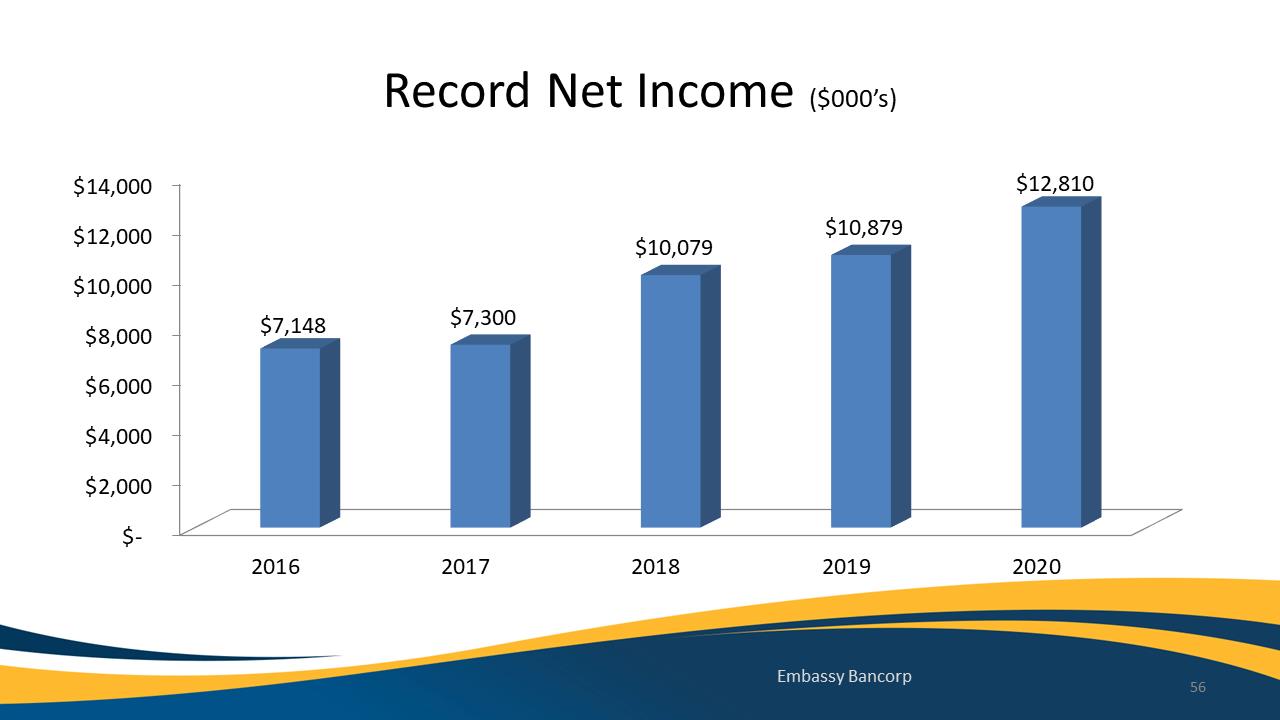
RecordNetIncome($000’s)
$‐
$2,000$4,000$6,000$8,000$10,000$12,000$14,00020162017201820192020$7,148$7,300$10,079$10,879$12,810EmbassyBancorp56RecordNetIncome($000’s)
$‐
$2,000$4,000$6,000$8,000$10,000$12,000$14,00020162017201820192020$7,148$7,300$10,079$10,879$12,810EmbassyBancorp56
Exhibit 99.1

1stQuarter2021Update‐JudyHunsicker571
Exhibit 99.1
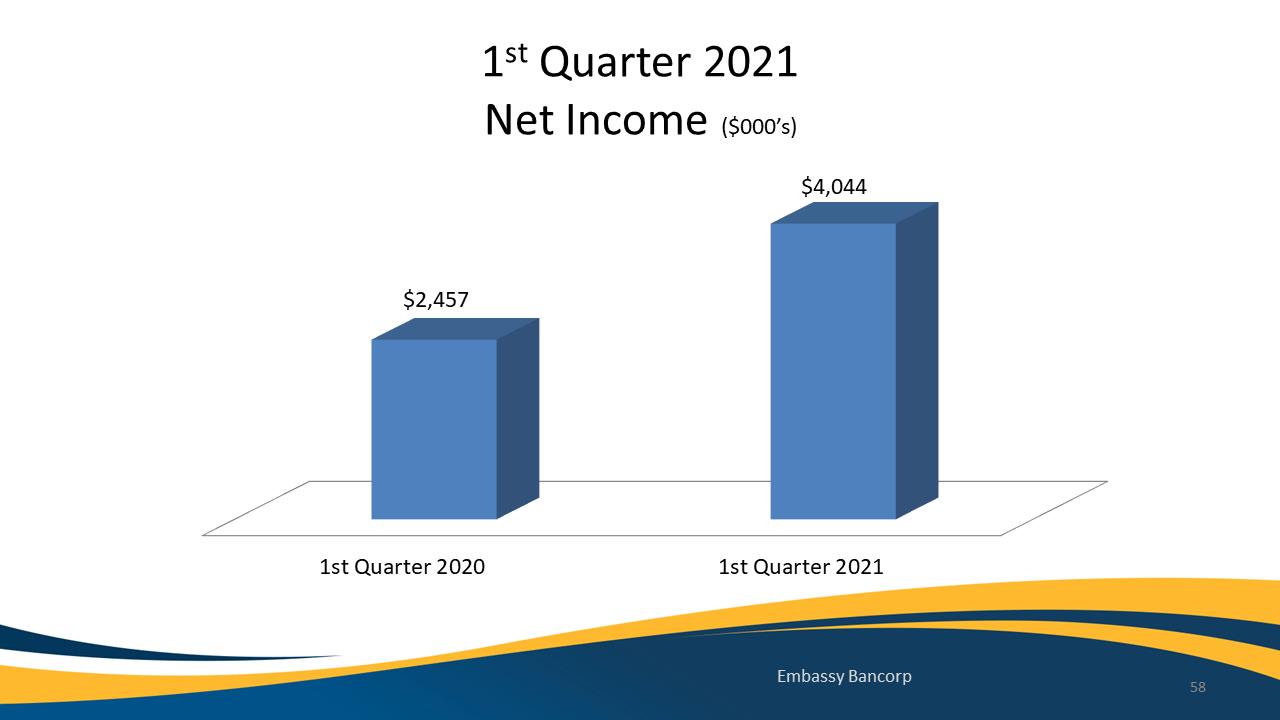
1stQuarter2021NetIncome($000’s)
1stQuarter20201stQuarter2021$2,457$4,044EmbassyBancorp581stQuarter2021NetIncome
Exhibit 99.1
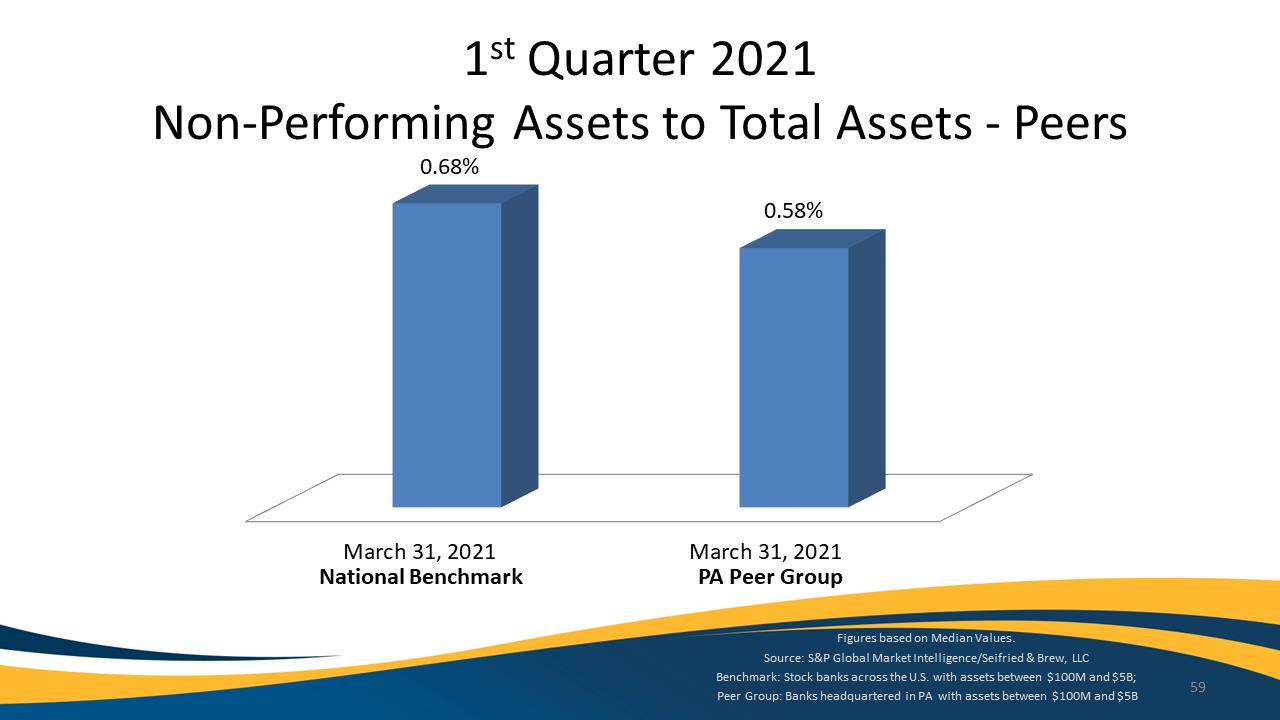
1st Quarter 2021 Non‐Performing Assets to Total Assets ‐ Peers
0.68%
0.58%
March 31, 2021 March 31, 2021
National Benchmark PA Peer Group
Figures based on Median Values.
Source: S&P Global Market Intelligence/Seifried & Brew, LLC Benchmark: Stock banks across the U.S. with assets between $100M and $5B;
Peer Group: Banks headquartered in PA with assets between $100M and $5B 59
Exhibit 99.1
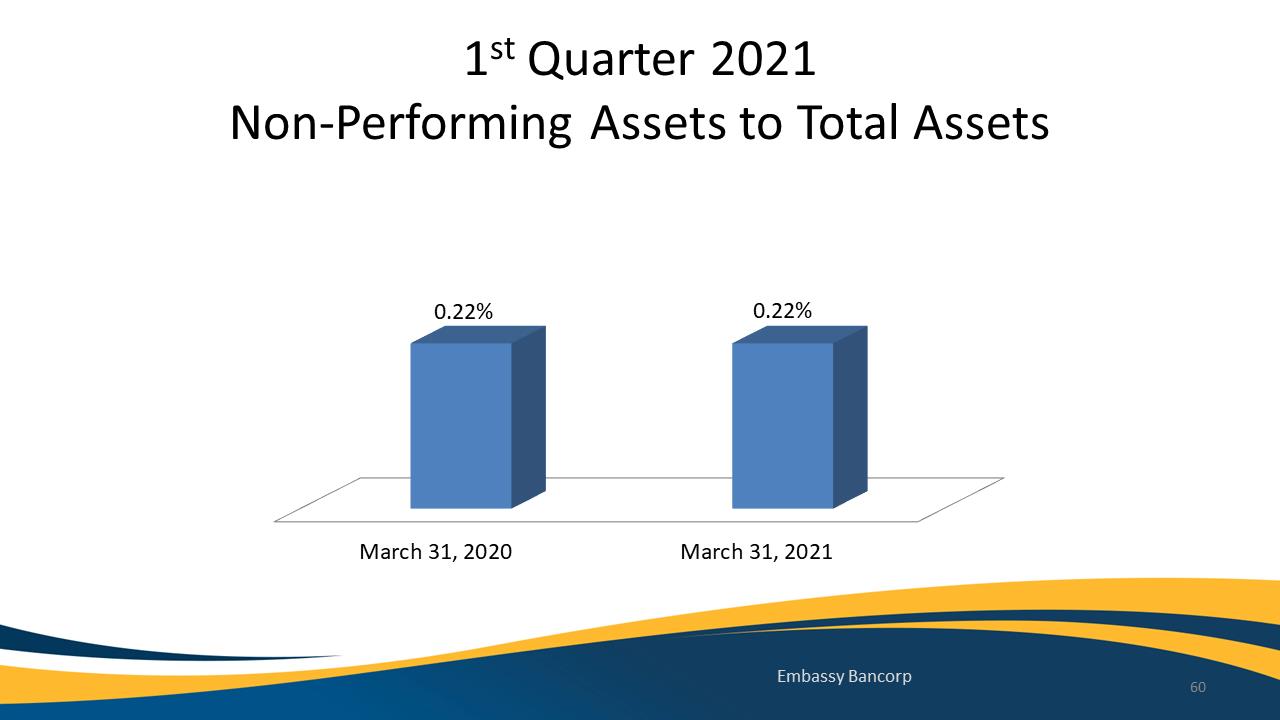
1st Quarter 2021 Non‐Performing Assets to Total Assets
0.22% 0.22%
March 31, 2020 March 31, 2021
Embassy Bancorp 60
Exhibit 99.1
1st Quarter 2021
Loan Payment Accommodations
As of April 30, 2021:
No loans remaining under COVID‐19 payment accommodations
1 loan in the amount of $418,000 transitioned to non‐accrual post‐ accommodation
Exhibit 99.1
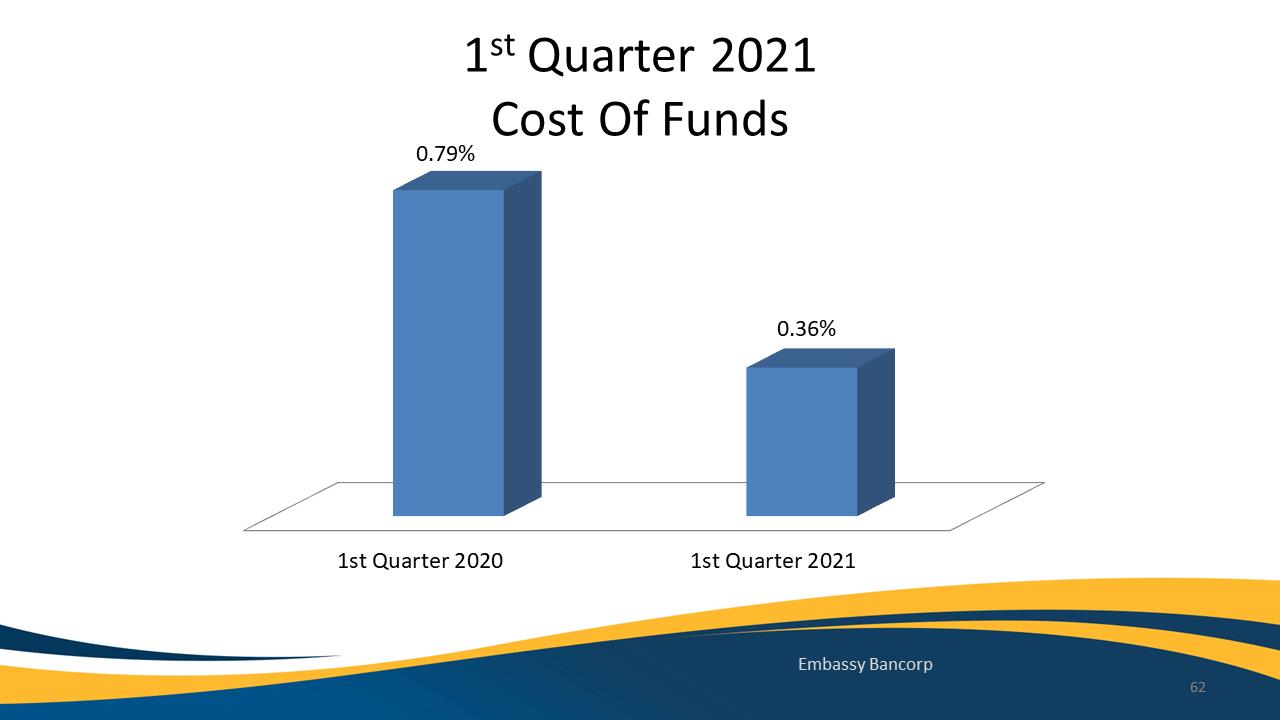
1st Quarter 2021
0.79%
Cost Of Funds
0.36%
1st Quarter 2020 1st Quarter 2021
Embassy Bancorp
62
Exhibit 99.1
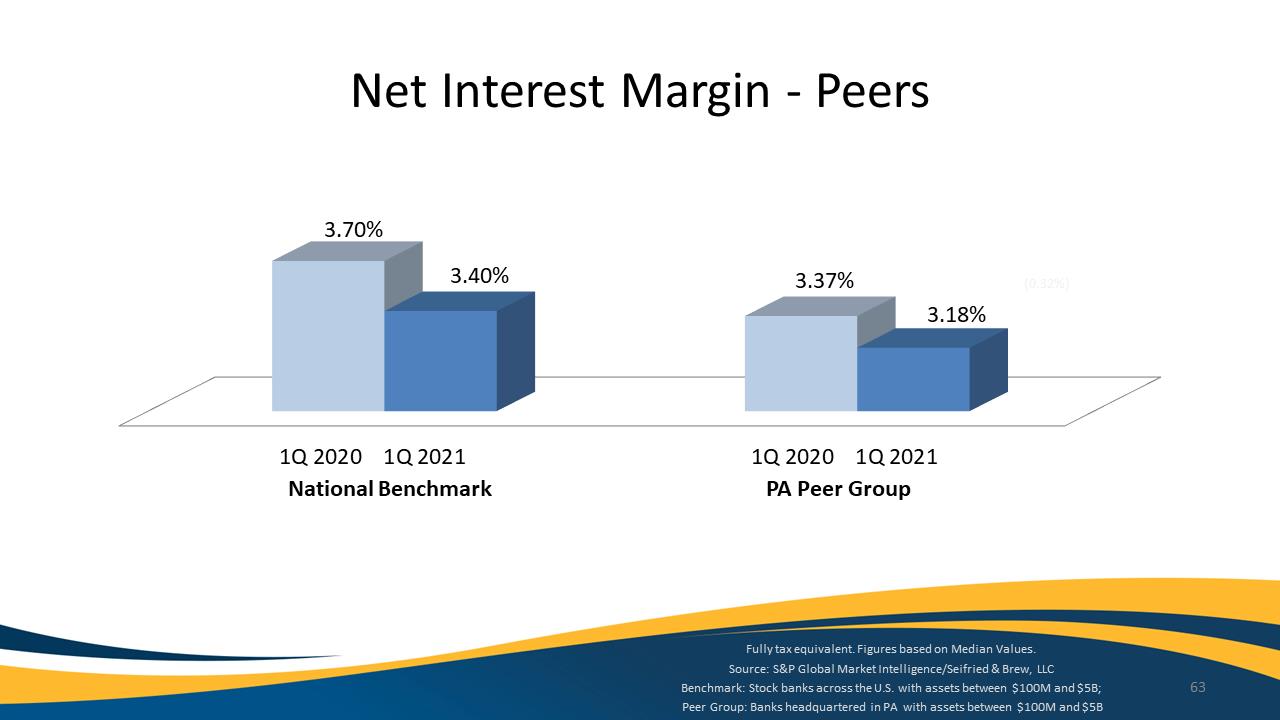
Net Interest Margin ‐ Peers 3.70% 3.40% 3.37% 3.18% (0.32%) 1Q 2020 1Q 2021 1Q 2020 1Q 2021 National Benchmark PA Peer Group
Fully tax equivalent. Figures based on Median Values.
Source: S&P Global Market Intelligence/Seifried & Brew, LLC
Benchmark: Stock banks across the U.S. with assets between $100M and $5B; 63
Peer Group: Banks headquartered in PA with assets between $100M and $5B
Exhibit 99.1
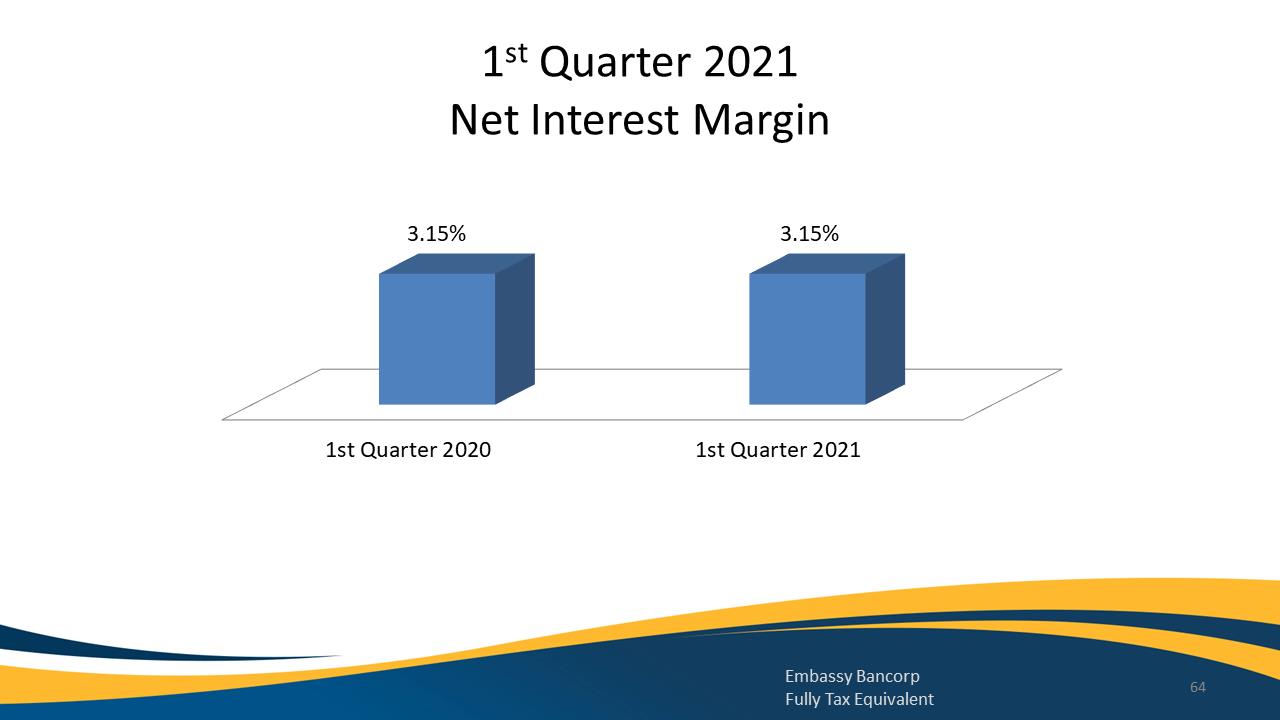
1st Quarter 2021 Net Interest Margin
3.15% 3.15%
1st Quarter 2020 1st Quarter 2021
Embassy Bancorp 64
Fully Tax Equivalent
Exhibit 99.1
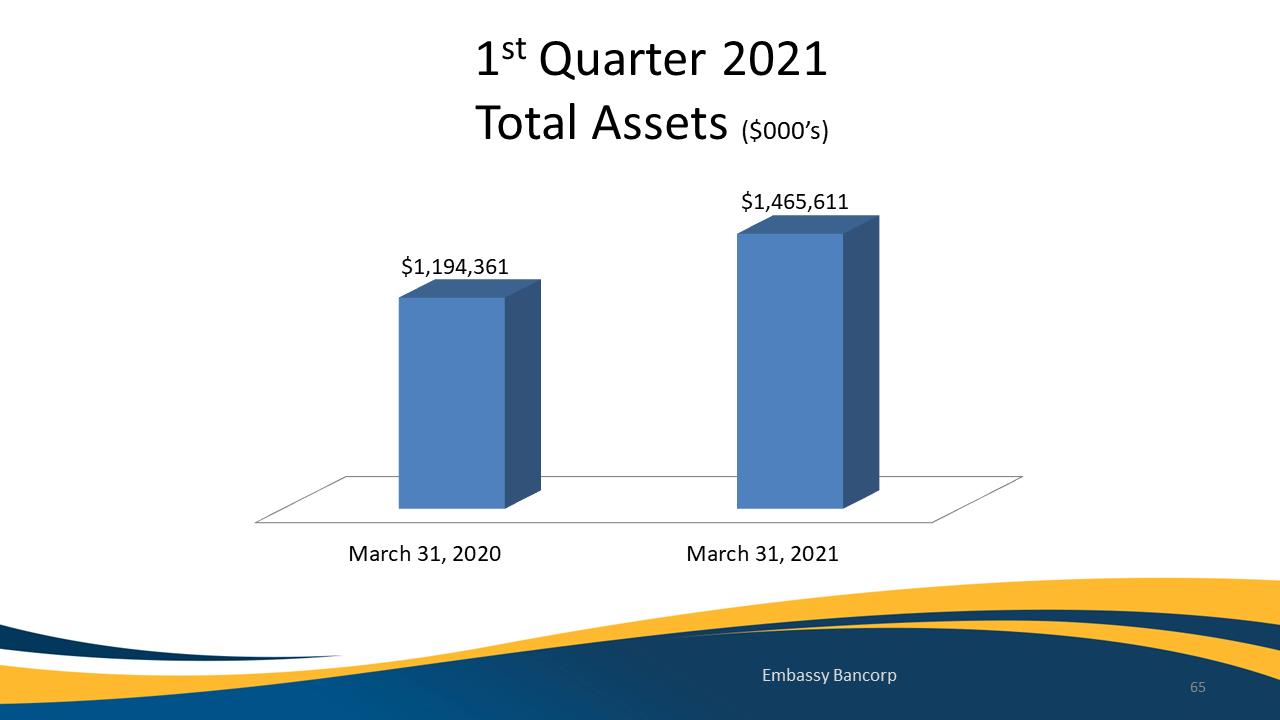
1st Quarter 2021 Total Assets ($000’s)
$1,465,611
$1,194,361
March 31, 2020 March 31, 2021
Embassy Bancorp
65
Exhibit 99.1
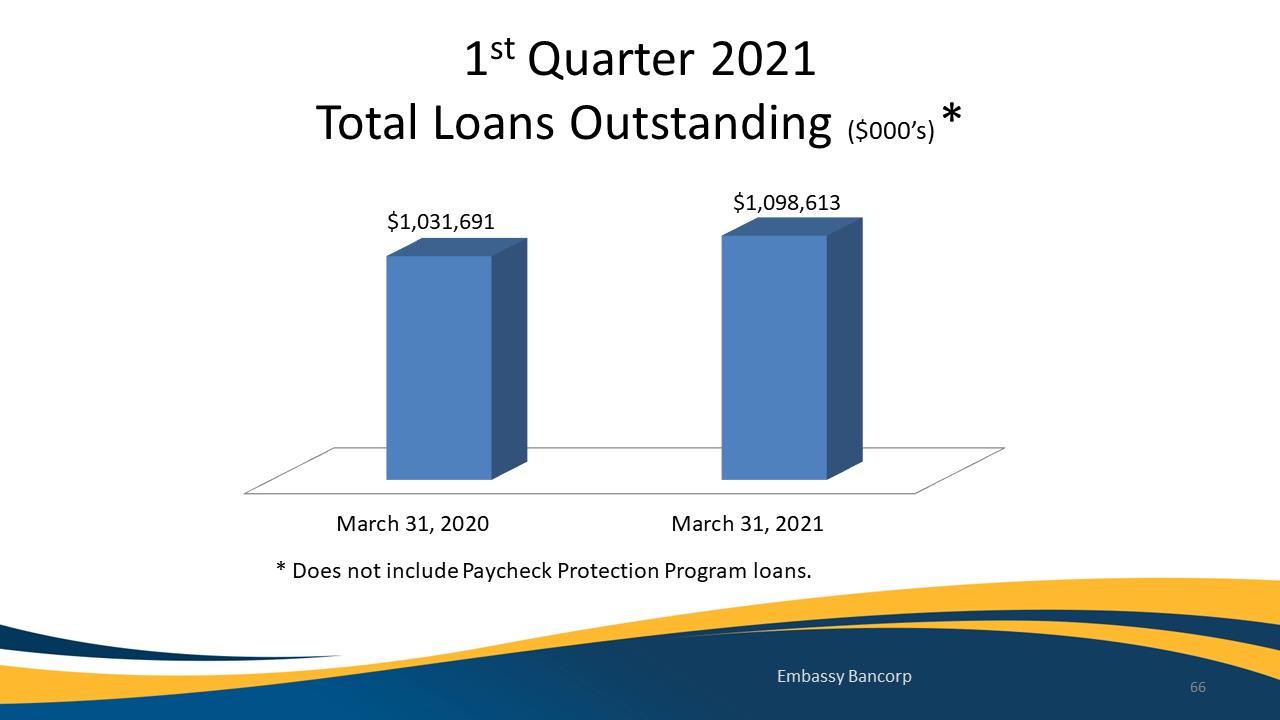
1st Quarter 2021
Total Loans Outstanding ($000’s) *
$1,031,691
$1,098,613
March 31, 2020 March 31, 2021
* Does not include Paycheck Protection Program loans.
Embassy Bancorp 66
Exhibit 99.1
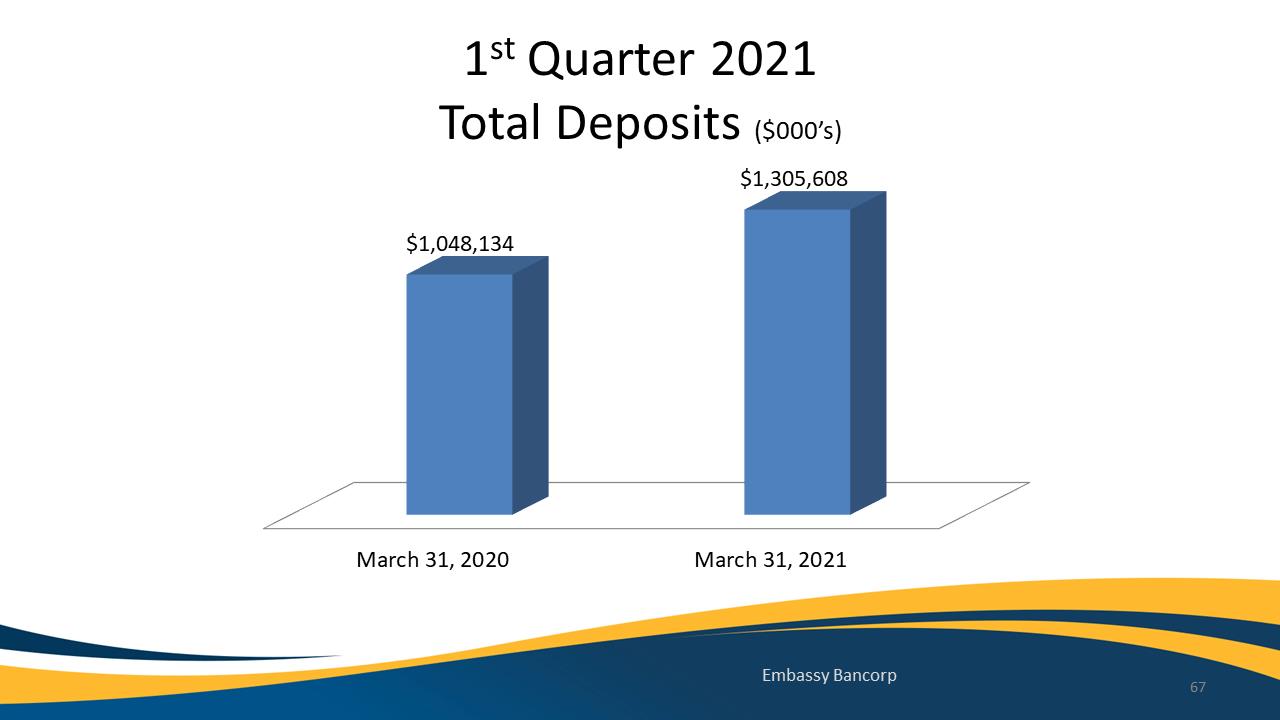
1st Quarter 2021 Total Deposits ($000’s)
$1,305,608
$1,048,134
March 31, 2020 March 31, 2021
Embassy Bancorp 67
Exhibit 99.1

Economic Update
‐ Jamie Sumner, Seifried & Brew LLC 68
Exhibit 99.1
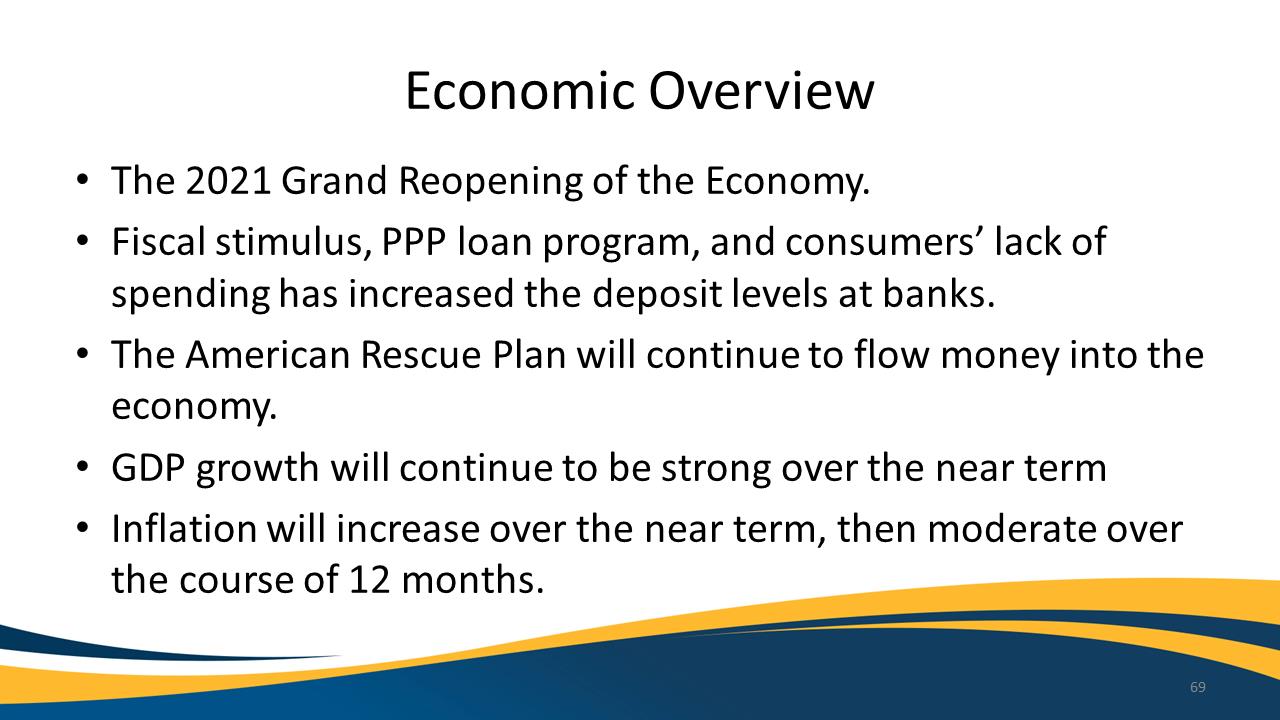
Economic Overview
The 2021 Grand Reopening of the Economy.
Fiscal stimulus, PPP loan program, and consumers’ lack of spending has increased the deposit levels at banks.
The American Rescue Plan will continue to flow money into the economy.
GDP growth will continue to be strong over the near term
Inflation will increase over the near term, then moderate over the course of 12 months.
Exhibit 99.1
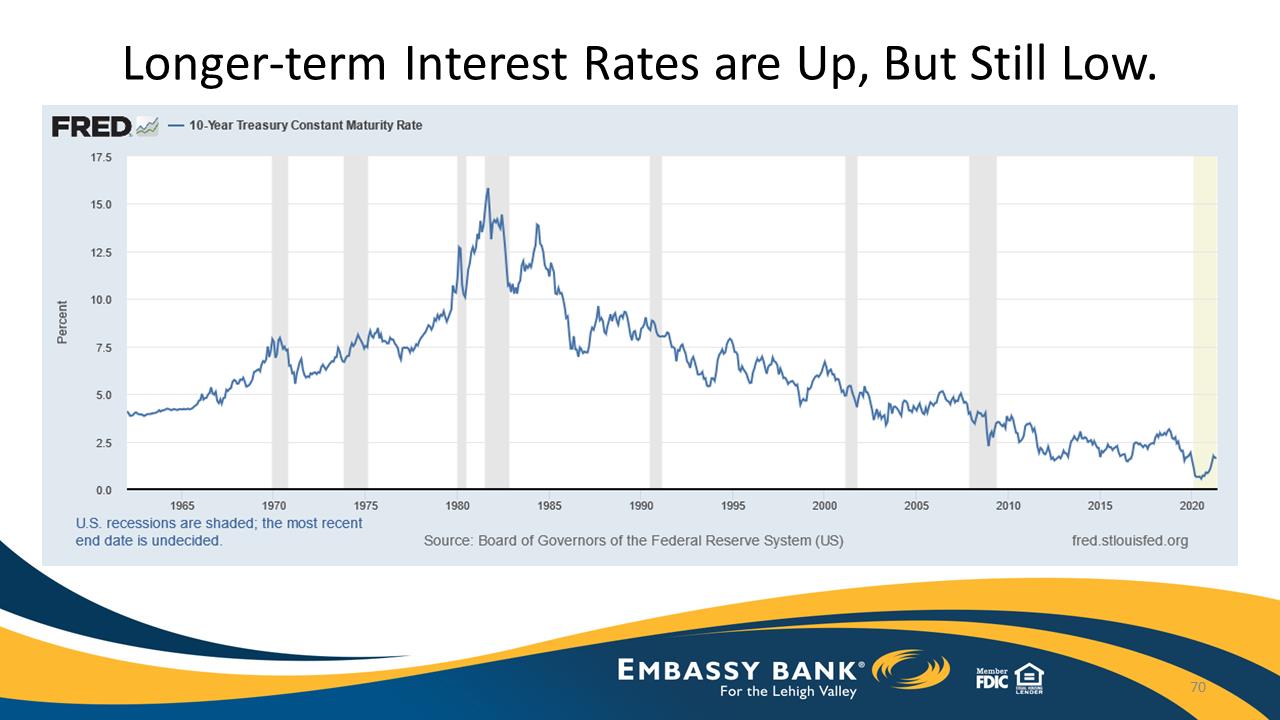
70Longer‐termInterestRatesareUp,ButStillLow.
17.5 15.0 12.5 10.0 7.5 5.0 2.5 0.0 1965 1970 1975 1980 1985 1990 1995 2000 2005 2010 2015 2020 FRED 10-Year Treasury Constant Maturity Rate Source: Board of Governors of the Federal Reserve System (US) fred.stlouisfed.org Embassy Bank for the Lehigh Valley Member FDIC Equal Housing Lender
Exhibit 99.1
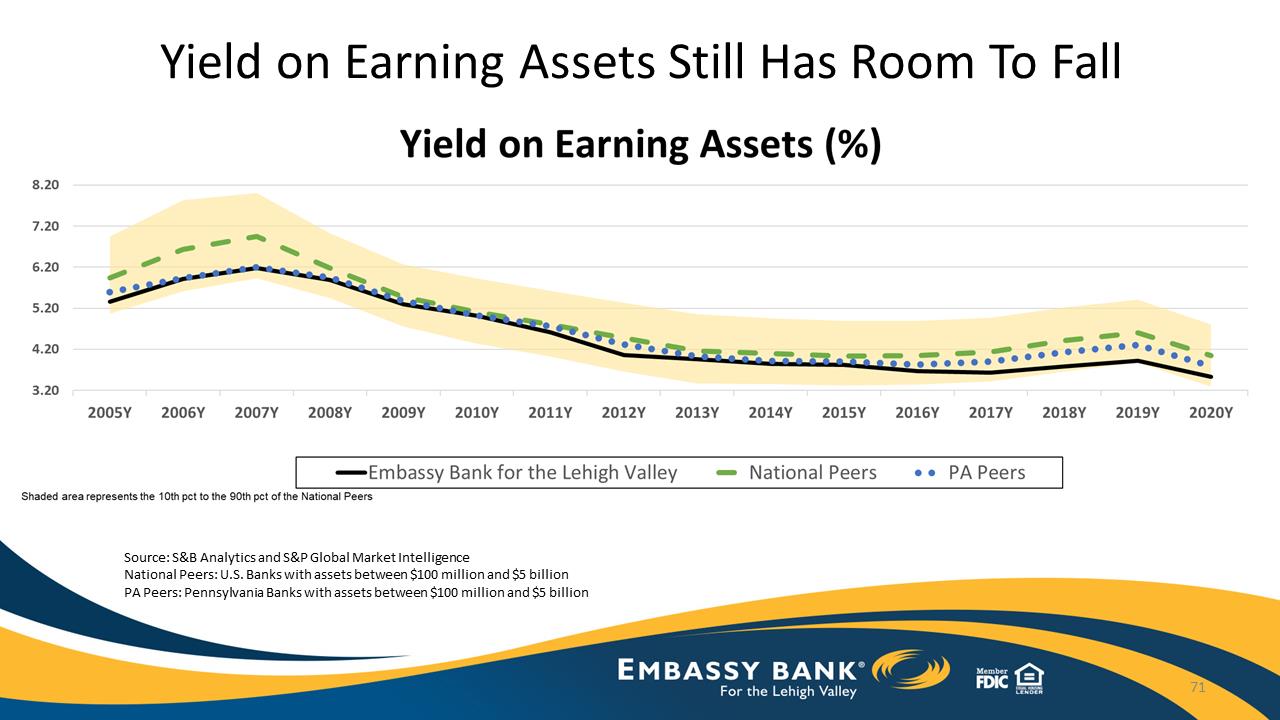
Exhibit 99.1
Yield on Earning Assets Still Has Room To Fall Source: S&B Analytics and S&P Global Market Intelligence National Peers: U.S. Banks with assets between $100 million and $5 billion
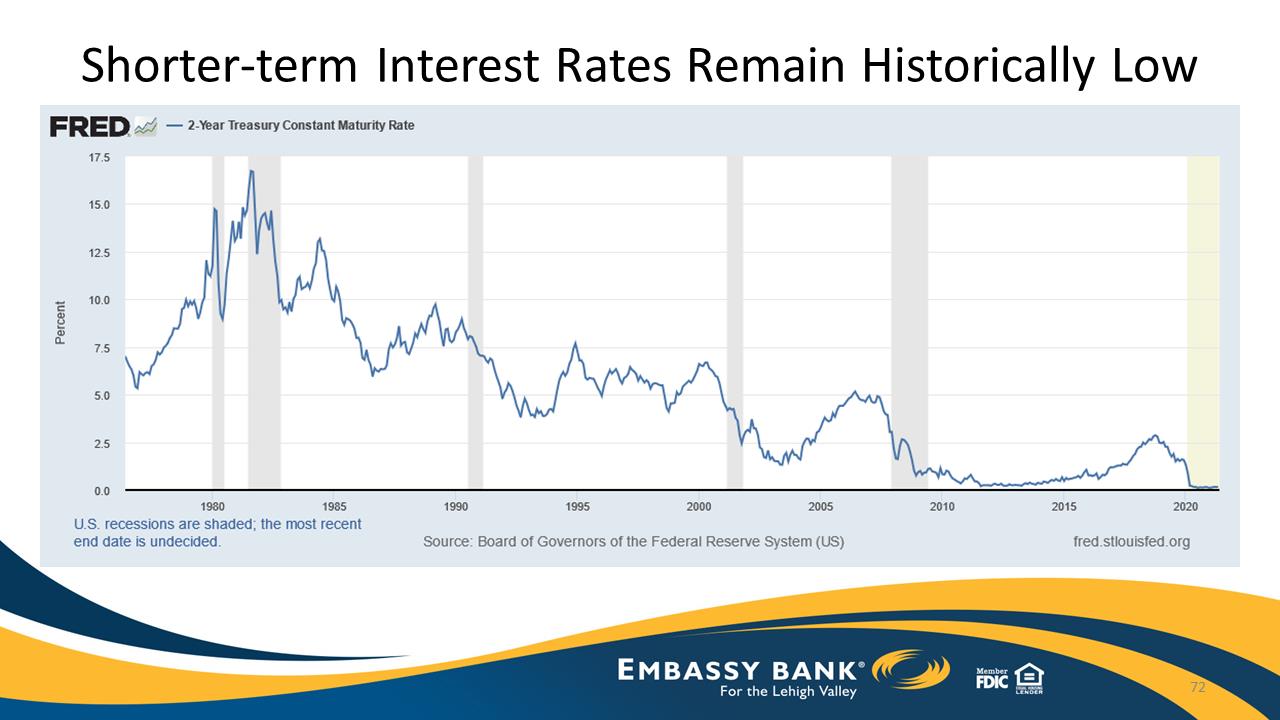
PA Peers: Pennsylvania Banks with assets between $100 million and $5 billion FRED 2-Year Treasury Constant Maturity Rate Percent 0.0 2.5 5.0 7.5 10.0 12.5 15.0 17.5 1980 1985 1990 1995 2000 2005 2010 2015 2020 U.S. recessions are shaded; the most recent date is undecided Source: Board of Governors of the Federal Reserve System (US) fred.stlouisfed.org embassy Bank for the Lehigh Valley member FDIC Equal Housing Lender. 72
Exhibit 99.1
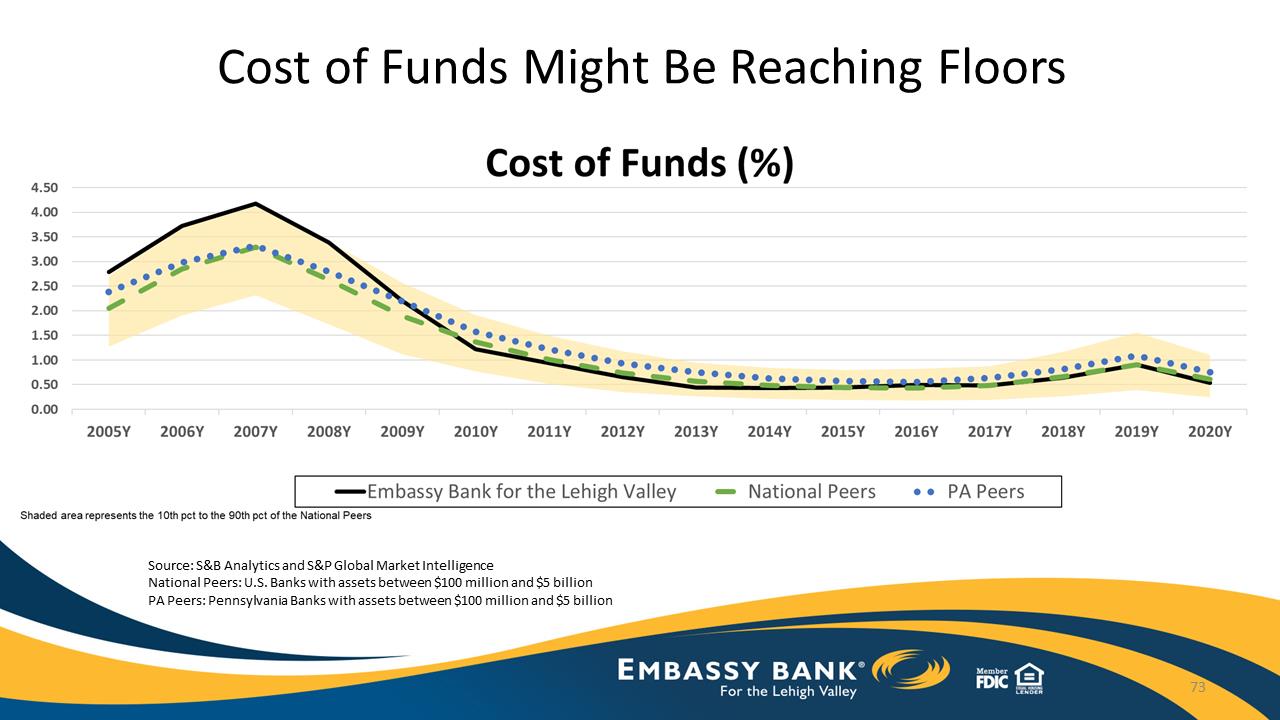
Cost of Funds Might Be Reaching Floors Source: S&B Analytics and S&P Global Market Intelligence National Peers: U.S. Banks with assets between $100 million and $5 billion PA Peers: Pennsylvania Banks with assets between $100 million and $5 billion Cost of Funds (%) 0.00 0.50 1.00 1.50 2.00 2.50 3.00 3.50 4.00 4.50 2005Y 2006Y 2007Y 2008Y 2009Y 2010Y 2011Y 2012Y 2013Y 2014Y 2015Y 2016Y 2017Y 2018Y 2019Y 2020Y Embassy Bank for the Lehigh Valley National Peers PA Peers Shaded area represents the 10th pct to the 90th pct of the National Peers Embassy Bank for the Lehigh Valley Member FDIC Equal Housing Lender.
Exhibit 99.1
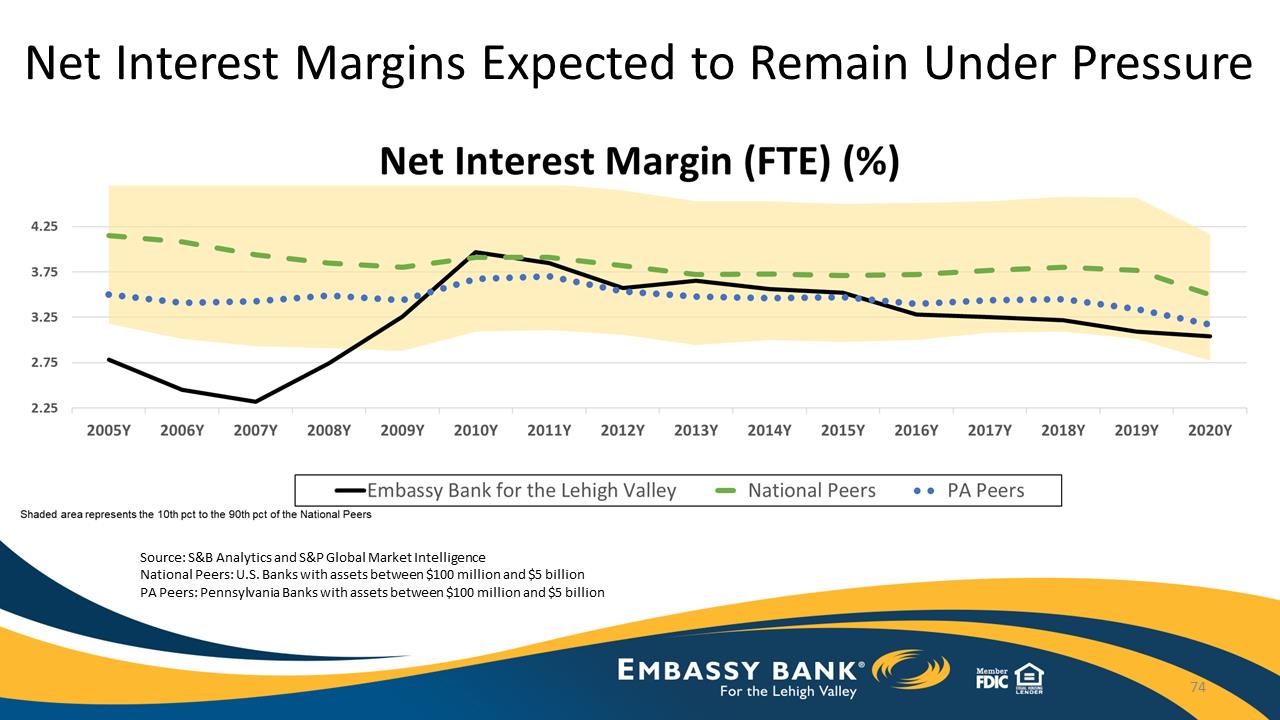
Net Interest Margins Expected to Remain Under Pressure Source: S&B Analytics and S&P Global Market Intelligence National Peers: U.S. Banks with assets between $100 million and $5 billion PA Peers: Pennsylvania Banks with assets between $100 million and $5 billion Net Interest Margin (FTE) (%) 2.25 2.75 3.25 3.75 4.25 2005Y 2006Y 2007Y 2008Y 2009Y 2010Y 2011Y 2012Y 2013Y 2014Y 2015Y 2016Y 2017Y 2018Y 2019Y 2020Y Embassy Bank for the Lehigh Valley Embassy Bank for the Lehigh Valley National Peers PA Peers member FDIC Equal Housing Lender
Exhibit 99.1
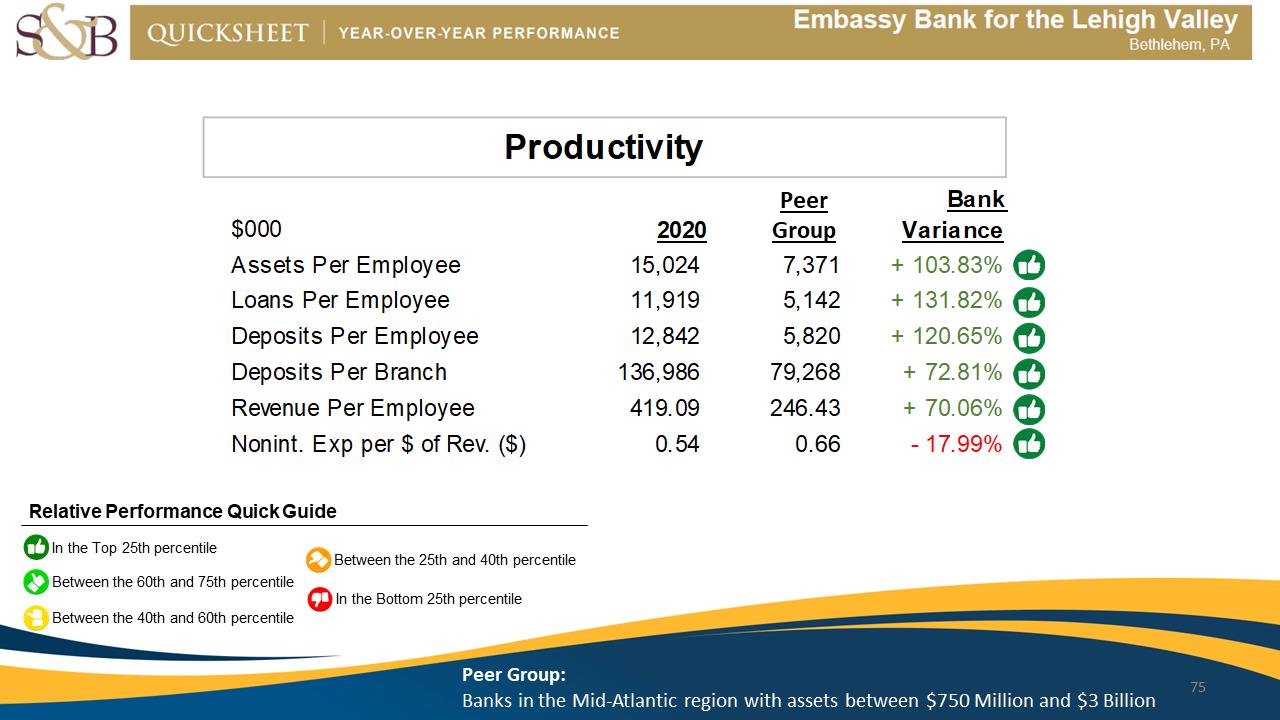
Productivity PeerGroup Bank $000 2020 Variance
Assets Per Employee 15,024 7,371 + 103.83%
Loans Per Employee 11,919 5,142 + 131.82%
Deposits Per Employee 12,842 5,820 + 120.65%
Deposits Per Branch 136,986 79,268 + 72.81%
Revenue Per Employee 419.09 246.43 + 70.06%
Nonint. Exp per $ of Rev. ($) 0.54 0.66 - 17.99%
Relative Performance Quick Guide In the Top 25th percentile Between the 25th and 40th percentile Between the 60th and 75th percentile In the Bottom 25th percentile Between the 40th and 60th percentile Peer Group: Banks in the Mid‐Atlantic region with assets between $750 Million and $Billion 75 S&B Quicksheet Year-Over-Year Performance Embassy Bank for the Lehigh Valley Bethlehem, PA
Exhibit 99.1
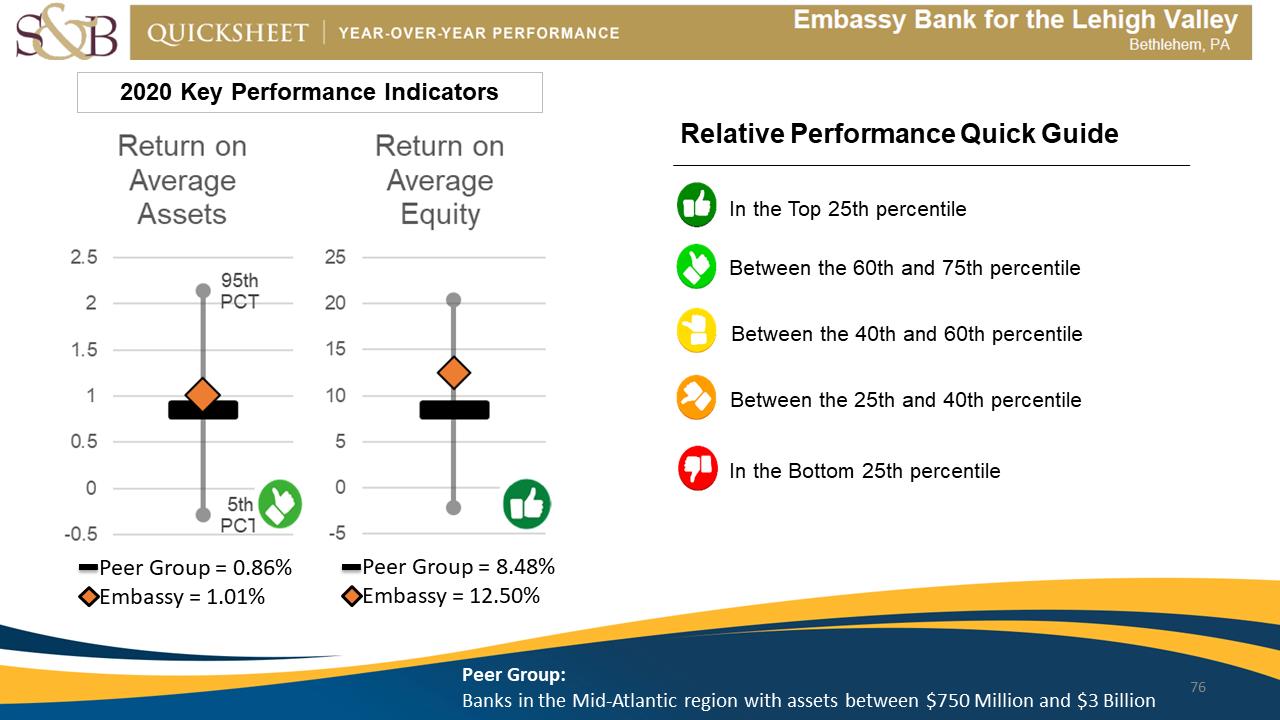
2020 Key Performance Indicators Relative Performance Quick Guide In the Top 25th percentile Between the 60th and 75th percentile Between the 40th and 60th percentile Between the 25th and 40th percentile In the Bottom 25th percentile Peer Group = 8.48% Embassy = 1.01% Peer Group = 0.86% Embassy = 12.50% Peer Group: Banks in the Mid‐Atlantic region with
assets between $750 Million and $Billion Return on Average Asset Return on Average Equity 2.5 2 1.5 1 0.5 0 -0.5 95th PCT 5th PCT 25 20 15 10 5 0 -5 76 S&B Quicksheet Year-Over-Year Performance Embassy Bank for the Lehigh Valley Bethlehem, PA
Exhibit 99.1
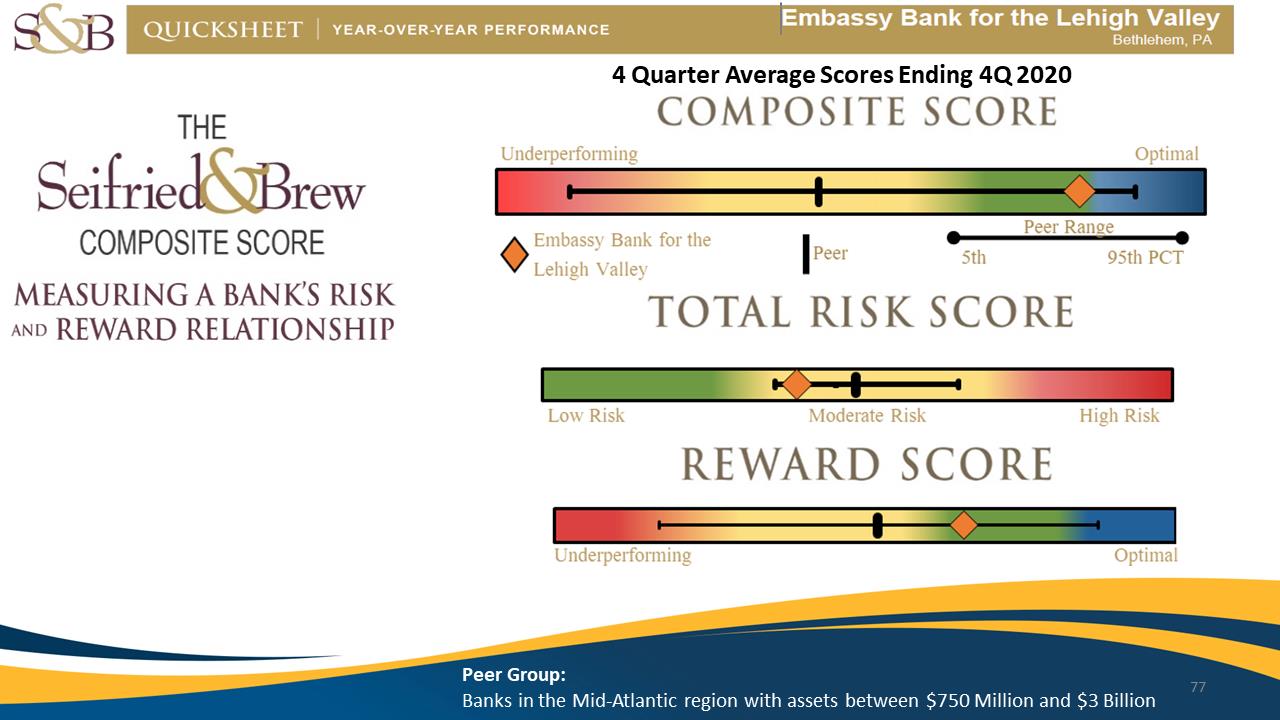
77PeerGroup:
BanksintheMid‐Atlanticregionwithassetsbetween$750Millionand$3Billion4QuarterAverageScoresEnding4Q2020 The Seifried & Brew Composite Score Measuring a Bank’s Risk and Reward Relationship 4 Quarter Average Scores Ending 4Q 2020 Composite Score Underperforming Optimal Embassy Bank for the Leigh Valley Peer Peer Range 5th 95th PCT Total Risk Score Low Risk Moderate Risk High Risk Reward Score Underperforming Optimal.
Exhibit 99.1

ShareholderValue‐DaveLobach78
Exhibit 99.1
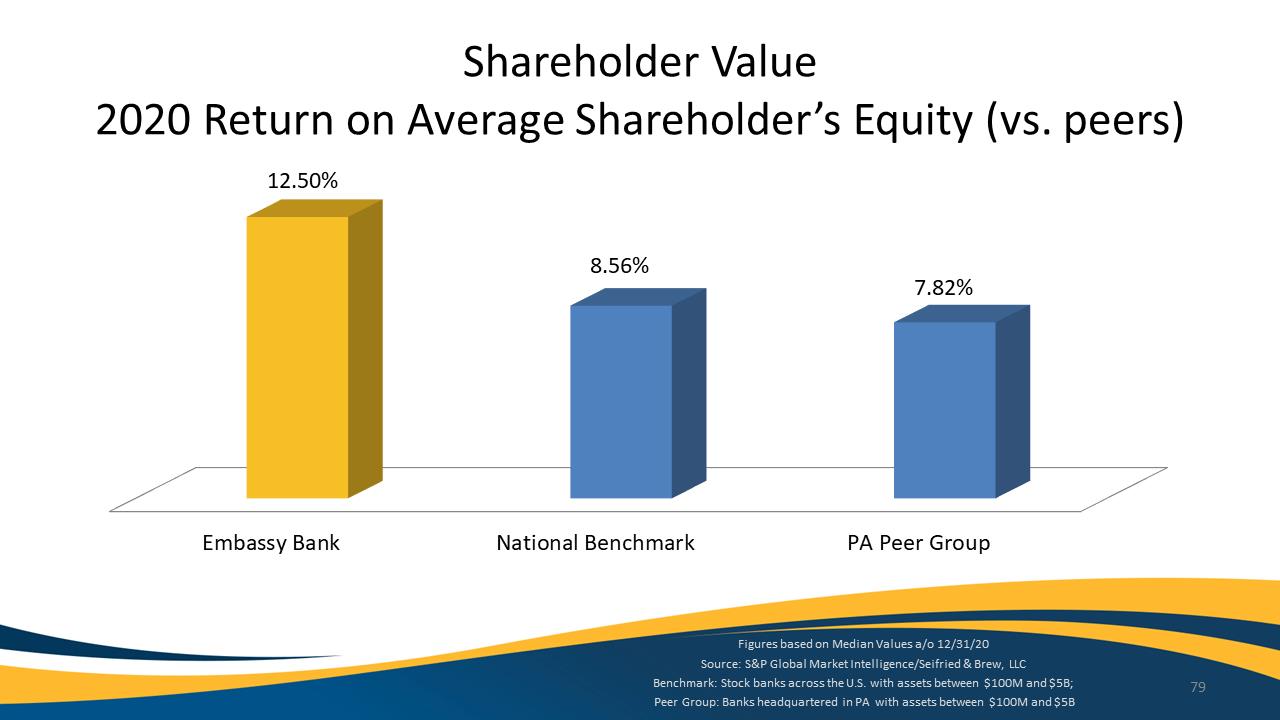
ShareholderValue2020ReturnonAverageShareholder’sEquity(vs.peers)12.50%8.56%7.82%Embassy Bank National Benchmark PA Peer Group Figures based on Median Values a/o 12/31/20 Source: S&P Global Market Intelligence/Seifried & Brew, LLC Benchmark: Stock banks across the U.S. with assets between $100M and $5B; 79
Exhibit 99.1
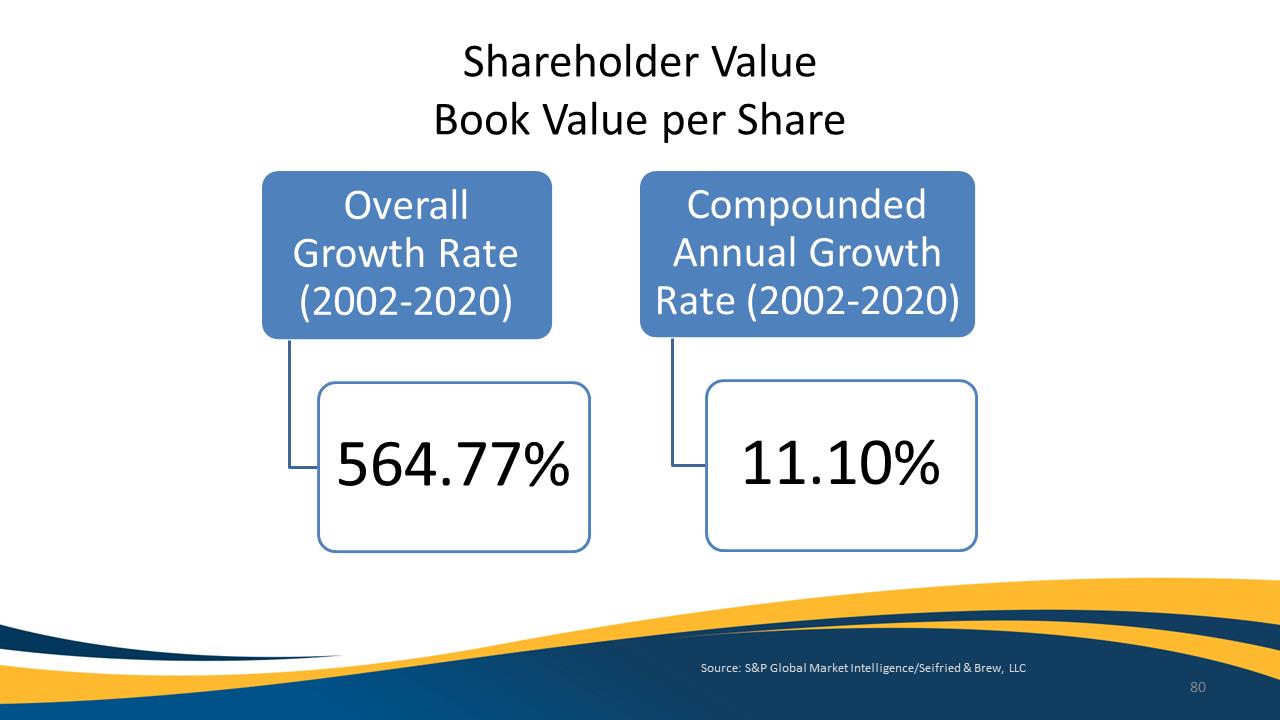
Shareholder
Value
Book
Value
per
Share
OverallGrowthRate(2002‐2020)
564.77%
CompoundedAnnualGrowthRate(2002‐2020)
11.10%
Source:S&PGlobalMarketIntelligence/Seifried&Brew,LLC80
Exhibit 99.1
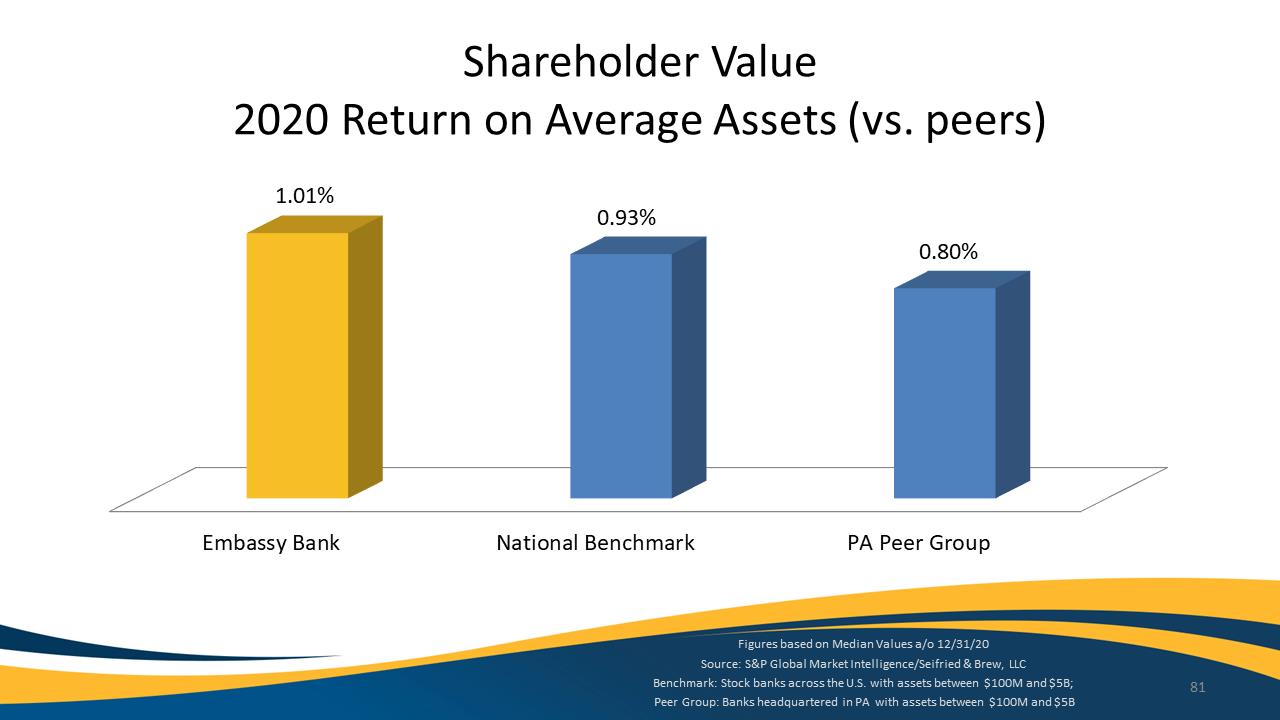
ShareholderValue2020ReturnonAverageAssets(vs.peers)1.01% 0.93%0.80%Embassy Bank National Benchmark PA Peer Group Figures based on Median Values a/o 12/31/20 Source: S&P Global Market Intelligence/Seifried & Brew, LLC Benchmark: Stock banks across the U.S. with assets between $100M and $5B; 81
Exhibit 99.1
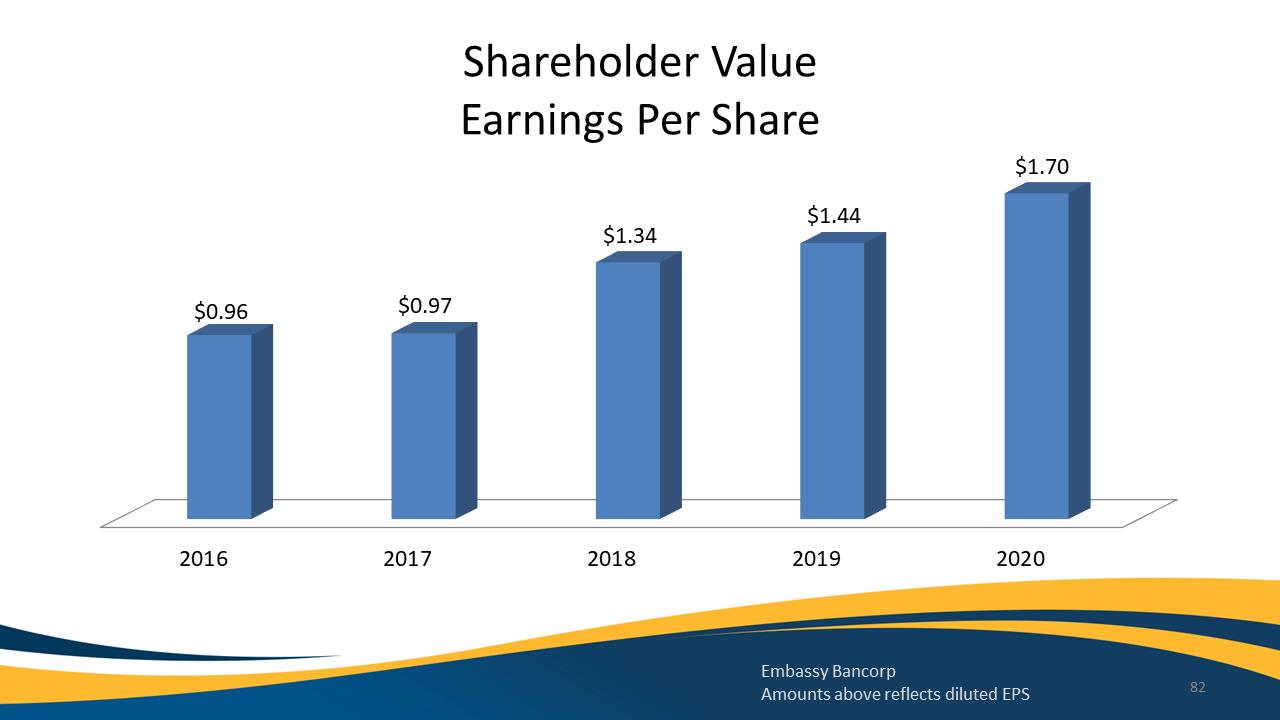
ShareholderValueEarningsPerShare20162017201820192020$0.96$0.97$1.34$1.44$1.70EmbassyBancorpAmountsabovereflectsdilutedEPS82ShareholderValueEarningsPerShare20162017201820192020$0.96$0.97$1.34$1.44$1.70EmbassyBancorpAmountsabovereflectsdilutedEPS82
Exhibit 99.1
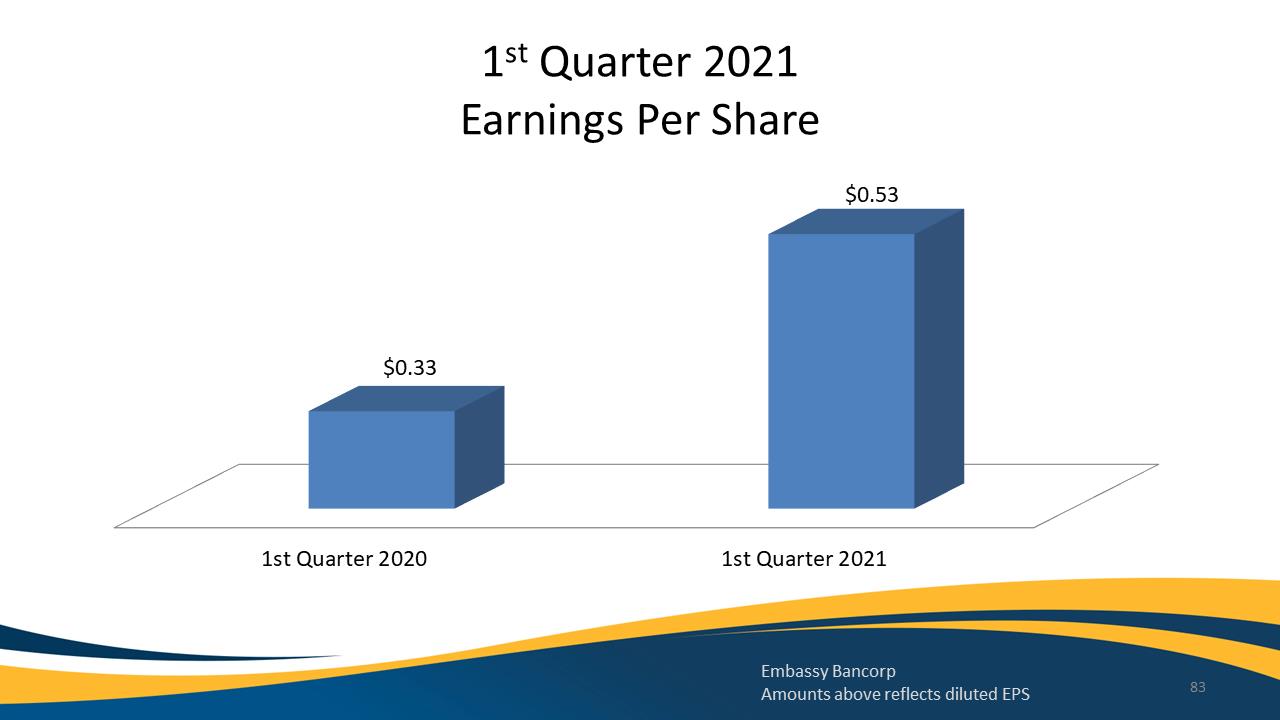
1stQuarter2021EarningsPerShare1stQuarter20201stQuarter2021$0.33$0.53EmbassyBancorpAmountsabovereflectsdilutedEPS831stQuarter2021EarningsPerShare1stQuarter20201stQuarter2021$0.33$0.53EmbassyBancorpAmountsabovereflectsdilutedEPS83
Exhibit 99.1
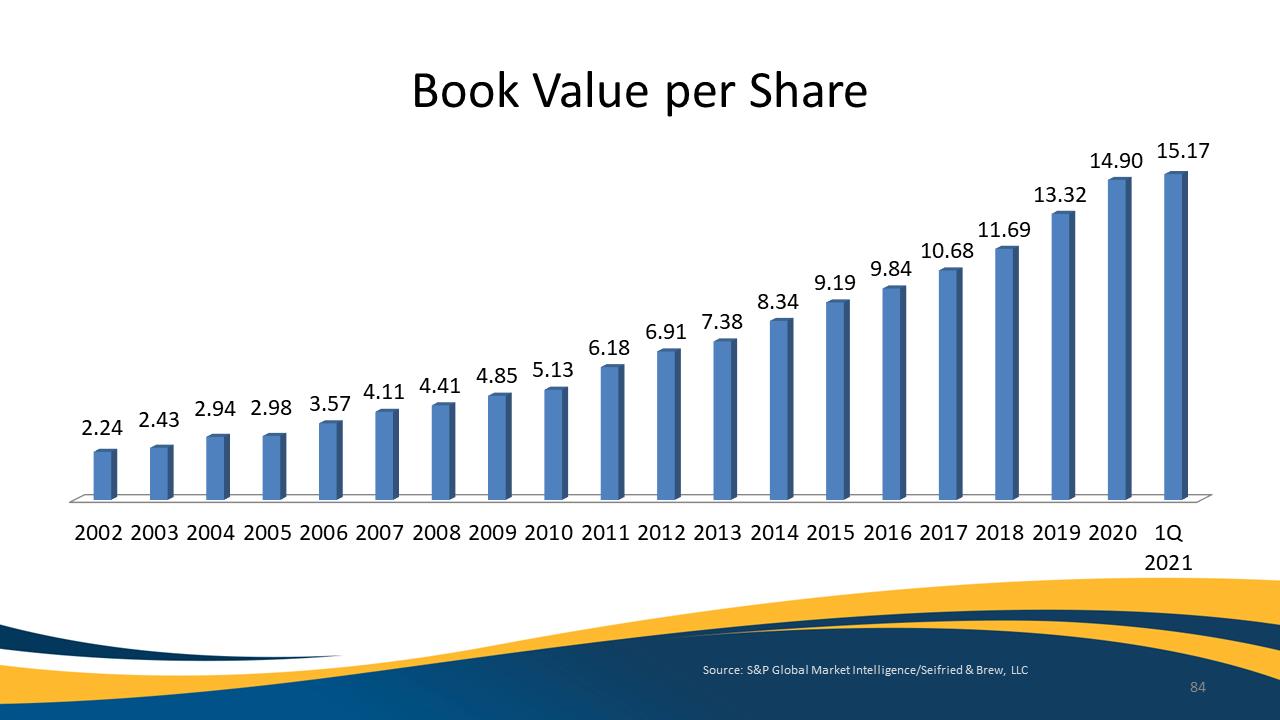
2.242.43 2.94 2.98 3.57Book Value per Share 6.91 7.38 6.18 4.11 4.41 4.85 5.13 10.68 11.69 13.32 14.90 15.17 2002 2003 2004 2005 2006 2007 2008 2009 2010 2011 2012 2013 2014 2015 2016 2017 2018 2019 2020 1Q 2021
Source: S&P Global Market Intelligence/Seifried & Brew, LLC
84
Exhibit 99.1
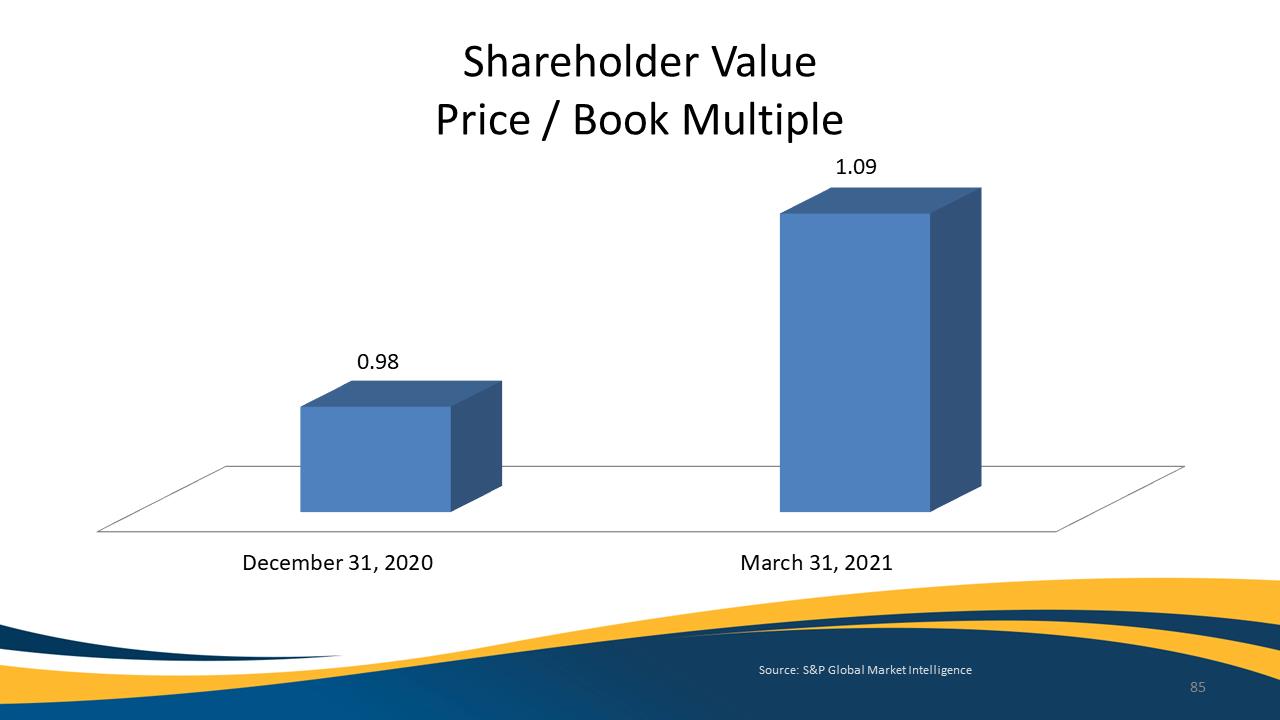
Shareholder Value
Price / Book Multiple
1.09
0.98
December 31, 2020 March 31, 2021
Source: S&P Global Market Intelligence
85
Exhibit 99.1
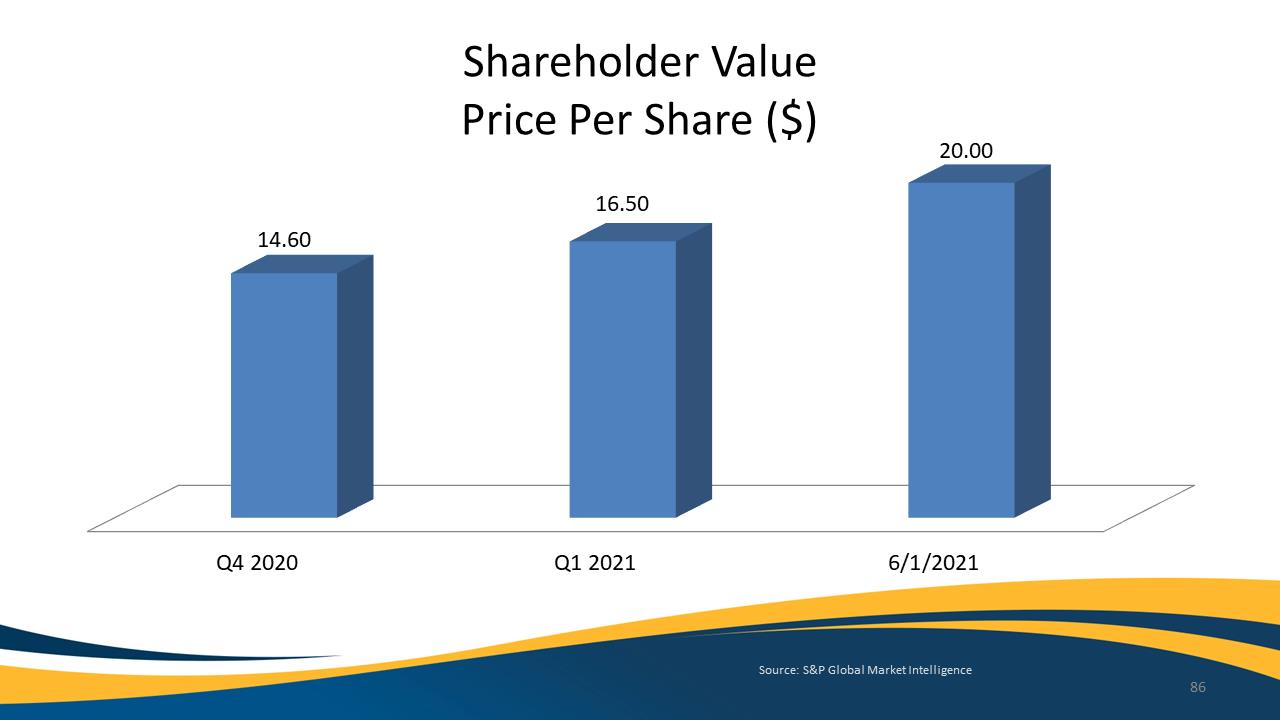
Shareholder Value Price Per Share ($) 20.00 16.50 14.60 Q4 2020 Q1 2021 6/1/2021
Source: S&P Global Market Intelligence
86
Exhibit 99.1
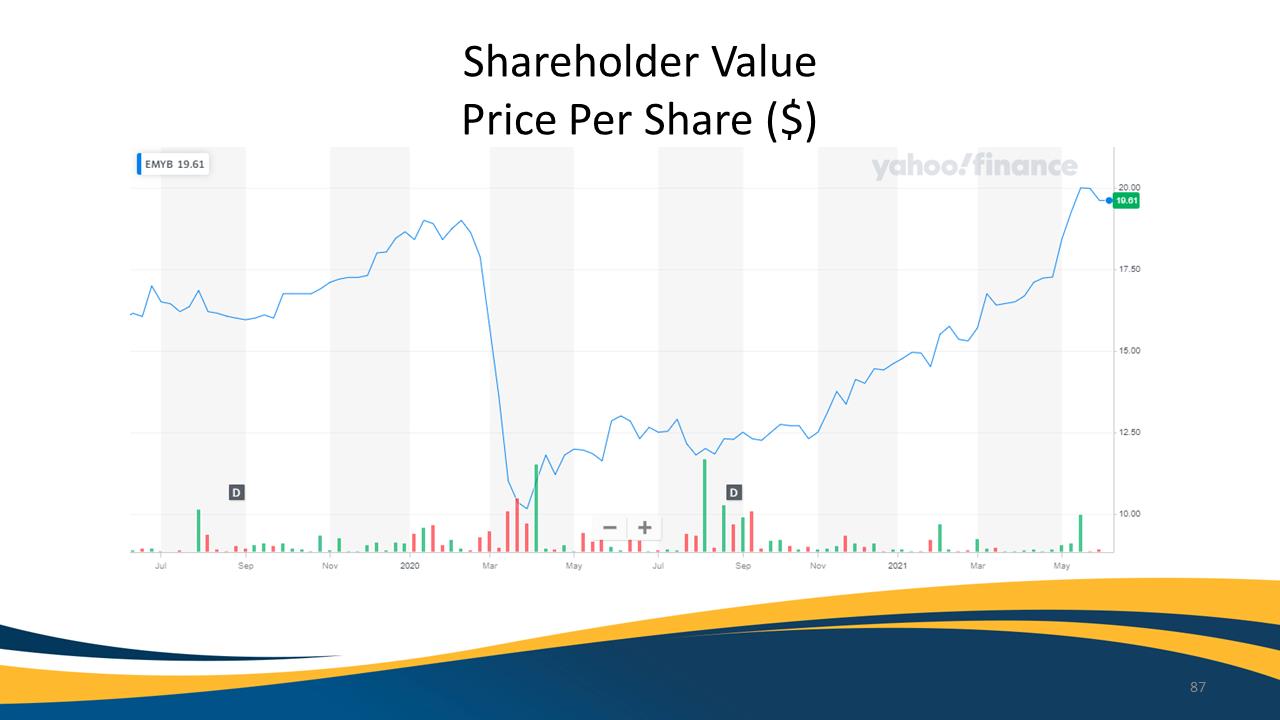
Shareholder Value Price Per Share ($) EMYB 19.61 Jul Sep Nov 2020 Mar May Jul Sep D D Nov 2021 Mar May 20.00 19.61 17.50 15.00 12.50 10.00 87
Exhibit 99.1
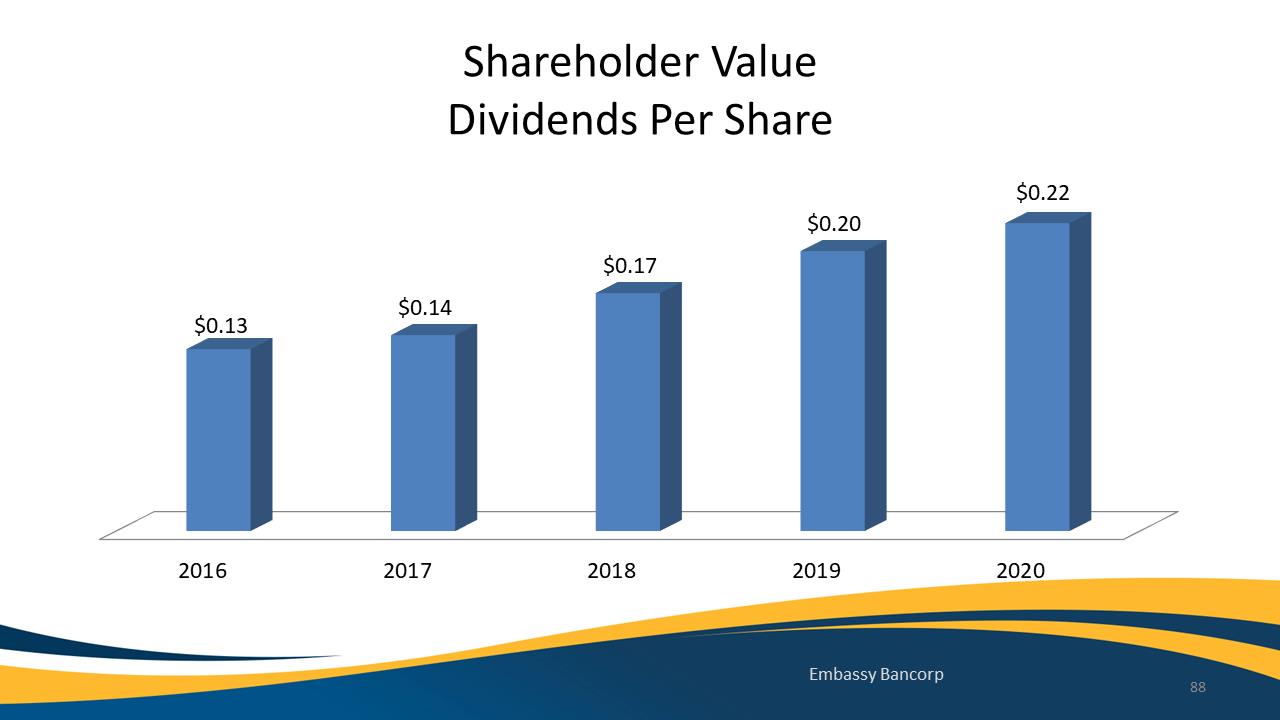
Shareholder Value Dividends Per Share $0.13 $0.14 $0.17 $0.20 $0.22 2016 2017 2018 2019 2020
Embassy Bancorp
88
Exhibit 99.1
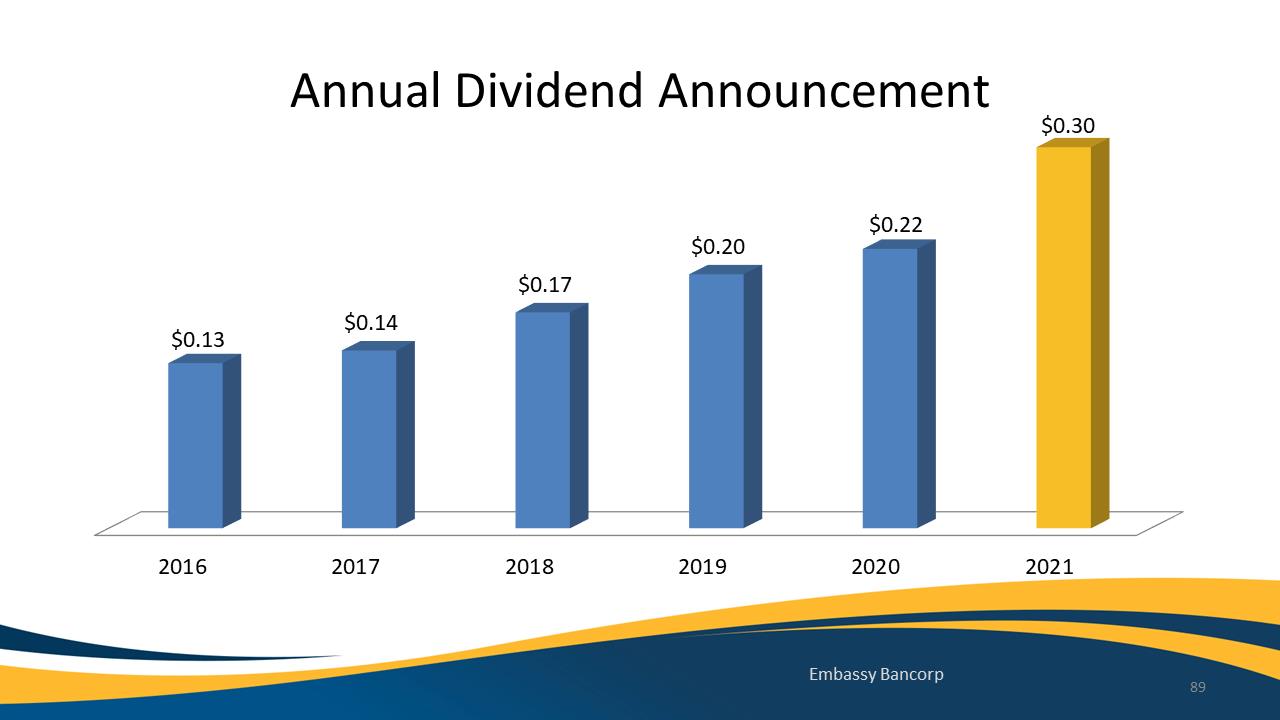
Annual Dividend Announcement 2016 2017 2018 2019 2020 2021 $0.13 $0.14 $0.17 $0.20 $0.22 $0.30 EmbassyBancorp 89
Exhibit 99.1

Our 20th Anniversary 90 Better Days. Straight Ahead.
Exhibit 99.1

Better Days. Straight Ahead. Embassy Bank Member FDIC Equal Housing Lender 91
Exhibit 99.1
Closing Items• Q&A• Results of Voting• Conclusion of Meeting 92
Exhibit 99.1

93 Thank You From Our Board of Directors! Embassy Bank For the Lehigh Valley