Attached files
| file | filename |
|---|---|
| 8-K - 8-K - SmartStop Self Storage REIT, Inc. | d414549d8k.htm |
Exhibit 99.1
Financial Supplement | Q4 2020
Table of Contents Portfolio Snapshot at 12/31/20 3 About SmartStop Self Storage REIT, Inc 4 Earnings Release5. Financial Highlights15 Trailing Five Quarter Financials: Balance Sheet16 Trailing Five Quarter Financials: Income Statement17 Trailing Five Quarter Financials: FFO Reconciliation18 Store Portfolio Reporting Information19 Same-Store Portfolio Details20 Same-Store Portfolio MSA Performance Summary21 Total Portfolio MSA Performance Summary22 Debt Summary23 Reconciliation of Net Loss to Net Operating Income: Trailing 5 Quarters & FY202024 Reconciliation of Same-Store Revenue and Net Operating Income25 Forward Looking Statements26
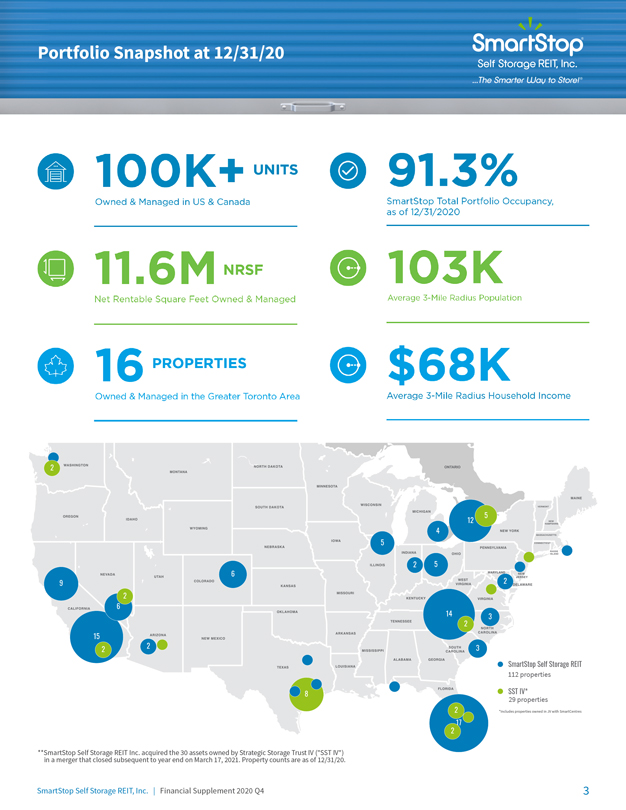
Portfolio Snapshot at 12/31/20 2 5 12 4 5 6 2 5 9 2 2 6 14 13 3 2 15 2 2 3 SmartStop Self Storage REIT 112 properties 8 SST IV* 29 properties 2 *Includes properties owned in JV with SmartCentres 17 2 **SmartStop in a merger Self that Storage closed subsequent REIT Inc. acquired to year the end 30 on assets March owned 17, 2021 by .Strategic Property Storage counts are Trust as IV of (“SST 12/31/20 IV”). SmartStop Self Storage REIT, Inc. | Financial Supplement 2020 Q4 3
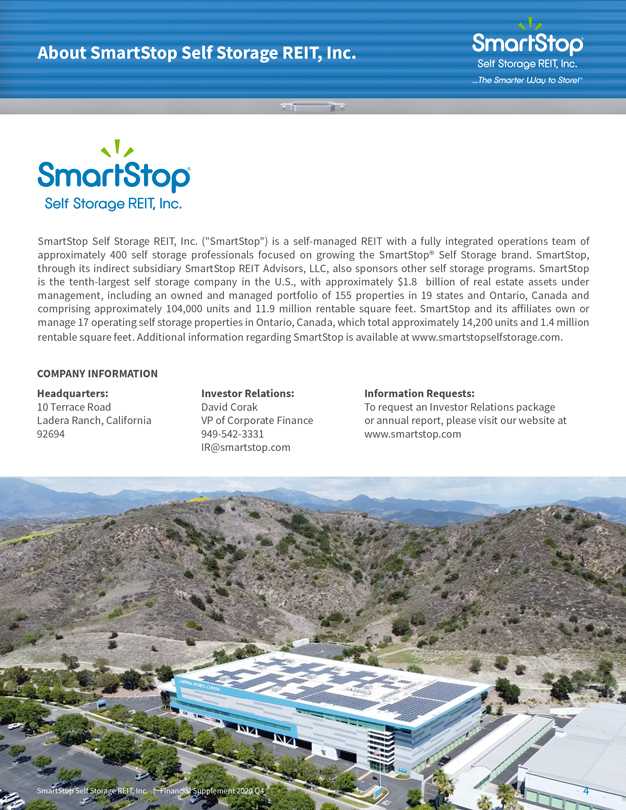
SmartStop Self Storage REIT, Inc. (“SmartStop”) is a self-managed REIT with a fully integrated operations team of approximately 400 self storage professionals focused on growing the SmartStop® Self Storage brand. SmartStop, through its indirect subsidiary SmartStop REIT Advisors, LLC, also sponsors other self storage programs. SmartStop is the tenth-largest self storage company in the U.S., with approximately $1.8 billion of real estate assets under management, including an owned and managed portfolio of 155 properties in 19 states and Ontario, Canada and comprising approximately 104,000 units and 11.9 million rentable square feet. SmartStop and its affiliates own or manage 17 operating self storage properties in Ontario, Canada, which total approximately 14,200 units and 1.4 million rentable square feet. Additional information regarding SmartStop is available at www.smartstopselfstorage.com. COMPANY INFORMATION Headquarters: Investor Relations: Information Requests: 10 Terrace Road David Corak To request an Investor Relations package Ladera Ranch, California VP of Corporate Finance or annual report, please visit our website at 92694 949-542-3331 www.smartstop.com IR@smartstop.com SmartStop Self Storage REIT, Inc. | Financial Supplement 2020 Q4 4
Earnings Release March 30, 2021 SmartStop Self Storage REIT, Inc. Reports 2020 Full Year Results LADERA RANCH, CA – March 30, 2021 – SmartStop Self Storage REIT, Inc. (“SmartStop”), a self-managed and fully-integrated self storage company with approximately $1.7 billion of self storage assets under management, announced its overall results for twelve months ended December 31, 2020. “SmartStop posted another strong year with FFO, as adjusted growth of 91% over the prior year as well as best-in-class same-store revenue and NOI growth as compared to our publicly traded peers,” said H. Michael Schwartz, Executive Chairman of SmartStop. “The power of the SmartStop® Self Storage platform was on full display this year, substantiating the investments we’ve made in the platform as well as the fantastic team that’s worked tirelessly to build our company. While 2020 was one of the most unprecedented years that our sector has seen, the current operating environment reinforces the resilient nature of our industry and portfolio. We believe the company is well positioned to deliver strong risk-adjusted returns and grow stockholder value in 2021 and beyond.” Twelve Months Ended December 31, 2020 Financial Highlights: Total self storage-related revenues increased by approximately $7.0 million, or 6.8%, when compared to the same period in 2019. FFO, as adjusted, increased by approximately $5.2 million, or 91%, when compared to the same period in 2019. Same-store revenues increased by 3.6% compared to the same period in 2019. Same-store NOI increased by 7.8% compared to the same period in 2019. Same-store average physical occupancy increased by 2.0% to 90.6% for the twelve months ended December 31, 2020, compared to 88.6% during the same period in 2019. Same-store annualized revenue per occupied square foot was approximately $16.18 for the twelve months ended December 31, 2020, which represented an increase of approximately 1.1% when compared to the same period in 2019. Managed REIT Platform revenue of approximately $8.0 million for the twelve months ended December 31, 2020, up significantly from $3.1 million during the same period in 2019. “In addition to our strong operating performance, on March 17, 2021, we executed on a strategic transaction to drive further growth and scalability, by closing the merger with Strategic Storage Trust IV, Inc. (“SST IV”),” continued Mr. Schwartz. “We are excited to welcome SST IV stockholders in a merger that allows us to recognize expense efficiencies and reduce borrowing costs, among other benefits, and better positions the combined company to execute on future growth plans. Additionally, in tandem with the closing of the merger, we secured a new $500 million credit facility, which was primarily used to refinance existing debt of both SmartStop and SST IV at significantly more attractive rates. This facility allows us to continue to execute our growth strategy utilizing a lower cost of debt capital, helping us drive stockholder returns going forward.” Closed the All-Stock Acquisition of Strategic Storage Trust IV, Inc. On March 17, 2021, SmartStop and SST IV announced that the companies closed a merger in which SST IV merged into a subsidiary of SmartStop, in an all-stock transaction with a value of approximately $380 million (which includes outstanding debt of SST IV assumed or repaid but excludes transaction costs) (the “Merger”). The Merger positions the combined company to achieve further economies of scale and drive incremental growth as it takes advantage of the benefits of a larger SmartStop Self Storage REIT, Inc. | Financial Supplement 2020 Q4 5
Earnings Release (Continued) aggregate portfolio. As a result of the Merger, SmartStop acquired all of the real estate owned by SST IV, consisting of 24 wholly-owned self storage facilities located across nine states and six joint venture properties located in the Greater Toronto Area of Ontario, Canada. The total SST IV portfolio, including joint venture property estimates at completion of development, represents approximately 22,500 self storage units and 2.6 million net rentable square feet. The resulting consolidated portfolio consists of 136 wholly-owned properties and six joint venture properties with a combined gross book value of approximately $1.5 billion of self storage assets. Closed a $500 Million Multi-Currency Credit Facility On March 17, 2021, SmartStop announced that it entered into a multi-currency credit facility (the “Credit Facility”) of up to $500 million with a syndicate of banks led by KeyBank National Association, Wells Fargo, N.A., Citibank, N.A. and Bank of Montreal. The facility consists of a $250 million revolving credit facility (the “Revolver”) and a $250 million term loan (the “Term Loan”), and has an accordion feature permitting expansion of the Credit Facility up to $850 million, subject to certain conditions. The Revolver has a three-year term with a maturity date of March 17, 2024 and a one-year extension option. The Term Loan has a five-year term with a maturity date of March 17, 2026. Borrowings under the Credit Facility may be in either U.S. dollars or Canadian dollars at SmartStop’s election. Initial advances under the Term Loan bear interest at 195 basis points over 30-day LIBOR or 30-day CDOR, while initial advances under the Revolver bear interest at 200 basis points over 30-day LIBOR or 30-day CDOR. The Credit Facility is initially secured by a pledge of equity interests in certain of SmartStop’s property owning subsidiaries. SmartStop can elect to release the pledges upon the achievement of certain financial conditions, making the Credit Facility fully unsecured and resulting in a reduction in the applicable interest rate, among other changes. Issuance of Series A Preferred Stock On October 26, 2020, SmartStop exercised its option to issue an additional 50,000 shares of Series A Preferred Stock to Extra Space Storage LP, a subsidiary of Extra Space Storage Inc. (NYSE: EXR), pursuant to a preferred stock purchase agreement between SmartStop and Extra Space Storage LP announced in October of 2019. The proceeds from the $50 million issuance were used to pay down existing debt, finance self storage acquisitions, and for working capital or other general corporate purposes. COVID-19 Update SmartStop continues to operate its stores with safety and social distancing procedures in place, including the use of masks and plastic dividers. Additionally, SmartStop’s corporate headquarters and dedicated call center continue to meet the needs of the business while working remotely. Many of the challenges associated with the COVID-19 pandemic in the second quarter of 2020 subsided. In fact, certain trends such as the broader shift of people working from home, migration patterns away from dense urban markets, and strength in the housing market helped drive the growth in self storage demand in the second half of 2020. SmartStop’s rental activity during the fourth quarter was strong, existing customer rate increases resumed in most markets, customer collections remained relatively consistent, and asking rates to new customers continued to improve on a year-over-year basis. Below is a summary of the business indicators, drivers, and metrics which were impacted by the COVID-19 pandemic: Resumed existing customer rate increases on a modified basis beginning July 2020 and through the third and fourth quarters of 2020, after pausing rate increases for our existing customers during second quarter 2020; A reduction in late fees during full year 2020 of approximately 19% on a same-store basis as compared to full year 2019, an improvement from second quarter 2020, in which quarterly same-store late fees declined 35% year-over-year; Same-store move-ins increased approximately 6% during full year 2020 as compared to full year 2019, an improvement from the decline of approximately 5% year-over-year during the second quarter 2020; Same-store move outs declined approximately 5% during full year 2020 as compared to full year 2019, as compared to the decline of approximately 12% year-over-year for the second quarter 2020; Same-store asking rates for new customers increased during the fourth quarter 2020 as compared to fourth quarter 2019, after a decline year-over-year during the second quarter 2020; Rents billed and collected within the same month remained consistent on year-over-year basis at approximately 97% during the full year of 2020. SmartStop Self Storage REIT, Inc. | Financial Supplement 2020 Q4 6
Earnings Release (Continued) Declared Distributions On December 3, 2020, SmartStop’s board of directors declared a distribution rate for the first quarter of 2021, of approximately $0.00164 per day per share on the outstanding shares of common stock payable to both Class A and Class T stockholders. Such distributions payable to each stockholder of record during a month will be paid the following month. Partial Reinstatement of Share Redemption Program On August 20, 2020, SmartStop’s board of directors partially reinstated its Share Redemption Program (“SRP”). Currently, our SRP remains suspended other than for redemptions sought in connection with a stockholder’s death, qualifying disability, or confinement to a long-term care facility or other exigent circumstances. The board further determined to revise the redemption price per share for all redemptions under the SRP to the most recently-published estimated net asset value per share. SmartStop Self Storage REIT, Inc. | Financial Supplement 2020 Q4 7
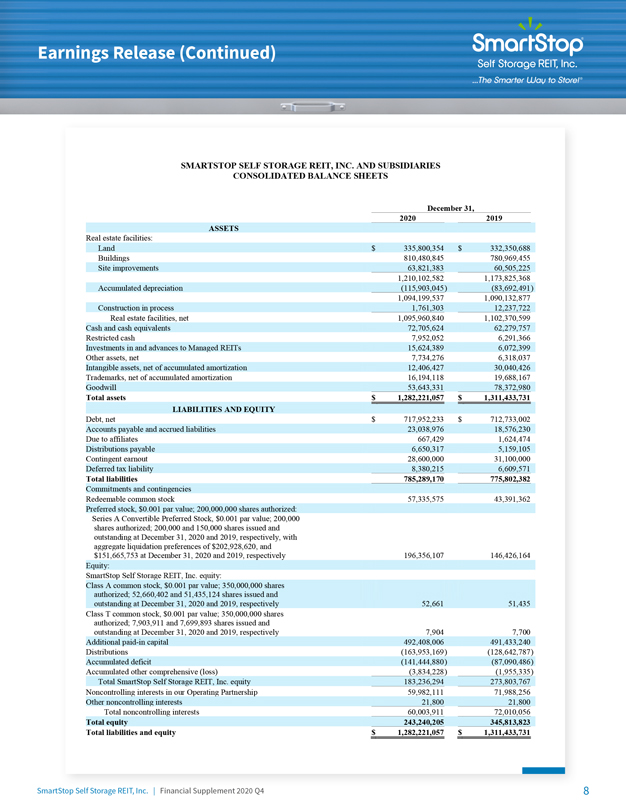
Earnings Release (Continued) SMARTSTOP SELF STORAGE REIT, INC. AND SUBSIDIARIES CONSOLIDATED BALANCE SHEETSDecember 31, 20202019 ASSETS Real estate facilities: Land$335,800,354$332,350,688 Buildings810,480,845780,969,455 Site improvements63,821,38360,505,225 1,210,102,5821,173,825,368 Accumulated depreciation(115,903,045)(83,692,491) 1,094,199,5371,090,132,877 Construction in process1,761,30312,237,722 Real estate facilities, net1,095,960,8401,102,370,599 Cash and cash equivalents72,705,62462,279,757 Restricted cash7,952,0526,291,366 Investments in and advances to Managed REITs15,624,3896,072,399 Other assets, net7,734,2766,318,037 Intangible assets, net of accumulated amortization12,406,42730,040,426 Trademarks, net of accumulated amortization16,194,11819,688,167 Goodwill53,643,33178,372,980 Total assets$1,282,221,057$1,311,433,731 LIABILITIES AND EQUITY Debt, net$717,952,233$712,733,002 Accounts payable and accrued liabilities23,038,976 18,576,230 Due to affiliates667,4291,624,474 Distributions payable6,650,3175,159,105 Contingent earnout 28,600,00031,100,000 Deferred tax liability8,380,2156,609,571 Total liabilities785,289,170775,802,382 Commitments and contingencies Redeemable common stock57,335,57543,391,362 Preferred stock, $0.001 par value; 200,000,000 shares authorized: Series A Convertible Preferred Stock, $0.001 par value; 200,000 shares authorized; 200,000 and 150,000 shares issued andoutstanding at December 31, 2020 and 2019, respectively, withaggregate liquidation preferences of $202,928,620, and $151,665,753 at December 31, 2020 and 2019, respectively196,356,107146,426,164 Equity:SmartStop Self Storage REIT, Inc. equity: Class A common stock, $0.001 par value; 350,000,000 sharesauthorized; 52,660,402 and 51,435,124 shares issued andoutstanding at December 31, 2020 and 2019, respectively 52,66151,435 Class T common stock, $0.001 par value; 350,000,000 sharesauthorized; 7,903,911 and 7,699,893 shares issued and outstanding at December 31, 2020 and 2019, respectively7,9047,700 Additional paid-in capital492,408,006491,433,240 Distributions(163,953,169)(128,642,787) Accumulated deficit(141,444,880)(87,090,486) Accumulated other comprehensive (loss)(3,834,228)(1,955,335) Total SmartStop Self Storage REIT, Inc. equity 183,236,294273,803,767 Noncontrolling interests in our Operating Partnership 59,982,11171,988,256 Other noncontrolling interests 21,80021,800 Total noncontrolling interests 60,003,91172,010,056 Total equity243,240,205345,813,823 Total liabilities and equity$1,282,221,057$1,311,433,731 SmartStop Self Storage REIT, Inc. | Financial Supplement 2020 Q4 8
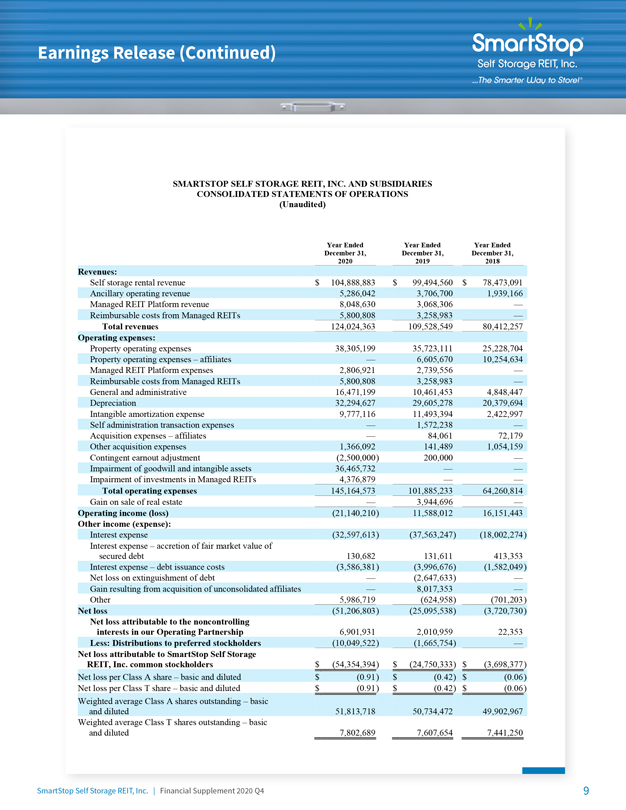
Earnings Release (Continued) SMARTSTOP SELF STORAGE REIT, INC. AND SUBSIDIARIES CONSOLIDATED STATEMENTS OF OPERATIONS (Unaudited) Year EndedYear EndedYear Ended December 31,December 31,December 31, 202020192018 Revenues: Self storage rental revenue$104,888,883$99,494,560$78,473,091 Ancillary operating revenue5,286,0423,706,7001,939,166 Managed REIT Platform revenue8,048,6303,068,306— Reimbursable costs from Managed REITs5,800,8083,258,983— Total revenues124,024,363109,528,54980,412,257 Operating expenses: Property operating expenses38,305,19935,723,11125,228,704 Property operating expenses – affiliates—6,605,67010,254,634 Managed REIT Platform expenses2,806,9212,739,556— Reimbursable costs from Managed REITs5,800,8083,258,983— General and administrative16,471,19910,461,4534,848,447 Depreciation32,294,62729,605,27820,379,694 Intangible amortization expense9,777,11611,493,3942,422,997 Self administration transaction expenses—1,572,238— Acquisition expenses – affiliates—84,06172,179 Other acquisition expenses1,366,092141,4891,054,159 Contingent earnout adjustment (2,500,000 )200,000— Impairment of goodwill and intangible assets36,465,732—— Impairment of investments in Managed REITs4,376,879—— Total operating expenses145,164,573101,885,23364,260,814 Gain on sale of real estate—3,944,696— Operating income (loss)(21,140,210 )11,588,01216,151,443 Other income (expense): Interest expense(32,597,613 )(37,563,247)(18,002,274 ) Interest expense – accretion of fair market value of secured debt130,682131,611413,353 Interest expense – debt issuance costs(3,586,381 )(3,996,676)(1,582,049 ) Net loss on extinguishment of debt—(2,647,633)— Gain resulting from acquisition of unconsolidated affiliates—8,017,353— Other5,986,719(624,958)(701,203 ) Net loss(51,206,803 )(25,095,538)(3,720,730 ) Net loss attributable to the noncontrolling interests in our Operating Partnership6,901,9312,010,95922,353 Less: Distributions to preferred stockholders(10,049,522 )(1,665,754)— Net loss attributable to SmartStop Self Storage REIT, Inc. common stockholders$(54,354,394 )$(24,750,333)$(3,698,377 ) Net loss per Class A share – basic and diluted $(0.91 )$(0.42)$(0.06 ) Net loss per Class T share – basic and diluted$(0.91 )$(0.42)$(0.06 ) Weighted average Class A shares outstanding – basic and diluted51,813,71850,734,47249,902,967 Weighted average Class T shares outstanding – basic and diluted7,802,6897,607,6547,441,250 SmartStop Self Storage REIT, Inc. | Financial Supplement 2020 Q4 9
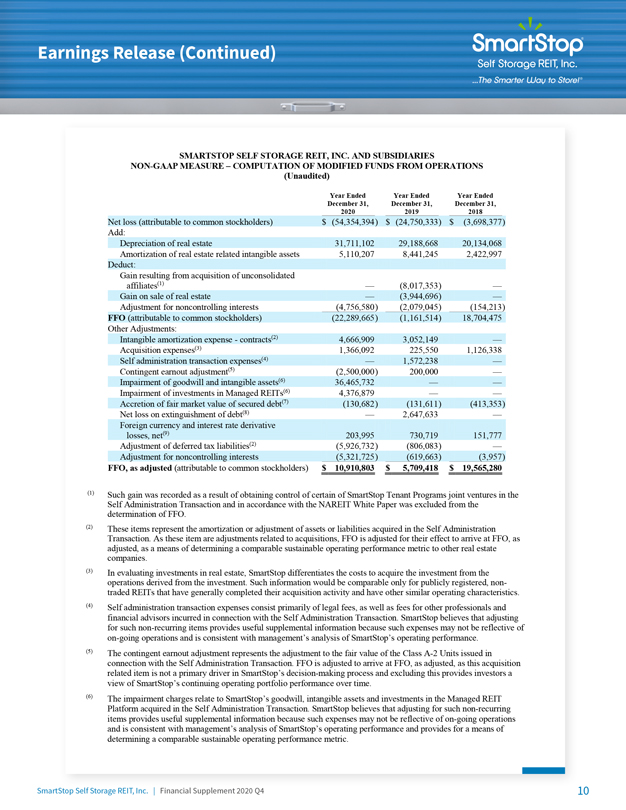
Earnings Release (Continued) SMARTSTOP SELF STORAGE REIT, INC. AND SUBSIDIARIES NON-GAAP MEASURE – COMPUTATION OF MODIFIED FUNDS FROM OPERATIONS (Unaudited) Year Ended Year Ended Year Ended December 31, December 31, December 31, 2020 2019 2018 Net loss (attributable to common stockholders) $ (54,354,394 ) $ (24,750,333) $ (3,698,377) Add: Depreciation of real estate 31,711,102 29,188,668 20,134,068 Amortization of real estate related intangible assets 5,110,207 8,441,245 2,422,997 Deduct: Gain resulting from acquisition of unconsolidated affiliates(1) — (8,017,353) — Gain on sale of real estate — (3,944,696) — Adjustment for noncontrolling interests (4,756,580 ) (2,079,045) (154,213) FFO (attributable to common stockholders) (22,289,665 ) (1,161,514) 18,704,475 Other Adjustments: Intangible amortization expense—contracts(2) 4,666,909 3,052,149 — Acquisition expenses(3) 1,366,092 225,550 1,126,338 Self administration transaction expenses(4) — 1,572,238 — Contingent earnout adjustment(5) (2,500,000 ) 200,000 — Impairment of goodwill and intangible assets(6) 36,465,732 — — Impairment of investments in Managed REITs(6) 4,376,879 — — Accretion of fair market value of secured debt(7) (130,682 ) (131,611) (413,353) Net loss on extinguishment of debt(8) — 2,647,633 — Foreign currency and interest rate derivative losses, net(9) 203,995 730,719 151,777 Adjustment of deferred tax liabilities(2) (5,926,732 ) (806,083) — Adjustment for noncontrolling interests (5,321,725 ) (619,663) (3,957) FFO, as adjusted (attributable to common stockholders) $ 10,910,803 $ 5,709,418 $ 19,565,280 (1) Such gain was recorded as a result of obtaining control of certain of SmartStop Tenant Programs joint ventures in the Self Administration Transaction and in accordance with the NAREIT White Paper was excluded from the determination of FFO. (2) These items represent the amortization or adjustment of assets or liabilities acquired in the Self Administration Transaction. As these item are adjustments related to acquisitions, FFO is adjusted for their effect to arrive at FFO, as adjusted, as a means of determining a comparable sustainable operating performance metric to other real estate companies. (3) In evaluating investments in real estate, SmartStop differentiates the costs to acquire the investment from the operations derived from the investment. Such information would be comparable only for publicly registered, non-traded REITs that have generally completed their acquisition activity and have other similar operating characteristics. (4) Self administration transaction expenses consist primarily of legal fees, as well as fees for other professionals and financial advisors incurred in connection with the Self Administration Transaction. SmartStop believes that adjusting for such non-recurring items provides useful supplemental information because such expenses may not be reflective of on-going operations and is consistent with management’s analysis of SmartStop’s operating performance. (5) The contingent earnout adjustment represents the adjustment to the fair value of the Class A-2 Units issued in connection with the Self Administration Transaction. FFO is adjusted to arrive at FFO, as adjusted, as this acquisition related item is not a primary driver in SmartStop’s decision-making process and excluding this provides investors a view of SmartStop’s continuing operating portfolio performance over time. (6) The impairment charges relate to SmartStop’s goodwill, intangible assets and investments in the Managed REIT Platform acquired in the Self Administration Transaction. SmartStop believes that adjusting for such non-recurring items provides useful supplemental information because such expenses may not be reflective of on-going operations and is consistent with management’s analysis of SmartStop’s operating performance and provides for a means of determining a comparable sustainable operating performance metric. SmartStop Self Storage REIT, Inc. | Financial Supplement 2020 Q4 10
Earnings Release (Continued) (7) This represents the difference between the stated interest rate and the estimated market interest rate on assumed notes as of the date of acquisition. Such amounts have been excluded from FFO, as adjusted, because SmartStop believes FFO, as adjusted, provides useful supplementary information by focusing on operating fundamentals, rather than events not related to SmartStop’s normal operations. SmartStop is responsible for managing interest rate risk and do not rely on another party to manage such risk. (8) The net loss associated with the extinguishment of debt includes prepayment penalties, the write-off of unamortized deferred financing fees, and other fees incurred. SmartStop believes that adjusting for such non-recurring items provides useful supplemental information because such losses may not be reflective of on-going transactions and operations and is consistent with management’s analysis of SmartStop’s operating performance. (9) This represents the mark-to-market adjustment for SmartStop’s derivative instruments not designated for hedge accounting and the ineffective portion of the change in fair value of derivatives recognized in earnings, as well as changes in foreign currency related to SmartStop’s foreign equity investments not classified as long term. These derivative contracts are intended to manage the Company’s exposure to interest rate and foreign currency risk which may not be reflective of SmartStop’s ongoing performance and may reflect unrealized impacts on SmartStop’s operating performance. Such amounts are recorded in “Other” within SmartStop’s consolidated statements of operations. Non-cash Items Included in Net Loss: Provided below is additional information related to selected non-cash items included in net loss above, which may be helpful in assessing SmartStop’s operating results: Interest expense—debt issuance costs of approximately $3.6 million, $4.0 million, and $1.6 million respectively, were recognized for the years ended December 31, 2020, 2019, and 2018. SmartStop Self Storage REIT, Inc. | Financial Supplement 2020 Q4 11
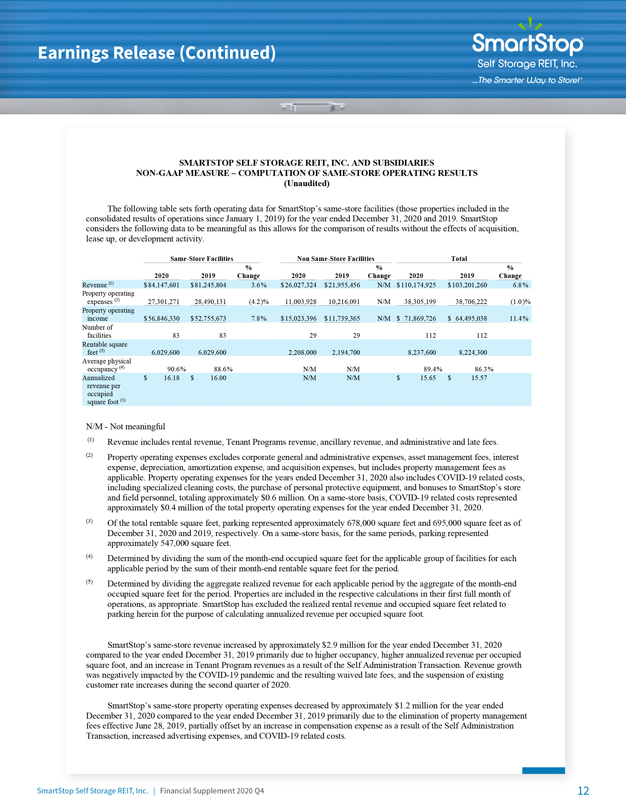
Earnings Release (Continued) SMARTSTOP SELF STORAGE REIT, INC. AND SUBSIDIARIES NON-GAAP MEASURE – COMPUTATION OF SAME-STORE OPERATING RESULTS (Unaudited) The following table sets forth operating data for SmartStop’s same-store facilities (those properties included in the consolidated results of operations since January 1, 2019) for the year ended December 31, 2020 and 2019. SmartStop considers the following data to be meaningful as this allows for the comparison of results without the effects of acquisition, lease up, or development activity. Same-Store Facilities Non Same-Store Facilities Total % % % 2020 2019 Change 2020 2019 Change 2020 2019 Change Revenue (1) $ 84,147,601 $ 81,245,804 3.6 % $ 26,027,324 $ 21,955,456 N/M $ 110,174,925 $ 103,201,260 6.8 % Property operating expenses (2) 27,301,271 28,490,131 (4.2 )% 11,003,928 10,216,091 N/M 38,305,199 38,706,222 (1.0 )% Property operating income $56,846,330 $52,755,673 7.8 % $15,023,396 $11,739,365 N/M $ 71,869,726 $ 64,495,038 11.4 % Number of facilities 83 83 29 29 112 112 Rentable square feet (3) 6,029,600 6,029,600 2,208,000 2,194,700 8,237,600 8,224,300 Average physical occupancy (4) 90.6 % 88.6 % N/M N/M 89.4 % 86.3 % Annualized $ 16.18 $ 16.00 N/M N/M $ 15.65 $ 15.57 revenue per occupied square foot (5) N/M—Not meaningful (1) Revenue includes rental revenue, Tenant Programs revenue, ancillary revenue, and administrative and late fees. (2) Property operating expenses excludes corporate general and administrative expenses, asset management fees, interest expense, depreciation, amortization expense, and acquisition expenses, but includes property management fees as applicable. Property operating expenses for the years ended December 31, 2020 also includes COVID-19 related costs, including specialized cleaning costs, the purchase of personal protective equipment, and bonuses to SmartStop’s store and field personnel, totaling approximately $0.6 million. On a same-store basis, COVID-19 related costs represented approximately $0.4 million of the total property operating expenses for the year ended December 31, 2020. (3) Of the total rentable square feet, parking represented approximately 678,000 square feet and 695,000 square feet as of December 31, 2020 and 2019, respectively. On a same-store basis, for the same periods, parking represented approximately 547,000 square feet. (4) Determined by dividing the sum of the month-end occupied square feet for the applicable group of facilities for each applicable period by the sum of their month-end rentable square feet for the period. (5) Determined by dividing the aggregate realized revenue for each applicable period by the aggregate of the month-end occupied square feet for the period. Properties are included in the respective calculations in their first full month of operations, as appropriate. SmartStop has excluded the realized rental revenue and occupied square feet related to parking herein for the purpose of calculating annualized revenue per occupied square foot. SmartStop’s same-store revenue increased by approximately $2.9 million for the year ended December 31, 2020 compared to the year ended December 31, 2019 primarily due to higher occupancy, higher annualized revenue per occupied square foot, and an increase in Tenant Program revenues as a result of the Self Administration Transaction. Revenue growth was negatively impacted by the COVID-19 pandemic and the resulting waived late fees, and the suspension of existing customer rate increases during the second quarter of 2020. SmartStop’s same-store property operating expenses decreased by approximately $1.2 million for the year ended December 31, 2020 compared to the year ended December 31, 2019 primarily due to the elimination of property management fees effective June 28, 2019, partially offset by an increase in compensation expense as a result of the Self Administration Transaction, increased advertising expenses, and COVID-19 related costs. SmartStop Self Storage REIT, Inc. | Financial Supplement 2020 Q4 12
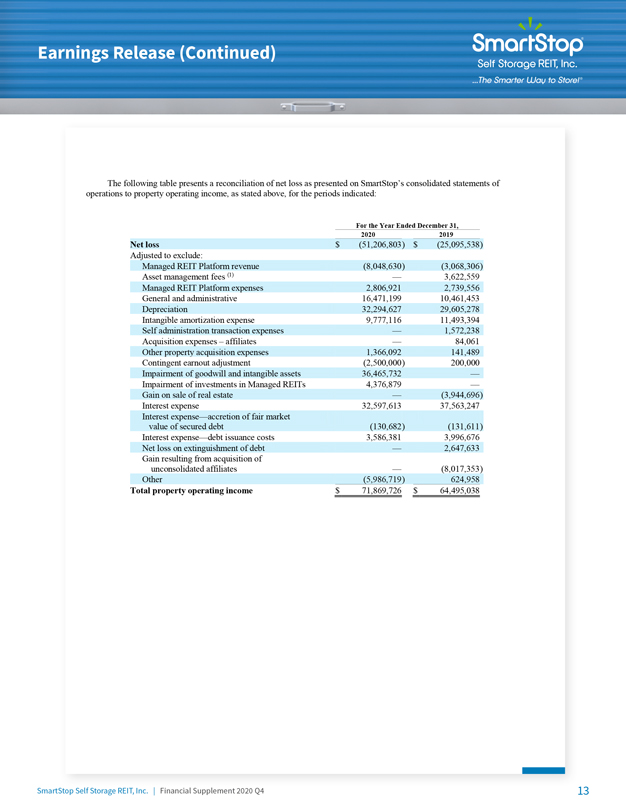
Earnings Release (Continued) The following table presents a reconciliation of net loss as presented on SmartStop’s consolidated statements of operations to property operating income, as stated above, for the periods indicated: For the Year Ended December 31, 2020 2019 Net loss $ (51,206,803) $ (25,095,538) Adjusted to exclude: Managed REIT Platform revenue (8,048,630) (3,068,306) Asset management fees (1) — 3,622,559 Managed REIT Platform expenses 2,806,921 2,739,556 General and administrative 16,471,199 10,461,453 Depreciation 32,294,627 29,605,278 Intangible amortization expense 9,777,116 11,493,394 Self administration transaction expenses — 1,572,238 Acquisition expenses – affiliates — 84,061 Other property acquisition expenses 1,366,092 141,489 Contingent earnout adjustment (2,500,000) 200,000 Impairment of goodwill and intangible assets 36,465,732 — Impairment of investments in Managed REITs 4,376,879 — Gain on sale of real estate — (3,944,696) Interest expense 32,597,613 37,563,247 Interest expense—accretion of fair market value of secured debt (130,682) (131,611) Interest expense—debt issuance costs 3,586,381 3,996,676 Net loss on extinguishment of debt — 2,647,633 Gain resulting from acquisition of unconsolidated affiliates — (8,017,353) Other (5,986,719) 624,958 Total property operating income $ 71,869,726 $ 64,495,038 SmartStop Self Storage REIT, Inc. | Financial Supplement 2020 Q4 13
Earnings Release (Continued) ADDITIONAL INFORMATION REGARDING NOI, FFO, and MFFO Net Operating Income (“NOI”) NOI is a non-GAAP measure that SmartStop defines as net income (loss), computed in accordance with GAAP, generated from properties before corporate general and administrative expenses, asset management fees, interest expense, depreciation, amortization, acquisition expenses and other non-property related expenses. SmartStop believes that NOI is useful for investors as it provides a measure of the operating performance of its operating assets because NOI excludes certain items that are not associated with the ongoing operation of the properties. Additionally, SmartStop believes that NOI (also referred to as property operating income) is a widely accepted measure of comparative operating performance in the real estate community. However, SmartStop’s use of the term NOI may not be comparable to that of other real estate companies as they may have different methodologies for computing this amount. Funds from Operations (“FFO”) and FFO, as Adjusted Funds from Operations Investment Funds Trusts, from operations or NAREIT, (“FFO”) which is SmartStop an industry believes wide metric to be an promulgated appropriate by supplemental the National measure Association to reflect of Real the Estate operating performance of a REIT. The use of FFO is recommended by the REIT industry as a supplemental performance measure. approved SmartStop by the Board defines of FFO, Governors a non-GAAP of NAREIT, measure, or the consistent White Paper. with the The standards White Paper established defines by FFO the as White net income Paper on (loss) FFO plus computed depreciation in accordance and amortization, with GAAP, and excluding after adjustments gains or losses for unconsolidated from sales of partnerships property and and asset joint impairment ventures. write Additionally, downs, partnerships gains and losses and from joint change ventures in are control calculated are excluded to reflect from FFO the on determination the same basis. of SmartStop’s FFO. Adjustments FFO calculation for unconsolidated complies with NAREIT’s policy described above. FFO, as Adjusted SmartStop SmartStop previously uses FFO, used Modified as adjusted, Funds as an from additional Operations non-GAAP (“MFFO”) financial (as defined measure by to the evaluate Institute its for operating Portfolio performance. Alternatives) adjusted, because as a non-GAAP FFO, as adjusted, measure provides of operating investors performance. with supplemental Management performance replaced information the MFFO measure that is consistent with FFO, with as the peer performance group, which models includes and analysis publicly used traded by management. REITs. Further, In addition, SmartStop FFO, believes as adjusted, FFO, as is adjusted, a measure is used useful among in comparing SmartStop’s the sustainability of its operating performance with the sustainability of the operating performance of other real estate companies. In determining FFO, as adjusted, SmartStop makes further adjustments to the NAREIT computation of FFO to exclude the effects of non-real estate related asset impairments and intangible amortization, acquisition related costs, contingent earnout expenses, adjustments of fair value of debt adjustments, gains or losses from extinguishment of debt, accretion of deferred tax liabilities, realized and unrealized gains/losses on foreign exchange transactions, and gains/losses on foreign exchange and interest rate derivatives not designated for hedge accounting, which SmartStop believes are not indicative of the Company’s overall long-term operating performance. SmartStop excludes these items from GAAP net income to arrive at FFO, as adjusted, as they are not the primary drivers in its decision-making process and excluding these items provides investors a view of its continuing operating portfolio performance over time and makes its results more comparable period to period and to other REITs, which in any respective period may experience fluctuations in such acquisition, merger or other similar activities that are not of a long-term operating performance nature. FFO, as adjusted, also reflects adjustments for unconsolidated partnerships and jointly owned investments. SmartStop uses FFO, as adjusted, as one measure of operating performance when SmartStop formulates corporate goals and evaluate the effectiveness of its strategies. Presentation of FFO and FFO, as adjusted, is intended to provide useful information to investors as they compare the operating performance of different REITs, although it should be noted that not all REITs calculate FFO and FFO, as adjusted, the same way, so comparisons with other REITs may not be meaningful. Furthermore, FFO and FFO, as adjusted, are not necessarily indicative of cash flow available to fund cash needs and should not be considered as an alternative to net income (loss) or income (loss) from continuing operations as an indication of SmartStop’s performance, as an alternative to cash flows from operations, which is an indication of liquidity, or indicative of funds available to fund SmartStop’s cash needs including SmartStop’s ability to make distributions to its stockholders. FFO and FFO, as adjusted, should not be considered as an alternative to net income (determined in accordance with GAAP) and should be reviewed in conjunction with other measurements as an indication of SmartStop’s performance. SmartStop Self Storage REIT, Inc. | Financial Supplement 2020 Q4 14
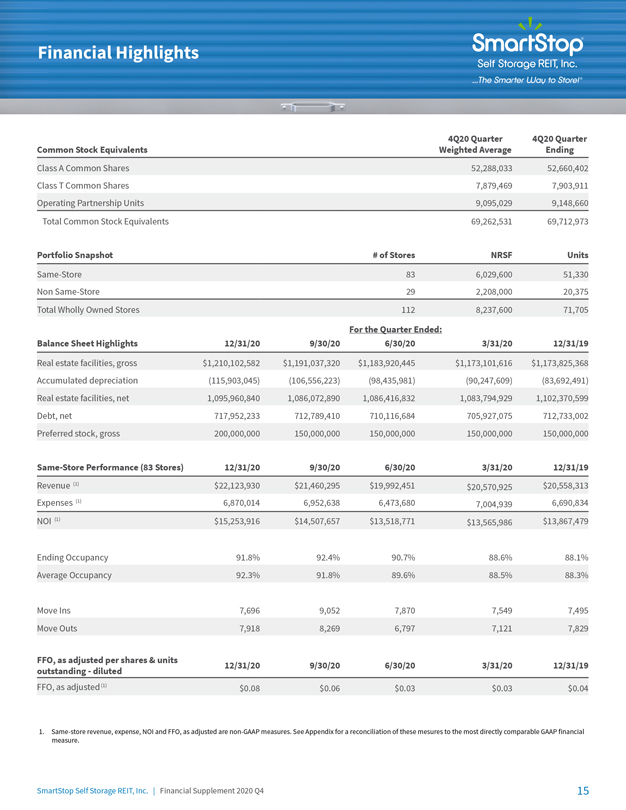
Trailing Five Quarter Financials: Income Statement Common Stock Equivalents Weighted Average Ending Class A Common Shares 52,288,033 52,660,402 Class T Common Shares 7,879,469 7,903,911 Operating Partnership Units 9,095,029 9,148,660 Total Common Stock Equivalents 69,262,531 69,712,973 Portfolio Snapshot # of Stores NRSF Units Same-Store 83 6,029,600 51,330 Non Same-Store 29 2,208,000 20,375 Total Wholly Owned Stores 112 8,237,600 71,705 For the Quarter Ended: Balance Sheet Highlights 12/31/20 9/30/20 6/30/20 3/31/20 12/31/19 Real estate facilities, gross $1,210,102,582 $1,191,037,320 $1,183,920,445 $1,173,101,616 $1,173,825,368 Accumulated depreciation (115,903,045) (106,556,223) (98,435,981) (90,247,609) (83,692,491) Real estate facilities, net 1,095,960,840 1,086,072,890 1,086,416,832 1,083,794,929 1,102,370,599 Debt, net 717,952,233 712,789,410 710,116,684 705,927,075 712,733,002 Preferred stock, gross 200,000,000 150,000,000 150,000,000 150,000,000 150,000,000 Same-Store Performance (83 Stores) 12/31/20 9/30/20 6/30/20 3/31/20 12/31/19 Revenue (1) $22,123,930 $21,460,295 $19,992,451 $20,570,925 $20,558,313 Expenses (1) 6,870,014 6,952,638 6,473,680 7,004,939 6,690,834 NOI (1) $15,253,916 $14,507,657 $13,518,771 $13,565,986 $13,867,479 Ending Occupancy 91.8% 92.4% 90.7% 88.6% 88.1% Average Occupancy 92.3% 91.8% 89.6% 88.5% 88.3% Move Ins 7,696 9,052 7,870 7,549 7,495 Move Outs 7,918 8,269 6,797 7,121 7,829 FFO, as adjusted per shares & units 12/31/20 9/30/20 6/30/20 3/31/20 12/31/19 outstanding – diluted FFO, as adjusted (1) $0.08 $0.06 $0.03 $0.03 $0.04 1. Same-store revenue, expense, NOI and FFO, as adjusted are non-GAAP measures. See Appendix for a reconciliation of these mesures to the most directly comparable GAAP financial measure.
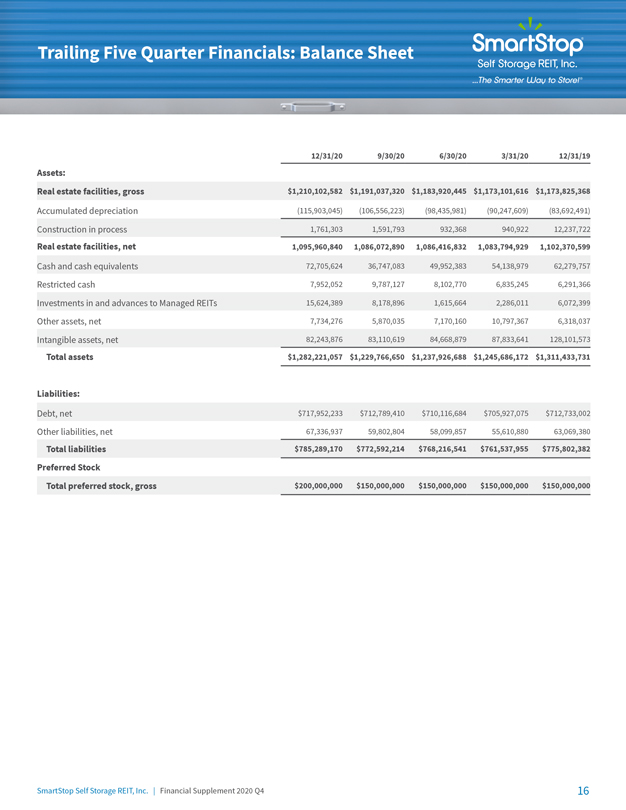
Trailing Five Quarter Financials: Balance Sheet 12/31/20 9/30/20 6/30/20 3/31/20 12/31/19 Assets: Real estate facilities, gross $1,210,102,582 $1,191,037,320 $1,183,920,445 $1,173,101,616 $1,173,825,368 Accumulated depreciation (115,903,045) (106,556,223) (98,435,981) (90,247,609) (83,692,491) Construction in process 1,761,303 1,591,793 932,368 940,922 12,237,722 Real estate facilities, net 1,095,960,840 1,086,072,890 1,086,416,832 1,083,794,929 1,102,370,599 Cash and cash equivalents 72,705,624 36,747,083 49,952,383 54,138,979 62,279,757 Restricted cash 7,952,052 9,787,127 8,102,770 6,835,245 6,291,366 Investments in and advances to Managed REITs 15,624,389 8,178,896 1,615,664 2,286,011 6,072,399 Other assets, net 7,734,276 5,870,035 7,170,160 10,797,367 6,318,037 Intangible assets, net 82,243,876 83,110,619 84,668,879 87,833,641 128,101,573 Total assets $1,282,221,057 $1,229,766,650 $1,237,926,688 $1,245,686,172 $1,311,433,731 Liabilities: Debt, net $717,952,233 $712,789,410 $710,116,684 $705,927,075 $712,733,002 Other liabilities, net 67,336,937 59,802,804 58,099,857 55,610,880 63,069,380 Total liabilities $785,289,170 $772,592,214 $768,216,541 $761,537,955 $775,802,382 Preferred Stock Total preferred stock, gross $200,000,000 $150,000,000 $150,000,000 $150,000,000 $150,000,000 SmartStop Self Storage REIT, Inc. | Financial Supplement 2020 Q4 16
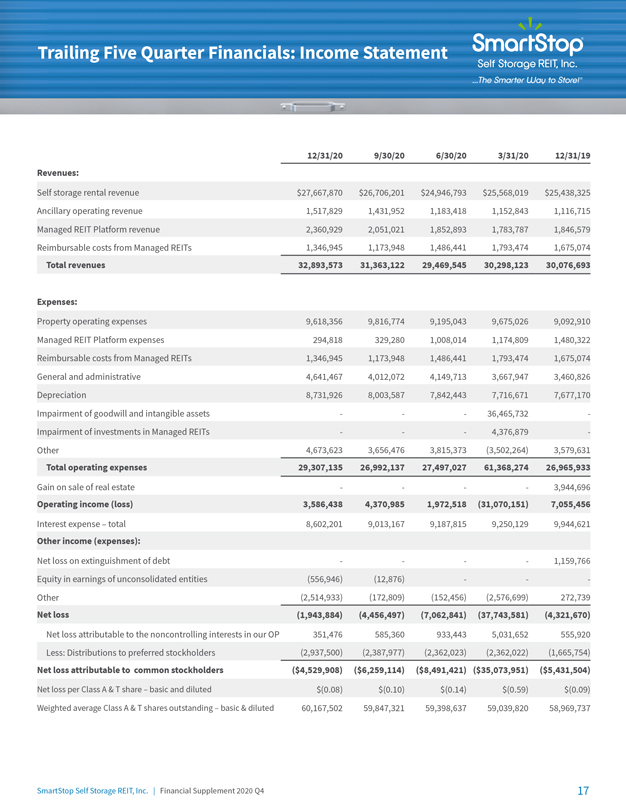
Trailing Five Quarter Financials: Balance Sheet 12/31/20 9/30/20 6/30/20 3/31/20 12/31/19 Assets: Real estate facilities, gross $1,210,102,582 $1,191,037,320 $1,183,920,445 $1,173,101,616 $1,173,825,368 Accumulated depreciation (115,903,045) (106,556,223) (98,435,981) (90,247,609) (83,692,491) Construction in process 1,761,303 1,591,793 932,368 940,922 12,237,722 Real estate facilities, net 1,095,960,840 1,086,072,890 1,086,416,832 1,083,794,929 1,102,370,599 Cash and cash equivalents 72,705,624 36,747,083 49,952,383 54,138,979 62,279,757 Restricted cash 7,952,052 9,787,127 8,102,770 6,835,245 6,291,366 Investments in and advances to Managed REITs 15,624,389 8,178,896 1,615,664 2,286,011 6,072,399 Other assets, net 7,734,276 5,870,035 7,170,160 10,797,367 6,318,037 Intangible assets, net 82,243,876 83,110,619 84,668,879 87,833,641 128,101,573 Total assets $1,282,221,057 $1,229,766,650 $1,237,926,688 $1,245,686,172 $1,311,433,731 Liabilities: Debt, net $717,952,233 $712,789,410 $710,116,684 $705,927,075 $712,733,002 Other liabilities, net 67,336,937 59,802,804 58,099,857 55,610,880 63,069,380 Total liabilities $785,289,170 $772,592,214 $768,216,541 $761,537,955 $775,802,382 Preferred Stock Total preferred stock, gross $200,000,000 $150,000,000 $150,000,000 $150,000,000 $150,000,000 SmartStop Self Storage REIT, Inc. | Financial Supplement 2020 Q4 16 Trailing Five Quarter Financials: Income Statement 12/31/20 9/30/20 6/30/20 3/31/20 12/31/19 Revenues: Self storage rental revenue $27,667,870 $26,706,201 $24,946,793 $25,568,019 $25,438,325 Ancillary operating revenue 1,517,829 1,431,952 1,183,418 1,152,843 1,116,715 Managed REIT Platform revenue 2,360,929 2,051,021 1,852,893 1,783,787 1,846,579 Reimbursable costs from Managed REITs 1,346,945 1,173,948 1,486,441 1,793,474 1,675,074 Total revenues 32,893,573 31,363,122 29,469,545 30,298,123 30,076,693 Expenses: Property operating expenses 9,618,356 9,816,774 9,195,043 9,675,026 9,092,910 Managed REIT Platform expenses 294,818 329,280 1,008,014 1,174,809 1,480,322 Reimbursable costs from Managed REITs 1,346,945 1,173,948 1,486,441 1,793,474 1,675,074 General and administrative 4,641,467 4,012,072 4,149,713 3,667,947 3,460,826 Depreciation 8,731,926 8,003,587 7,842,443 7,716,671 7,677,170 Impairment of goodwill and intangible assets 36,465,732 Impairment of investments in Managed REITs 4,376,879 Other 4,673,623 3,656,476 3,815,373 (3,502,264) 3,579,631 Total operating expenses 29,307,135 26,992,137 27,497,027 61,368,274 26,965,933 Gain on sale of real estate 3,944,696 Operating income (loss) 3,586,438 4,370,985 1,972,518 (31,070,151) 7,055,456 Interest expense – total 8,602,201 9,013,167 9,187,815 9,250,129 9,944,621 Other income (expenses): Net loss on extinguishment of debt 1,159,766 Equity in earnings of unconsolidated entities (556,946) (12,876) Other (2,514,933) (172,809) (152,456) (2,576,699) 272,739 Net loss (1,943,884) (4,456,497) (7,062,841) (37,743,581) (4,321,670) Net loss attributable to the noncontrolling interests in our OP 351,476 585,360 933,443 5,031,652 555,920 Less: Distributions to preferred stockholders (2,937,500) (2,387,977) (2,362,023) (2,362,022) (1,665,754) Net loss attributable to common stockholders ($4,529,908) ($6,259,114) ($8,491,421) ($35,073,951) ($5,431,504) Net loss per Class A & T share – basic and diluted $(0.08) $(0.10) $(0.14) $(0.59) $(0.09) Weighted average Class A & T shares outstanding – basic & diluted 60,167,502 59,847,321 59,398,637 59,039,820 58,969,737 SmartStop Self Storage REIT, Inc. | Financial Supplement 2020 Q4 17
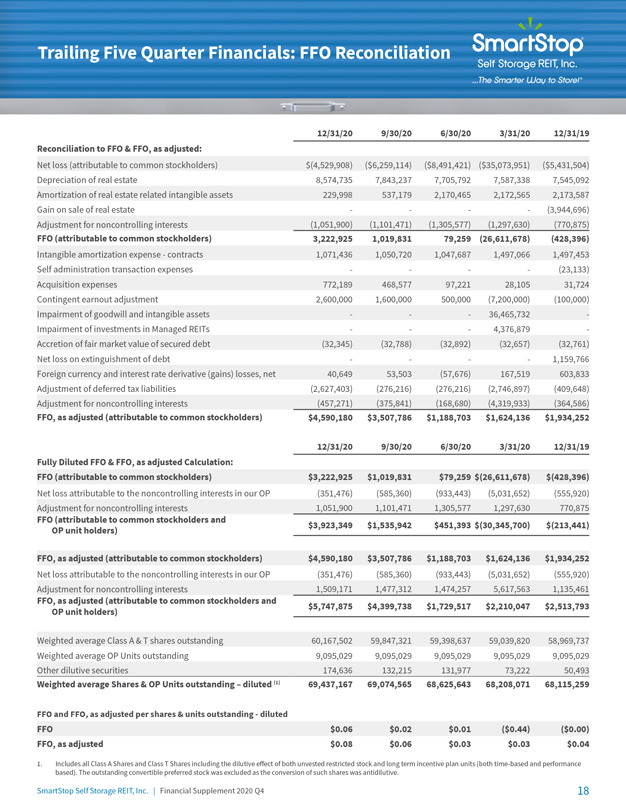
Trailing Five Quarter Financials: FFO Reconciliation 12/31/20 9/30/20 6/30/20 3/31/20 12/31/19 Reconciliation to FFO & FFO, as adjusted: Net loss (attributable to common stockholders) $(4,529,908) ($6,259,114) ($8,491,421) ($35,073,951) ($5,431,504) Depreciation of real estate 8,574,735 7,843,237 7,705,792 7,587,338 7,545,092 Amortization of real estate related intangible assets 229,998 537,179 2,170,465 2,172,565 2,173,587 Gain on sale of real estate (3,944,696) Adjustment for noncontrolling interests (1,051,900) (1,101,471) (1,305,577) (1,297,630) (770,875) FFO (attributable to common stockholders) 3,222,925 1,019,831 79,259 (26,611,678) (428,396) Intangible amortization expense—contracts 1,071,436 1,050,720 1,047,687 1,497,066 1,497,453 Self administration transaction expenses (23,133) Acquisition expenses 772,189 468,577 97,221 28,105 31,724 Contingent earnout adjustment 2,600,000 1,600,000 500,000 (7,200,000) (100,000) Impairment of goodwill and intangible assets 36,465,732 Impairment of investments in Managed REITs 4,376,879 Accretion of fair market value of secured debt (32,345) (32,788) (32,892) (32,657) (32,761) Net loss on extinguishment of debt 1,159,766 Foreign currency and interest rate derivative (gains) losses, net 40,649 53,503 (57,676) 167,519 603,833 Adjustment of deferred tax liabilities (2,627,403) (276,216) (276,216) (2,746,897) (409,648) Adjustment for noncontrolling interests (457,271) (375,841) (168,680) (4,319,933) (364,586) FFO, as adjusted (attributable to common stockholders) $4,590,180 $3,507,786 $1,188,703 $1,624,136 $1,934,252 12/31/20 9/30/20 6/30/20 3/31/20 12/31/19 Fully Diluted FFO & FFO, as adjusted Calculation: FFO (attributable to common stockholders) $3,222,925 $1,019,831 $79,259 $(26,611,678) $(428,396) Net loss attributable to the noncontrolling interests in our OP (351,476) (585,360) (933,443) (5,031,652) (555,920) Adjustment for noncontrolling interests 1,051,900 1,101,471 1,305,577 1,297,630 770,875 FFO (attributable to common stockholders and $3,923,349 $1,535,942 $451,393 $(30,345,700) $(213,441) OP unit holders) FFO, as adjusted (attributable to common stockholders) $4,590,180 $3,507,786 $1,188,703 $1,624,136 $1,934,252 Net loss attributable to the noncontrolling interests in our OP (351,476) (585,360) (933,443) (5,031,652) (555,920) Adjustment for noncontrolling interests 1,509,171 1,477,312 1,474,257 5,617,563 1,135,461 FFO, as adjusted (attributable to common stockholders and $5,747,875 $4,399,738 $1,729,517 $2,210,047 $2,513,793 OP unit holders) Weighted average Class A & T shares outstanding 60,167,502 59,847,321 59,398,637 59,039,820 58,969,737 Weighted average OP Units outstanding 9,095,029 9,095,029 9,095,029 9,095,029 9,095,029 Other dilutive securities 174,636 132,215 131,977 73,222 50,493 Weighted average Shares & OP Units outstanding – diluted (1) 69,437,167 69,074,565 68,625,643 68,208,071 68,115,259 FFO and FFO, as adjusted per shares & units outstanding—diluted FFO $0.06 $0.02 $0.01 ($0.44) ($0.00) FFO, as adjusted $0.08 $0.06 $0.03 $0.03 $0.04 1. Includes all Class A Shares and Class T Shares including the dilutive effect of both unvested restricted stock and long term incentive plan units (both time-based and performance based). The outstanding convertible preferred stock was excluded as the conversion of such shares was antidilutive. SmartStop Self Storage REIT, Inc. | Financial Supplement 2020 Q4 18
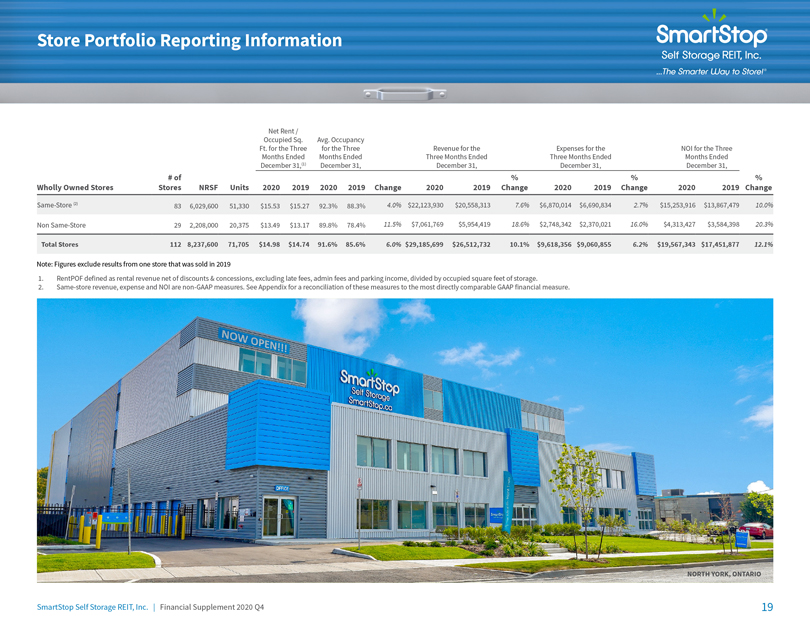
Store Portfolio Reporting Information Net Rent / Occupied Sq. Avg. Occupancy Ft. for the Three for the Three Revenue for the Expenses for the NOI for the Three Months Ended Months Ended Three Months Ended Three Months Ended Months Ended December 31,(1) December 31, December 31, December 31, December 31, # of % % % Wholly Owned Stores Stores NRSF Units 2020 2019 2020 2019 Change 2020 2019 Change 2020 2019 Change 2020 2019 Change Same-Store (2) 83 6,029,600 51,330 $15.53 $15.27 92.3% 88.3% 4.0% $22,123,930 $20,558,313 7.6% $6,870,014 $6,690,834 2.7% $15,253,916 $13,867,479 10.0% Non Same-Store 29 2,208,000 20,375 $13.49 $13.17 89.8% 78.4% 11.5% $7,061,769 $5,954,419 18.6% $2,748,342 $2,370,021 16.0% $4,313,427 $3,584,398 20.3% Total Stores 112 8,237,600 71,705 $14.98 $14.74 91.6% 85.6% 6.0% $29,185,699 $26,512,732 10.1% $9,618,356 $9,060,855 6.2% $19,567,343 $17,451,877 12.1% NNote: Figures exclude results from one store that was sold in 2019 1. RentPOF defined as rental revenue net of discounts & concessions, excluding late fees, admin fees and parking income, divided by occupied square feet of storage. 2. Same-store revenue, expense and NOI are non-GAAP measures. See Appendix for a reconciliation of these measures to the most directly comparable GAAP financial measure. NORTH YORK, ONTARIO SmartStop Self Storage REIT, Inc. | Financial Supplement 2020 Q4 19
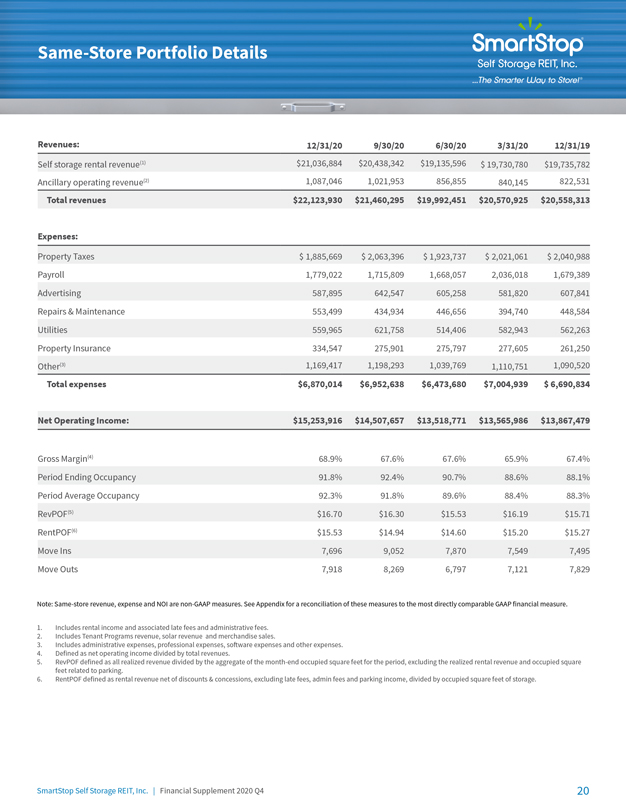
Same-Store Portfolio Details Revenues: 12/31/20 9/30/20 6/30/20 3/31/20 12/31/19 Self storage rental revenue(1) $21,036,884 $20,438,342 $19,135,596 $ 19,730,780 $19,735,782 Ancillary operating revenue(2) 1,087,046 1,021,953 856,855 840,145 822,531 Total revenues $22,123,930 $21,460,295 $19,992,451 $20,570,925 $20,558,313 Expenses: Property Taxes $ 1,885,669 $ 2,063,396 $ 1,923,737 $ 2,021,061 $ 2,040,988 Payroll 1,779,022 1,715,809 1,668,057 2,036,018 1,679,389 Advertising 587,895 642,547 605,258 581,820 607,841 Repairs & Maintenance 553,499 434,934 446,656 394,740 448,584 Utilities 559,965 621,758 514,406 582,943 562,263 Property Insurance 334,547 275,901 275,797 277,605 261,250 Other(3) 1,169,417 1,198,293 1,039,769 1,110,751 1,090,520 Total expenses $6,870,014 $6,952,638 $6,473,680 $7,004,939 $ 6,690,834 Net Operating Income: $15,253,916 $14,507,657 $13,518,771 $13,565,986 $13,867,479 Gross Margin(4) 68.9% 67.6% 67.6% 65.9% 67.4% Period Ending Occupancy 91.8% 92.4% 90.7% 88.6% 88.1% Period Average Occupancy 92.3% 91.8% 89.6% 88.4% 88.3% RevPOF(5) $16.70 $16.30 $15.53 $16.19 $15.71 RentPOF(6) $15.53 $14.94 $14.60 $15.20 $15.27 Move Ins 7,696 9,052 7,870 7,549 7,495 Move Outs 7,918 8,269 6,797 7,121 7,829 Note: Same-store revenue, expense and NOI are non-GAAP measures. See Appendix for a reconciliation of these measures to the most directly comparable GAAP financial measure. 1. Includes rental income and associated late fees and administrative fees. 2. Includes Tenant Programs revenue, solar revenue and merchandise sales. 3. Includes administrative expenses, professional expenses, software expenses and other expenses. 4. Defined as net operating income divided by total revenues. 5. RevPOF defined as all realized revenue divided by the aggregate of the month-end occupied square feet for the period, excluding the realized rental revenue and occupied square feet related to parking. 6. RentPOF defined as rental revenue net of discounts & concessions, excluding late fees, admin fees and parking income, divided by occupied square feet of storage. SmartStop Self Storage REIT, Inc. | Financial Supplement 2020 Q4 20
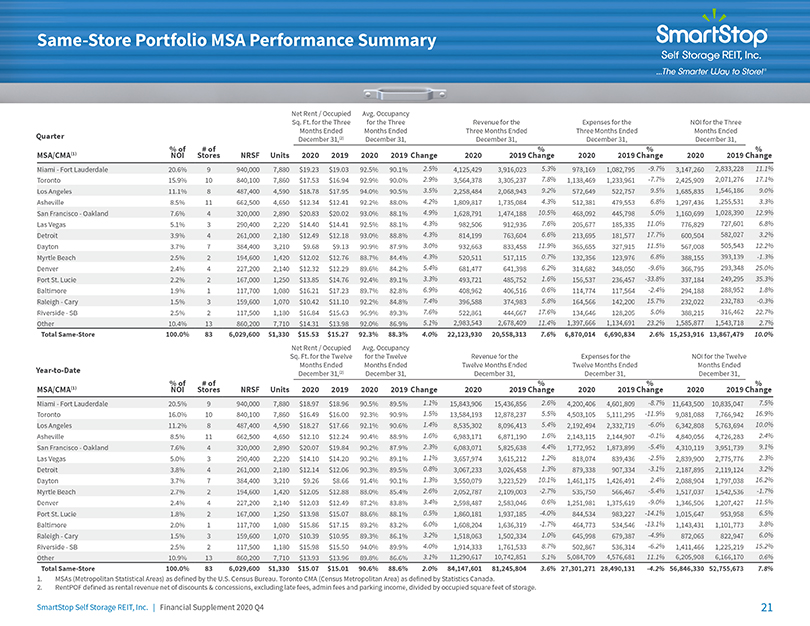
Same-Store Portfolio MSA Performance Summary Net Rent / Occupied Avg. Occupancy Sq. Ft. for the Three for the Three Revenue for the Expenses for the NOI for the Three Months Ended Months Ended Three Months Ended Three Months Ended Months Ended Quarter December 31,(2) December 31, December 31, December 31, December 31, % of # of % % % MSA/CMA(1) NOI Stores NRSF Units 2020 2019 2020 2019 Change 2020 2019 Change 2020 2019 Change 2020 2019 Change Miami - Fort Lauderdale 20.6% 9 940,000 7,880 $19.23 $19.03 92.5% 90.1% 2.5% 4,125,429 3,916,023 5.3% 978,169 1,082,795 -9.7% 3,147,260 2,833,228 11.1% Toronto 15.9% 10 840,100 7,860 $17.53 $16.94 92.9% 90.0% 2.9% 3,564,378 3,305,237 7.8% 1,138,469 1,233,961 -7.7% 2,425,909 2,071,276 17.1% Los Angeles 11.1% 8 487,400 4,590 $18.78 $17.95 94.0% 90.5% 3.5% 2,258,484 2,068,943 9.2% 572,649 522,757 9.5% 1,685,835 1,546,186 9.0% Asheville 8.5% 11 662,500 4,650 $12.34 $12.41 92.2% 88.0% 4.2% 1,809,817 1,735,084 4.3% 512,381 479,553 6.8% 1,297,436 1,255,531 3.3% San Francisco - Oakland 7.6% 4 320,000 2,890 $20.83 $20.02 93.0% 88.1% 4.9% 1,628,791 1,474,188 10.5% 468,092 445,798 5.0% 1,160,699 1,028,390 12.9% Las Vegas 5.1% 3 290,400 2,220 $14.40 $14.41 92.5% 88.1% 4.3% 982,506 912,936 7.6% 205,677 185,335 11.0% 776,829 727,601 6.8% Detroit 3.9% 4 261,000 2,180 $12.49 $12.18 93.0% 88.8% 4.3% 814,199 763,604 6.6% 213,695 181,577 17.7% 600,504 582,027 3.2% Dayton 3.7% 7 384,400 3,210 $9.68 $9.13 90.9% 87.9% 3.0% 932,663 833,458 11.9% 365,655 327,915 11.5% 567,008 505,543 12.2% Myrtle Beach 2.5% 2 194,600 1,420 $12.02 $12.76 88.7% 84.4% 4.3% 520,511 517,115 0.7% 132,356 123,976 6.8% 388,155 393,139 -1.3% Denver 2.4% 4 227,200 2,140 $12.32 $12.29 89.6% 84.2% 5.4% 681,477 641,398 6.2% 314,682 348,050 -9.6% 366,795 293,348 25.0% Port St. Lucie 2.2% 2 167,000 1,250 $13.85 $14.76 92.4% 89.1% 3.3% 493,721 485,752 1.6% 156,537 236,457 -33.8% 337,184 249,295 35.3% Baltimore 1.9% 1 117,700 1,080 $16.21 $17.23 89.7% 82.8% 6.9% 408,962 406,516 0.6% 114,774 117,564 -2.4% 294,188 288,952 1.8% Raleigh - Cary 1.5% 3 159,600 1,070 $10.42 $11.10 92.2% 84.8% 7.4% 396,588 374,983 5.8% 164,566 142,200 15.7% 232,022 232,783 -0.3% Riverside - SB 2.5% 2 117,500 1,180 $16.84 $15.63 96.9% 89.3% 7.6% 522,861 444,667 17.6% 134,646 128,205 5.0% 388,215 316,462 22.7% Other 10.4% 13 860,200 7,710 $14.31 $13.98 92.0% 86.9% 5.1% 2,983,543 2,678,409 11.4% 1,397,666 1,134,691 23.2% 1,585,877 1,543,718 2.7% Total Same-Store 100.0% 83 6,029,600 51,330 $15.53 $15.27 92.3% 88.3% 4.0% 22,123,930 20,558,313 7.6% 6,870,014 6,690,834 2.6% 15,253,916 13,867,479 10.0% Net Rent / Occupied Avg. Occupancy Sq. Ft. for the Twelve for the Twelve Revenue for the Expenses for the NOI for the Twelve Months Ended Months Ended Twelve Months Ended Twelve Months Ended Months Ended Year-to-Date December 31,(2) December 31, December 31, December 31, December 31, % of # of % % % MSA/CMA(1) NOI Stores NRSF Units 2020 2019 2020 2019 Change 2020 2019 Change 2020 2019 Change 2020 2019 Change Miami - Fort Lauderdale 20.5% 9 940,000 7,880 $18.97 $18.96 90.5% 89.5% 1.1% 15,843,906 15,436,856 2.6% 4,200,406 4,601,809 -8.7% 11,643,500 10,835,047 7.5% Toronto 16.0% 10 840,100 7,860 $16.49 $16.00 92.3% 90.9% 1.5% 13,584,193 12,878,237 5.5% 4,503,105 5,111,295 -11.9% 9,081,088 7,766,942 16.9% Los Angeles 11.2% 8 487,400 4,590 $18.27 $17.66 92.1% 90.6% 1.4% 8,535,302 8,096,413 5.4% 2,192,494 2,332,719 -6.0% 6,342,808 5,763,694 10.0% Asheville 8.5% 11 662,500 4,650 $12.10 $12.24 90.4% 88.9% 1.6% 6,983,171 6,871,190 1.6% 2,143,115 2,144,907 -0.1% 4,840,056 4,726,283 2.4% San Francisco - Oakland 7.6% 4 320,000 2,890 $20.07 $19.84 90.2% 87.9% 2.3% 6,083,071 5,825,638 4.4% 1,772,952 1,873,899 -5.4% 4,310,119 3,951,739 9.1% Las Vegas 5.0% 3 290,400 2,220 $14.10 $14.20 90.2% 89.1% 1.1% 3,657,974 3,615,212 1.2% 818,074 839,436 -2.5% 2,839,900 2,775,776 2.3% Detroit 3.8% 4 261,000 2,180 $12.14 $12.06 90.3% 89.5% 0.8% 3,067,233 3,026,458 1.3% 879,338 907,334 -3.1% 2,187,895 2,119,124 3.2% Dayton 3.7% 7 384,400 3,210 $9.26 $8.66 91.4% 90.1% 1.3% 3,550,079 3,223,529 10.1% 1,461,175 1,426,491 2.4% 2,088,904 1,797,038 16.2% Myrtle Beach 2.7% 2 194,600 1,420 $12.05 $12.88 88.0% 85.4% 2.6% 2,052,787 2,109,003 -2.7% 535,750 566,467 -5.4% 1,517,037 1,542,536 -1.7% Denver 2.4% 4 227,200 2,140 $12.03 $12.49 87.2% 83.8% 3.4% 2,598,487 2,583,046 0.6% 1,251,981 1,375,619 -9.0% 1,346,506 1,207,427 11.5% Port St. Lucie 1.8% 2 167,000 1,250 $13.98 $15.07 88.6% 88.1% 0.5% 1,860,181 1,937,185 -4.0% 844,534 983,227 -14.1% 1,015,647 953,958 6.5% Baltimore 2.0% 1 117,700 1,080 $15.86 $17.15 89.2% 83.2% 6.0% 1,608,204 1,636,319 -1.7% 464,773 534,546 -13.1% 1,143,431 1,101,773 3.8% Raleigh - Cary 1.5% 3 159,600 1,070 $10.39 $10.95 89.3% 86.1% 3.2% 1,518,063 1,502,334 1.0% 645,998 679,387 -4.9% 872,065 822,947 6.0% Riverside - SB 2.5% 2 117,500 1,180 $15.98 $15.50 94.0% 89.9% 4.0% 1,914,333 1,761,533 8.7% 502,867 536,314 -6.2% 1,411,466 1,225,219 15.2% Other 10.9% 13 860,200 7,710 $13.93 $13.96 89.8% 86.6% 3.1% 11,290,617 10,742,851 5.1% 5,084,709 4,576,681 11.1% 6,205,908 6,166,170 0.6% Total Same-Store 100.0% 83 6,029,600 51,330 $15.07 $15.01 90.6% 88.6% 2.0% 84,147,601 81,245,804 3.6% 27,301,271 28,490,131 -4.2% 56,846,330 52,755,673 7.8% 1. MSAs (Metropolitan Statistical Areas) as defined by the U.S. Census Bureau. Toronto CMA (Census Metropolitan Area) as defined by Statistics Canada. 2. RentPOF defined as rental revenue net of discounts & concessions, excluding late fees, admin fees and parking income, divided by occupied square feet of storage. SmartStop Self Storage REIT, Inc. | Financial Supplement 2020 Q4 21
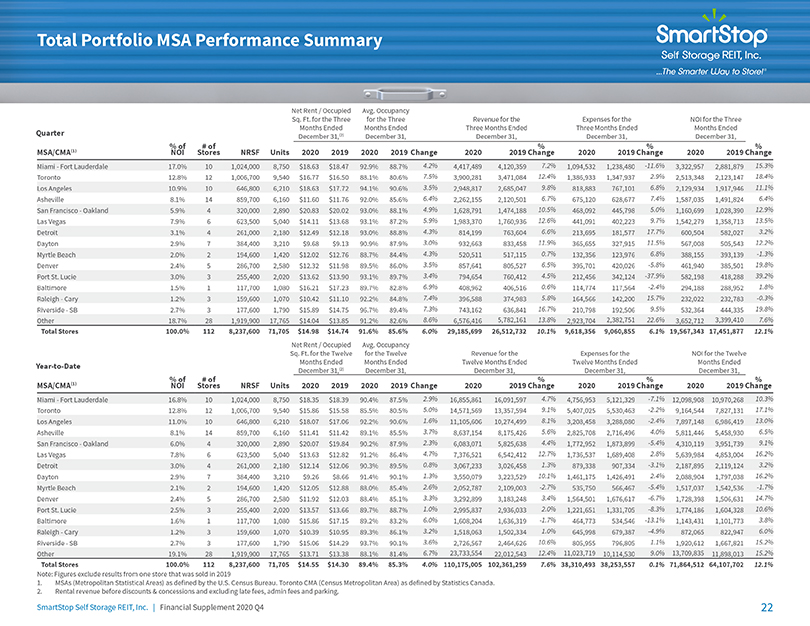
Total Portfolio MSA Performance Summary Net Rent / Occupied Avg. Occupancy Sq. Ft. for the Three for the Three Revenue for the Expenses for the NOI for the Three Months Ended Months Ended Three Months Ended Three Months Ended Months Ended Quarter December 31,(2) December 31, December 31, December 31, December 31, % of # of % % % MSA/CMA(1) NOI Stores NRSF Units 2020 2019 2020 2019 Change 2020 2019 Change 2020 2019 Change 2020 2019 Change Miami - Fort Lauderdale 17.0% 10 1,024,000 8,750 $18.63 $18.47 92.9% 88.7% 4.2% 4,417,489 4,120,359 7.2% 1,094,532 1,238,480 -11.6% 3,322,957 2,881,879 15.3% Toronto 12.8% 12 1,006,700 9,540 $16.77 $16.50 88.1% 80.6% 7.5% 3,900,281 3,471,084 12.4% 1,386,933 1,347,937 2.9% 2,513,348 2,123,147 18.4% Los Angeles 10.9% 10 646,800 6,210 $18.63 $17.72 94.1% 90.6% 3.5% 2,948,817 2,685,047 9.8% 818,883 767,101 6.8% 2,129,934 1,917,946 11.1% Asheville 8.1% 14 859,700 6,160 $11.60 $11.76 92.0% 85.6% 6.4% 2,262,155 2,120,501 6.7% 675,120 628,677 7.4% 1,587,035 1,491,824 6.4% San Francisco - Oakland 5.9% 4 320,000 2,890 $20.83 $20.02 93.0% 88.1% 4.9% 1,628,791 1,474,188 10.5% 468,092 445,798 5.0% 1,160,699 1,028,390 12.9% Las Vegas 7.9% 6 623,500 5,040 $14.11 $13.68 93.1% 87.2% 5.9% 1,983,370 1,760,936 12.6% 441,091 402,223 9.7% 1,542,279 1,358,713 13.5% Detroit 3.1% 4 261,000 2,180 $12.49 $12.18 93.0% 88.8% 4.3% 814,199 763,604 6.6% 213,695 181,577 17.7% 600,504 582,027 3.2% Dayton 2.9% 7 384,400 3,210 $9.68 $9.13 90.9% 87.9% 3.0% 932,663 833,458 11.9% 365,655 327,915 11.5% 567,008 505,543 12.2% Myrtle Beach 2.0% 2 194,600 1,420 $12.02 $12.76 88.7% 84.4% 4.3% 520,511 517,115 0.7% 132,356 123,976 6.8% 388,155 393,139 -1.3% Denver 2.4% 5 286,700 2,580 $12.32 $11.98 89.5% 86.0% 3.5% 857,641 805,527 6.5% 395,701 420,026 -5.8% 461,940 385,501 19.8% Port St. Lucie 3.0% 3 255,400 2,020 $13.62 $13.90 93.1% 89.7% 3.4% 794,654 760,412 4.5% 212,456 342,124 -37.9% 582,198 418,288 39.2% Baltimore 1.5% 1 117,700 1,080 $16.21 $17.23 89.7% 82.8% 6.9% 408,962 406,516 0.6% 114,774 117,564 -2.4% 294,188 288,952 1.8% Raleigh - Cary 1.2% 3 159,600 1,070 $10.42 $11.10 92.2% 84.8% 7.4% 396,588 374,983 5.8% 164,566 142,200 15.7% 232,022 232,783 -0.3% Riverside - SB 2.7% 3 177,600 1,790 $15.89 $14.75 96.7% 89.4% 7.3% 743,162 636,841 16.7% 210,798 192,506 9.5% 532,364 444,335 19.8% Other 18.7% 28 1,919,900 17,765 $14.04 $13.85 91.2% 82.6% 8.6% 6,576,416 5,782,161 13.8% 2,923,704 2,382,751 22.6% 3,652,712 3,399,410 7.6% Total Stores 100.0% 112 8,237,600 71,705 $14.98 $14.74 91.6% 85.6% 6.0% 29,185,699 26,512,732 10.1% 9,618,356 9,060,855 6.1% 19,567,343 17,451,877 12.1% Net Rent / Occupied Avg. Occupancy Sq. Ft. for the Twelve for the Twelve Revenue for the Expenses for the NOI for the Twelve Year-to-Date Months Ended Months Ended Twelve Months Ended Twelve Months Ended Months Ended December 31,(2) December 31, December 31, December 31, December 31, % of # of % % % MSA/CMA(1) NOI Stores NRSF Units 2020 2019 2020 2019 Change 2020 2019 Change 2020 2019 Change 2020 2019 Change Miami - Fort Lauderdale 16.8% 10 1,024,000 8,750 $18.35 $18.39 90.4% 87.5% 2.9% 16,855,861 16,091,597 4.7% 4,756,953 5,121,329 -7.1% 12,098,908 10,970,268 10.3% Toronto 12.8% 12 1,006,700 9,540 $15.86 $15.58 85.5% 80.5% 5.0% 14,571,569 13,357,594 9.1% 5,407,025 5,530,463 -2.2% 9,164,544 7,827,131 17.1% Los Angeles 11.0% 10 646,800 6,210 $18.07 $17.06 92.2% 90.6% 1.6% 11,105,606 10,274,499 8.1% 3,208,458 3,288,080 -2.4% 7,897,148 6,986,419 13.0% Asheville 8.1% 14 859,700 6,160 $11.41 $11.42 89.1% 85.5% 3.7% 8,637,154 8,175,426 5.6% 2,825,708 2,716,496 4.0% 5,811,446 5,458,930 6.5% San Francisco - Oakland 6.0% 4 320,000 2,890 $20.07 $19.84 90.2% 87.9% 2.3% 6,083,071 5,825,638 4.4% 1,772,952 1,873,899 -5.4% 4,310,119 3,951,739 9.1% Las Vegas 7.8% 6 623,500 5,040 $13.63 $12.82 91.2% 86.4% 4.7% 7,376,521 6,542,412 12.7% 1,736,537 1,689,408 2.8% 5,639,984 4,853,004 16.2% Detroit 3.0% 4 261,000 2,180 $12.14 $12.06 90.3% 89.5% 0.8% 3,067,233 3,026,458 1.3% 879,338 907,334 -3.1% 2,187,895 2,119,124 3.2% Dayton 2.9% 7 384,400 3,210 $9.26 $8.66 91.4% 90.1% 1.3% 3,550,079 3,223,529 10.1% 1,461,175 1,426,491 2.4% 2,088,904 1,797,038 16.2% Myrtle Beach 2.1% 2 194,600 1,420 $12.05 $12.88 88.0% 85.4% 2.6% 2,052,787 2,109,003 -2.7% 535,750 566,467 -5.4% 1,517,037 1,542,536 -1.7% Denver 2.4% 5 286,700 2,580 $11.92 $12.03 88.4% 85.1% 3.3% 3,292,899 3,183,248 3.4% 1,564,501 1,676,617 -6.7% 1,728,398 1,506,631 14.7% Port St. Lucie 2.5% 3 255,400 2,020 $13.57 $13.66 89.7% 88.7% 1.0% 2,995,837 2,936,033 2.0% 1,221,651 1,331,705 -8.3% 1,774,186 1,604,328 10.6% Baltimore 1.6% 1 117,700 1,080 $15.86 $17.15 89.2% 83.2% 6.0% 1,608,204 1,636,319 -1.7% 464,773 534,546 -13.1% 1,143,431 1,101,773 3.8% Raleigh - Cary 1.2% 3 159,600 1,070 $10.39 $10.95 89.3% 86.1% 3.2% 1,518,063 1,502,334 1.0% 645,998 679,387 -4.9% 872,065 822,947 6.0% Riverside - SB 2.7% 3 177,600 1,790 $15.06 $14.29 93.7% 90.1% 3.6% 2,726,567 2,464,626 10.6% 805,955 796,805 1.1% 1,920,612 1,667,821 15.2% Other 19.1% 28 1,919,900 17,765 $13.71 $13.38 88.1% 81.4% 6.7% 23,733,554 22,012,543 12.4% 11,023,719 10,114,530 9.0% 13,709,835 11,898,013 15.2% Total Stores 100.0% 112 8,237,600 71,705 $14.55 $14.30 89.4% 85.3% 4.0% 110,175,005 102,361,259 7.6% 38,310,493 38,253,557 0.1% 71,864,512 64,107,702 12.1% Note: Figures exclude results from one store that was sold in 2019 1. MSAs (Metropolitan Statistical Areas) as defined by the U.S. Census Bureau. Toronto CMA (Census Metropolitan Area) as defined by Statistics Canada. 2. Rental revenue before discounts & concessions and excluding late fees, admin fees and parking. SmartStop Self Storage REIT, Inc. | Financial Supplement 2020 Q4 22
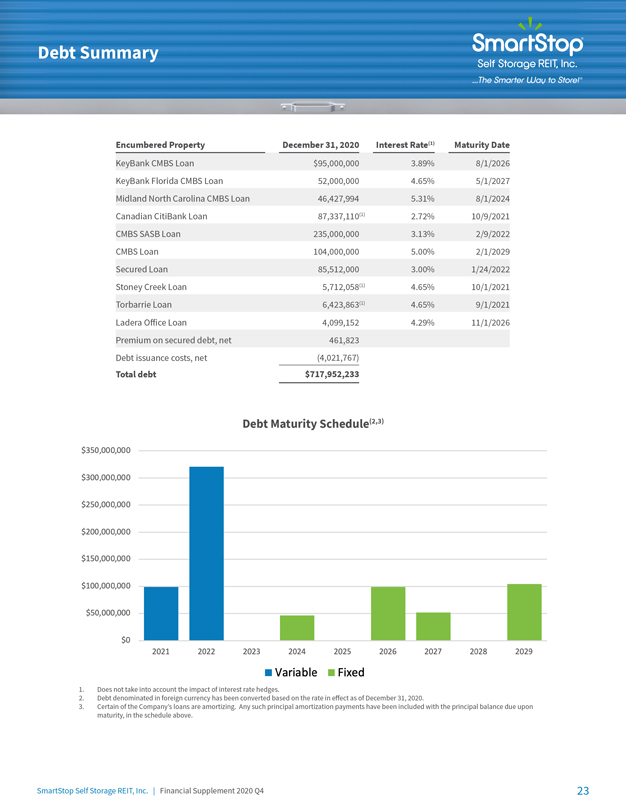
Debt Summary Encumbered Property December 31, 2020 Interest Rate(1) Maturity Date KeyBank CMBS Loan $95,000,000 3.89% 8/1/2026 KeyBank Florida CMBS Loan 52,000,000 4.65% 5/1/2027 Midland North Carolina CMBS Loan 46,427,994 5.31% 8/1/2024 Canadian CitiBank Loan 87,337,110(1) 2.72% 10/9/2021 CMBS SASB Loan 235,000,000 3.13% 2/9/2022 CMBS Loan 104,000,000 5.00% 2/1/2029 Secured Loan 85,512,000 3.00% 1/24/2022 Stoney Creek Loan 5,712,058(1) 4.65% 10/1/2021 Torbarrie Loan 6,423,863(1) 4.65% 9/1/2021 Ladera Office Loan 4,099,152 4.29% 11/1/2026 Premium on secured debt, net 461,823 Debt issuance costs, net (4,021,767) Total debt $717,952,233 Debt Maturity Schedule(2,3) 1. Does not take into account the impact of interest rate hedges. 2. Debt denominated in foreign currency has been converted based on the rate in effect as of December 31, 2020. 3. Certain of the Company’s loans are amortizing. Any such principal amortization payments have been included with the principal balance due upon maturity, in the schedule above. SmartStop Self Storage REIT, Inc. | Financial Supplement 2020 Q4 23
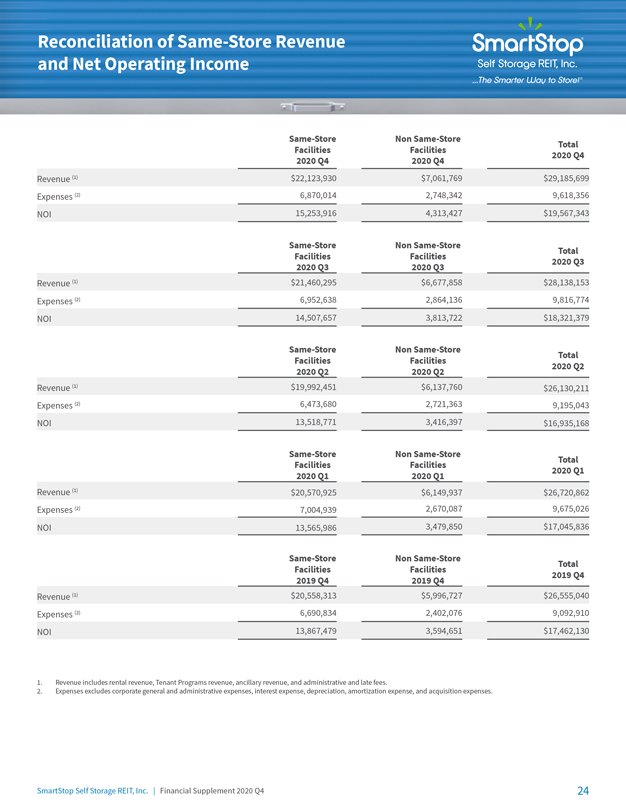
Reconciliation of Same-Store Revenue and Net Operating Income Same-Store Non Same-Store Total Facilities Facilities 2020 Q4 2020 Q4 2020 Q4 Revenue (1) $22,123,930 $7,061,769 $29,185,699 Expenses (2) 6,870,014 2,748,342 9,618,356 NOI 15,253,916 4,313,427 $19,567,343 Same-Store Non Same-Store Total Facilities Facilities 2020 Q3 2020 Q3 2020 Q3 Revenue (1) $21,460,295 $6,677,858 $28,138,153 Expenses (2) 6,952,638 2,864,136 9,816,774 NOI 14,507,657 3,813,722 $18,321,379 Same-Store Non Same-Store Total Facilities Facilities 2020 Q2 2020 Q2 2020 Q2 Revenue (1) $19,992,451 $6,137,760 $26,130,211 Expenses (2) 6,473,680 2,721,363 9,195,043 NOI 13,518,771 3,416,397 $16,935,168 Same-Store Non Same-Store Total Facilities Facilities 2020 Q1 2020 Q1 2020 Q1 Revenue (1) $20,570,925 $6,149,937 $26,720,862 Expenses (2) 7,004,939 2,670,087 9,675,026 NOI 13,565,986 3,479,850 $17,045,836 Same-Store Non Same-Store Total Facilities Facilities 2019 Q4 2019 Q4 2019 Q4 Revenue (1) $20,558,313 $5,996,727 $26,555,040 Expenses (2) 6,690,834 2,402,076 9,092,910 NOI 13,867,479 3,594,651 $17,462,130 1. Revenue includes rental revenue, Tenant Programs revenue, ancillary revenue, and administrative and late fees. 2. Expenses excludes corporate general and administrative expenses, interest expense, depreciation, amortization expense, and acquisition expenses. SmartStop Self Storage REIT, Inc. | Financial Supplement 2020 Q4 24
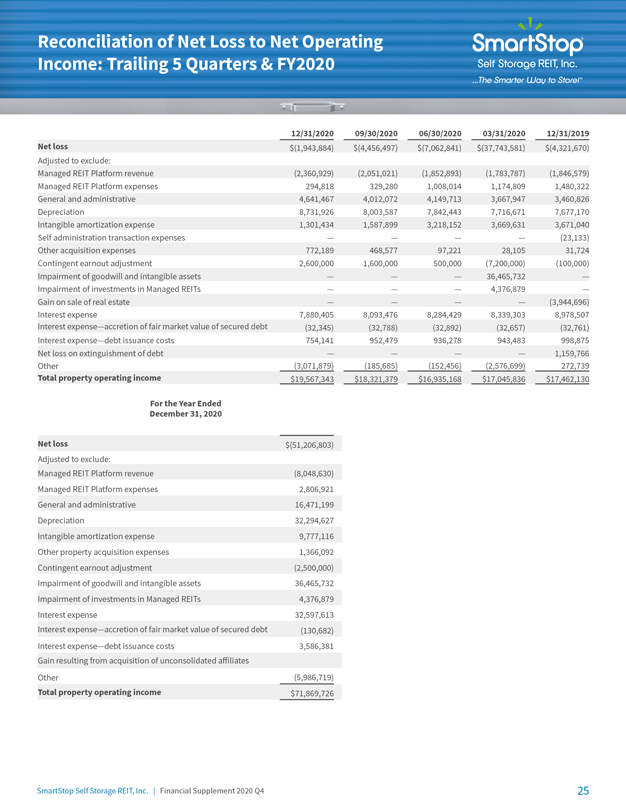
Reconciliation of Net Loss to Net Operating Income: Trailing 5 Quarters & FY2020 12/31/202009/30/202006/30/202003/31/202012/31/2019 Net loss$(1,943,884)$(4,456,497)$(7,062,841)$(37,743,581)$(4,321,670) Adjusted to exclude: Managed REIT Platform revenue(2,360,929)(2,051,021)(1,852,893)(1,783,787)(1,846,579) Managed REIT Platform expenses294,818329,2801,008,0141,174,8091,480,322 General and administrative4,641,4674,012,0724,149,7133,667,9473,460,826 Depreciation8,731,9268,003,5877,842,4437,716,6717,677,170 Intangible amortization expense1,301,4341,587,8993,218,1523,669,6313,671,040 Self administration transaction expenses————(23,133) Other acquisition expenses772,189468,57797,22128,10531,724 Contingent earnout adjustment 2,600,0001,600,000500,000(7,200,000)(100,000) Impairment of goodwill and intangible assets———36,465,732— Impairment of investments in Managed REITs———4,376,879— Gain on sale of real estate————(3,944,696) Interest expense7,880,4058,093,4768,284,4298,339,3038,978,507 Interest expense—accretion of fair market value of secured debt(32,345)(32,788)(32,892)(32,657)(32,761) Interest expense—debt issuance costs754,141952,479936,278943,483998,875 Net loss on extinguishment of debt————1,159,766 Other(3,071,879)(185,685)(152,456)(2,576,699)272,739 Total property operating income$19,567,343$18,321,379$16,935,168$17,045,836$17,462,130 For the Year Ended December 31, 2020 Net loss$(51,206,803) Adjusted to exclude: Managed REIT Platform revenue(8,048,630) Managed REIT Platform expenses2,806,921 General and administrative16,471,199 Depreciation32,294,627 Intangible amortization expense9,777,116 Other property acquisition expenses1,366,092 Contingent earnout adjustment (2,500,000) Impairment of goodwill and intangible assets36,465,732 Impairment of investments in Managed REITs4,376,879 Interest expense32,597,613 Interest expense—accretion of fair market value of secured debt(130,682) Interest expense—debt issuance costs3,586,381 Gain resulting from acquisition of unconsolidated affiliates Other(5,986,719) Total property operating income$71,869,726 SmartStop Self Storage REIT, Inc. | Financial Supplement 2020 Q4 25
Forward Looking Statements Certain of the matters discussed in this communication constitute forward-looking statements within the meaning of the safe harbor provisions of the Private Securities Litigation Reform Act of 1995. Such forward-looking statements can generally be identified by our use of forward-looking terminology such as “may,” “will,” “expect,” “intend,” “anticipate,” “estimate,” “believe,” “continue,” or other similar words. Readers are cautioned not to place undue reliance on these forward-looking statements and any such forward-looking statements are qualified in their entirety by reference to the following cautionary statements. All forward-looking statements speak only as of the date hereof and are based on current expectations and involve a number of assumptions, risks and uncertainties that could cause the actual results to differ materially from such forward-looking statements. Such forward-looking statements include, but are not limited to, statements about the expected effects and benefits of the SST IV merger, the SSGT merger, the self administration transaction and the Series A Preferred equity investment, including anticipated future financial and operating results and synergies, as well as all other statements in this communication, other than historical facts. There are several factors which could cause actual plans and results to differ materially from those expressed or implied in forward-looking statements, including, without limitation, the following: (i) risks related to disruption of management’s attention from SmartStop’s ongoing business operations due to the SST IV merger, the self administration transaction, or other business matters; (ii) significant transaction costs, including financing costs, and unknown liabilities; (iii) failure to realize the expected benefits and synergies of either of the SST IV merger, the SSGT merger or the self administration transaction in the expected timeframes or at all; (iv) costs or difficulties related to the integration of acquired self storage facilities and operations, including facilities acquired through the SST IV merger, the SSGT merger and operations acquired through the self administration transaction; (v) changes in the political and economic climate, economic conditions and fiscal imbalances in the United States, and other major developments, including wars, natural disasters, epidemics and pandemics, including the outbreak of novel coronavirus (COVID-19), military actions, and terrorist attacks; (vi) changes in tax and other laws and regulations; or (vii) difficulties in SmartStop’s ability to attract and retain qualified personnel and management. Actual results may differ materially from those indicated by such forward-looking statements. In addition, the forward-looking statements represent SmartStop’s views as of the date on which such statements were made. SmartStop anticipates that subsequent events and developments may cause its views to change. These forward-looking statements should not be relied upon as representing SmartStop’s views as of any date subsequent to the date hereof. Additional factors that may affect the business or financial results of SmartStop are described in the risk factors included in SmartStop’s filings with the SEC, including SmartStop’s Annual Report on Form 10-K for the fiscal year ended December 31, 2020 and subsequent Quarterly Reports on Form 10-Q and Current Reports on Form 8-K, which factors are incorporated herein by reference, all of which are filed with the SEC and available at www.sec.gov. SmartStop expressly disclaims a duty to provide updates to forward-looking statements, whether as a result of new information, future events or other occurrences. SmartStop Self Storage REIT, Inc. | Financial Supplement 2020 Q4 26
Smart Stop Self Storage REIT, Inc. …The Smarter Way to Storl