Attached files
| file | filename |
|---|---|
| 8-K - 8-K - LCI INDUSTRIES | lcii-20210610.htm |
LCI Industries Investor Presentation June 2021 1
FORWARD-LOOKING STATEMENTS This presentation contains certain “forward-looking statements” with respect to our financial condition, results of operations, business strategies, operating efficiencies or synergies, competitive position, growth opportunities, acquisitions, plans and objectives of management, markets for the Company’s common stock, the impact of legal proceedings, and other matters. Statements in this presentation that are not historical facts are “forward-looking statements” for the purpose of the safe harbor provided by Section 21E of the Securities Exchange Act of 1934, as amended, and Section 27A of the Securities Act of 1933, as amended, and involve a number of risks and uncertainties. Forward-looking statements, including, without limitation, those relating to the Company's future business prospects, net sales, expenses and income (loss), capital expenditures, tax rate, cash flow, financial condition, liquidity, covenant compliance, retail and wholesale demand, integration of acquisitions, R&D investments, and industry trends, whenever they occur in this presentation are necessarily estimates reflecting the best judgment of the Company's senior management at the time such statements were made. There are a number of factors, many of which are beyond the Company’s control, which could cause actual results and events to differ materially from those described in the forward-looking statements. These factors include, in addition to other matters described in this presentation, the impacts of COVID-19, or other future pandemics, on the global economy and on the Company's customers, suppliers, employees, business and cash flows, pricing pressures due to domestic and foreign competition, costs and availability of, and tariffs on, raw materials (particularly steel and aluminum) and other components, seasonality and cyclicality in the industries to which we sell our products, availability of credit for financing the retail and wholesale purchase of products for which we sell our components, inventory levels of retail dealers and manufacturers, availability of transportation for products for which we sell our components, the financial condition of our customers, the financial condition of retail dealers of products for which we sell our components, retention and concentration of significant customers, the costs, pace of and successful integration of acquisitions and other growth initiatives, availability and costs of production facilities and labor, team member benefits, team member retention, realization and impact of expansion plans, efficiency improvements and cost reductions, the disruption of business resulting from natural disasters or other unforeseen events, the successful entry into new markets, the costs of compliance with environmental laws, laws of foreign jurisdictions in which we operate, other operational and financial risks related to conducting business internationally, and increased governmental regulation and oversight, information technology performance and security, the ability to protect intellectual property, warranty and product liability claims or product recalls, interest rates, oil and gasoline prices and availability, the impact of international, national and regional economic conditions and consumer confidence on the retail sale of products for which we sell our components, and other risks and uncertainties discussed more fully under the caption “Risk Factors” in the Company’s Annual Report on Form 10-K for the year ended December 31, 2020, and in the Company’s subsequent filings with the Securities and Exchange Commission. Readers of this presentation are cautioned not to place undue reliance on these forward-looking statements, since there can be no assurance that these forward-looking statements will prove to be accurate. The Company disclaims any obligation or undertaking to update forward-looking statements to reflect circumstances or events that occur after the date the forward-looking statements are made, except as required by law. This presentation includes certain non-GAAP financial measures, such as adjusted diluted earnings per share, EBITDA, adjusted EBITDA, net debt to EBITDA leverage, and free cash flow. These non-GAAP financial measures should not be considered a substitute for the comparable GAAP financial measures. Reconciliations of these non-GAAP financial measures to the most directly comparable GAAP financial measure are included in the Appendix to this presentation. This presentation also includes certain forward-looking non-GAAP financial measures, such as forward-looking targets for net debt to EBITDA leverage. The Company is unable to provide a reconciliation of forward-looking non-GAAP financial measures to their most directly comparable GAAP financial measures because the Company is unable to provide, without unreasonable effort, a meaningful or accurate calculation or estimation of amounts that would be necessary for the reconciliation due to the complexity and inherent difficulty in forecasting and quantifying future amounts or when they may occur. Such unavailable information could be significant to future results.
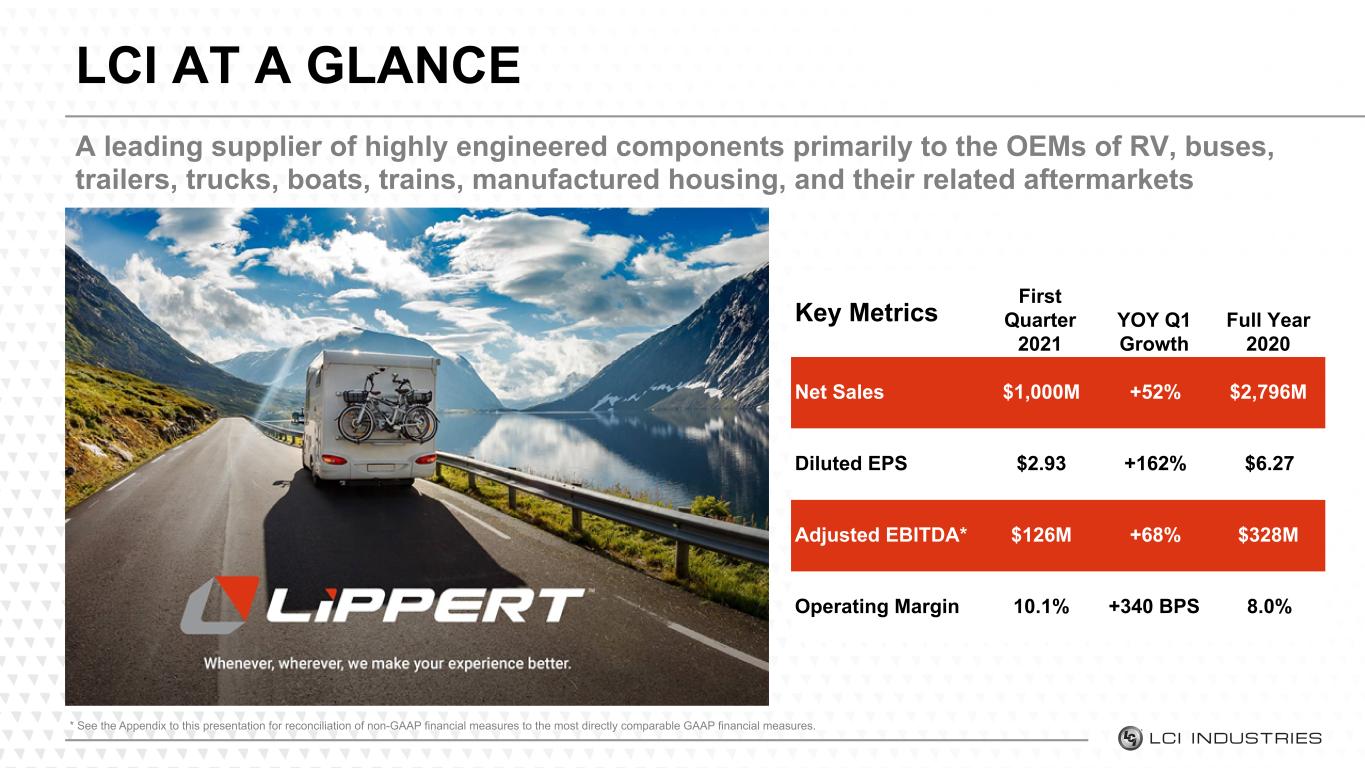
LCI AT A GLANCE A leading supplier of highly engineered components primarily to the OEMs of RV, buses, trailers, trucks, boats, trains, manufactured housing, and their related aftermarkets * See the Appendix to this presentation for reconciliation of non-GAAP financial measures to the most directly comparable GAAP financial measures. Key Metrics First Quarter 2021 YOY Q1 Growth Full Year 2020 Net Sales $1,000M +52% $2,796M Diluted EPS $2.93 +162% $6.27 Adjusted EBITDA* $126M +68% $328M Operating Margin 10.1% +340 BPS 8.0%
INVESTMENT APPEALS Our goal is to be a leading supplier for component parts manufacturing in the markets in which we compete Dominant Competitive Position Leading market share with unmatched depth and breadth of products, driven by compelling industry tailwinds supporting consistent, long-term growth Steep Growth Trajectory Proven strategy to support global expansion and diversification, leveraging core strengths to pursue growth opportunities in attractive adjacent industries Strong Culture Upheld by Veteran Leadership Deep culture rooted in innovation technology, and operational excellence, driven by experienced leadership team Balanced Capital Allocation Strong balance sheet and balanced capital deployment strategy with extensive track record of accretive M&A
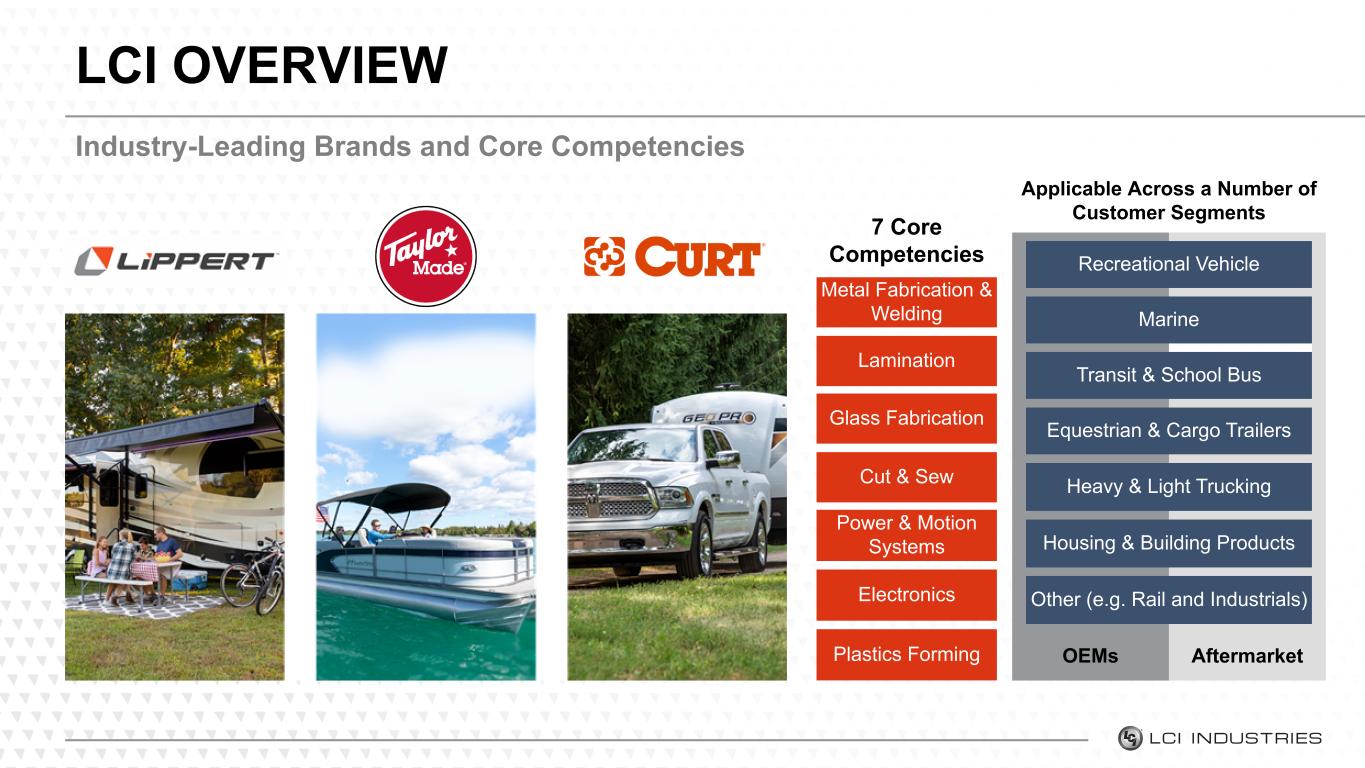
LCI OVERVIEW Industry-Leading Brands and Core Competencies 7 Core Competencies Metal Fabrication & Welding Lamination Glass Fabrication Cut & Sew Power & Motion Systems Electronics Plastics Forming Applicable Across a Number of Customer Segments Recreational Vehicle Marine Transit & School Bus Equestrian & Cargo Trailers Heavy & Light Trucking Housing & Building Products Other (e.g. Rail and Industrials) OEMs Aftermarket
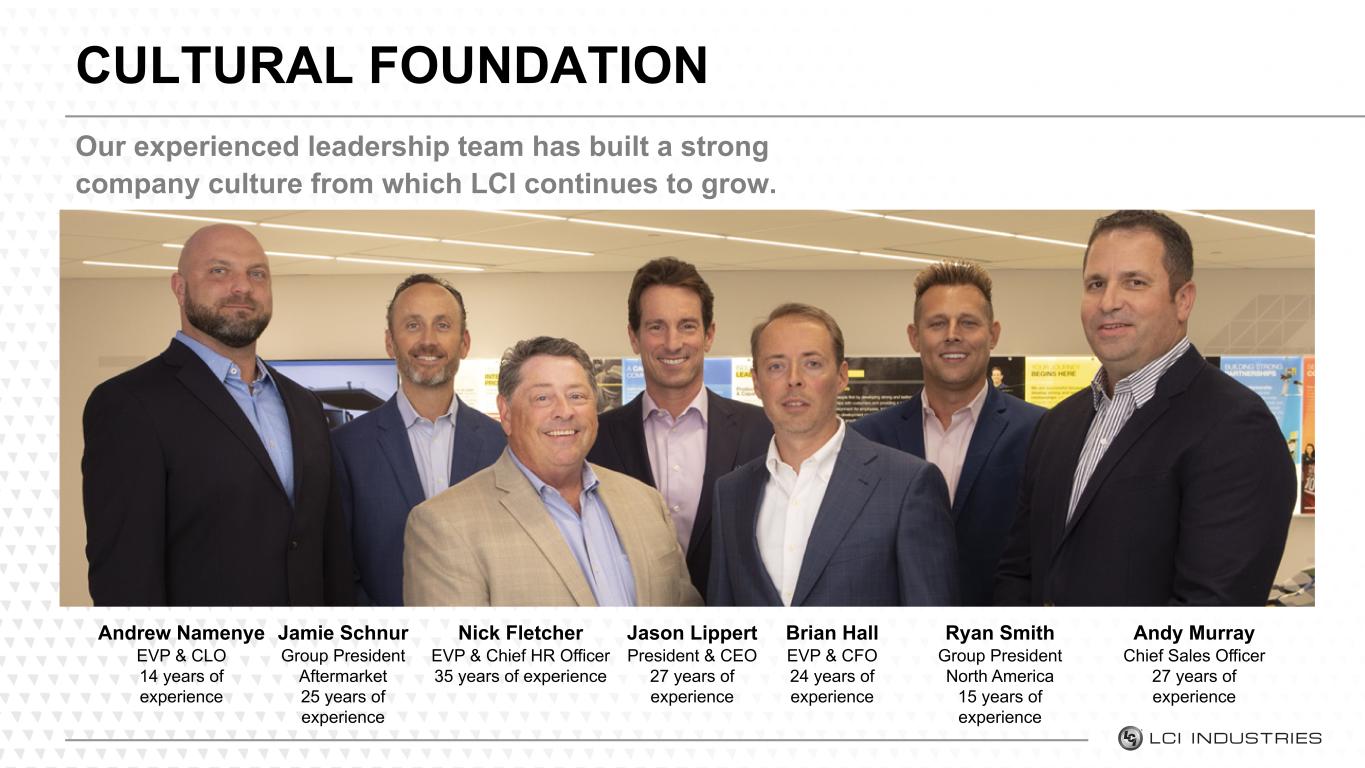
CULTURAL FOUNDATION Our experienced leadership team has built a strong company culture from which LCI continues to grow. Andrew Namenye EVP & CLO 14 years of experience Nick Fletcher EVP & Chief HR Officer 35 years of experience Jason Lippert President & CEO 27 years of experience Brian Hall EVP & CFO 24 years of experience Ryan Smith Group President North America 15 years of experience Andy Murray Chief Sales Officer 27 years of experience Jamie Schnur Group President Aftermarket 25 years of experience
CULTURAL FOUNDATION We strive to drive superior returns to all of our teams…our PEOPLE, our CUSTOMERS and our SHAREHOLDERS Striving to Lead Our passion to win, coupled with a robust growth strategy, drive us to be a leader in every market we enter Fostering Leadership and Leveraging our Culture to Grow Our workforce is our largest engine for growth, and we are focused on empowering our leadership and equipping the next generation of leaders within LCI to drive our performance over the long-term Focus on Quality and Innovation Our industry-leading innovation and the quality of our products lead to strong customer relationships and drive sales and profitability Operational Excellence Our culture of innovation, focus on team member retention, and experienced leadership team drive operational excellence
ESG FOCUS AREAS Driving long-term value creation through progress on ESG initiatives. Commitment to Sustainability Key Metrics and SASB Disclosure • 12,434.59 tons of trash to landfill • 2,293,057 lbs. of plastic from regrind recycled • 2,200,000 solar KW hours powered each year • Integrating SASB index into disclosures to enhance sustainability monitoring and reporting Environmental, Health & Safety Increased monitoring and transparency • Established Environmental Management System, certified under the International Organization for Standardization (ISO) to effectively monitor the impact of the Company’s operations on the environment • Increased threshold of Company-wide safety training, now required by 90% of LCI’s workforce each month Social & Community Involvement Strive to create meaningful change and inspire a culture of giving • 100,000 hours of community service within LCI communities • $1 million+ in donations to support community needs • Launched “Take the Step” program to improve and maintain healthy lifestyle among our employees Corporate Governance New and Updated Policies: Code of Conduct, Whistleblower and Conflict Minerals • Expanded Employee Code of Conduct to comply with best practices in labor management • Updated Whistleblower Policy to expand compliance and ethics training, improved reporting channels • Ongoing focus to expand Board diversity, most recently announced addition of Stephanie Mains
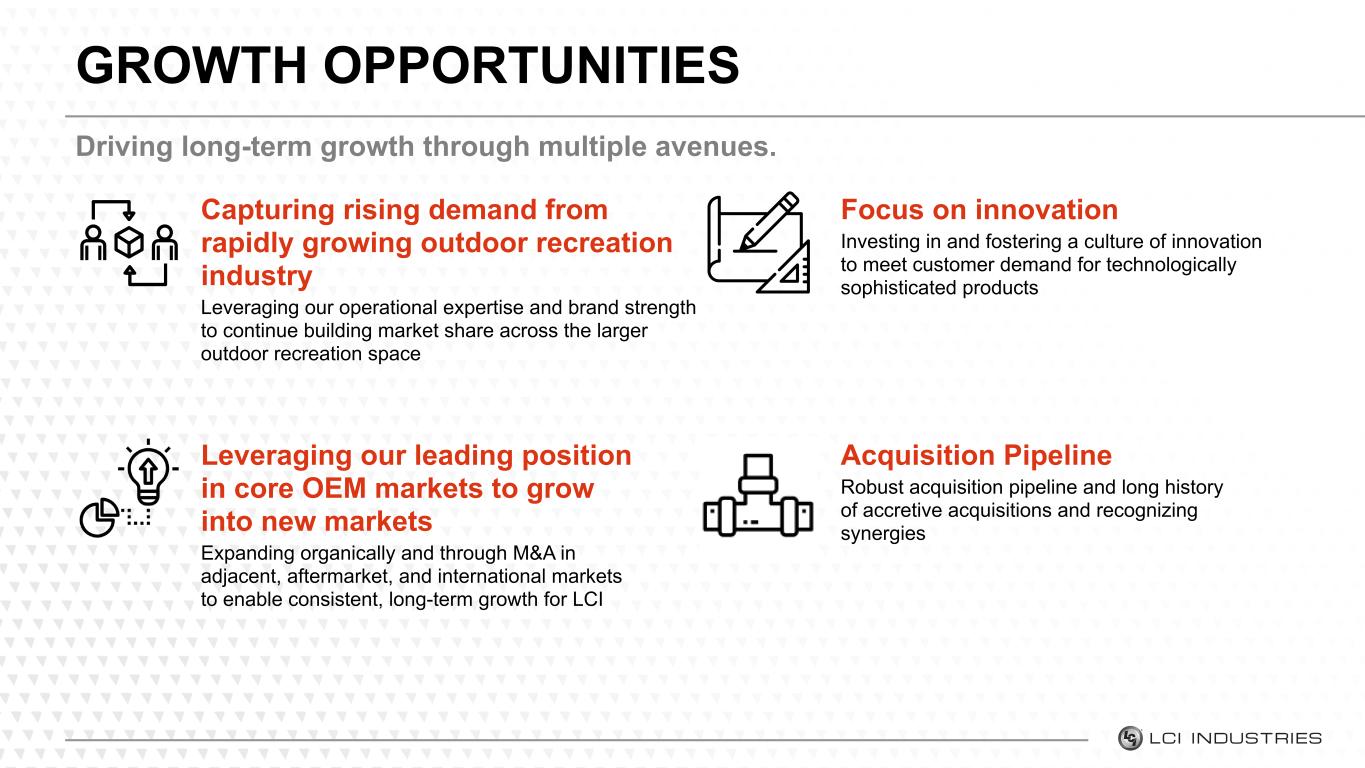
Leveraging our leading position in core OEM markets to grow into new markets Expanding organically and through M&A in adjacent, aftermarket, and international markets to enable consistent, long-term growth for LCI Capturing rising demand from rapidly growing outdoor recreation industry Leveraging our operational expertise and brand strength to continue building market share across the larger outdoor recreation space GROWTH OPPORTUNITIES Driving long-term growth through multiple avenues. Focus on innovation Investing in and fostering a culture of innovation to meet customer demand for technologically sophisticated products Acquisition Pipeline Robust acquisition pipeline and long history of accretive acquisitions and recognizing synergies
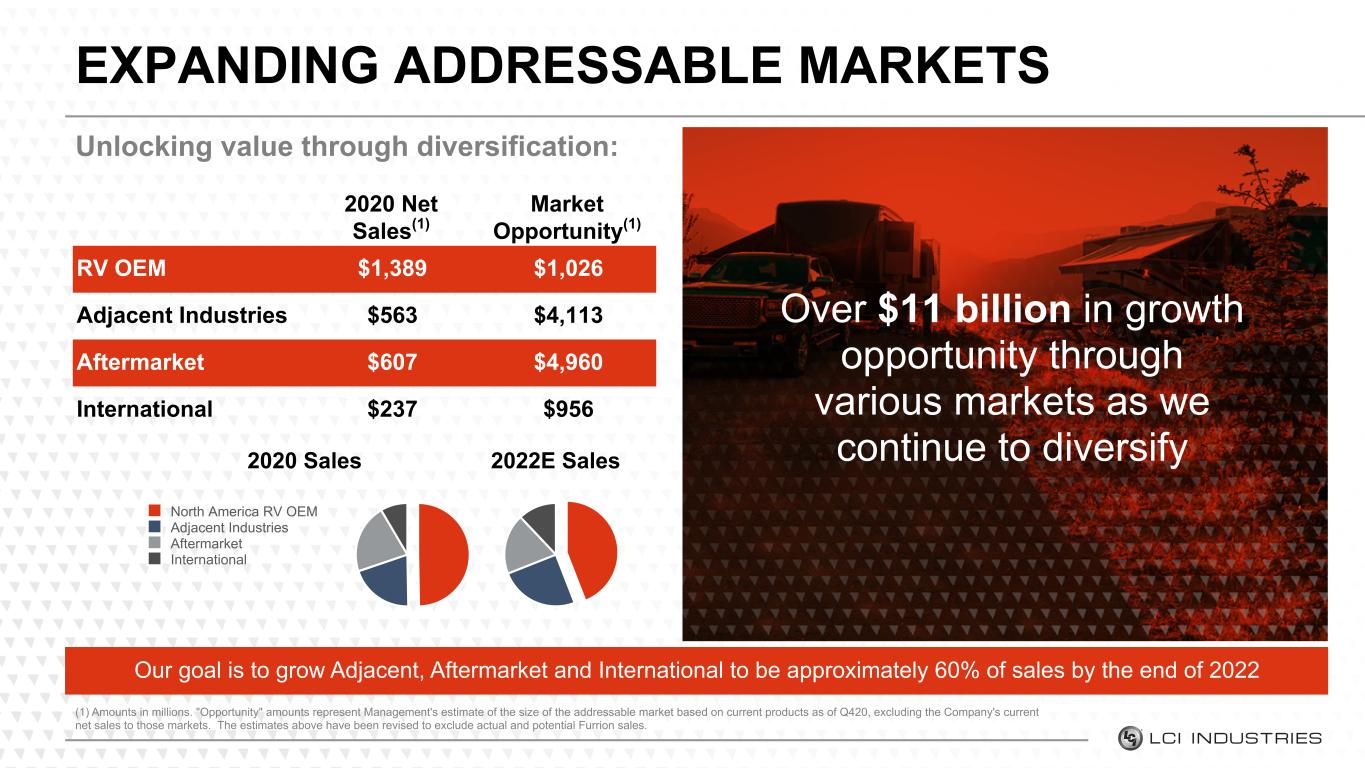
EXPANDING ADDRESSABLE MARKETS Unlocking value through diversification: (1) Amounts in millions. "Opportunity" amounts represent Management's estimate of the size of the addressable market based on current products as of Q420, excluding the Company's current net sales to those markets. The estimates above have been revised to exclude actual and potential Furrion sales. Our goal is to grow Adjacent, Aftermarket and International to be approximately 60% of sales by the end of 2022 Over $11 billion in growth opportunity through various markets as we continue to diversify 2020 Net Sales(1) Market Opportunity(1) RV OEM $1,389 $1,026 Adjacent Industries $563 $4,113 Aftermarket $607 $4,960 International $237 $956 2022E Sales2020 Sales North America RV OEM Adjacent Industries Aftermarket International

INNOVATIVE LEADERSHIP Leveraging our culture of innovation and technology: Our innovative culture brings technologically advanced products to a new generation of campers, enhancing the RV experience driving the success of our platforms Safety & Security Monitoring & Control Connected & Digital Comfort & Convenience
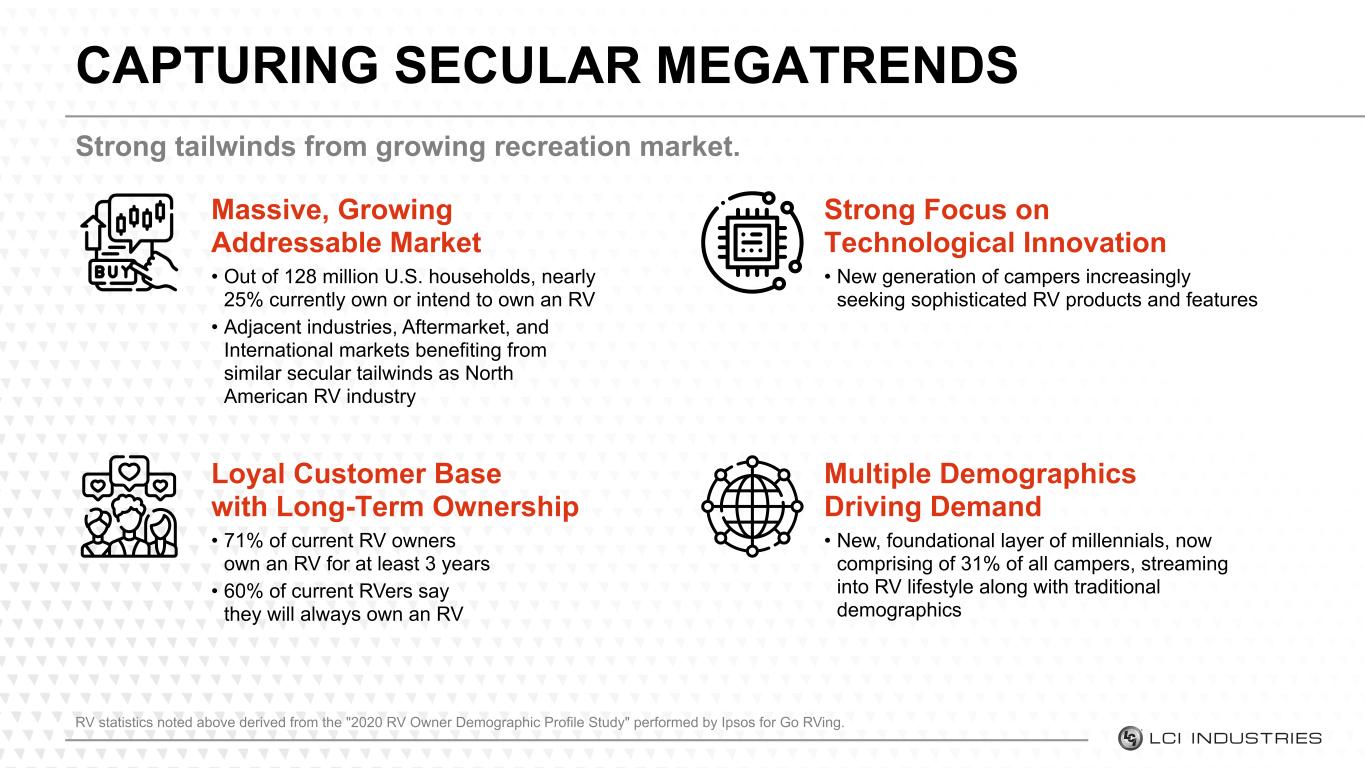
CAPTURING SECULAR MEGATRENDS Strong tailwinds from growing recreation market. Massive, Growing Addressable Market • Out of 128 million U.S. households, nearly 25% currently own or intend to own an RV • Adjacent industries, Aftermarket, and International markets benefiting from similar secular tailwinds as North American RV industry Strong Focus on Technological Innovation • New generation of campers increasingly seeking sophisticated RV products and features Loyal Customer Base with Long-Term Ownership • 71% of current RV owners own an RV for at least 3 years • 60% of current RVers say they will always own an RV Multiple Demographics Driving Demand • New, foundational layer of millennials, now comprising of 31% of all campers, streaming into RV lifestyle along with traditional demographics RV statistics noted above derived from the "2020 RV Owner Demographic Profile Study" performed by Ipsos for Go RVing.

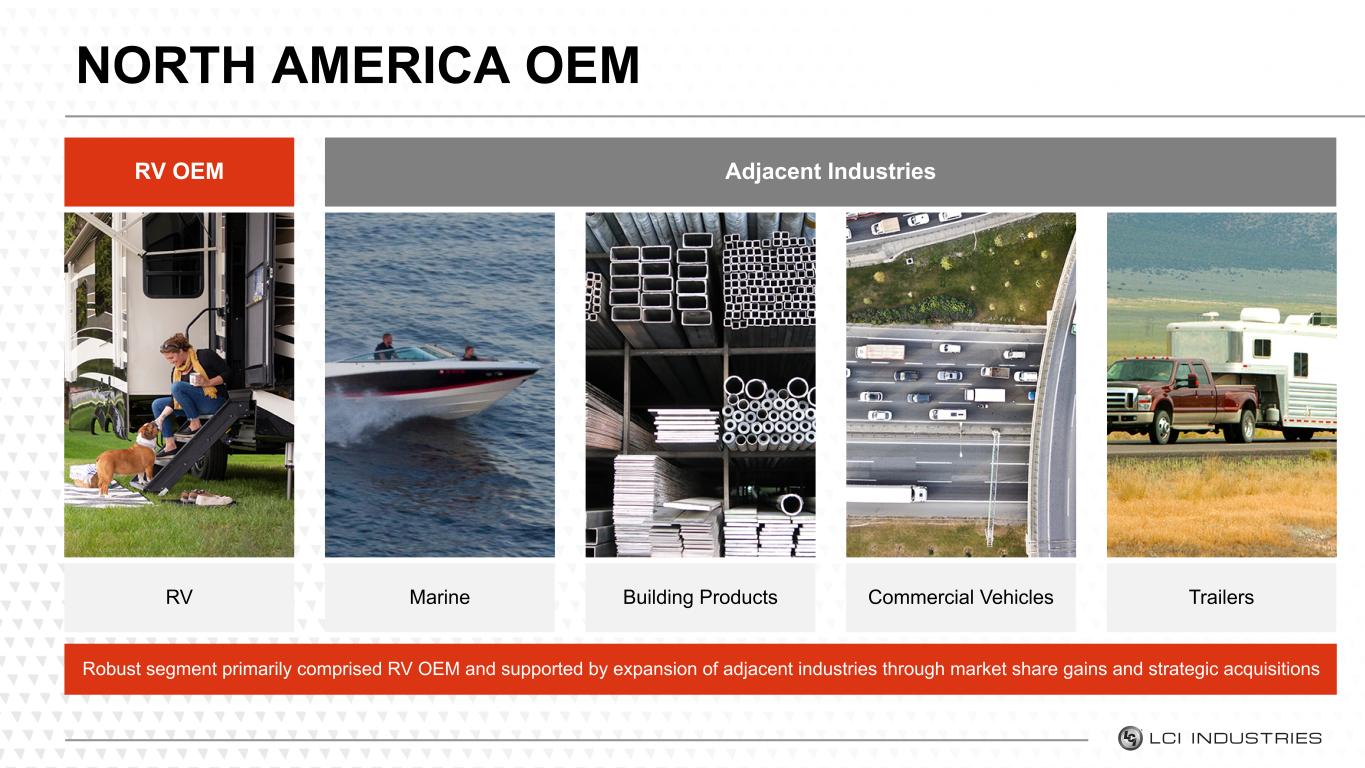
NORTH AMERICA OEM Robust segment primarily comprised RV OEM and supported by expansion of adjacent industries through market share gains and strategic acquisitions RV Building Products Commercial Vehicles TrailersMarine RV OEM Adjacent Industries
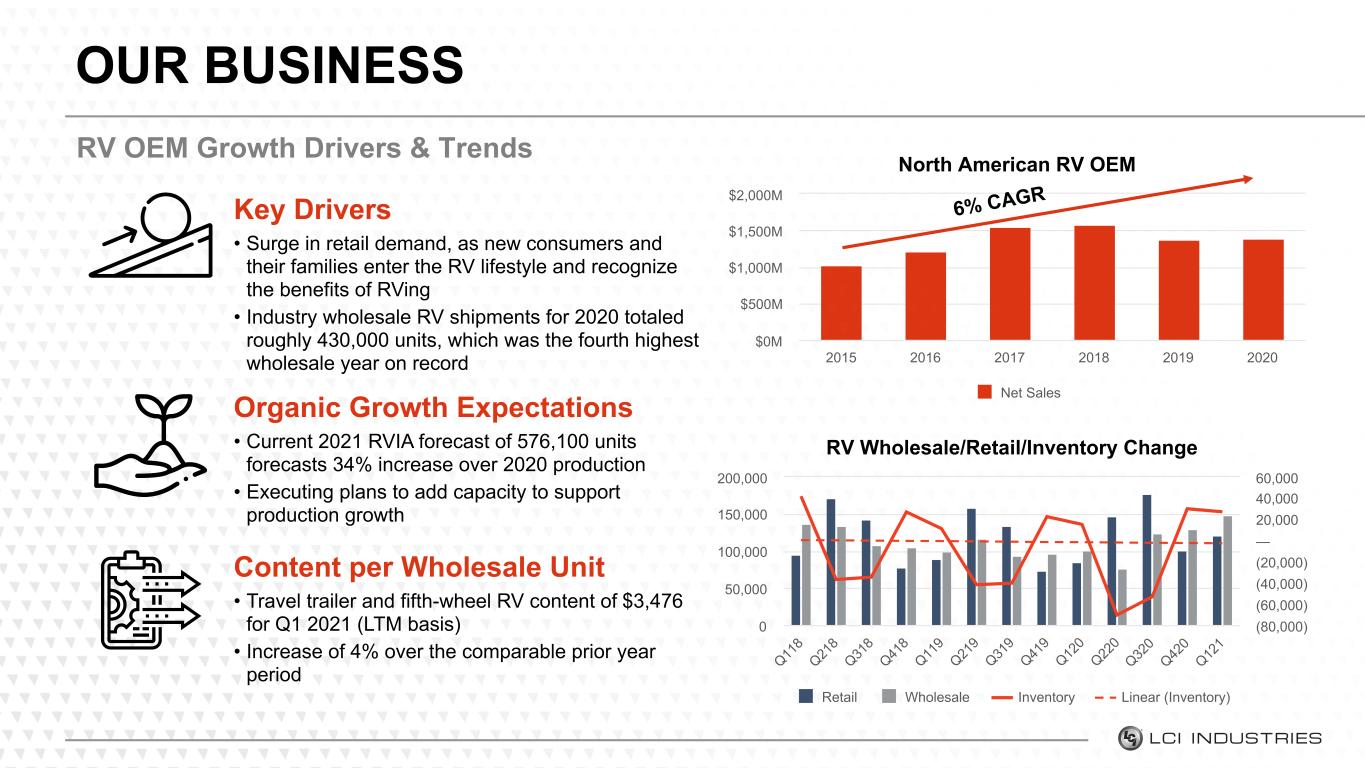
North American RV OEM Net Sales 2015 2016 2017 2018 2019 2020 $0M $500M $1,000M $1,500M $2,000M RV OEM Growth Drivers & Trends OUR BUSINESS 6% CAG RKey Drivers • Surge in retail demand, as new consumers and their families enter the RV lifestyle and recognize the benefits of RVing • Industry wholesale RV shipments for 2020 totaled roughly 430,000 units, which was the fourth highest wholesale year on record Organic Growth Expectations • Current 2021 RVIA forecast of 576,100 units forecasts 34% increase over 2020 production • Executing plans to add capacity to support production growth RV Wholesale/Retail/Inventory Change Retail Wholesale Inventory Linear (Inventory) Q1 18 Q2 18 Q3 18 Q4 18 Q1 19 Q2 19 Q3 19 Q4 19 Q1 20 Q2 20 Q3 20 Q4 20 Q1 21 0 50,000 100,000 150,000 200,000 (80,000) (60,000) (40,000) (20,000) — 20,000 40,000 60,000 Content per Wholesale Unit • Travel trailer and fifth-wheel RV content of $3,476 for Q1 2021 (LTM basis) • Increase of 4% over the comparable prior year period
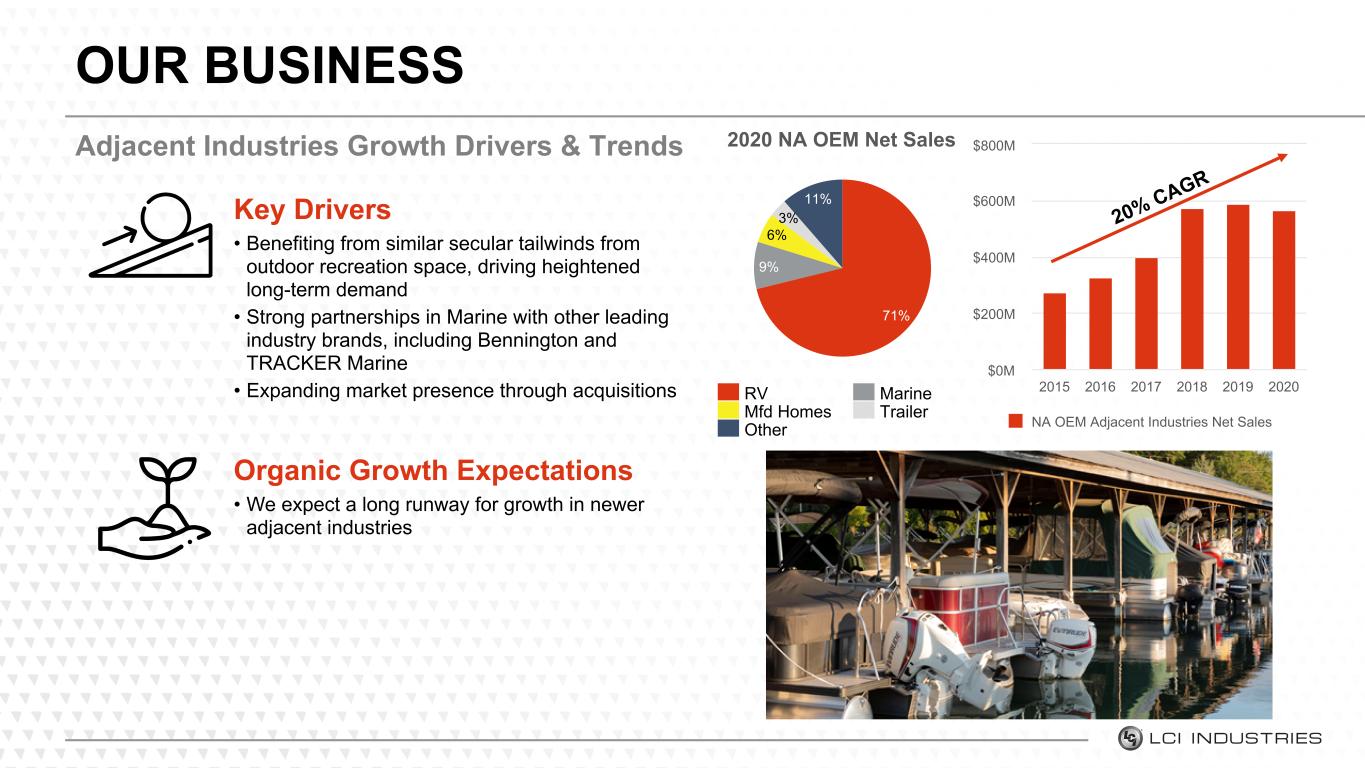
Adjacent Industries Growth Drivers & Trends OUR BUSINESS Key Drivers • Benefiting from similar secular tailwinds from outdoor recreation space, driving heightened long-term demand • Strong partnerships in Marine with other leading industry brands, including Bennington and TRACKER Marine • Expanding market presence through acquisitions Organic Growth Expectations • We expect a long runway for growth in newer adjacent industries NA OEM Adjacent Industries Net Sales 2015 2016 2017 2018 2019 2020 $0M $200M $400M $600M $800M 20% CA GR 2020 NA OEM Net Sales 71% 9% 6% 3% 11% RV Marine Mfd Homes Trailer Other

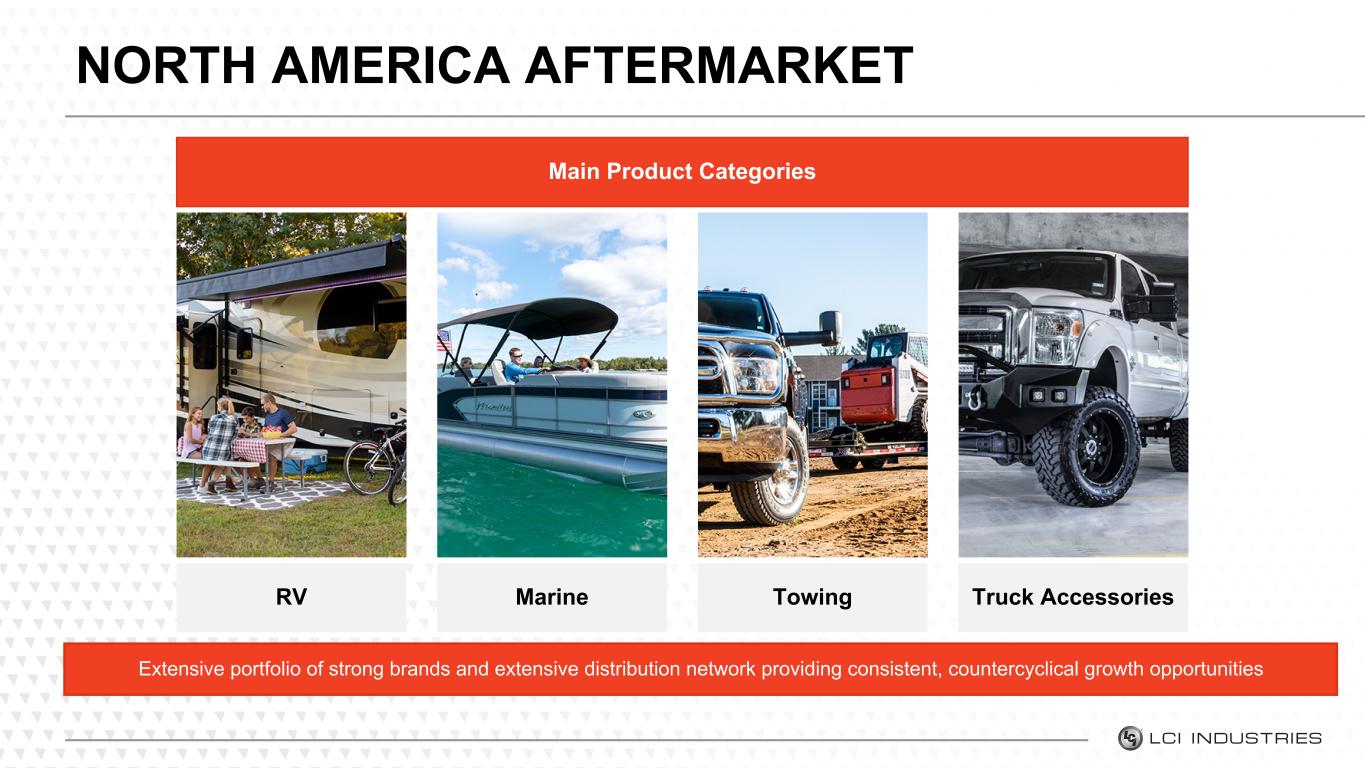
NORTH AMERICA AFTERMARKET Extensive portfolio of strong brands and extensive distribution network providing consistent, countercyclical growth opportunities Marine Towing Truck AccessoriesRV Main Product Categories
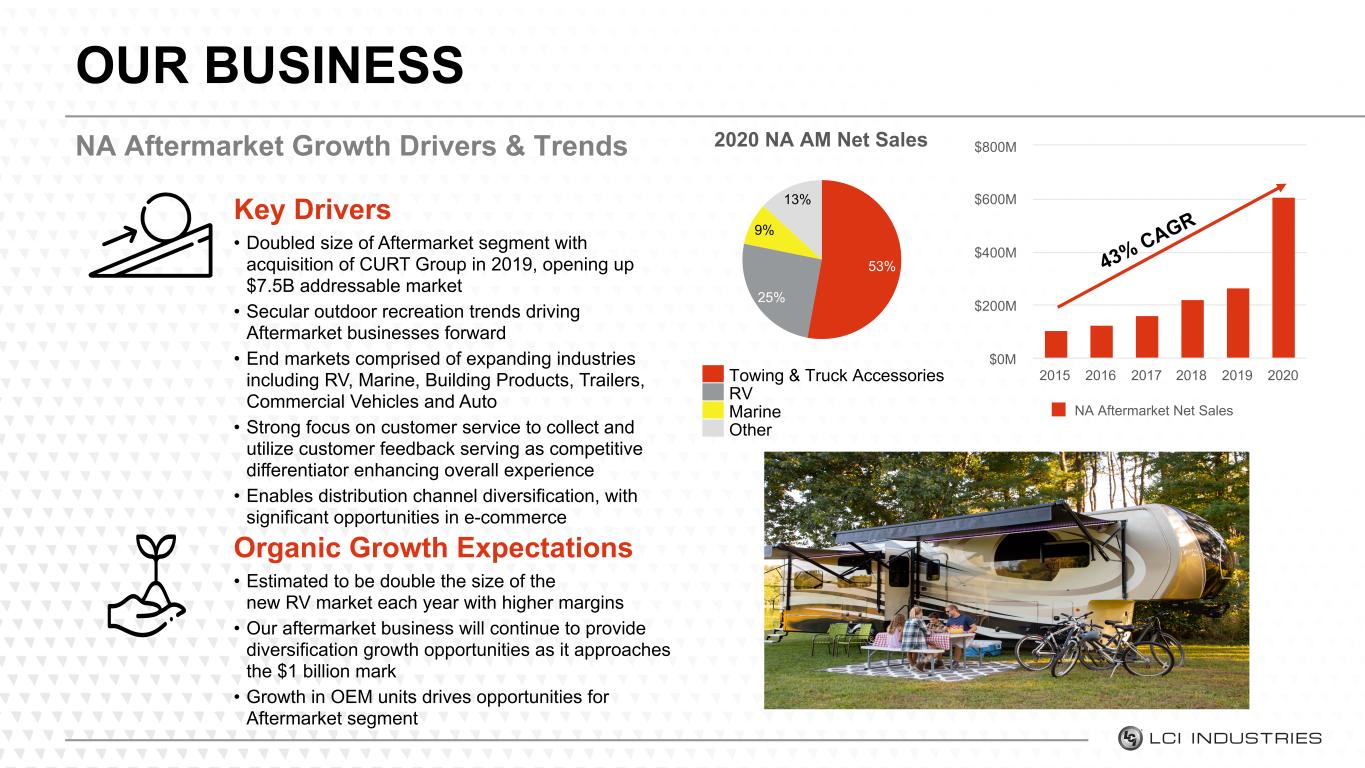
NA Aftermarket Growth Drivers & Trends OUR BUSINESS Key Drivers • Doubled size of Aftermarket segment with acquisition of CURT Group in 2019, opening up $7.5B addressable market • Secular outdoor recreation trends driving Aftermarket businesses forward • End markets comprised of expanding industries including RV, Marine, Building Products, Trailers, Commercial Vehicles and Auto • Strong focus on customer service to collect and utilize customer feedback serving as competitive differentiator enhancing overall experience • Enables distribution channel diversification, with significant opportunities in e-commerce Organic Growth Expectations • Estimated to be double the size of the new RV market each year with higher margins • Our aftermarket business will continue to provide diversification growth opportunities as it approaches the $1 billion mark • Growth in OEM units drives opportunities for Aftermarket segment NA Aftermarket Net Sales 2015 2016 2017 2018 2019 2020 $0M $200M $400M $600M $800M 43% CA GR 2020 NA AM Net Sales 53% 25% 9% 13% Towing & Truck Accessories RV Marine Other

International OUR BUSINESS Expanding segment serving international recreation and transportation markets, leveraging wide-reaching footprints and strong customer relationships to establish LCI’s position as a global leader
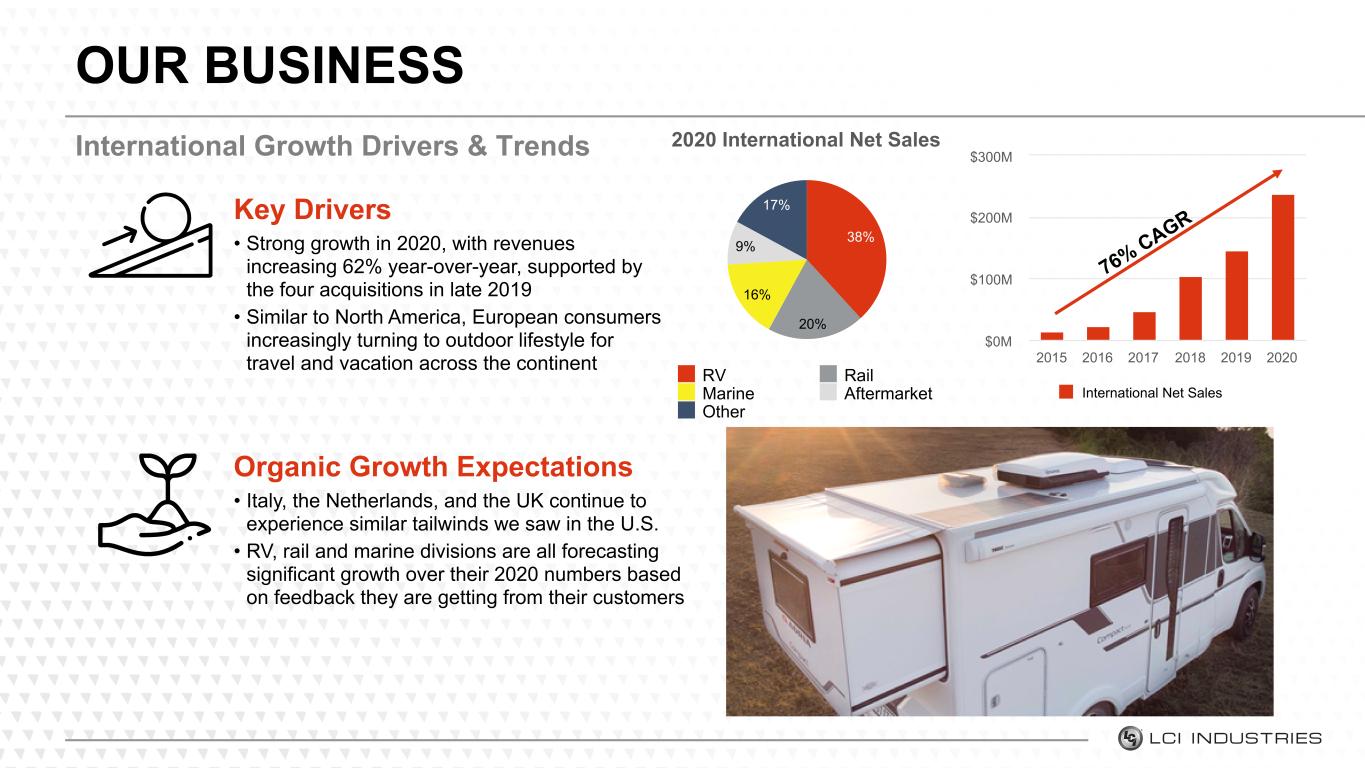
International Growth Drivers & Trends OUR BUSINESS Key Drivers • Strong growth in 2020, with revenues increasing 62% year-over-year, supported by the four acquisitions in late 2019 • Similar to North America, European consumers increasingly turning to outdoor lifestyle for travel and vacation across the continent Organic Growth Expectations • Italy, the Netherlands, and the UK continue to experience similar tailwinds we saw in the U.S. • RV, rail and marine divisions are all forecasting significant growth over their 2020 numbers based on feedback they are getting from their customers International Net Sales 2015 2016 2017 2018 2019 2020 $0M $100M $200M $300M 76% CA GR 2020 International Net Sales 38% 20% 16% 9% 17% RV Rail Marine Aftermarket Other

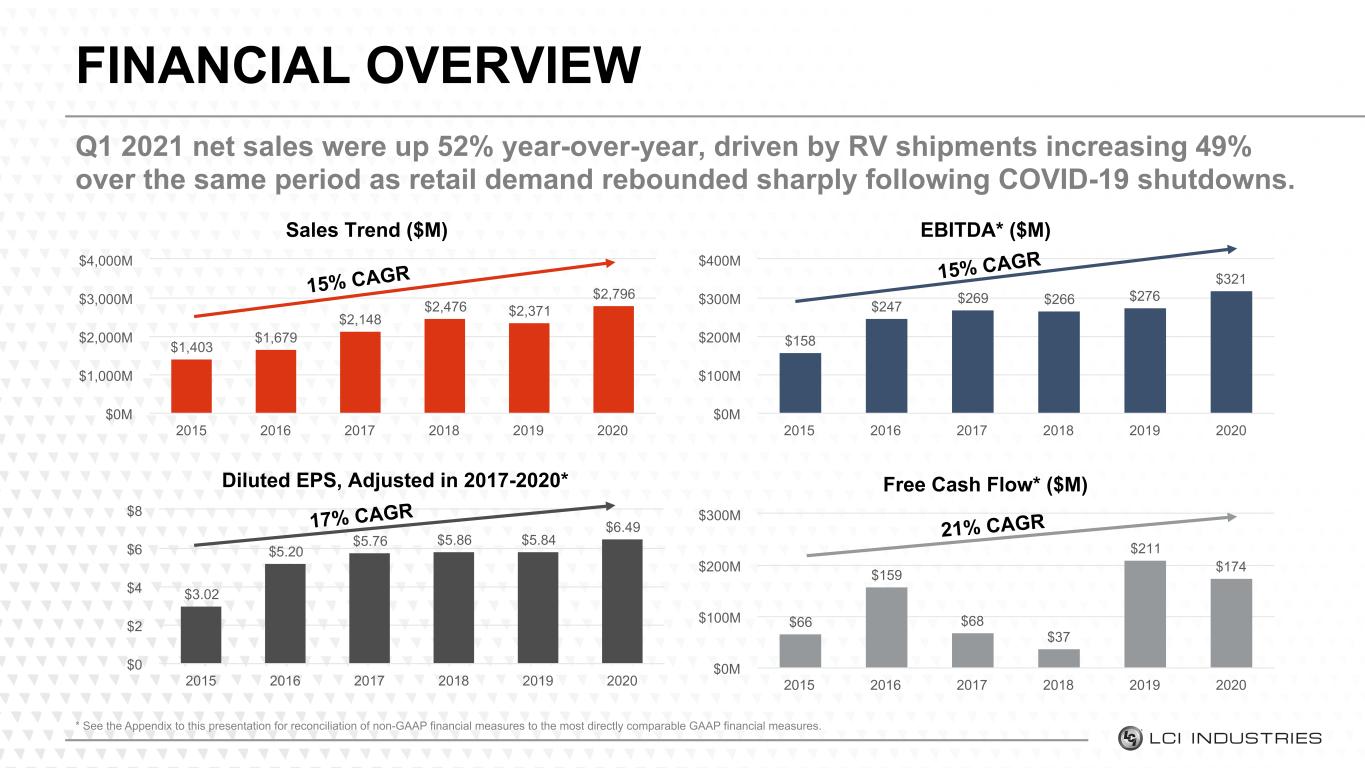
Free Cash Flow* ($M) $66 $159 $68 $37 $211 $174 2015 2016 2017 2018 2019 2020 $0M $100M $200M $300M EBITDA* ($M) $158 $247 $269 $266 $276 $321 2015 2016 2017 2018 2019 2020 $0M $100M $200M $300M $400M Q1 2021 net sales were up 52% year-over-year, driven by RV shipments increasing 49% over the same period as retail demand rebounded sharply following COVID-19 shutdowns. FINANCIAL OVERVIEW Sales Trend ($M) $1,403 $1,679 $2,148 $2,476 $2,371 $2,796 2015 2016 2017 2018 2019 2020 $0M $1,000M $2,000M $3,000M $4,000M * See the Appendix to this presentation for reconciliation of non-GAAP financial measures to the most directly comparable GAAP financial measures. Diluted EPS, Adjusted in 2017-2020* $3.02 $5.20 $5.76 $5.86 $5.84 $6.49 2015 2016 2017 2018 2019 2020 $0 $2 $4 $6 $8 15% CAGR 15% CAGR 17% CAGR 21% CAGR
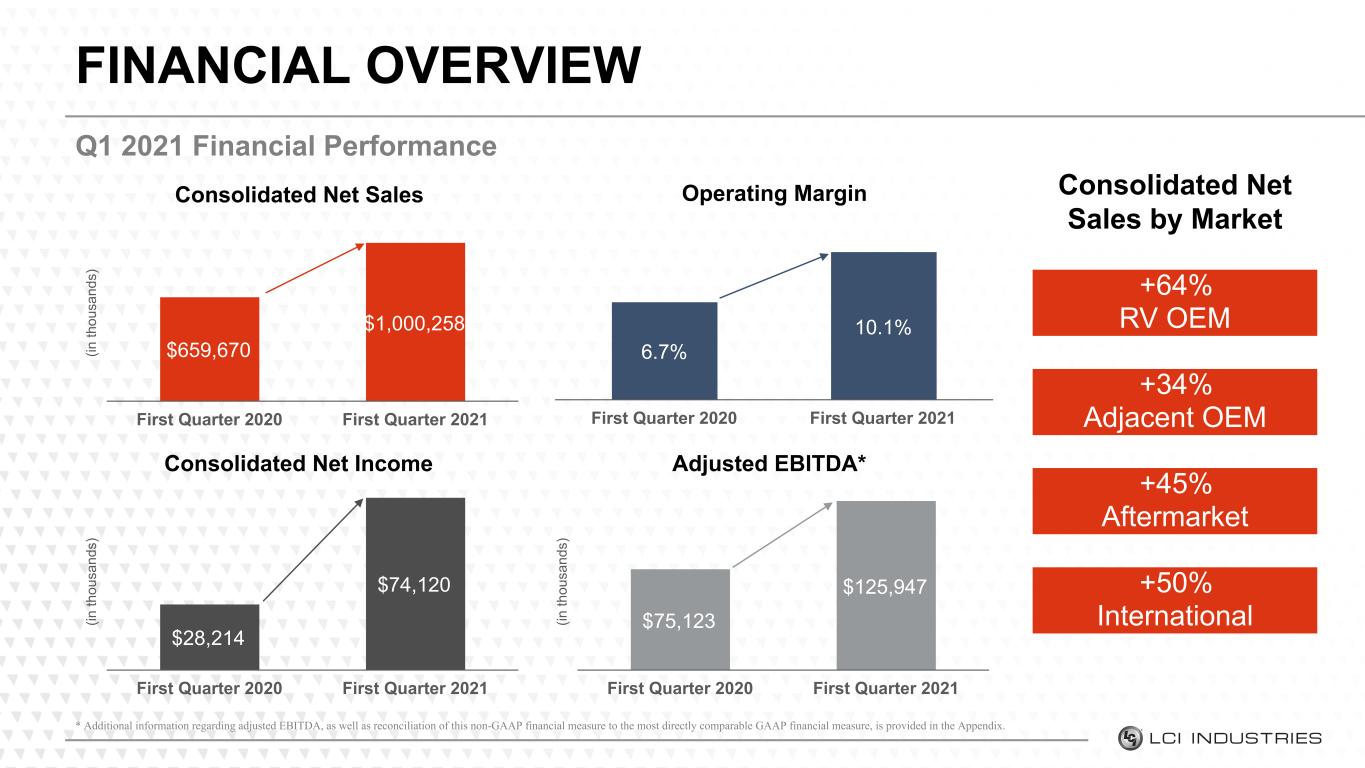
Q1 2021 Financial Performance FINANCIAL OVERVIEW * Additional information regarding adjusted EBITDA, as well as reconciliation of this non-GAAP financial measure to the most directly comparable GAAP financial measure, is provided in the Appendix. (in th ou sa nd s) Consolidated Net Sales $659,670 $1,000,258 First Quarter 2020 First Quarter 2021 (in th ou sa nd s) Consolidated Net Income $28,214 $74,120 First Quarter 2020 First Quarter 2021 Operating Margin 6.7% 10.1% First Quarter 2020 First Quarter 2021 (in th ou sa nd s) Adjusted EBITDA* $75,123 $125,947 First Quarter 2020 First Quarter 2021 Consolidated Net Sales by Market +64% RV OEM +34% Adjacent OEM +45% Aftermarket +50% International
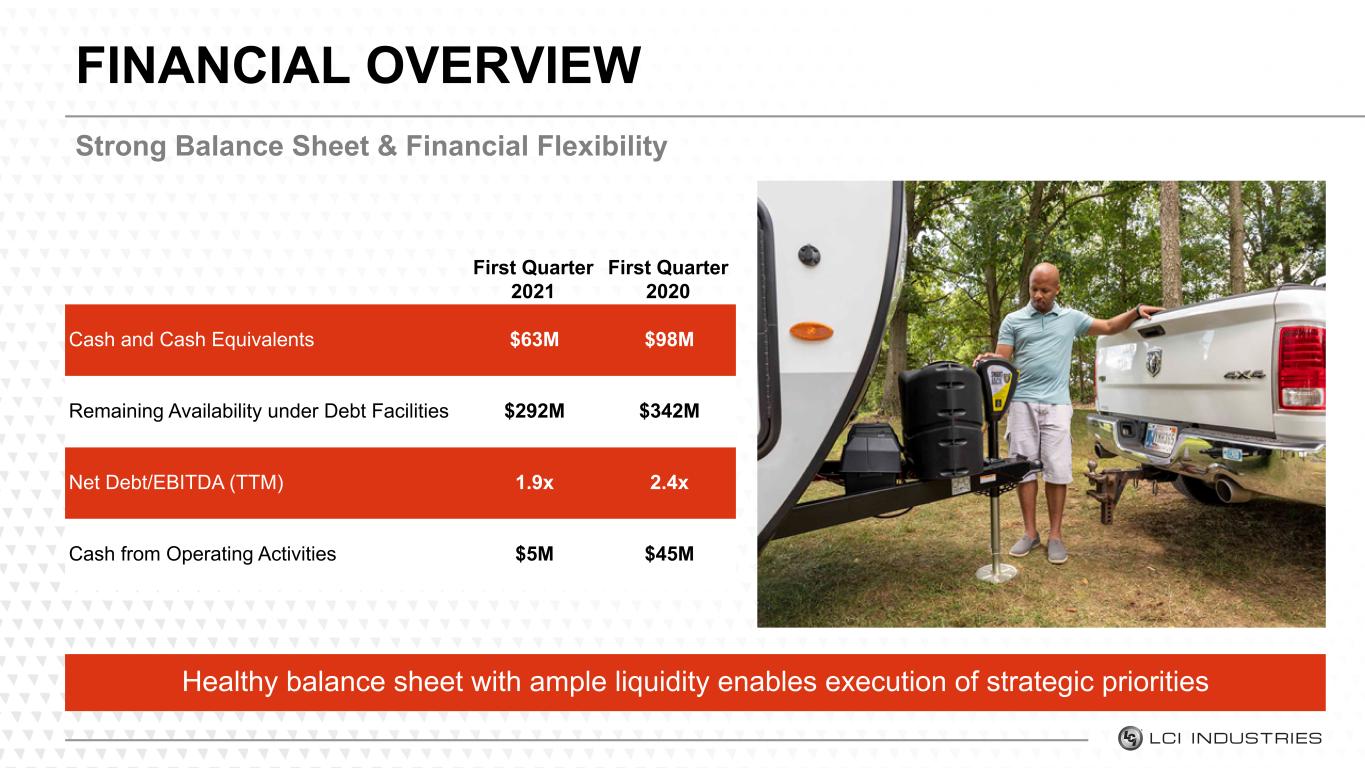
Strong Balance Sheet & Financial Flexibility FINANCIAL OVERVIEW Healthy balance sheet with ample liquidity enables execution of strategic priorities First Quarter 2021 First Quarter 2020 Cash and Cash Equivalents $63M $98M Remaining Availability under Debt Facilities $292M $342M Net Debt/EBITDA (TTM) 1.9x 2.4x Cash from Operating Activities $5M $45M
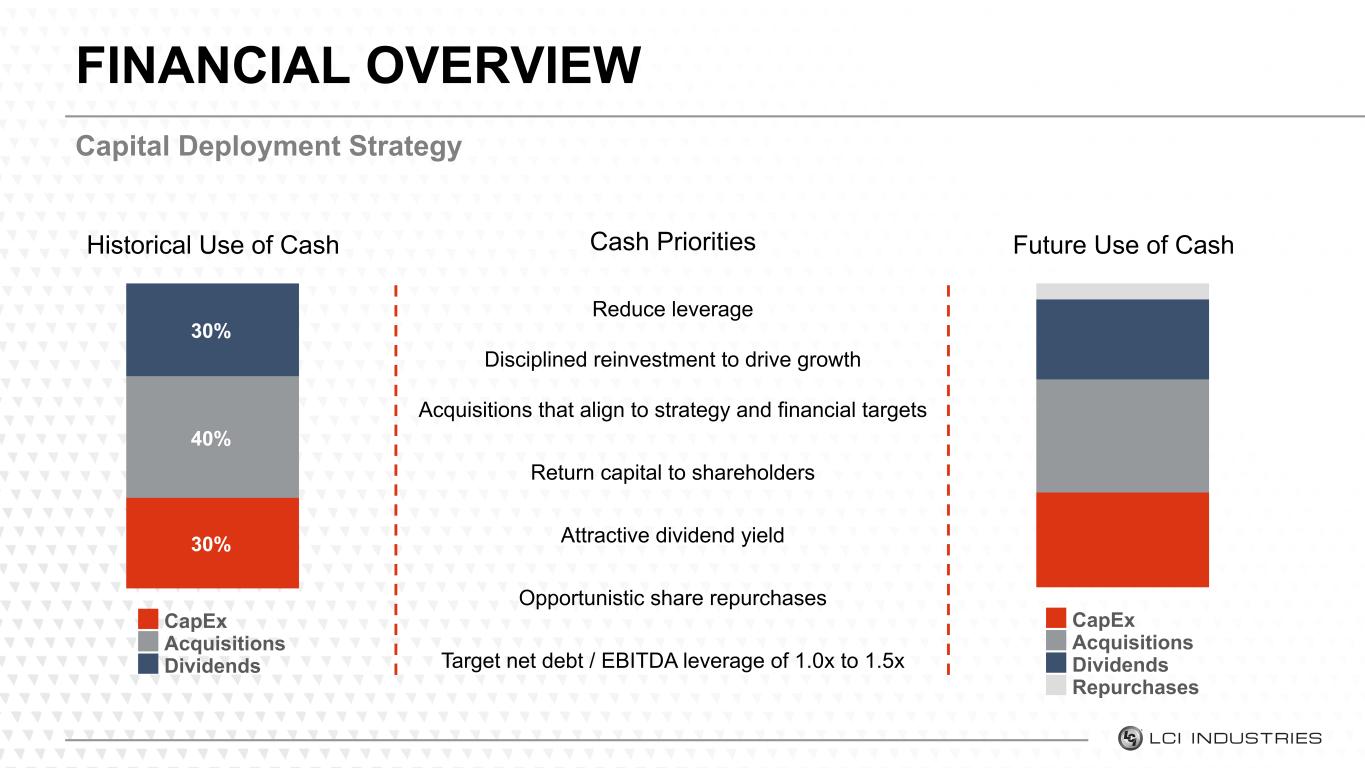
Capital Deployment Strategy FINANCIAL OVERVIEW Reduce leverage Disciplined reinvestment to drive growth Acquisitions that align to strategy and financial targets Return capital to shareholders Attractive dividend yield Opportunistic share repurchases Target net debt / EBITDA leverage of 1.0x to 1.5x Future Use of CashHistorical Use of Cash Cash Priorities 30% 40% 30% CapEx Acquisitions Dividends CapEx Acquisitions Dividends Repurchases
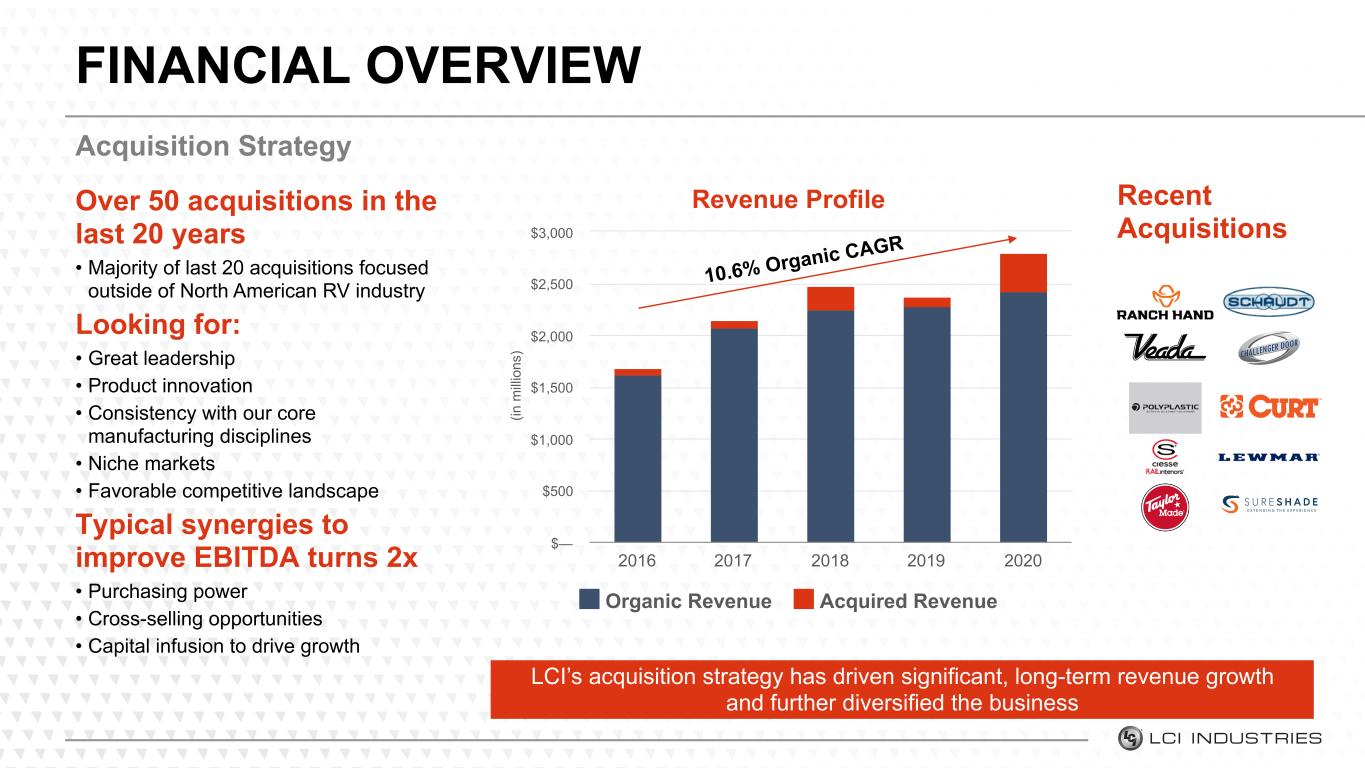
Over 50 acquisitions in the last 20 years • Majority of last 20 acquisitions focused outside of North American RV industry Looking for: • Great leadership • Product innovation • Consistency with our core manufacturing disciplines • Niche markets • Favorable competitive landscape Typical synergies to improve EBITDA turns 2x • Purchasing power • Cross-selling opportunities • Capital infusion to drive growth (in m ill io ns ) Revenue Profile Organic Revenue Acquired Revenue 2016 2017 2018 2019 2020 $— $500 $1,000 $1,500 $2,000 $2,500 $3,000 Acquisition Strategy FINANCIAL OVERVIEW LCI’s acquisition strategy has driven significant, long-term revenue growth and further diversified the business 10.6% O rganic C AGR Recent Acquisitions
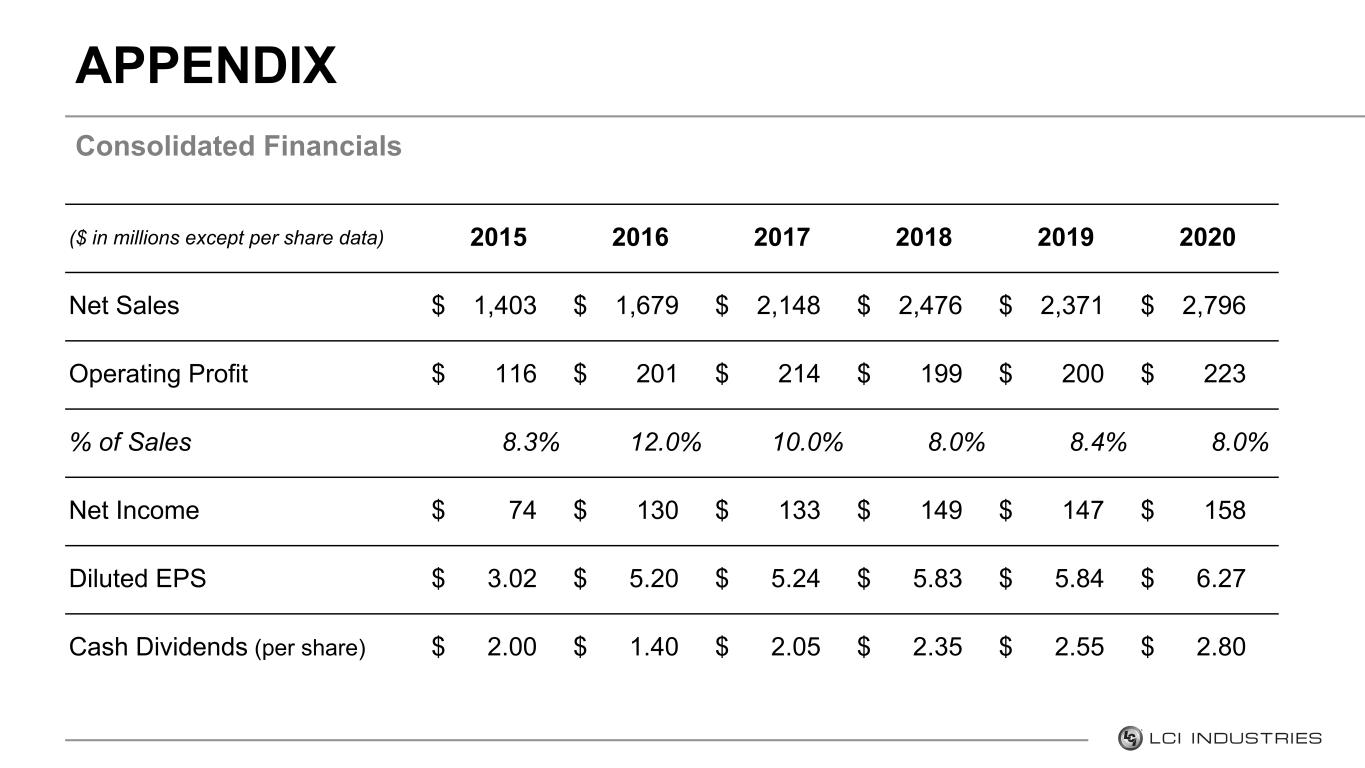
Consolidated Financials APPENDIX ($ in millions except per share data) 2015 2016 2017 2018 2019 2020 Net Sales $ 1,403 $ 1,679 $ 2,148 $ 2,476 $ 2,371 $ 2,796 Operating Profit $ 116 $ 201 $ 214 $ 199 $ 200 $ 223 % of Sales 8.3% 12.0% 10.0% 8.0% 8.4% 8.0% Net Income $ 74 $ 130 $ 133 $ 149 $ 147 $ 158 Diluted EPS $ 3.02 $ 5.20 $ 5.24 $ 5.83 $ 5.84 $ 6.27 Cash Dividends (per share) $ 2.00 $ 1.40 $ 2.05 $ 2.35 $ 2.55 $ 2.80
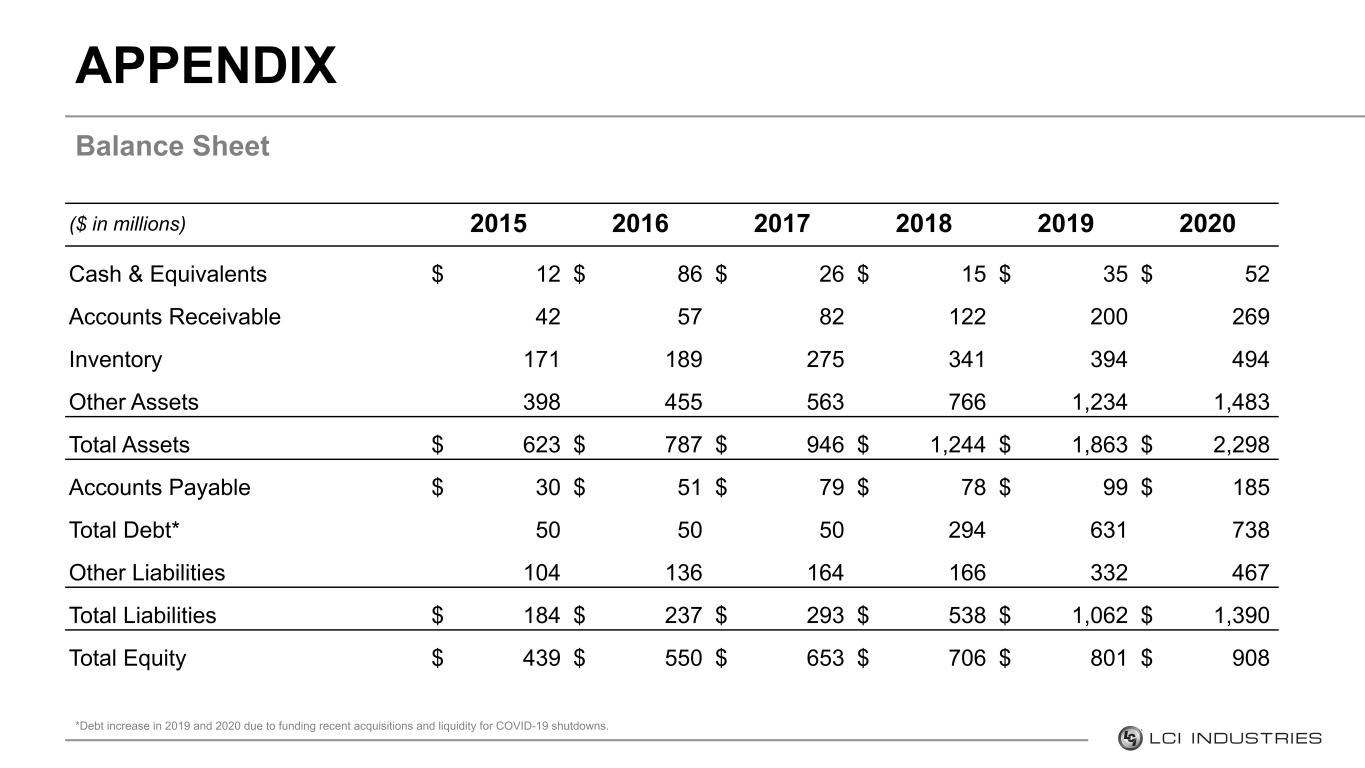
Balance Sheet APPENDIX *Debt increase in 2019 and 2020 due to funding recent acquisitions and liquidity for COVID-19 shutdowns. ($ in millions) 2015 2016 2017 2018 2019 2020 Cash & Equivalents $ 12 $ 86 $ 26 $ 15 $ 35 $ 52 Accounts Receivable 42 57 82 122 200 269 Inventory 171 189 275 341 394 494 Other Assets 398 455 563 766 1,234 1,483 Total Assets $ 623 $ 787 $ 946 $ 1,244 $ 1,863 $ 2,298 Accounts Payable $ 30 $ 51 $ 79 $ 78 $ 99 $ 185 Total Debt* 50 50 50 294 631 738 Other Liabilities 104 136 164 166 332 467 Total Liabilities $ 184 $ 237 $ 293 $ 538 $ 1,062 $ 1,390 Total Equity $ 439 $ 550 $ 653 $ 706 $ 801 $ 908
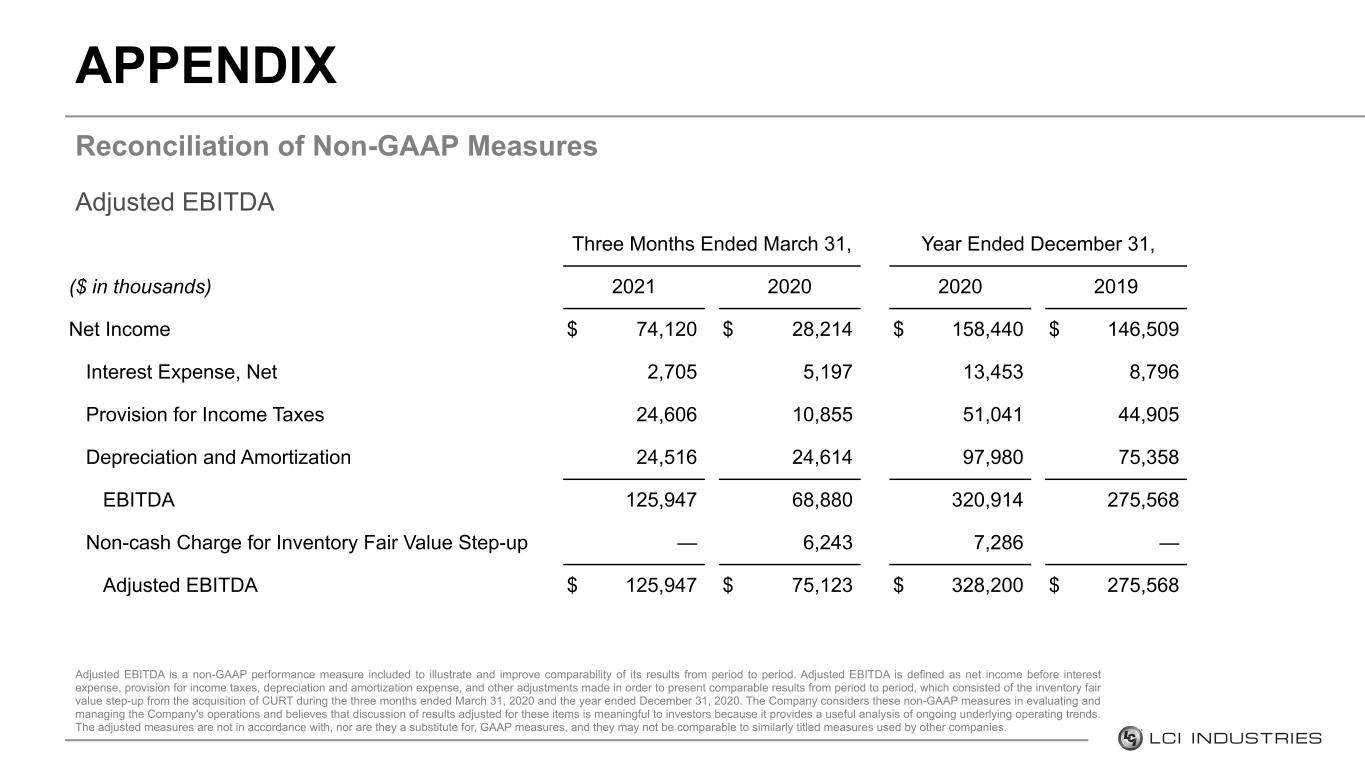
Adjusted EBITDA Reconciliation of Non-GAAP Measures APPENDIX Adjusted EBITDA is a non-GAAP performance measure included to illustrate and improve comparability of its results from period to period. Adjusted EBITDA is defined as net income before interest expense, provision for income taxes, depreciation and amortization expense, and other adjustments made in order to present comparable results from period to period, which consisted of the inventory fair value step-up from the acquisition of CURT during the three months ended March 31, 2020 and the year ended December 31, 2020. The Company considers these non-GAAP measures in evaluating and managing the Company's operations and believes that discussion of results adjusted for these items is meaningful to investors because it provides a useful analysis of ongoing underlying operating trends. The adjusted measures are not in accordance with, nor are they a substitute for, GAAP measures, and they may not be comparable to similarly titled measures used by other companies. Three Months Ended March 31, Year Ended December 31, ($ in thousands) 2021 2020 2020 2019 Net Income $ 74,120 $ 28,214 $ 158,440 $ 146,509 Interest Expense, Net 2,705 5,197 13,453 8,796 Provision for Income Taxes 24,606 10,855 51,041 44,905 Depreciation and Amortization 24,516 24,614 97,980 75,358 EBITDA 125,947 68,880 320,914 275,568 Non-cash Charge for Inventory Fair Value Step-up — 6,243 7,286 — Adjusted EBITDA $ 125,947 $ 75,123 $ 328,200 $ 275,568
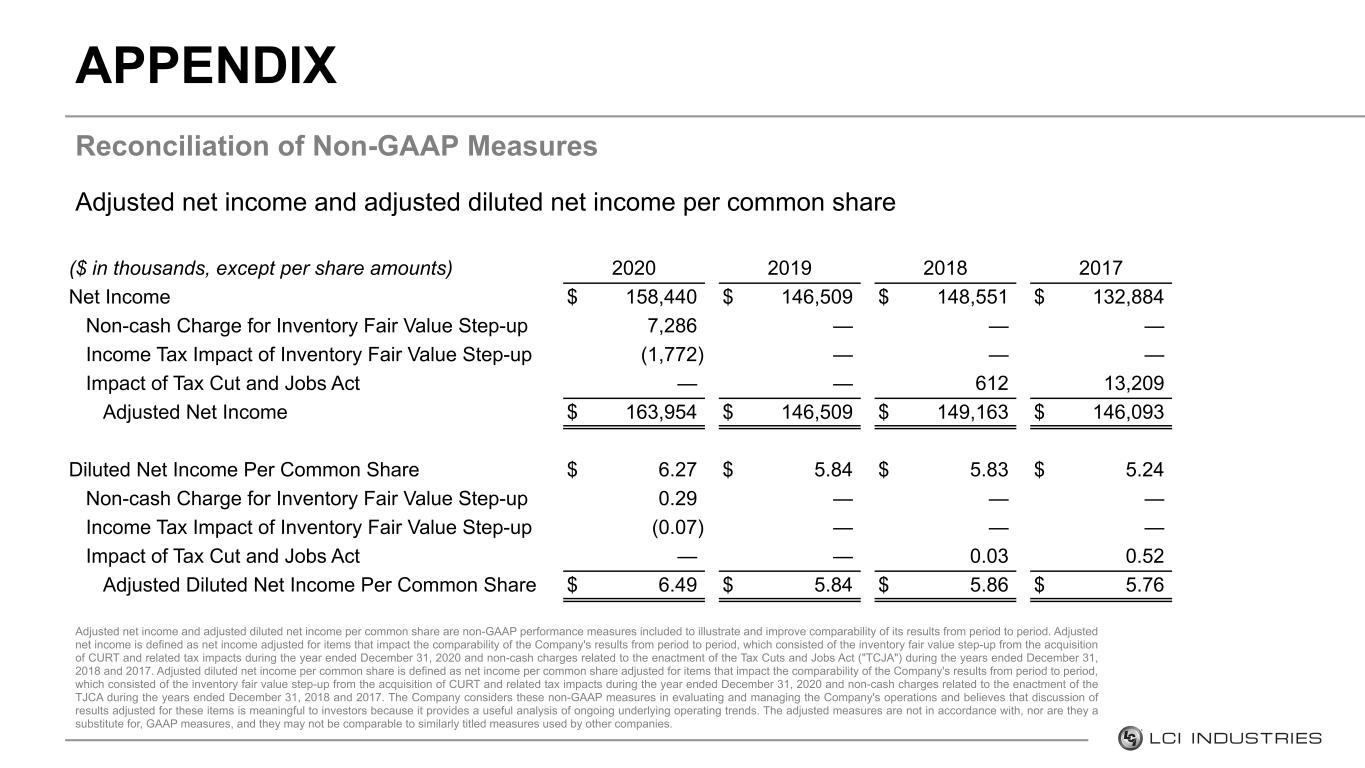
Adjusted net income and adjusted diluted net income per common share Reconciliation of Non-GAAP Measures APPENDIX Adjusted net income and adjusted diluted net income per common share are non-GAAP performance measures included to illustrate and improve comparability of its results from period to period. Adjusted net income is defined as net income adjusted for items that impact the comparability of the Company's results from period to period, which consisted of the inventory fair value step-up from the acquisition of CURT and related tax impacts during the year ended December 31, 2020 and non-cash charges related to the enactment of the Tax Cuts and Jobs Act ("TCJA") during the years ended December 31, 2018 and 2017. Adjusted diluted net income per common share is defined as net income per common share adjusted for items that impact the comparability of the Company's results from period to period, which consisted of the inventory fair value step-up from the acquisition of CURT and related tax impacts during the year ended December 31, 2020 and non-cash charges related to the enactment of the TJCA during the years ended December 31, 2018 and 2017. The Company considers these non-GAAP measures in evaluating and managing the Company's operations and believes that discussion of results adjusted for these items is meaningful to investors because it provides a useful analysis of ongoing underlying operating trends. The adjusted measures are not in accordance with, nor are they a substitute for, GAAP measures, and they may not be comparable to similarly titled measures used by other companies. ($ in thousands, except per share amounts) 2020 2019 2018 2017 Net Income $ 158,440 $ 146,509 $ 148,551 $ 132,884 Non-cash Charge for Inventory Fair Value Step-up 7,286 — — — Income Tax Impact of Inventory Fair Value Step-up (1,772) — — — Impact of Tax Cut and Jobs Act — — 612 13,209 Adjusted Net Income $ 163,954 $ 146,509 $ 149,163 $ 146,093 Diluted Net Income Per Common Share $ 6.27 $ 5.84 $ 5.83 $ 5.24 Non-cash Charge for Inventory Fair Value Step-up 0.29 — — — Income Tax Impact of Inventory Fair Value Step-up (0.07) — — — Impact of Tax Cut and Jobs Act — — 0.03 0.52 Adjusted Diluted Net Income Per Common Share $ 6.49 $ 5.84 $ 5.86 $ 5.76
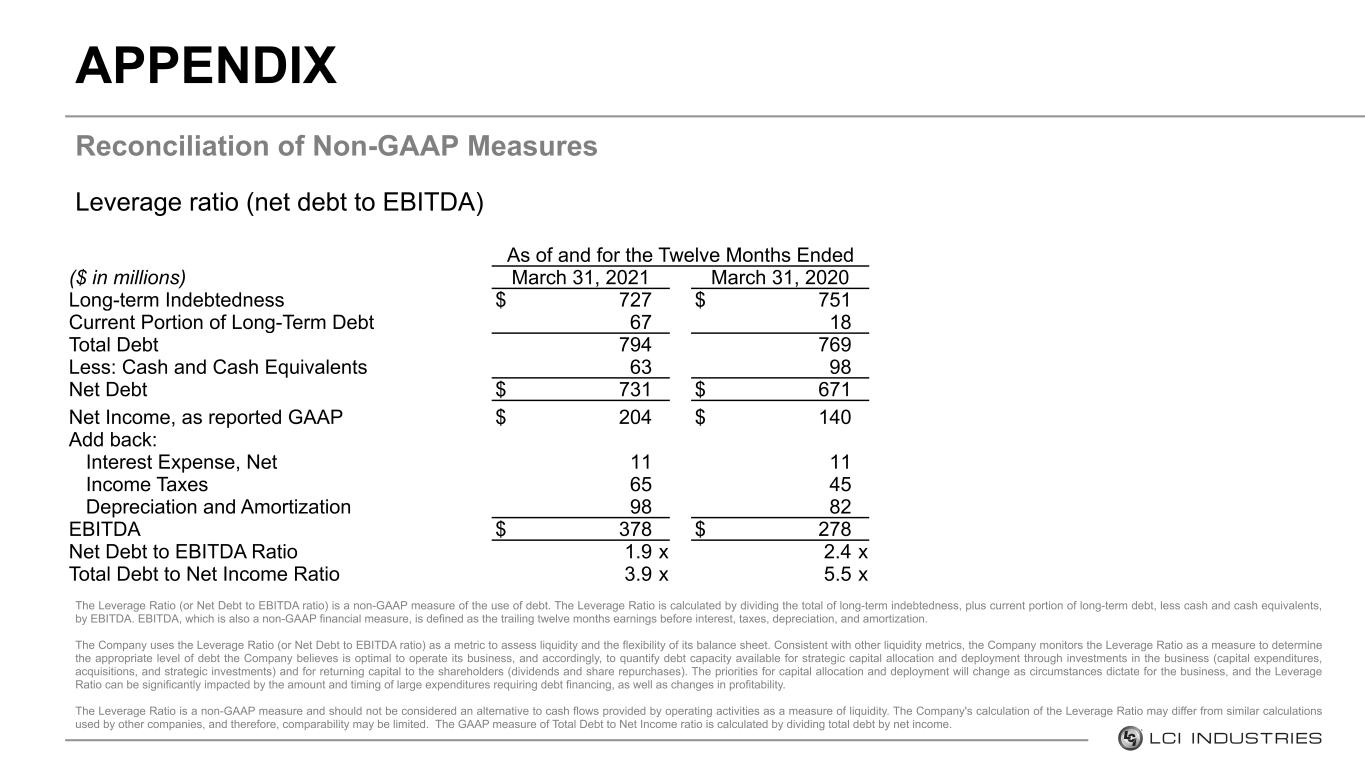
Leverage ratio (net debt to EBITDA) Reconciliation of Non-GAAP Measures APPENDIX The Leverage Ratio (or Net Debt to EBITDA ratio) is a non-GAAP measure of the use of debt. The Leverage Ratio is calculated by dividing the total of long-term indebtedness, plus current portion of long-term debt, less cash and cash equivalents, by EBITDA. EBITDA, which is also a non-GAAP financial measure, is defined as the trailing twelve months earnings before interest, taxes, depreciation, and amortization. The Company uses the Leverage Ratio (or Net Debt to EBITDA ratio) as a metric to assess liquidity and the flexibility of its balance sheet. Consistent with other liquidity metrics, the Company monitors the Leverage Ratio as a measure to determine the appropriate level of debt the Company believes is optimal to operate its business, and accordingly, to quantify debt capacity available for strategic capital allocation and deployment through investments in the business (capital expenditures, acquisitions, and strategic investments) and for returning capital to the shareholders (dividends and share repurchases). The priorities for capital allocation and deployment will change as circumstances dictate for the business, and the Leverage Ratio can be significantly impacted by the amount and timing of large expenditures requiring debt financing, as well as changes in profitability. The Leverage Ratio is a non-GAAP measure and should not be considered an alternative to cash flows provided by operating activities as a measure of liquidity. The Company's calculation of the Leverage Ratio may differ from similar calculations used by other companies, and therefore, comparability may be limited. The GAAP measure of Total Debt to Net Income ratio is calculated by dividing total debt by net income. As of and for the Twelve Months Ended ($ in millions) March 31, 2021 March 31, 2020 Long-term Indebtedness $ 727 $ 751 Current Portion of Long-Term Debt 67 18 Total Debt 794 769 Less: Cash and Cash Equivalents 63 98 Net Debt $ 731 $ 671 Net Income, as reported GAAP $ 204 $ 140 Add back: Interest Expense, Net 11 11 Income Taxes 65 45 Depreciation and Amortization 98 82 EBITDA $ 378 $ 278 Net Debt to EBITDA Ratio 1.9 x 2.4 x Total Debt to Net Income Ratio 3.9 x 5.5 x
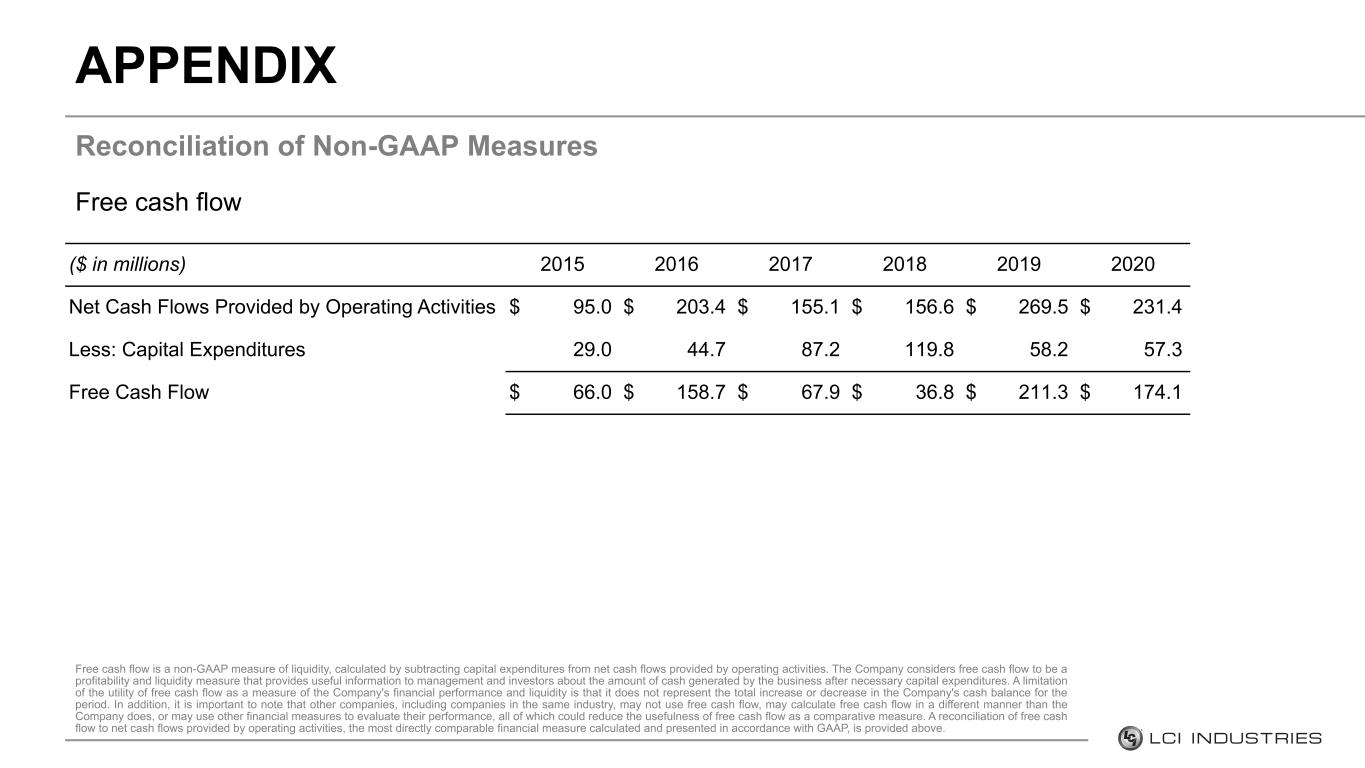
Free cash flow Reconciliation of Non-GAAP Measures APPENDIX Free cash flow is a non-GAAP measure of liquidity, calculated by subtracting capital expenditures from net cash flows provided by operating activities. The Company considers free cash flow to be a profitability and liquidity measure that provides useful information to management and investors about the amount of cash generated by the business after necessary capital expenditures. A limitation of the utility of free cash flow as a measure of the Company's financial performance and liquidity is that it does not represent the total increase or decrease in the Company's cash balance for the period. In addition, it is important to note that other companies, including companies in the same industry, may not use free cash flow, may calculate free cash flow in a different manner than the Company does, or may use other financial measures to evaluate their performance, all of which could reduce the usefulness of free cash flow as a comparative measure. A reconciliation of free cash flow to net cash flows provided by operating activities, the most directly comparable financial measure calculated and presented in accordance with GAAP, is provided above. ($ in millions) 2015 2016 2017 2018 2019 2020 Net Cash Flows Provided by Operating Activities $ 95.0 $ 203.4 $ 155.1 $ 156.6 $ 269.5 $ 231.4 Less: Capital Expenditures 29.0 44.7 87.2 119.8 58.2 57.3 Free Cash Flow $ 66.0 $ 158.7 $ 67.9 $ 36.8 $ 211.3 $ 174.1
APPENDIX
