Attached files
| file | filename |
|---|---|
| 8-K - 8-K - FUELCELL ENERGY INC | fcel-20210610x8k.htm |
| EX-99.1 - EX-99.1 - FUELCELL ENERGY INC | fcel-20210610xex99d1.htm |
Exhibit 99.2
| FuelCell Energy Q2 2021 Investor Presentation Second Quarter of Fiscal 2021 Financial Results & Strategy Update June 10, 2021 Exhibit 99.2 |
| FuelCell Energy Q2 2021 Investor Presentation This presentation contains forward-looking statements within the meaning of the safe harbor provisions of the Private Securities Litigation Reform Act of 1995 regarding future events or our future financial performance that involve certain contingencies and uncertainties, including those discussed in our Quarterly Report on Form 10-Q for the quarter ended April 30, 2021 in the section entitled "Management's Discussion and Analysis of Financial Condition and Results of Operations”. Forward-looking statements include, without limitation, statements with respect to the Company’s anticipated financial results and statements regarding the Company’s plans and expectations regarding the continuing development, commercialization and financing of its fuel cell technology and its business plans and strategies. These statements are not guarantees of future performance, and all forward-looking statements are subject to risks and uncertainties that could cause actual results to differ materially from those projected. Factors that could cause such a difference include, without limitation: general risks associated with product development and manufacturing; general economic conditions; changes in the utility regulatory environment; changes in the utility industry and the markets for distributed generation, distributed hydrogen, and fuel cell power platforms configured for carbon capture or carbon sequestration; potential volatility of energy prices; availability of government subsidies and economic incentives for alternative energy technologies; our ability to remain in compliance with U.S. federal and state and foreign government laws and regulations and the listing rules of The Nasdaq Stock Market; rapid technological change; competition; the risk that our bid awards will not convert to contracts or that our contracts will not convert to revenue; market acceptance of our products; changes in accounting policies or practices adopted voluntarily or as required by accounting principles generally accepted in the United States; factors affecting our liquidity position and financial condition; government appropriations; the ability of the government and third parties to terminate their development contracts at any time; the ability of the government to exercise “march-in” rights with respect to certain of our patents; the arbitration and other legal proceedings with POSCO Energy Co., Ltd.; our ability to implement our strategy; our ability to reduce our levelized cost of energy and our cost reduction strategy generally; our ability to protect our intellectual property; litigation and other proceedings; the risk that commercialization of our products will not occur when anticipated; our need for and the availability of additional financing; our ability to generate positive cash flow from operations; our ability to service our long-term debt; our ability to increase the output and longevity of our power plants and to meet the performance requirements of our contracts; our ability to expand our customer base and maintain relationships with our largest customers and strategic business allies; changes by the U.S. Small Business Administration or other governmental authorities to, or with respect to the implementation or interpretation of, the Coronavirus Aid, Relief, and Economic Security Act, the Paycheck Protection Program or related administrative matters; and concerns with, threats of, or the consequences of, pandemics, contagious diseases or health epidemics, including the novel coronavirus, and resulting supply chain disruptions, shifts in clean energy demand, impacts to our customers’ capital budgets and investment plans, impacts to our project schedules, impacts to our ability to service existing projects, and impacts on the demand for our products, as well as other risks set forth in the Company’s filings with the Securities and Exchange Commission. The forward-looking statements contained herein speak only as of the date of this presentation. The Company expressly disclaims any obligation or undertaking to release publicly any updates or revisions to any such statement contained or incorporated by reference herein to reflect any change in the Company’s expectations or any change in events, conditions or circumstances on which any such statement is based. The Company refers to non-GAAP financial measures in this presentation. The Company believes that this information is useful to understanding its operating results and assessing performance and highlighting trends on an overall basis. Please refer to the Company’s earnings release and the appendix to this presentation for further disclosure and reconciliation of non-GAAP financial measures.(As used herein, the term “GAAP” refers to generally accepted accounting principles in the U.S.) The information set forth in this presentation is qualified by reference to, and should be read in conjunction with, our Annual Report on Form 10-K for the fiscal year ended October 31, 2020, filed with the SEC on January 21, 2021, our Quarterly Report on Form 10-Q for the fiscal quarter ended April 30, 2021, filed with the SEC on June 10, 2021, and our earnings release for the second fiscal quarter ended April 30, 2021, filed as an exhibit to our Current Report on Form 8-K filed with the SEC on June 10, 2021. Safe Harbor Statement 2 |
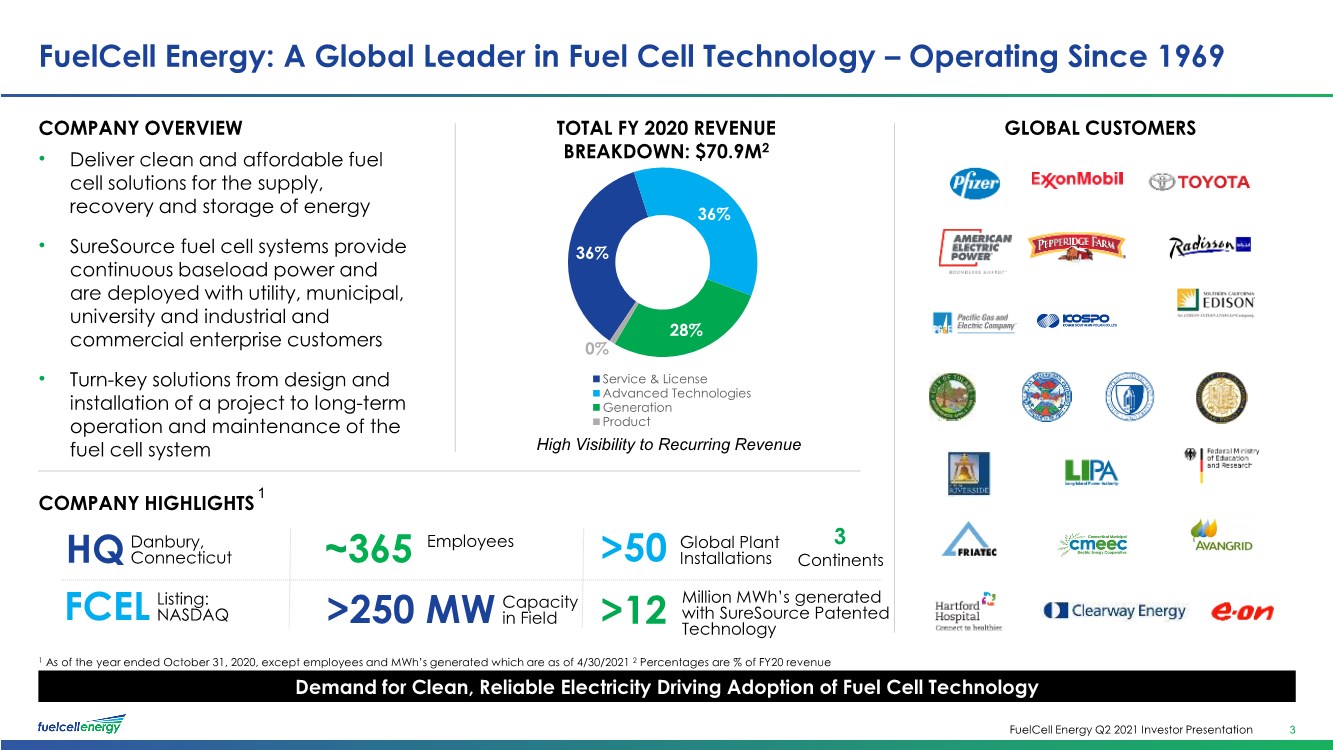
| FuelCell Energy Q2 2021 Investor Presentation 36% 36% 28% 0% Service & License Advanced Technologies Generation Product GLOBAL CUSTOMERS COMPANY OVERVIEW • Deliver clean and affordable fuel cell solutions for the supply, recovery and storage of energy • SureSource fuel cell systems provide continuous baseload power and are deployed with utility, municipal, university and industrial and commercial enterprise customers • Turn-key solutions from design and installation of a project to long-term operation and maintenance of the fuel cell system COMPANY HIGHLIGHTS FuelCell Energy: A Global Leader in Fuel Cell Technology – Operating Since 1969 3 TOTAL FY 2020 REVENUE BREAKDOWN: $70.9M2 Demand for Clean, Reliable Electricity Driving Adoption of Fuel Cell Technology High Visibility to Recurring Revenue 1 As of the year ended October 31, 2020, except employees and MWh’s generated which are as of 4/30/2021 2 Percentages are % of FY20 revenue >250 MW Capacity in Field >50 Global Plant Installations 3 Continents ~365 Employees FCEL Listing: NASDAQ HQ Danbury, Connecticut 1 >12 Million MWh’s generated with SureSource Patented Technology |
| FuelCell Energy Q2 2021 Investor Presentation Purpose Statement 4 Enable The World To Live A Life Empowered By Clean Energy |
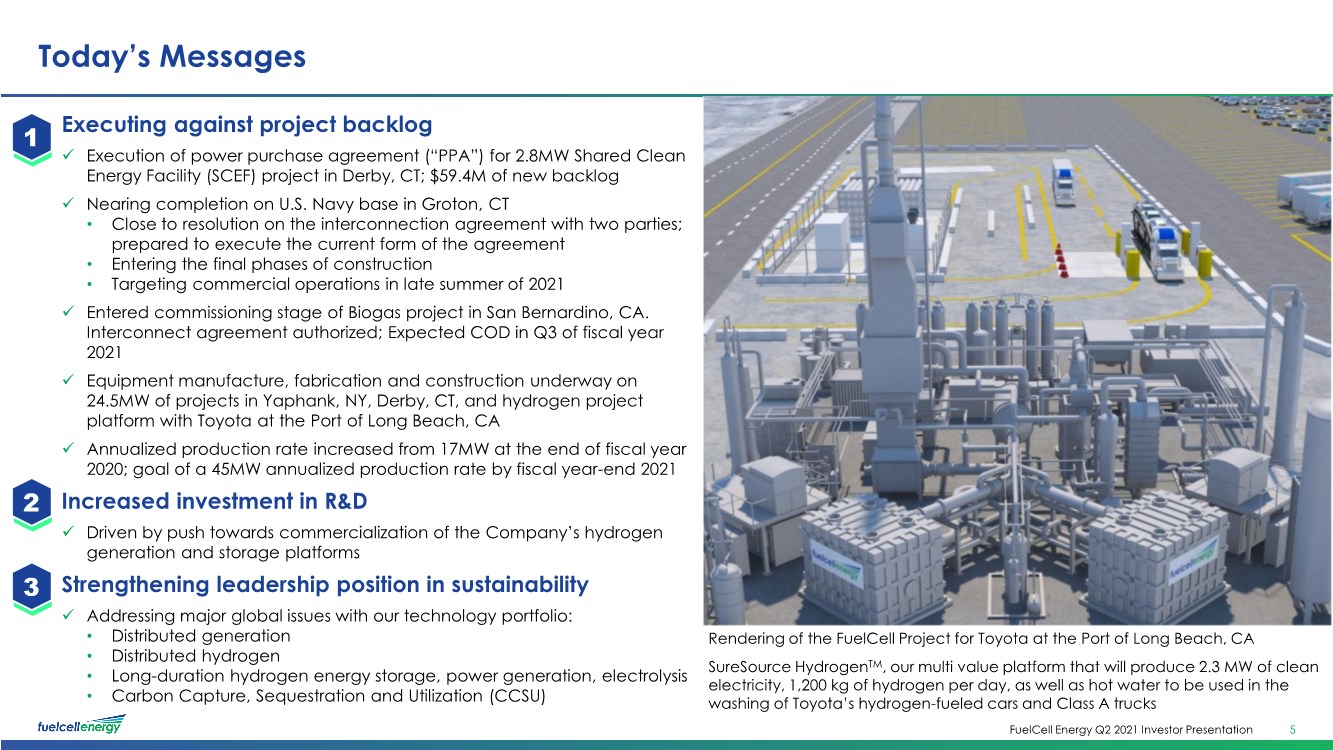
| FuelCell Energy Q2 2021 Investor Presentation Today’s Messages 5 Executing against project backlog ✓ Execution of power purchase agreement (“PPA”) for 2.8MW Shared Clean Energy Facility (SCEF) project in Derby, CT; $59.4M of new backlog ✓ Nearing completion on U.S. Navy base in Groton, CT • Close to resolution on the interconnection agreement with two parties; prepared to execute the current form of the agreement • Entering the final phases of construction • Targeting commercial operations in late summer of 2021 ✓ Entered commissioning stage of Biogas project in San Bernardino, CA. Interconnect agreement authorized; Expected COD in Q3 of fiscal year 2021 ✓ Equipment manufacture, fabrication and construction underway on 24.5MW of projects in Yaphank, NY, Derby, CT, and hydrogen project platform with Toyota at the Port of Long Beach, CA ✓ Annualized production rate increased from 17MW at the end of fiscal year 2020; goal of a 45MW annualized production rate by fiscal year-end 2021 Increased investment in R&D ✓ Driven by push towards commercialization of the Company’s hydrogen generation and storage platforms Strengthening leadership position in sustainability ✓ Addressing major global issues with our technology portfolio: • Distributed generation • Distributed hydrogen • Long-duration hydrogen energy storage, power generation, electrolysis • Carbon Capture, Sequestration and Utilization (CCSU) 1 2 Rendering of the FuelCell Project for Toyota at the Port of Long Beach, CA SureSource HydrogenTM, our multi value platform that will produce 2.3 MW of clean electricity, 1,200 kg of hydrogen per day, as well as hot water to be used in the washing of Toyota’s hydrogen-fueled cars and Class A trucks 3 |
| FuelCell Energy Q2 2021 Investor Presentation Q2 2021 Financial Performance |
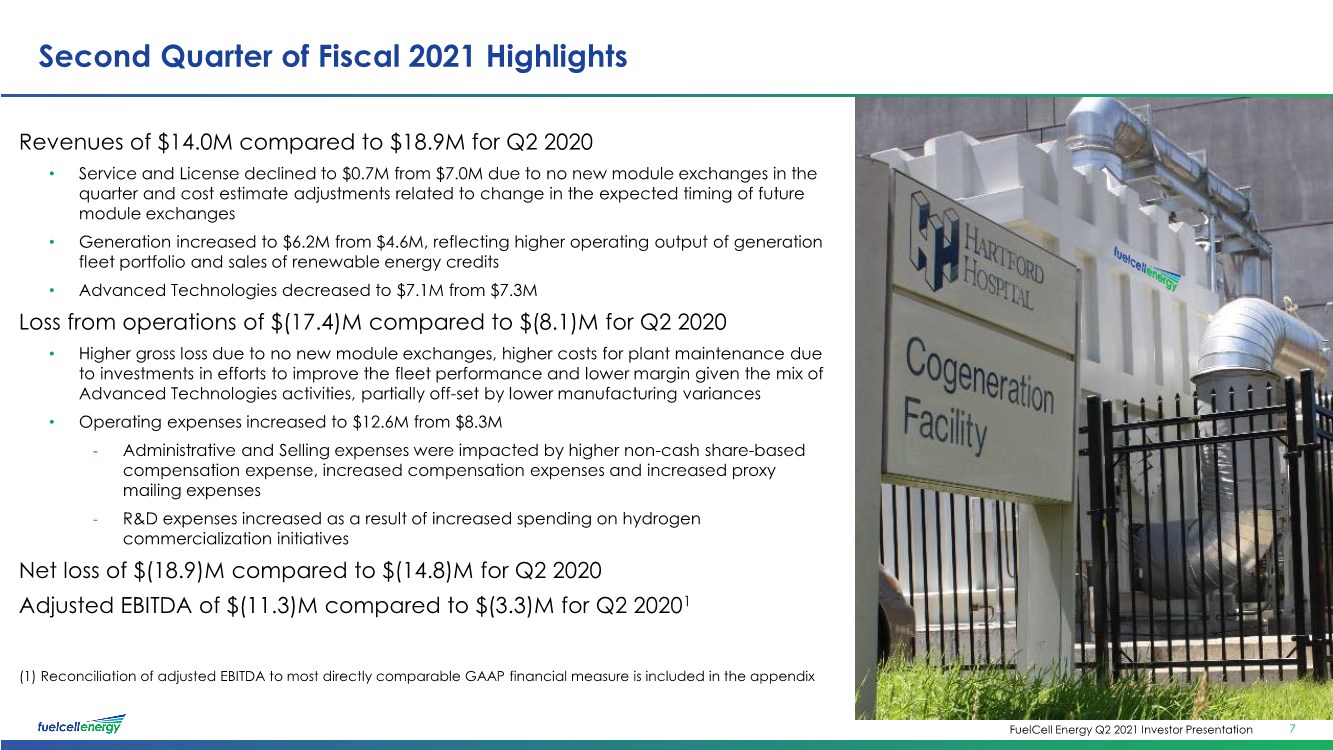
| FuelCell Energy Q2 2021 Investor Presentation Second Quarter of Fiscal 2021 Highlights Revenues of $14.0M compared to $18.9M for Q2 2020 • Service and License declined to $0.7M from $7.0M due to no new module exchanges in the quarter and cost estimate adjustments related to change in the expected timing of future module exchanges • Generation increased to $6.2M from $4.6M, reflecting higher operating output of generation fleet portfolio and sales of renewable energy credits • Advanced Technologies decreased to $7.1M from $7.3M Loss from operations of $(17.4)M compared to $(8.1)M for Q2 2020 • Higher gross loss due to no new module exchanges, higher costs for plant maintenance due to investments in efforts to improve the fleet performance and lower margin given the mix of Advanced Technologies activities, partially off-set by lower manufacturing variances • Operating expenses increased to $12.6M from $8.3M - Administrative and Selling expenses were impacted by higher non-cash share-based compensation expense, increased compensation expenses and increased proxy mailing expenses - R&D expenses increased as a result of increased spending on hydrogen commercialization initiatives Net loss of $(18.9)M compared to $(14.8)M for Q2 2020 Adjusted EBITDA of $(11.3)M compared to $(3.3)M for Q2 20201 Winter 2020 Summer 2020 FuelCell Project with CMEEC SureSourceTM 7.4 MW Location: U.S. Navy Subbase | Groton, CT Current 7 (1) Reconciliation of adjusted EBITDA to most directly comparable GAAP financial measure is included in the appendix |
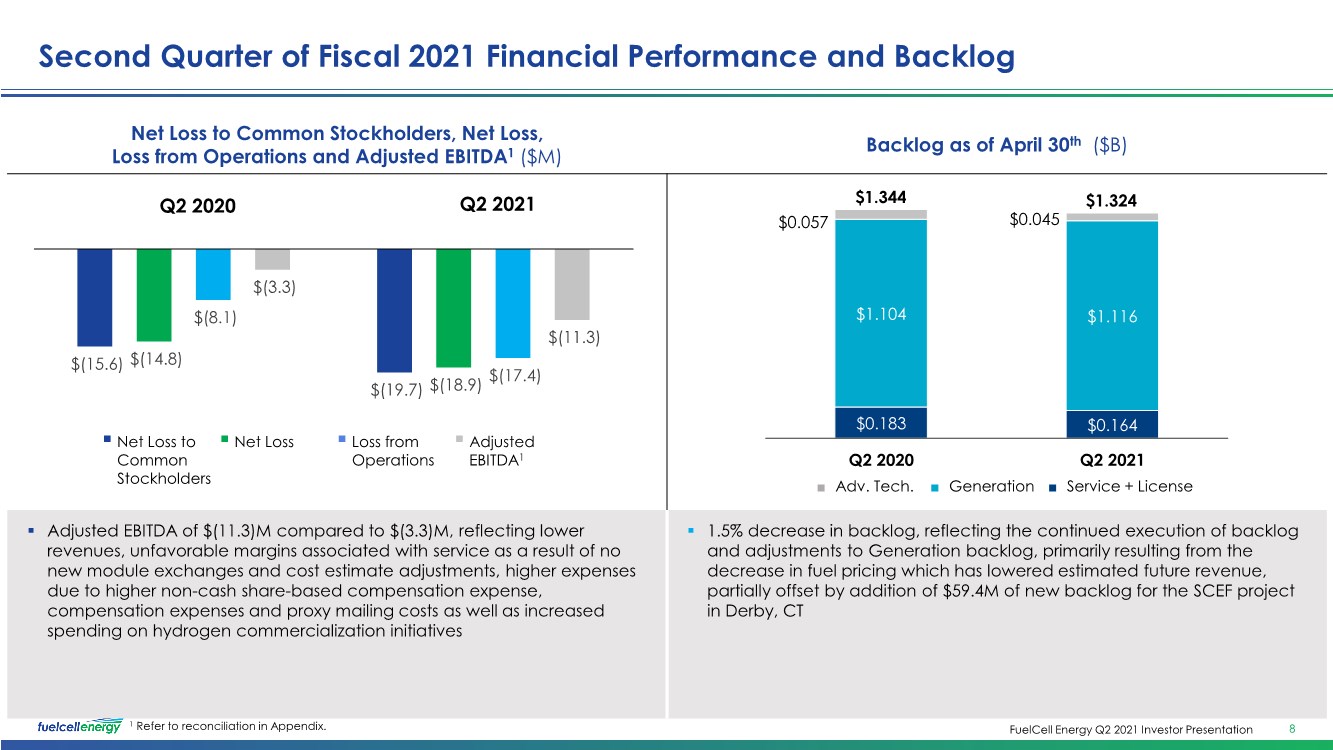
| FuelCell Energy Q2 2021 Investor Presentation 8 1 Refer to reconciliation in Appendix. Net Loss to Common Stockholders, Net Loss, Loss from Operations and Adjusted EBITDA1 ($M) Backlog as of April 30th ($B) ▪ Adjusted EBITDA of $(11.3)M compared to $(3.3)M, reflecting lower revenues, unfavorable margins associated with service as a result of no new module exchanges and cost estimate adjustments, higher expenses due to higher non-cash share-based compensation expense, compensation expenses and proxy mailing costs as well as increased spending on hydrogen commercialization initiatives ▪ 1.5% decrease in backlog, reflecting the continued execution of backlog and adjustments to Generation backlog, primarily resulting from the decrease in fuel pricing which has lowered estimated future revenue, partially offset by addition of $59.4M of new backlog for the SCEF project in Derby, CT $0.183 $0.164 $1.104 $1.116 $0.057 $0.045 Q2 2020 Q2 2021 $1.324 $1.344 ■ Adv. Tech. ■ Generation ■ Service + License $(15.6) $(19.7) $(14.8) $(18.9) $(8.1) $(17.4) $(3.3) $(11.3) ▪ Net Loss to Common Stockholders ▪ Loss from Operations ▪ Adjusted EBITDA1 ▪ Net Loss Q2 2020 Q2 2021 Second Quarter of Fiscal 2021 Financial Performance and Backlog |
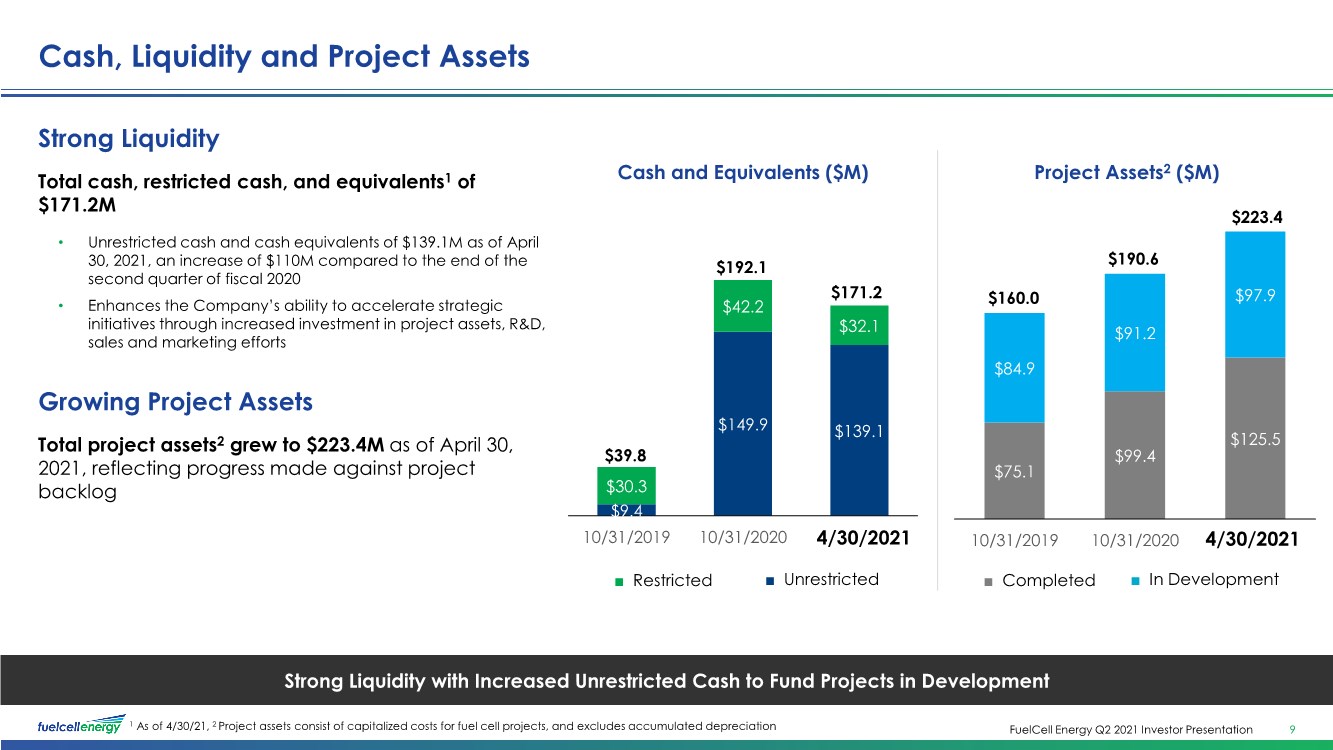
| FuelCell Energy Q2 2021 Investor Presentation 1 As of 4/30/21, 2 Project assets consist of capitalized costs for fuel cell projects, and excludes accumulated depreciation Strong Liquidity with Increased Unrestricted Cash to Fund Projects in Development ■ Restricted ■ Unrestricted $9.4 $149.9 $139.1 $30.3 $42.2 $32.1 10/31/2019 10/31/2020 4/30/2021 $192.1 $171.2 Cash and Equivalents ($M) Strong Liquidity Total cash, restricted cash, and equivalents1 of $171.2M • Unrestricted cash and cash equivalents of $139.1M as of April 30, 2021, an increase of $110M compared to the end of the second quarter of fiscal 2020 • Enhances the Company’s ability to accelerate strategic initiatives through increased investment in project assets, R&D, sales and marketing efforts Growing Project Assets Total project assets2 grew to $223.4M as of April 30, 2021, reflecting progress made against project backlog ■ Completed ■ In Development $75.1 $99.4 $125.5 $84.9 $91.2 $97.9 10/31/2019 10/31/2020 4/30/2021 Project Assets2 ($M) $190.6 $223.4 $160.0 $39.8 4/30/2021 4/30/2021 Cash, Liquidity and Project Assets 9 |
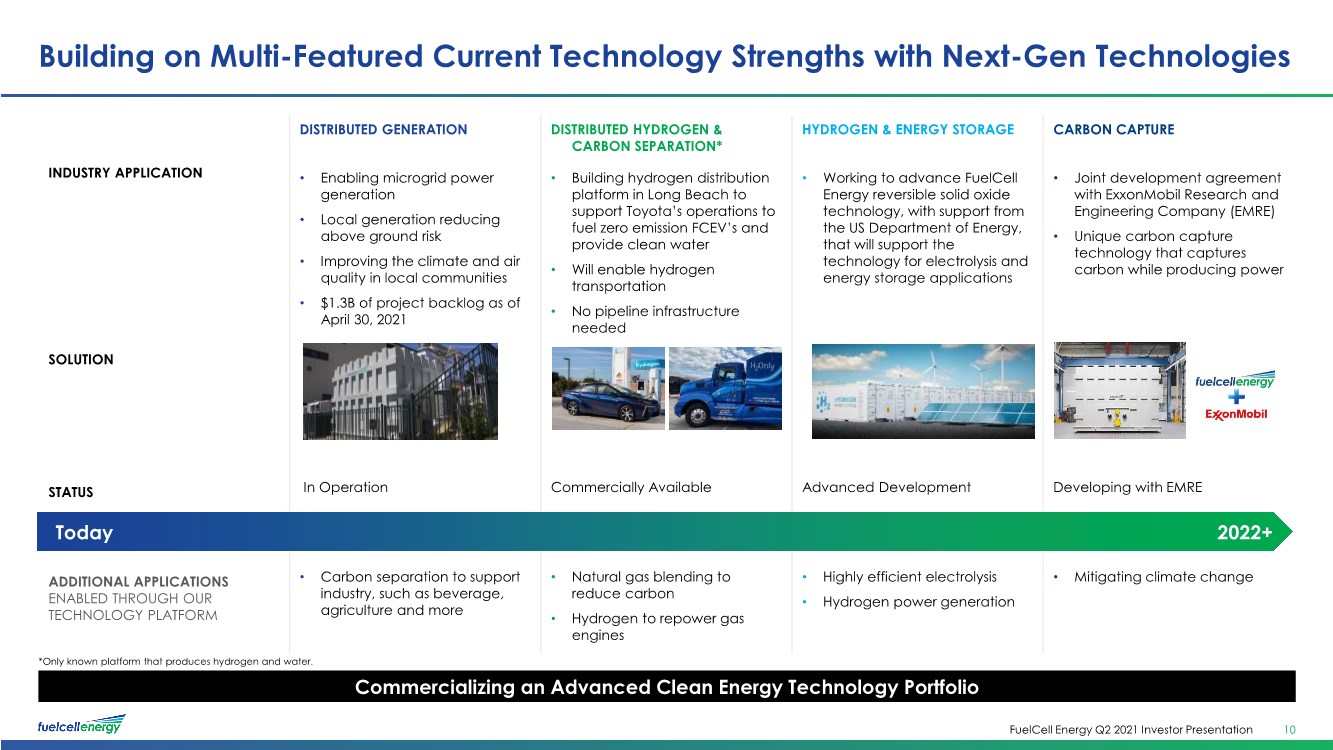
| FuelCell Energy Q2 2021 Investor Presentation *Only known platform that produces hydrogen and water. DISTRIBUTED GENERATION DISTRIBUTED HYDROGEN & CARBON SEPARATION* HYDROGEN & ENERGY STORAGE CARBON CAPTURE INDUSTRY APPLICATION • Enabling microgrid power generation • Local generation reducing above ground risk • Improving the climate and air quality in local communities • $1.3B of project backlog as of April 30, 2021 • Building hydrogen distribution platform in Long Beach to support Toyota’s operations to fuel zero emission FCEV’s and provide clean water • Will enable hydrogen transportation • No pipeline infrastructure needed • Working to advance FuelCell Energy reversible solid oxide technology, with support from the US Department of Energy, that will support the technology for electrolysis and energy storage applications • Joint development agreement with ExxonMobil Research and Engineering Company (EMRE) • Unique carbon capture technology that captures carbon while producing power SOLUTION STATUS In Operation Commercially Available Advanced Development Developing with EMRE ADDITIONAL APPLICATIONS ENABLED THROUGH OUR TECHNOLOGY PLATFORM • Carbon separation to support industry, such as beverage, agriculture and more • Natural gas blending to reduce carbon • Hydrogen to repower gas engines • Highly efficient electrolysis • Hydrogen power generation • Mitigating climate change Building on Multi-Featured Current Technology Strengths with Next-Gen Technologies 10 Commercializing an Advanced Clean Energy Technology Portfolio Today 2022+ |
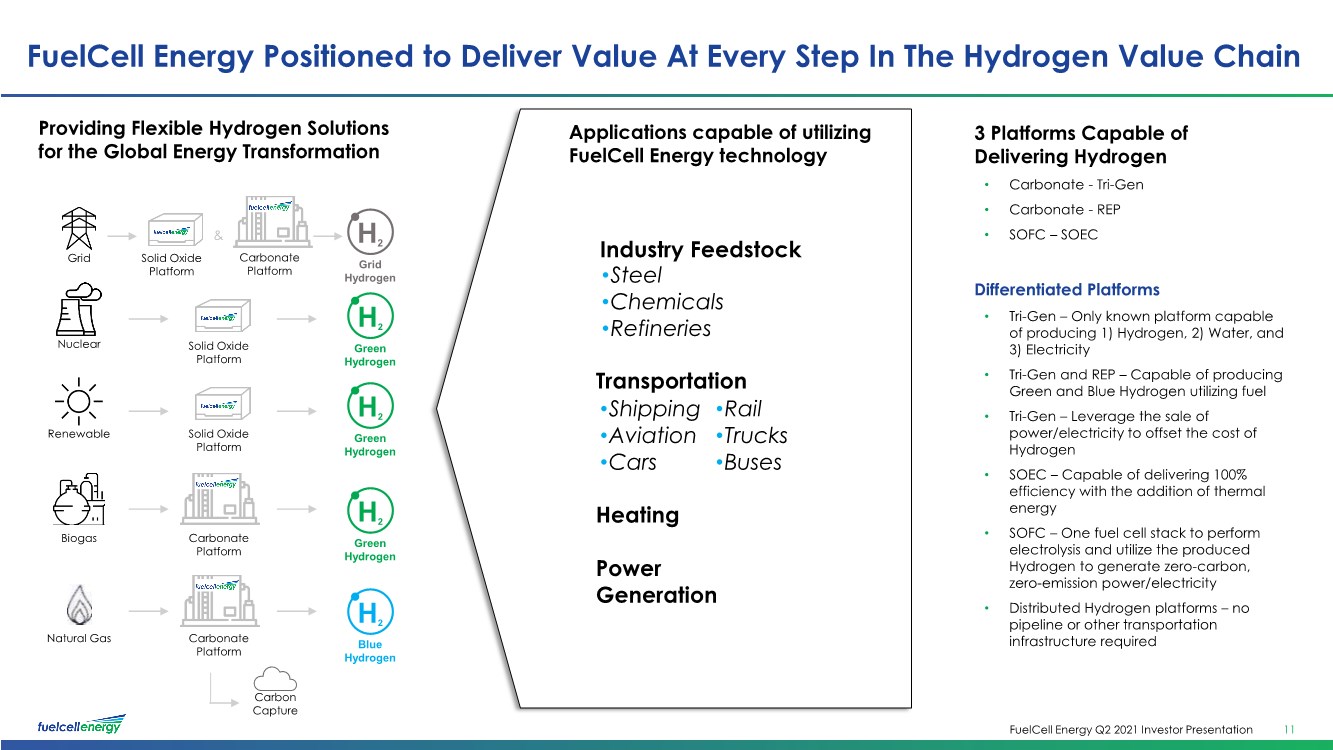
| FuelCell Energy Q2 2021 Investor Presentation Providing Flexible Hydrogen Solutions for the Global Energy Transformation FuelCell Energy Positioned to Deliver Value At Every Step In The Hydrogen Value Chain 11 3 Platforms Capable of Delivering Hydrogen • Carbonate - Tri-Gen • Carbonate - REP • SOFC – SOEC Differentiated Platforms • Tri-Gen – Only known platform capable of producing 1) Hydrogen, 2) Water, and 3) Electricity • Tri-Gen and REP – Capable of producing Green and Blue Hydrogen utilizing fuel • Tri-Gen – Leverage the sale of power/electricity to offset the cost of Hydrogen • SOEC – Capable of delivering 100% efficiency with the addition of thermal energy • SOFC – One fuel cell stack to perform electrolysis and utilize the produced Hydrogen to generate zero-carbon, zero-emission power/electricity • Distributed Hydrogen platforms – no pipeline or other transportation infrastructure required Industry Feedstock Transportation Applications capable of utilizing FuelCell Energy technology Heating Power Generation •Shipping •Aviation •Cars •Rail •Trucks •Buses •Steel •Chemicals •Refineries H2 Blue Hydrogen H2 Green Hydrogen H2 Green Hydrogen H2 Grid Hydrogen Solid Oxide Platform Solid Oxide Platform Solid Oxide Platform Carbonate Platform Carbonate Platform Grid Nuclear Renewable Biogas Natural Gas Carbon Capture Carbonate Platform & H2 Green Hydrogen |
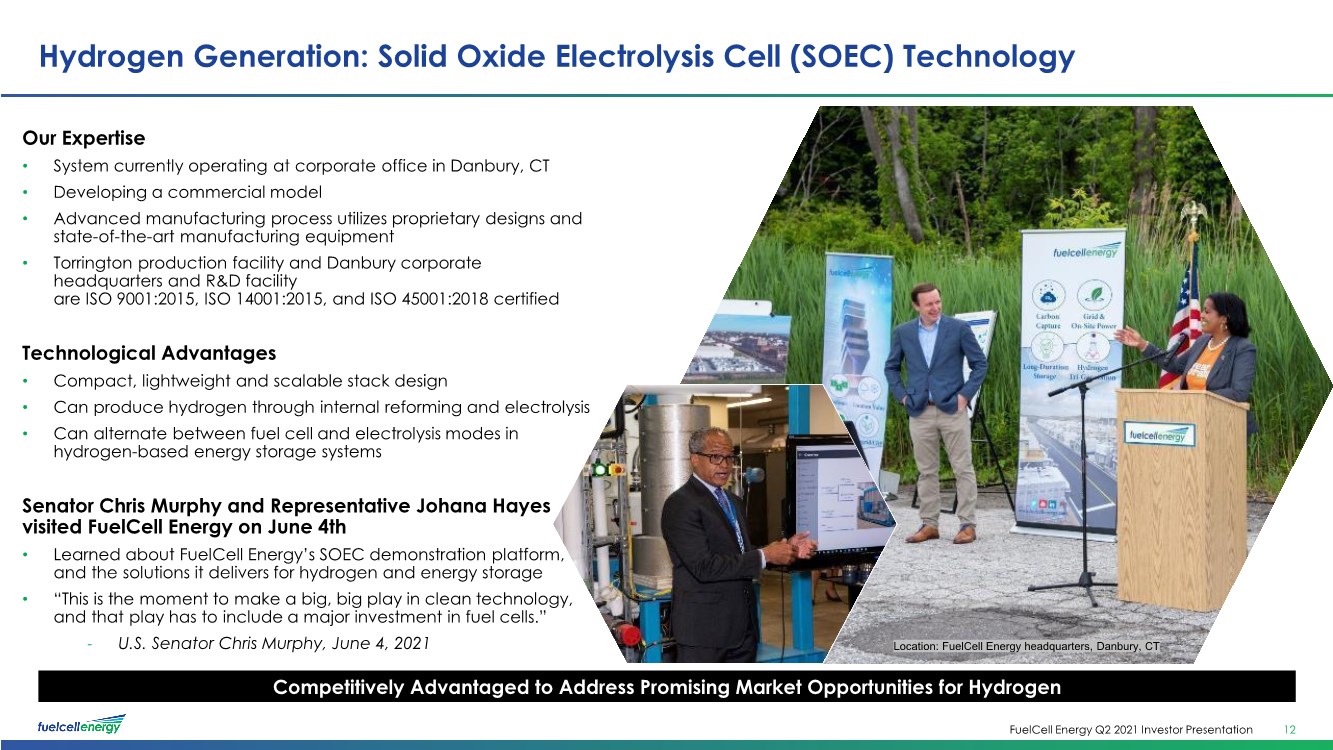
| FuelCell Energy Q2 2021 Investor Presentation Hydrogen Generation: Solid Oxide Electrolysis Cell (SOEC) Technology 12 Competitively Advantaged to Address Promising Market Opportunities for Hydrogen Location: FuelCell Energy headquarters, Danbury, CT Our Expertise • System currently operating at corporate office in Danbury, CT • Developing a commercial model • Advanced manufacturing process utilizes proprietary designs and state-of-the-art manufacturing equipment • Torrington production facility and Danbury corporate headquarters and R&D facility are ISO 9001:2015, ISO 14001:2015, and ISO 45001:2018 certified Technological Advantages • Compact, lightweight and scalable stack design • Can produce hydrogen through internal reforming and electrolysis • Can alternate between fuel cell and electrolysis modes in hydrogen-based energy storage systems Senator Chris Murphy and Representative Johana Hayes visited FuelCell Energy on June 4th • Learned about FuelCell Energy’s SOEC demonstration platform, and the solutions it delivers for hydrogen and energy storage •“This is the moment to make a big, big play in clean technology, and that play has to include a major investment in fuel cells.” - U.S. Senator Chris Murphy, June 4, 2021 |
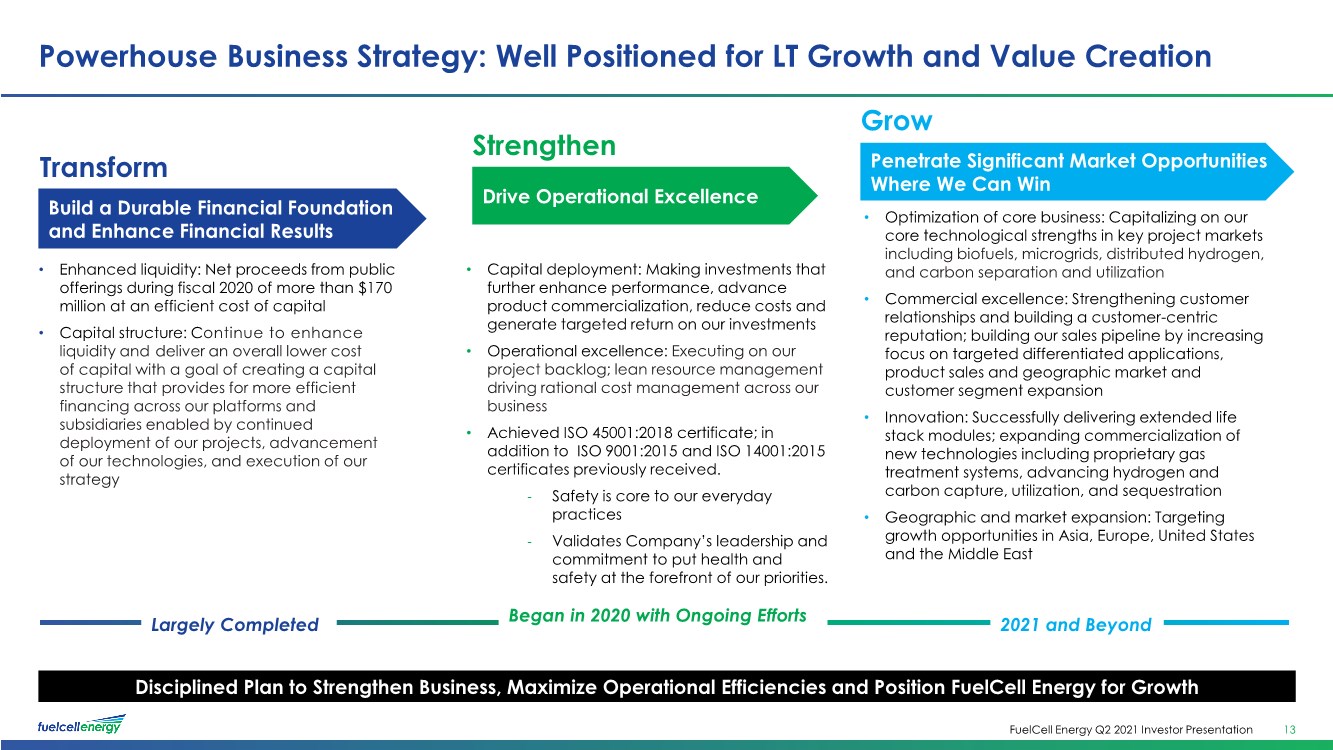
| FuelCell Energy Q2 2021 Investor Presentation • Enhanced liquidity: Net proceeds from public offerings during fiscal 2020 of more than $170 million at an efficient cost of capital • Capital structure: Continue to enhance liquidity and deliver an overall lower cost of capital with a goal of creating a capital structure that provides for more efficient financing across our platforms and subsidiaries enabled by continued deployment of our projects, advancement of our technologies, and execution of our strategy Powerhouse Business Strategy: Well Positioned for LT Growth and Value Creation 13 • Optimization of core business: Capitalizing on our core technological strengths in key project markets including biofuels, microgrids, distributed hydrogen, and carbon separation and utilization • Commercial excellence: Strengthening customer relationships and building a customer-centric reputation; building our sales pipeline by increasing focus on targeted differentiated applications, product sales and geographic market and customer segment expansion • Innovation: Successfully delivering extended life stack modules; expanding commercialization of new technologies including proprietary gas treatment systems, advancing hydrogen and carbon capture, utilization, and sequestration • Geographic and market expansion: Targeting growth opportunities in Asia, Europe, United States and the Middle East • Capital deployment: Making investments that further enhance performance, advance product commercialization, reduce costs and generate targeted return on our investments • Operational excellence: Executing on our project backlog; lean resource management driving rational cost management across our business • Achieved ISO 45001:2018 certificate; in addition to ISO 9001:2015 and ISO 14001:2015 certificates previously received. - Safety is core to our everyday practices - Validates Company’s leadership and commitment to put health and safety at the forefront of our priorities. Disciplined Plan to Strengthen Business, Maximize Operational Efficiencies and Position FuelCell Energy for Growth Build a Durable Financial Foundation and Enhance Financial Results Drive Operational Excellence Penetrate Significant Market Opportunities Where We Can Win Transform Strengthen Grow Largely Completed Began in 2020 with Ongoing Efforts 2021 and Beyond |
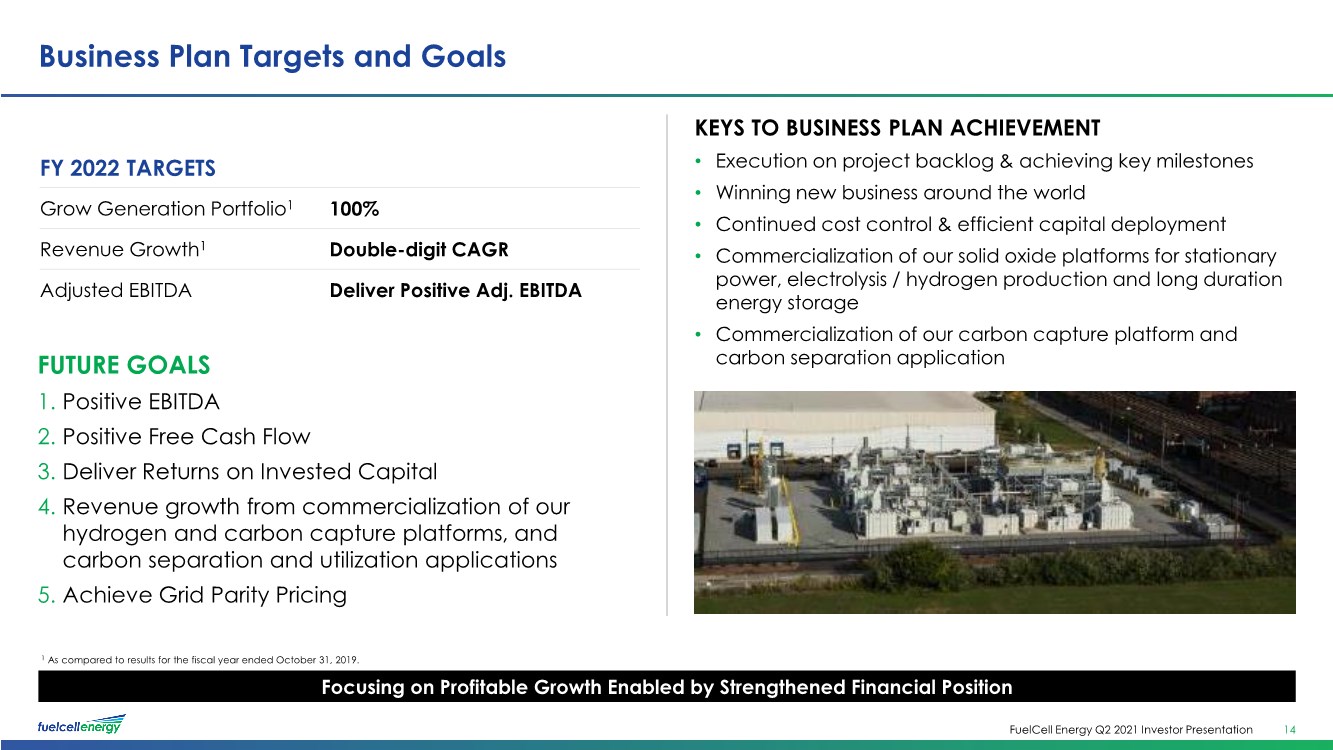
| FuelCell Energy Q2 2021 Investor Presentation FUTURE GOALS 1. Positive EBITDA 2. Positive Free Cash Flow 3. Deliver Returns on Invested Capital 4. Revenue growth from commercialization of our hydrogen and carbon capture platforms, and carbon separation and utilization applications 5. Achieve Grid Parity Pricing Business Plan Targets and Goals 14 KEYS TO BUSINESS PLAN ACHIEVEMENT • Execution on project backlog & achieving key milestones • Winning new business around the world • Continued cost control & efficient capital deployment • Commercialization of our solid oxide platforms for stationary power, electrolysis / hydrogen production and long duration energy storage • Commercialization of our carbon capture platform and carbon separation application Focusing on Profitable Growth Enabled by Strengthened Financial Position FY 2022 TARGETS Grow Generation Portfolio1 100% Revenue Growth1 Double-digit CAGR Adjusted EBITDA Deliver Positive Adj. EBITDA 1 As compared to results for the fiscal year ended October 31, 2019. |
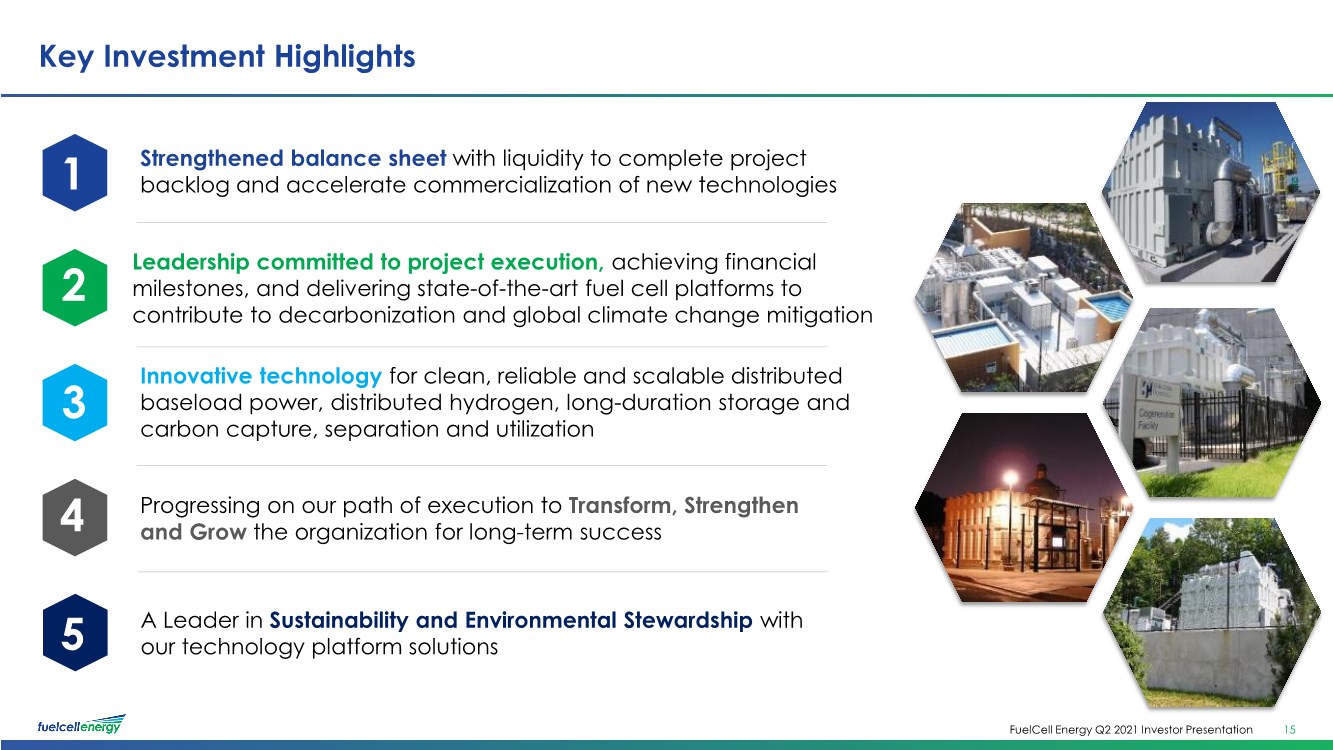
| FuelCell Energy Q2 2021 Investor Presentation Key Investment Highlights 15 1 2 3 4 Strengthened balance sheet with liquidity to complete project backlog and accelerate commercialization of new technologies Leadership committed to project execution, achieving financial milestones, and delivering state-of-the-art fuel cell platforms to contribute to decarbonization and global climate change mitigation Innovative technology for clean, reliable and scalable distributed baseload power, distributed hydrogen, long-duration storage and carbon capture, separation and utilization Progressing on our path of execution to Transform, Strengthen and Grow the organization for long-term success 5 A Leader in Sustainability and Environmental Stewardship with our technology platform solutions |
| FuelCell Energy Q2 2021 Investor Presentation Fuel Cell Project: SureSourceTM 7.4 MW Yaphank, NY Q&A |
| FuelCell Energy Q2 2021 Investor Presentation Fuel Cell Project: SureSourceTM 7.4 MW Yaphank, NY Appendix |

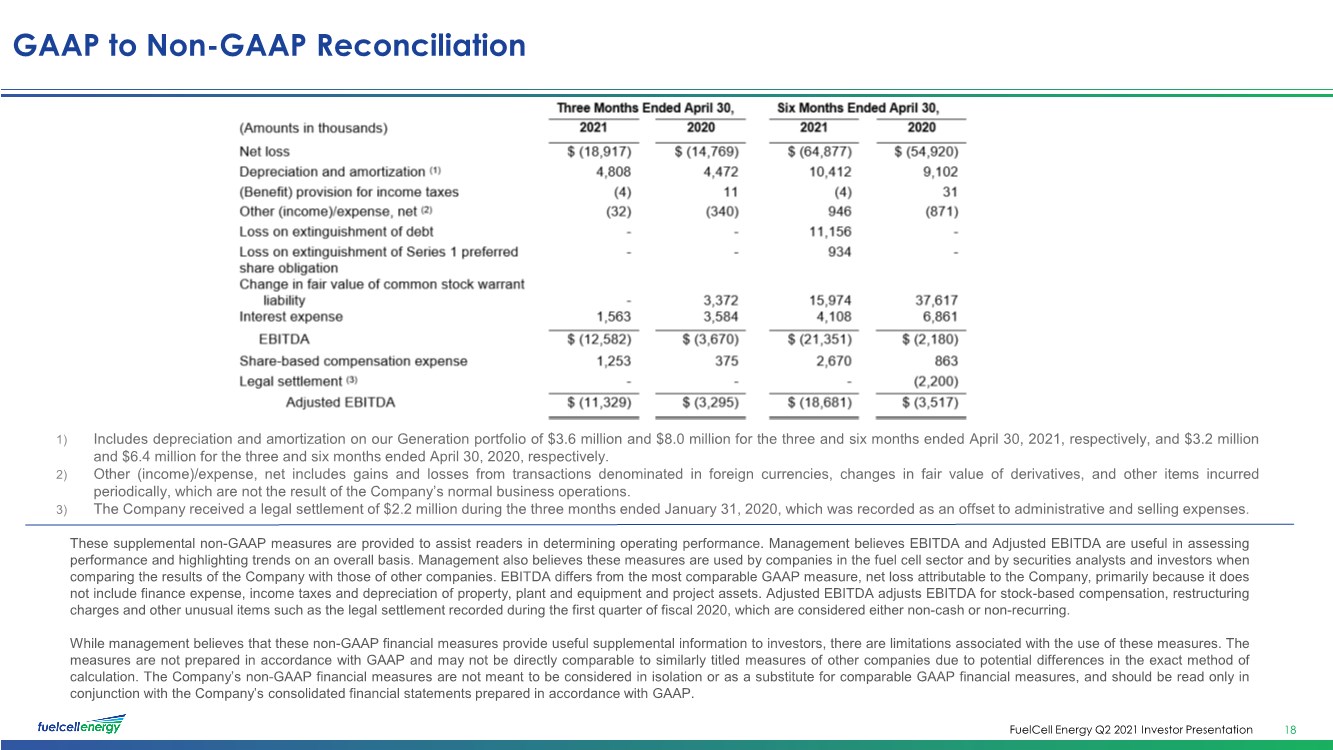
| FuelCell Energy Q2 2021 Investor Presentation GAAP to Non-GAAP Reconciliation These supplemental non-GAAP measures are provided to assist readers in determining operating performance. Management believes EBITDA and Adjusted EBITDA are useful in assessing performance and highlighting trends on an overall basis. Management also believes these measures are used by companies in the fuel cell sector and by securities analysts and investors when comparing the results of the Company with those of other companies. EBITDA differs from the most comparable GAAP measure, net loss attributable to the Company, primarily because it does not include finance expense, income taxes and depreciation of property, plant and equipment and project assets. Adjusted EBITDA adjusts EBITDA for stock-based compensation, restructuring charges and other unusual items such as the legal settlement recorded during the first quarter of fiscal 2020, which are considered either non-cash or non-recurring. While management believes that these non-GAAP financial measures provide useful supplemental information to investors, there are limitations associated with the use of these measures. The measures are not prepared in accordance with GAAP and may not be directly comparable to similarly titled measures of other companies due to potential differences in the exact method of calculation. The Company’s non-GAAP financial measures are not meant to be considered in isolation or as a substitute for comparable GAAP financial measures, and should be read only in conjunction with the Company’s consolidated financial statements prepared in accordance with GAAP. 1) Includes depreciation and amortization on our Generation portfolio of $3.6 million and $8.0 million for the three and six months ended April 30, 2021, respectively, and $3.2 million and $6.4 million for the three and six months ended April 30, 2020, respectively. 2) Other (income)/expense, net includes gains and losses from transactions denominated in foreign currencies, changes in fair value of derivatives, and other items incurred periodically, which are not the result of the Company’s normal business operations. 3) The Company received a legal settlement of $2.2 million during the three months ended January 31, 2020, which was recorded as an offset to administrative and selling expenses. 18 |
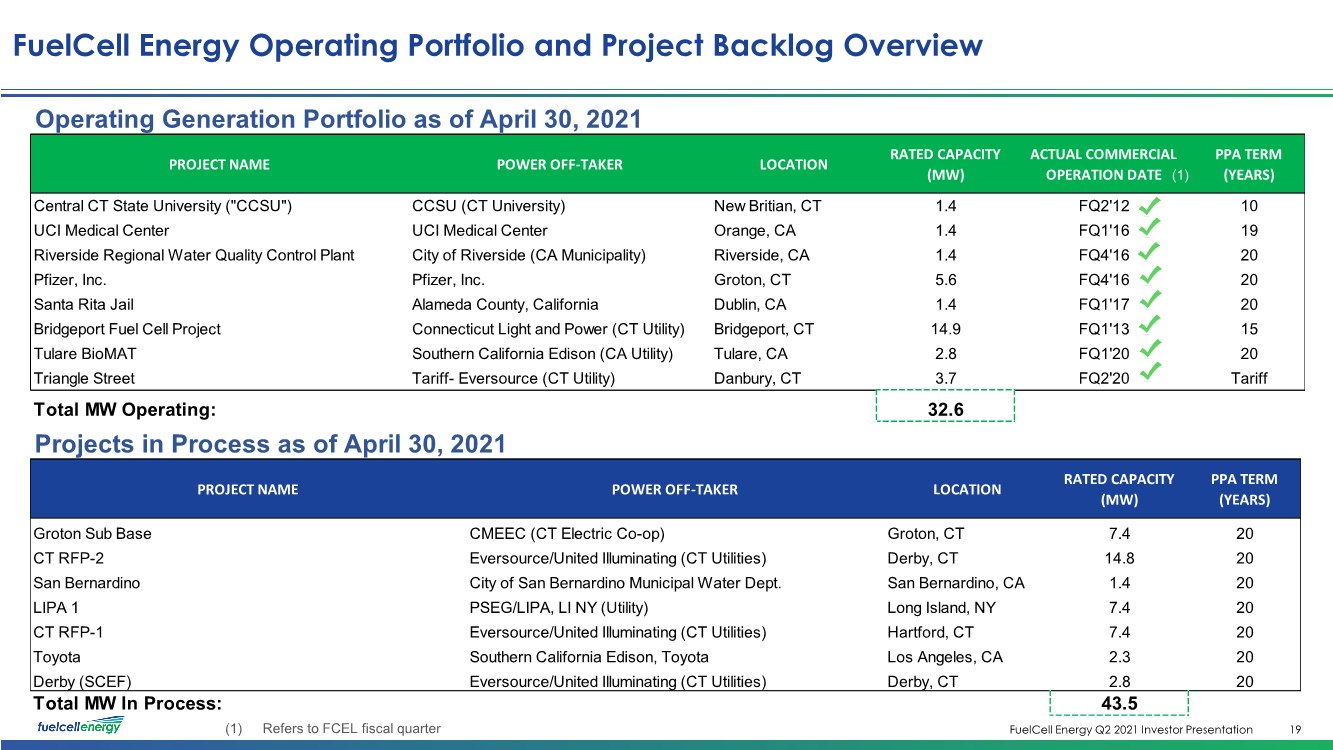
| FuelCell Energy Q2 2021 Investor Presentation PROJECT NAME POWER OFF-TAKER LOCATION RATED CAPACITY (MW) ACTUAL COMMERCIAL OPERATION DATE PPA TERM (YEARS) Central CT State University ("CCSU") CCSU (CT University) New Britian, CT 1.4 FQ2'12 10 UCI Medical Center UCI Medical Center Orange, CA 1.4 FQ1'16 19 Riverside Regional Water Quality Control Plant City of Riverside (CA Municipality) Riverside, CA 1.4 FQ4'16 20 Pfizer, Inc. Pfizer, Inc. Groton, CT 5.6 FQ4'16 20 Santa Rita Jail Alameda County, California Dublin, CA 1.4 FQ1'17 20 Bridgeport Fuel Cell Project Connecticut Light and Power (CT Utility) Bridgeport, CT 14.9 FQ1'13 15 Tulare BioMAT Southern California Edison (CA Utility) Tulare, CA 2.8 FQ1'20 20 Triangle Street Tariff- Eversource (CT Utility) Danbury, CT 3.7 FQ2'20 Tariff 32.6 Operating Generation Portfolio as of April 30, 2021 Total MW Operating: FuelCell Energy Operating Portfolio and Project Backlog Overview 19 (1) Refers to FCEL fiscal quarter (1) (1) PROJECT NAME POWER OFF-TAKER LOCATION RATED CAPACITY (MW) PPA TERM (YEARS) Groton Sub Base CMEEC (CT Electric Co-op) Groton, CT 7.4 20 CT RFP-2 Eversource/United Illuminating (CT Utilities) Derby, CT 14.8 20 San Bernardino City of San Bernardino Municipal Water Dept. San Bernardino, CA 1.4 20 LIPA 1 PSEG/LIPA, LI NY (Utility) Long Island, NY 7.4 20 CT RFP-1 Eversource/United Illuminating (CT Utilities) Hartford, CT 7.4 20 Toyota Southern California Edison, Toyota Los Angeles, CA 2.3 20 Derby (SCEF) Eversource/United Illuminating (CT Utilities) Derby, CT 2.8 20 43.5 Projects in Process as of April 30, 2021 Total MW In Process: |