Attached files
| file | filename |
|---|---|
| 8-K - FORM 8-K - OXFORD INDUSTRIES INC | f8k_060921.htm |
| EX-99.1 - PRESS RELEASE - OXFORD INDUSTRIES INC | exh_991.htm |
Exhibit 99.2
Investor Highlights June 9, 2021 NYSE: OXM

We own brands that make people happy
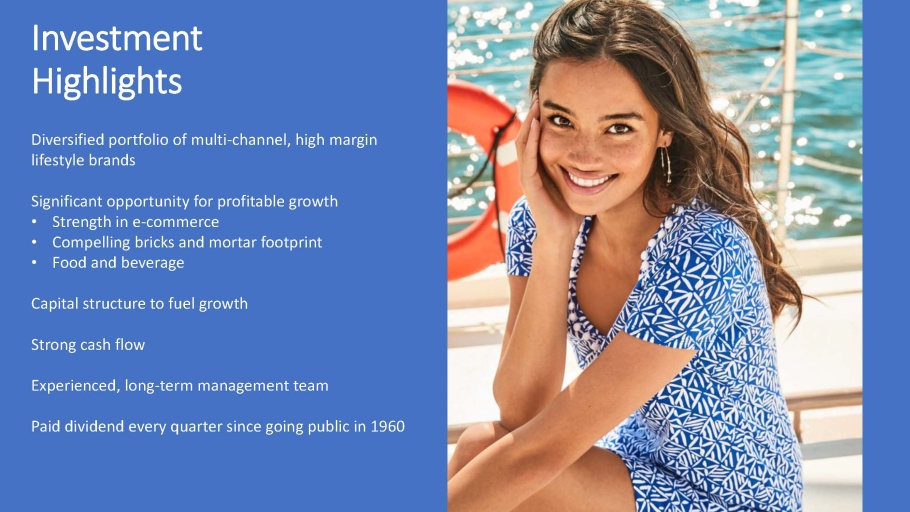
Investment Highlights Diversified portfolio of multi - channel, high margin lifestyle brands Significant opportunity for profitable growth • Strength in e - commerce • Compelling bricks and mortar footprint • Food and beverage Capital structure to fuel growth Strong cash flow Experienced, long - term management team Paid dividend every quarter since going public in 1960

Financial Highlights FY 21* FY 20 FY 19 Revenue $1.015B - $1.05B $749M $1.1B EPS - GAAP $4.55 - $4.85 ($5.77) $4.05 EPS - Adjusted $4.85 - $5.15 ($1.81) $4.32 Q1 21 Q1 20 Q1 19 Revenue $266M $160M $282M EPS - GAAP $1.70 ($4.02) $1.29 EPS - Adjusted $1.89 ($1.12) $1.30 * Outlook provided on June 9, 2021. See Forward - Looking Statements on slide 6 for additional information regarding projected financial results. Retail 38% E - commerce 33% Restaurants 9% Wholesale 20% Projected FY21 Revenue by Channel of Distribution* Tommy Bahama 64% Lilly Pulitzer 27% Southern Tide 4% Other 3% Lanier Apparel 2% Projected FY21 Revenue by Operating Group*
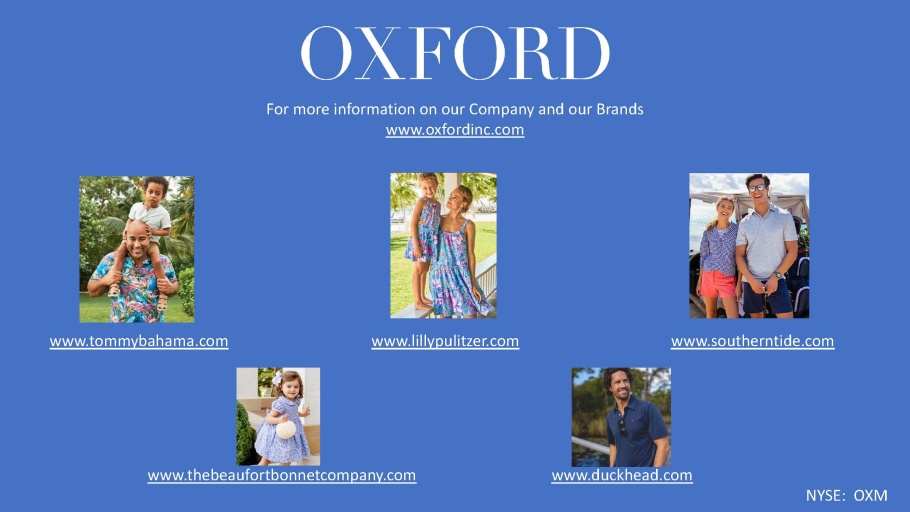
For more information on our Company and our Brands www.oxfordinc.com NYSE: OXM www.tommybahama.com www.lillypulitzer.com www.southerntide.com www.duckhead.com www.thebeaufortbonnetcompany.com
Oxford NYSE: OXM This infographic was prepared as of June 9, 2021, and any subsequent distribution, dissemination or reproduction of this info gra phic or any of its content is not an affirmation or restatement of any forward - looking statements contained herein. Forward - Looking Statements This infographic includes statements that constitute forward - looking statements. Such statements are subject to a number of risk s, uncertainties and assumptions which could cause actual results to differ materially from those anticipated or projected, including, without li mitation, those identified under Part I, Item 1A. contained in our Annual Report on Form 10 - K for the period ended January 30, 2021 under the heading “Risk Factors,” those descri bed from time to time in subsequent reports filed with the SEC and those identified in our press release dated June 9, 2021 under the caption, “Safe Harbor”, all of whic h a re available under the Investor Relations tab of our website at oxfordinc.com. Those risks may not be the only risks which may impact our forward - looking statements. We disclaim an y intention, obligation or duty to update or revise any forward - looking statements, whether as a result of new information, future events or otherwise, except as required by law. Basis of Presentation All per share information is presented on a diluted basis. Non - GAAP Measures This infographic contains certain non - GAAP financial metrics, such as adjusted earnings per share, which are intended to supplem ent our consolidated financial results presented in accordance with GAAP. We use these adjusted financial measures in making financial, operational and planning decisions, to evaluate our ongoing performance and in discussions with investment and other financial institutions, our board of directors and others. Reconcili ati ons of these adjusted measures to the most directly comparable GAAP financial measures are presented in tables included at the end of our press release dated June 9, 2021.