Attached files
| file | filename |
|---|---|
| 8-K - FORM 8-K - Limbach Holdings, Inc. | tm2119101d1_8k.htm |
Exhibit 99.1

Investor Presentation June 2021 Diverse භ Evolving භ Essential 1

Forward Looking Statements We make forward - looking statements in this presentation within the meaning of the Private Securities Litigation Reform Act of 1995 . These forward - looking statements relate to expectations or forecasts for future events, including, without limitation, the execution of the Company’s long - term strategic roadmap . These statements may be preceded by, followed by or include the words “may,” “might,” “will,” “will likely result,” “should,” “estimate,” “plan,” “project,” “forecast,” “intend,” “expect,” “anticipate,” “believe,” “seek,” “continue,” “target” or similar expressions . These forward - looking statements are based on information available to us as of the date they were made and involve a number of risks and uncertainties which may cause them to turn out to be wrong . Some of these risks and uncertainties may in the future be amplified by the COVID - 19 outbreak and there may be additional risks that we consider immaterial, or which are unknown . Accordingly, forward - looking statements should not be relied upon as representing our views as of any subsequent date, and we do not undertake any obligation to update forward - looking statements to reflect events or circumstances after the date they were made, whether as a result of new information, future events or otherwise, except as may be required under applicable securities laws . As a result of a number of known and unknown risks and uncertainties, our actual results or performance may be materially different from those expressed or implied by these forward - looking statements . Please refer to our most recent annual report on Form 10 - K, as well as our subsequent filings on Form 10 - Q and Form 8 - K, which are available on the SEC’s website ( www . sec . gov ), for a full discussion of the risks and other factors that may impact any forward - looking statements in this presentation . 2

BUSINESS OVERVIEW 3

Complete Portfolio of MEP Services • National provider of integrated design, engineering, installation, maintenance and building system management solutions to facility owners and other sophisticated customers • Single source, technically - driven provider of full - lifecycle solutions for mechanical, electrical, plumbing and controls (MEP+C) systems across high - growth end - markets 4 Data Driven Solutions Construction and Installation Operations and Maintenance and 24/7 Service Commissioning 3D Estimating / Design to Estimate Modular / Offsite Construction Planning and Coordination Engineering and Energy Modeling

Well Diversified Business Model • Provides insulation against regional economic fluctuations, a changing regulatory and political environment, and end - market cyclicality • Offers opportunities for continued expansion , leveraging the Company’s platform to gain market share and drive growth in revenue and profitability 5 Utilizing Our National Expertise at a Local Level To Provide the Right MEP+C Solutions To Each Market We Serve And the Building Owners and Contractors That We Work For Secondary Markets Primary Markets HEALTHCARE MISSION CRITICAL CONTROLLED AGRICULTURE EDUCATION SPORTS & ENTERTAINMENT INDUSTRIAL AND MANUFACTURING GOVERNMENT INFRASTRUCTURE COMMERCIAL HOSPITALITY

Broad Geographic Reach • Operations in 21 cities , including exposure to large East Coast population centers and active secondary and tertiary MSAs in the Midwest and Southeast • Well - established presence in the energy and manufacturing - driven resurgent Midwest, and the continued demographic growth of Florida and the Southwest 6 Expansion • Greenfield expansion into markets adjacent to legacy operations – what Limbach has always done and will continue to do • Compelling new geographic markets for acquisition - driven entry over the coming years : • Southeast • Deeper into the Midwest • Texas Southern California භ Eastern & Central Michigan භ Columbus and Southeast Ohio භ Western Pennsylvania භ Mid - Atlantic භ Eastern Pennsylvania භ Delaware භ New England භ New Jersey භ Nashville, Tennessee භ Tampa, Orlando, and Boynton Beach, Florida

Large and Stable End - Markets with Great Customer Relationships • Serving growing end - markets that require specialized technical capabilities and innovative solutions • Targeting markets that drive repeat business and provide for an executive - level dialogue that is unmatched in the industry • We are the preferred partner for leading general contractors, construction managers and facility owners, with excellent brand recognition 7 Primary Markets Secondary Markets HEALTHCARE MISSION CRITICAL SPORTS & ENTERTAINMENT CONTROLLED AGRICULTURE EDUCATION INDUSTRIAL / MANUFACTURING COMMERCIAL GOVERNMENT INFRASTRUCTURE HOSPITALITY

Growth Strategy We intend to strategically grow our company on a compound basis, both organically and through acquisition • Through our Sales Strateg y , we seek to broaden our customer base and to deliver an expanded array of conventional and technical mechanical and facility services • We are expanding Limbach Collaborative Services to provide professional design, engineering and program management services beyond our branch territory, and to service a national client base • We expect to acquire strategically synergistic companies that will supplement our current business model, address capability gaps, and enhance the breadth of our service offerings

Customer Segmentation Reflecting a broader and expanded customer base, Limbach has two distinct segments for operational and financial reporting purposes : • General Contractor Relationships (GCR) : In the GCR segment, Limbach generally manages new construction or renovation projects that involve primarily heating, ventilation, and air conditioning (“HVAC”), plumbing, or electrical services awarded to the Company by general contractors or construction managers . This segment was previously referred to as the “Construction” segment . • Owner Direct Relationships (ODR) : In the ODR segment, Limbach provides maintenance or service primarily on HVAC, plumbing or electrical systems, building controls and specialty contracting projects direct to, or assigned by, building owners or property managers . This segment was previously referred to as the “Service” segment .

The owner - driven business model has two distinct stages . • The first stage of our strategic evolution is focused on optimizing margins in the General Contractor Relationships segment and achieving accelerated growth in the Owner Direct Relationships segment by expanding the number and breadth of owner relationships that we serve on a direct basis . • The second stage of our strategic evolution is to leverage these expanded owner - direct relationships to deliver a broad suite of services including technology - enabled capabilities and products that leverage both professional services and field services . Owner Direct Business Model Evolution Sell existing services to a larger, owner - focused customer base. Target new owner direct customers. Stage 1 of Strategy Leverage owner relationships to provide an expanded offering of technolgy - enabled products and services. Stage 2 of Strategy ODS 10 • Engineering • Fabrication • Construction • Service and Maintenance • Predictive Analytics • Capital Planning • Virtual Technician • Energy Management • Data Analytics

Our business model is evolving to accomplish two primary objectives : • First, to optimize the return on the capital and resources deployed to large project construction in order to best align Limbach’s capabilities with market opportunities • Second, to expand the breadth and depth of our relationships with building owners who offer greater revenue opportunities and superior risk - adjusted margins Earned Revenue Owner Direct Strategy Drives a High - Margin Business Mix 11 77.6% 22.4% Construction Service 2020 2025 50.0% 50.0% GCR ODR

Investment Summary • Limbach is well positioned in the current environment to capitalize on emerging trends in building infrastructure and mechanical system optimization, and to further increase earnings and enterprise value • The unique combination and integration of professional services and field capabilities presents new opportunities for delivering value to an expanding customer base, and for revenue and profit growth across multiple strategies 12 `` 120 - year legacy of providing technically driven building solutions Brand Value Geographic, end - market and customer diversification provides risk mitigation and a lack of correlation to national economic trends Diversification Improving field execution, SG&A leverage and new revenue streams expected to drive margin expansion in coming quarters Profit Expansion Gathering momentum in energy efficiency and improving indoor air quality support continued organic growth Gr owth Outlook Recent equity offering and debt refinancing reinforce the strength of the balance sheet and reduce the cost of debt capital Balance Sheet Accretive Merger and Acquisition opportunities to support the owner direct model and geographic expansion initiatives M & A Opportunities

1 Q’21 OPERATING AND FINANCIAL UPDATE 13

1 Q’21 Operating and Financial Update Quarterly Performance 14 Dollars in millions. 1. See the Company’s quarterly report on Form 10 - Q for the quarterly period ended March 31, 2021. 2. See p. 17 for Non - GAAP Reconciliation Table. $109.5 $84.8 $29.3 $28.5 1Q'20 1Q'21 GCR ODR Earned Revenue 1 Gross Profit and Margin 1 $ 138.8 $3.7 $2.1 1Q'20 1Q'21 Adjusted EBITDA 2 - 44.6% - 5.5% - 18.3% Year - Over - Year Change Year - Over - Year Change Year - Over - Year Change $11.0 $9.4 $7.2 $7.8 13.1% 15.2% 1Q'20 1Q'21 GCR ODR $113.3 $ 18.2 $17.2

1 Q’21 Operating and Financial Update Reduced Leverage and Continuing Improvements in Capitalization 15 Key Balance Sheet Items 1,2 December 31, 2020 March 31, 2021 Current Assets $199.4 $ 195.9 Current Liabilities $150.3 $ 134.5 Working Capital $49.1 $61.3 Net Under / (Over) Billing 3 ($14.1) ($0.7) Revolver — — Term Loans $39.0 $29.5 Capital Leases $6.5 $5.9 Total Debt $45.5 $35.4 Equity $53.7 $76.8 Dollars in millions. 1. See the Company’s quarterly report on Form 10 - Q for the quarterly period ended March 31, 2021. 2. On February 24, 2021, the Company refinanced its senior credit facility. Pro forma for the refinancing, the Term Loan balance wa s $ 30 million. 3. Refer to Note 5 within the Company’s quarterly report on Form 10 - Q for the quarterly period ended March 31, 2021 for the calculation of the Company’s net billing position.

APPENDIX 16
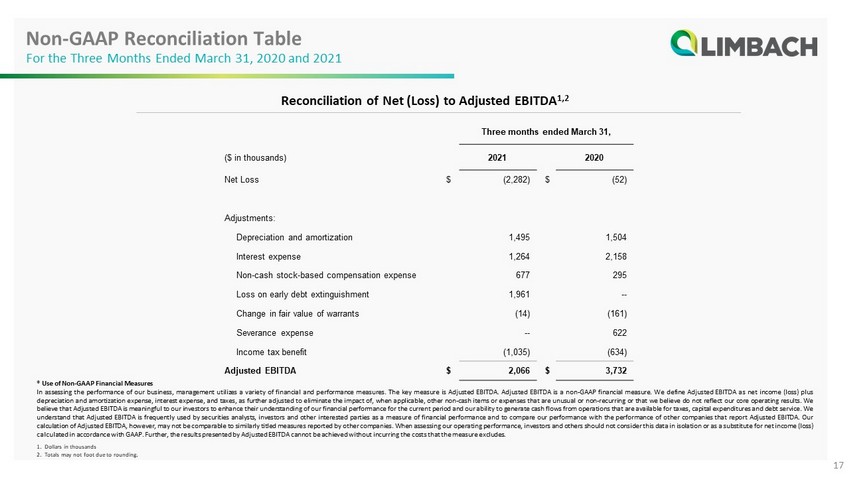
Non - GAAP Reconciliation Table For the Three Months Ended March 31, 2020 and 2021 17 * Use of Non - GAAP Financial Measures In assessing the performance of our business, management utilizes a variety of financial and performance measures . The key measure is Adjusted EBITDA . Adjusted EBITDA is a non - GAAP financial measure . We define Adjusted EBITDA as net income (loss) plus depreciation and amortization expense, interest expense, and taxes, as further adjusted to eliminate the impact of, when applicable, other non - cash items or expenses that are unusual or non - recurring or that we believe do not reflect our core operating results . We believe that Adjusted EBITDA is meaningful to our investors to enhance their understanding of our financial performance for the current period and our ability to generate cash flows from operations that are available for taxes, capital expenditures and debt service . We understand that Adjusted EBITDA is frequently used by securities analysts, investors and other interested parties as a measure of financial performance and to compare our performance with the performance of other companies that report Adjusted EBITDA . Our calculation of Adjusted EBITDA, however, may not be comparable to similarly titled measures reported by other companies . When assessing our operating performance, investors and others should not consider this data in isolation or as a substitute for net income (loss) calculated in accordance with GAAP . Further, the results presented by Adjusted EBITDA cannot be achieved without incurring the costs that the measure excludes . 1. Dollars in thousands 2. Totals may not foot due to rounding . Three months ended March 31, ($ in thousands) 2021 2020 Net Loss $ (2,282) $ (52) Adjustments: Depreciation and amortization 1,495 1,504 Interest expense 1,264 2,158 Non - cash stock - based compensation expense 677 295 Loss on early debt extinguishment 1,961 -- Change in fair value of warrants (14) (161) Severance expense -- 622 Income tax benefit (1,035) (634) Adjusted EBITDA $ 2,066 $ 3,732 Reconciliation of Net (Loss) to Adjusted EBITDA 1,2

Diverse ● Evolving ● Essential 18