Attached files
| file | filename |
|---|---|
| EX-99.1 - EX-99.1 - Cano Health, Inc. | d142136dex991.htm |
| 8-K - FORM 8-K - Cano Health, Inc. | d142136d8k.htm |

Q1 2021 Supplemental Materials June 9, 2021 Exhibit 99.2
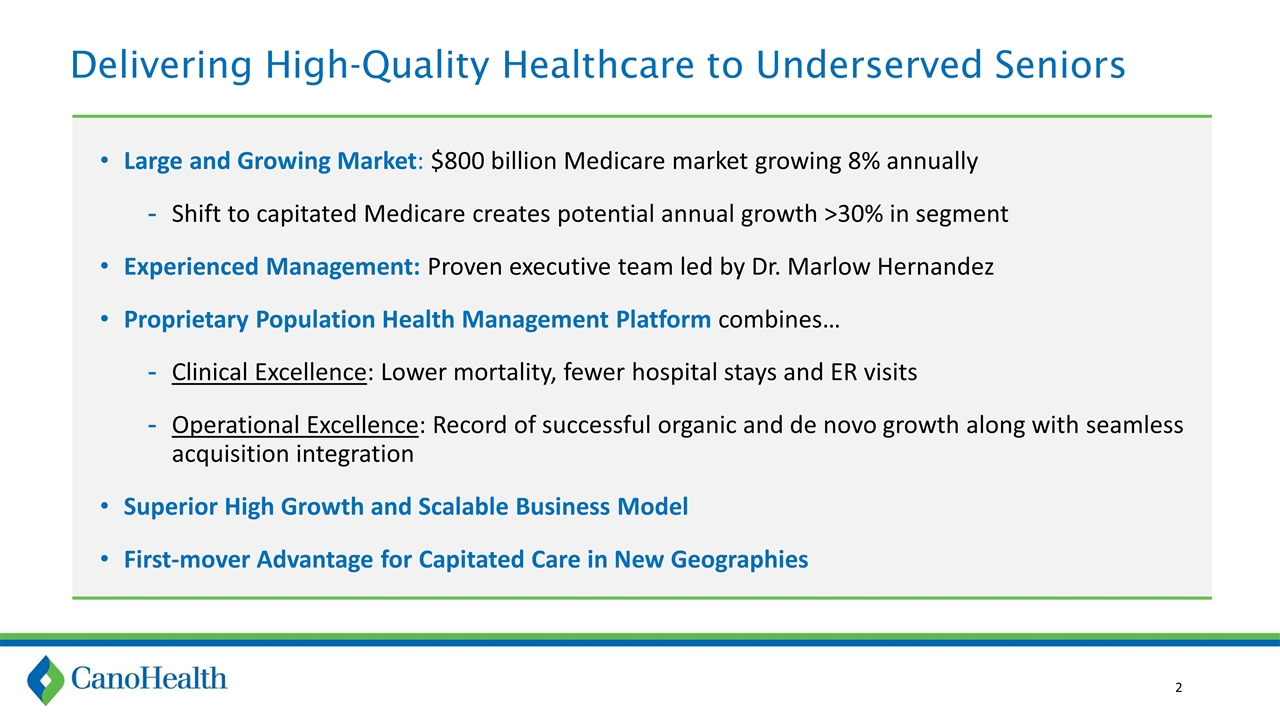
Delivering High-Quality Healthcare to Underserved Seniors Large and Growing Market: $800 billion Medicare market growing 8% annually Shift to capitated Medicare creates potential annual growth >30% in segment Experienced Management: Proven executive team led by Dr. Marlow Hernandez Proprietary Population Health Management Platform combines… Clinical Excellence: Lower mortality, fewer hospital stays and ER visits Operational Excellence: Record of successful organic and de novo growth along with seamless acquisition integration Superior High Growth and Scalable Business Model First-mover Advantage for Capitated Care in New Geographies
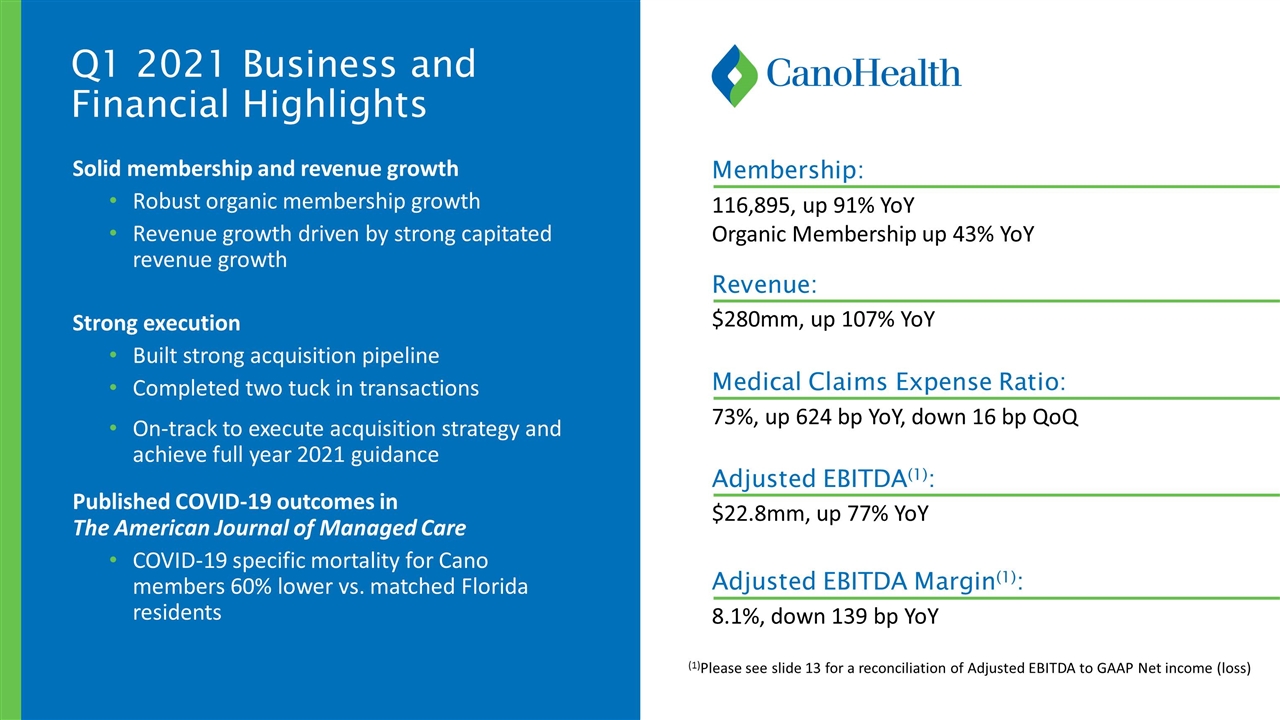
Q1 2021 Business and Financial Highlights Solid membership and revenue growth Robust organic membership growth Revenue growth driven by strong capitated revenue growth Strong execution Built strong acquisition pipeline Completed two tuck in transactions On-track to execute acquisition strategy and achieve full year 2021 guidance Published COVID-19 outcomes in The American Journal of Managed Care COVID-19 specific mortality for Cano members 60% lower vs. matched Florida residents $280mm, up 107% YoY 73%, up 624 bp YoY, down 16 bp QoQ $22.8mm, up 77% YoY 8.1%, down 139 bp YoY Revenue: 116,895, up 91% YoY Organic Membership up 43% YoY Membership: Medical Claims Expense Ratio: Adjusted EBITDA(1): Adjusted EBITDA Margin(1): (1)Please see slide 13 for a reconciliation of Adjusted EBITDA to GAAP Net income (loss)
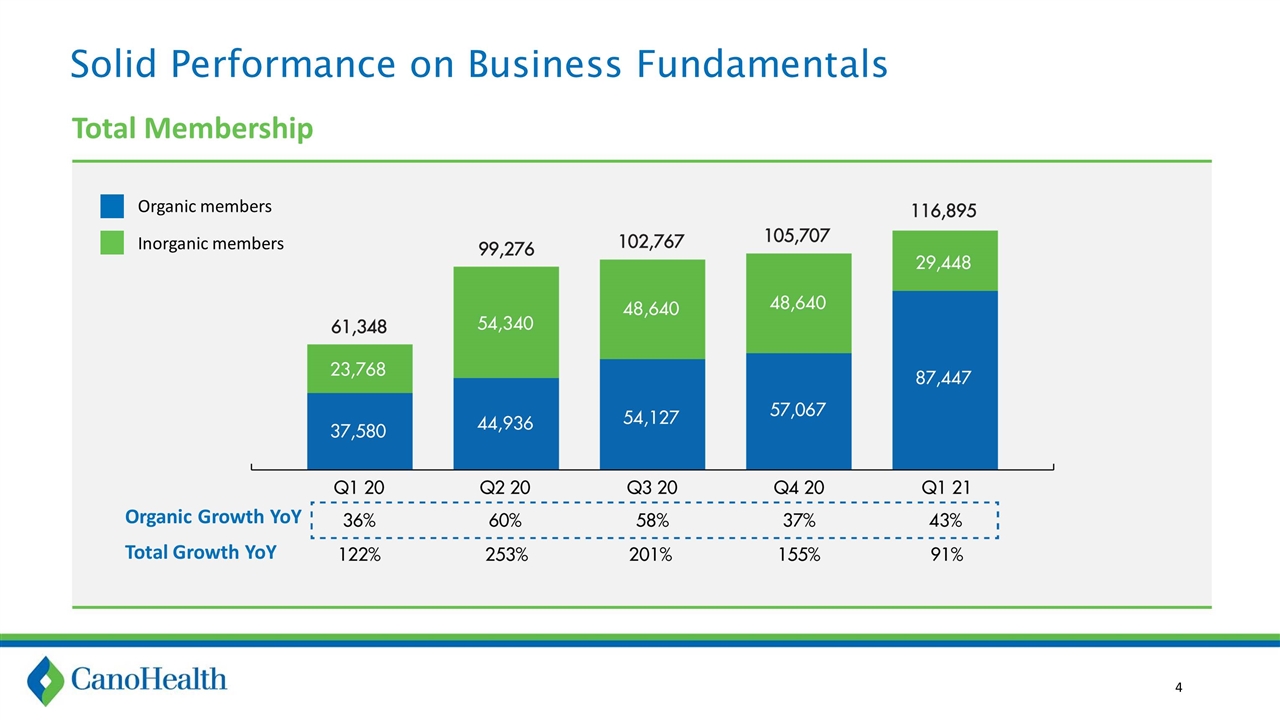
Solid Performance on Business Fundamentals Total Membership Organic Growth YoY Total Growth YoY Organic members Inorganic members
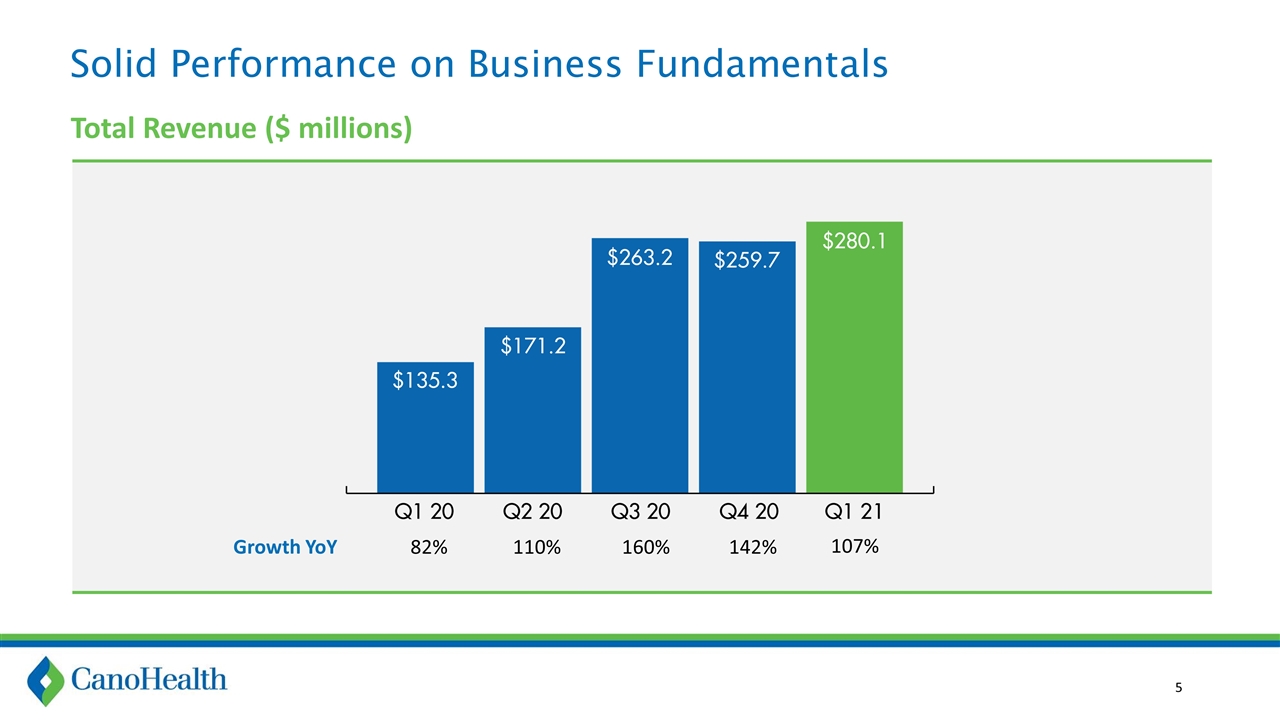
Solid Performance on Business Fundamentals Total Revenue ($ millions) Growth YoY 82% 110% 160% 142% 107%
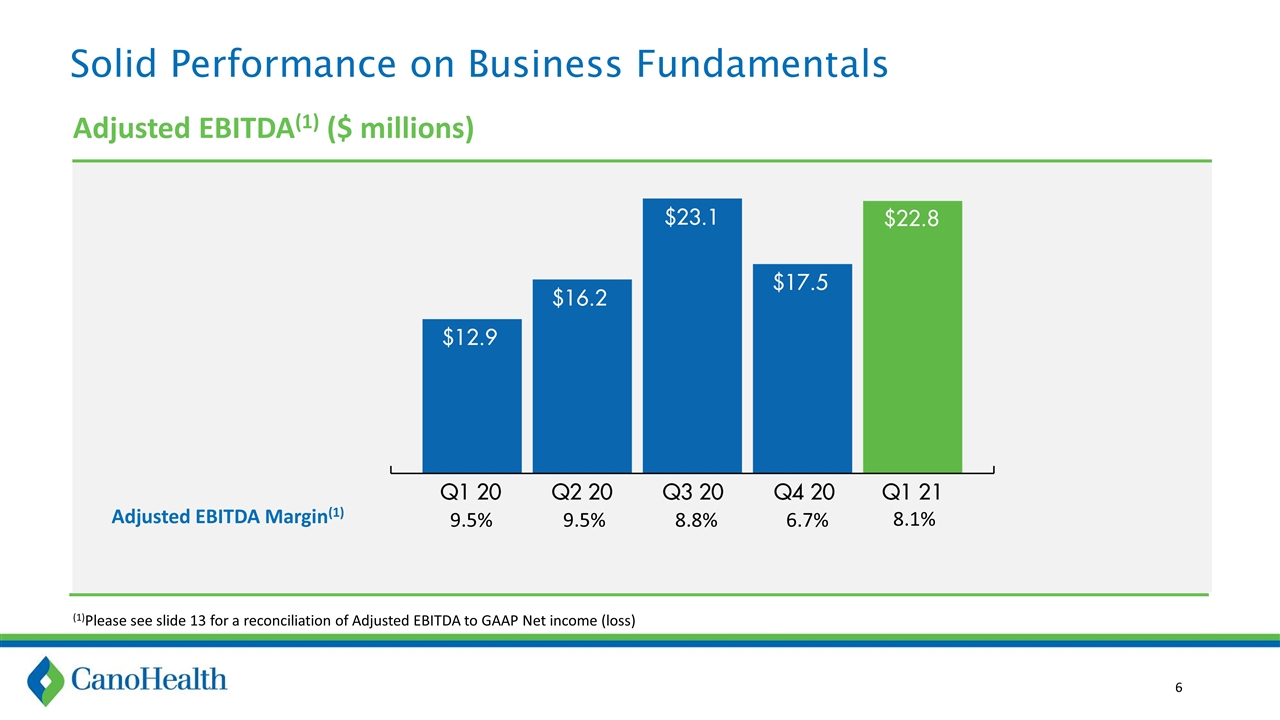
Solid Performance on Business Fundamentals Adjusted EBITDA(1) ($ millions) Adjusted EBITDA Margin(1) 9.5% 9.5% 8.8% 6.7% 8.1% (1)Please see slide 13 for a reconciliation of Adjusted EBITDA to GAAP Net income (loss)
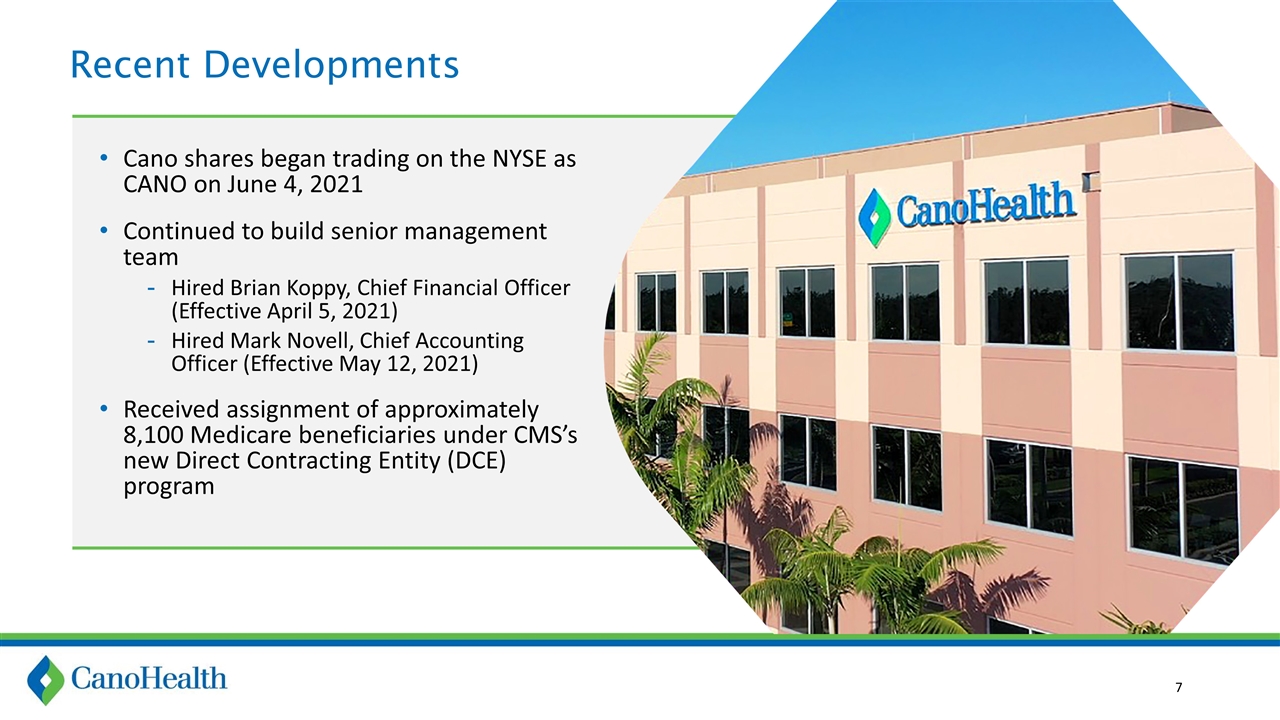
Recent Developments Cano shares began trading on the NYSE as CANO on June 4, 2021 Continued to build senior management team Hired Brian Koppy, Chief Financial Officer (Effective April 5, 2021) Hired Mark Novell, Chief Accounting Officer (Effective May 12, 2021) Received assignment of approximately 8,100 Medicare beneficiaries under CMS’s new Direct Contracting Entity (DCE) program
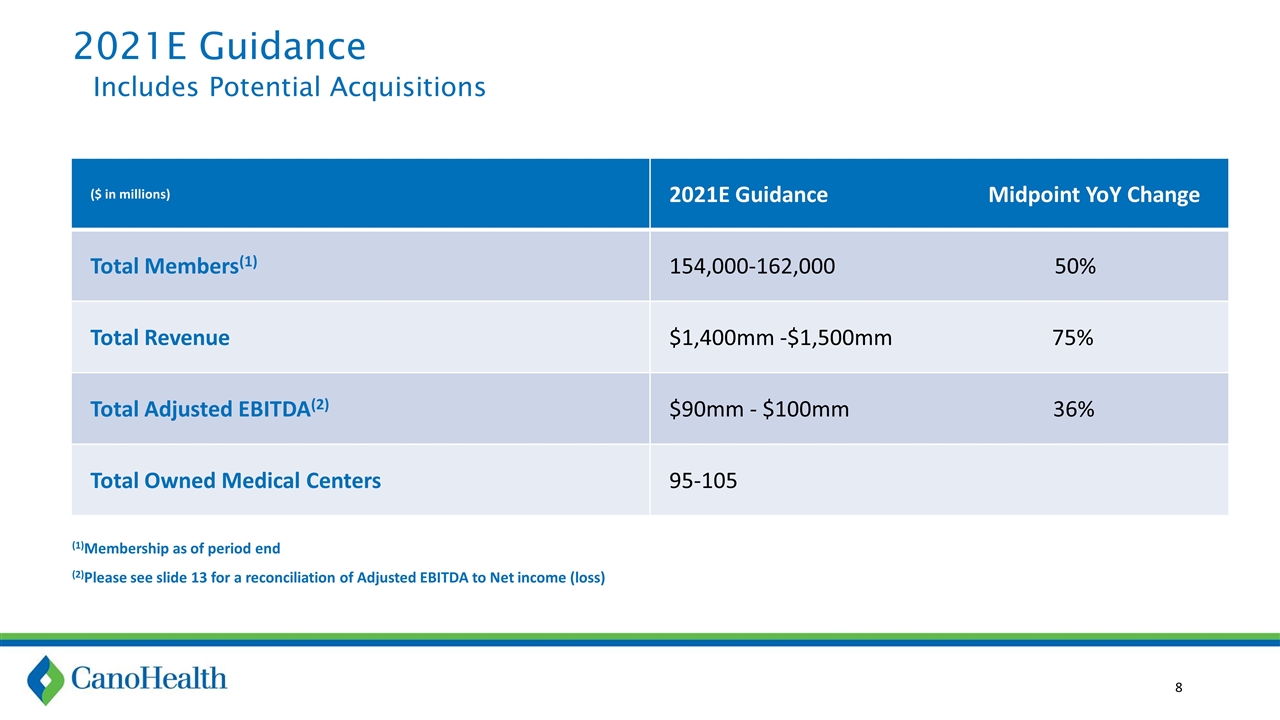
2021E Guidance Includes Potential Acquisitions ($ in millions) 2021E Guidance Midpoint YoY Change Total Members(1) 154,000-162,000 50% Total Revenue $1,400mm -$1,500mm 75% Total Adjusted EBITDA(2) $90mm - $100mm 36% Total Owned Medical Centers 95-105 (2)Please see slide 13 for a reconciliation of Adjusted EBITDA to Net income (loss) (1)Membership as of period end

Appendix
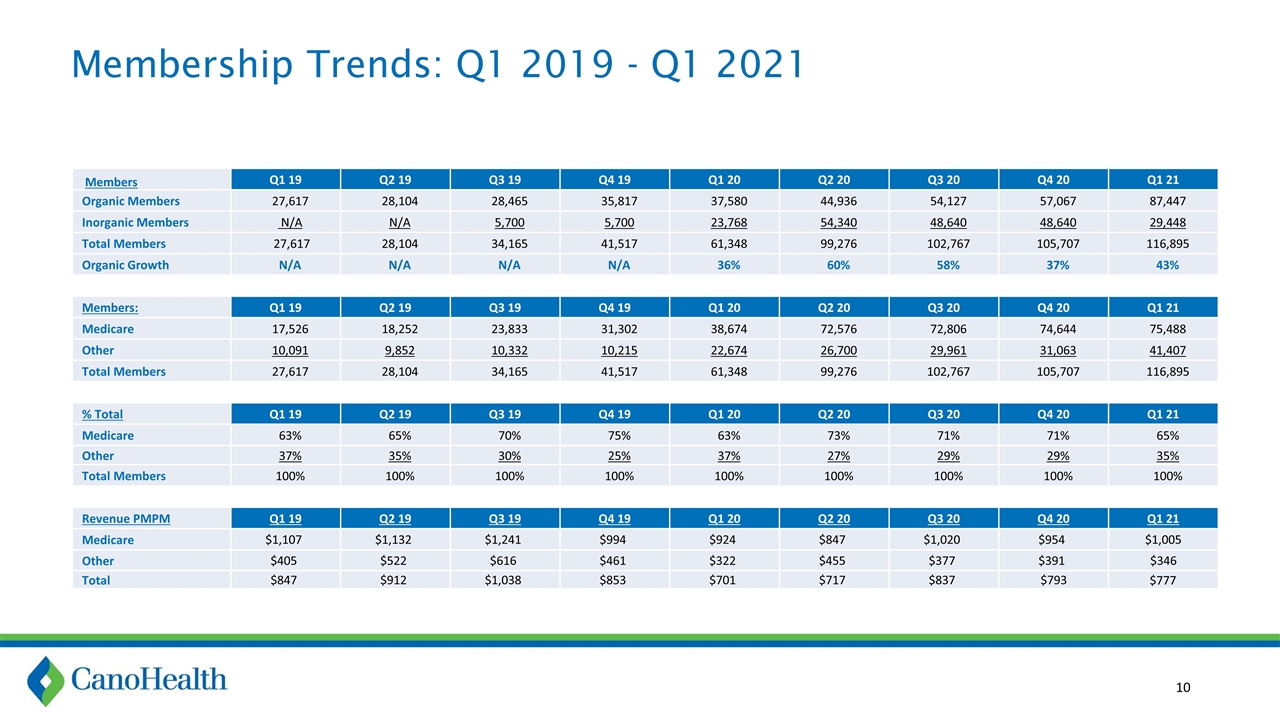
Membership Trends: Q1 2019 - Q1 2021 Members Q1 19 Q2 19 Q3 19 Q4 19 Q1 20 Q2 20 Q3 20 Q4 20 Q1 21 Organic Members 27,617 28,104 28,465 35,817 37,580 44,936 54,127 57,067 87,447 Inorganic Members N/A N/A 5,700 5,700 23,768 54,340 48,640 48,640 29,448 Total Members 27,617 28,104 34,165 41,517 61,348 99,276 102,767 105,707 116,895 Organic Growth N/A N/A N/A N/A 36% 60% 58% 37% 43% Members: Q1 19 Q2 19 Q3 19 Q4 19 Q1 20 Q2 20 Q3 20 Q4 20 Q1 21 Medicare 17,526 18,252 23,833 31,302 38,674 72,576 72,806 74,644 75,488 Other 10,091 9,852 10,332 10,215 22,674 26,700 29,961 31,063 41,407 Total Members 27,617 28,104 34,165 41,517 61,348 99,276 102,767 105,707 116,895 % Total Q1 19 Q2 19 Q3 19 Q4 19 Q1 20 Q2 20 Q3 20 Q4 20 Q1 21 Medicare 63% 65% 70% 75% 63% 73% 71% 71% 65% Other 37% 35% 30% 25% 37% 27% 29% 29% 35% Total Members 100% 100% 100% 100% 100% 100% 100% 100% 100% Revenue PMPM Q1 19 Q2 19 Q3 19 Q4 19 Q1 20 Q2 20 Q3 20 Q4 20 Q1 21 Medicare $1,107 $1,132 $1,241 $994 $924 $847 $1,020 $954 $1,005 Other $405 $522 $616 $461 $322 $455 $377 $391 $346 Total $847 $912 $1,038 $853 $701 $717 $837 $793 $777
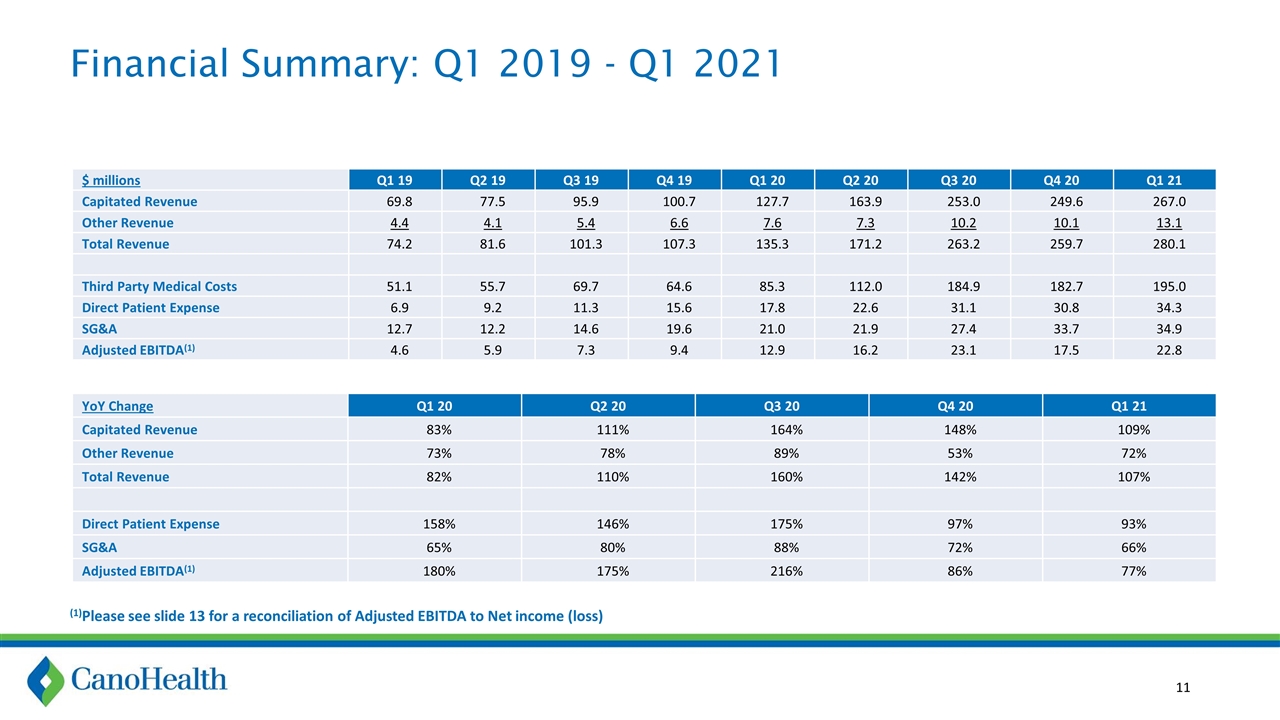
Financial Summary: Q1 2019 - Q1 2021 YoY Change Q1 20 Q2 20 Q3 20 Q4 20 Q1 21 Capitated Revenue 83% 111% 164% 148% 109% Other Revenue 73% 78% 89% 53% 72% Total Revenue 82% 110% 160% 142% 107% Direct Patient Expense 158% 146% 175% 97% 93% SG&A 65% 80% 88% 72% 66% Adjusted EBITDA(1) 180% 175% 216% 86% 77% $ millions Q1 19 Q2 19 Q3 19 Q4 19 Q1 20 Q2 20 Q3 20 Q4 20 Q1 21 Capitated Revenue 69.8 77.5 95.9 100.7 127.7 163.9 253.0 249.6 267.0 Other Revenue 4.4 4.1 5.4 6.6 7.6 7.3 10.2 10.1 13.1 Total Revenue 74.2 81.6 101.3 107.3 135.3 171.2 263.2 259.7 280.1 Third Party Medical Costs 51.1 55.7 69.7 64.6 85.3 112.0 184.9 182.7 195.0 Direct Patient Expense 6.9 9.2 11.3 15.6 17.8 22.6 31.1 30.8 34.3 SG&A 12.7 12.2 14.6 19.6 21.0 21.9 27.4 33.7 34.9 Adjusted EBITDA(1) 4.6 5.9 7.3 9.4 12.9 16.2 23.1 17.5 22.8 (1)Please see slide 13 for a reconciliation of Adjusted EBITDA to Net income (loss)
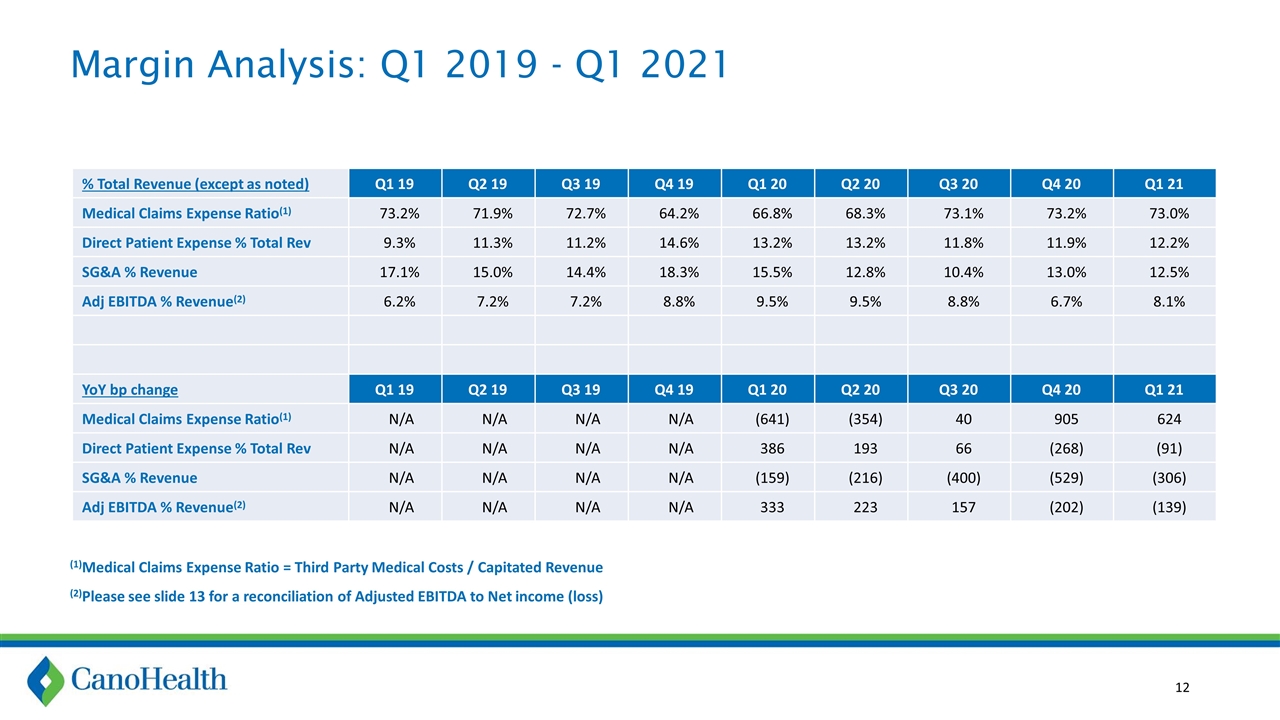
Margin Analysis: Q1 2019 - Q1 2021 % Total Revenue (except as noted) Q1 19 Q2 19 Q3 19 Q4 19 Q1 20 Q2 20 Q3 20 Q4 20 Q1 21 Medical Claims Expense Ratio(1) 73.2% 71.9% 72.7% 64.2% 66.8% 68.3% 73.1% 73.2% 73.0% Direct Patient Expense % Total Rev 9.3% 11.3% 11.2% 14.6% 13.2% 13.2% 11.8% 11.9% 12.2% SG&A % Revenue 17.1% 15.0% 14.4% 18.3% 15.5% 12.8% 10.4% 13.0% 12.5% Adj EBITDA % Revenue(2) 6.2% 7.2% 7.2% 8.8% 9.5% 9.5% 8.8% 6.7% 8.1% YoY bp change Q1 19 Q2 19 Q3 19 Q4 19 Q1 20 Q2 20 Q3 20 Q4 20 Q1 21 Medical Claims Expense Ratio(1) N/A N/A N/A N/A (641) (354) 40 905 624 Direct Patient Expense % Total Rev N/A N/A N/A N/A 386 193 66 (268) (91) SG&A % Revenue N/A N/A N/A N/A (159) (216) (400) (529) (306) Adj EBITDA % Revenue(2) N/A N/A N/A N/A 333 223 157 (202) (139) (1)Medical Claims Expense Ratio = Third Party Medical Costs / Capitated Revenue (2)Please see slide 13 for a reconciliation of Adjusted EBITDA to Net income (loss)
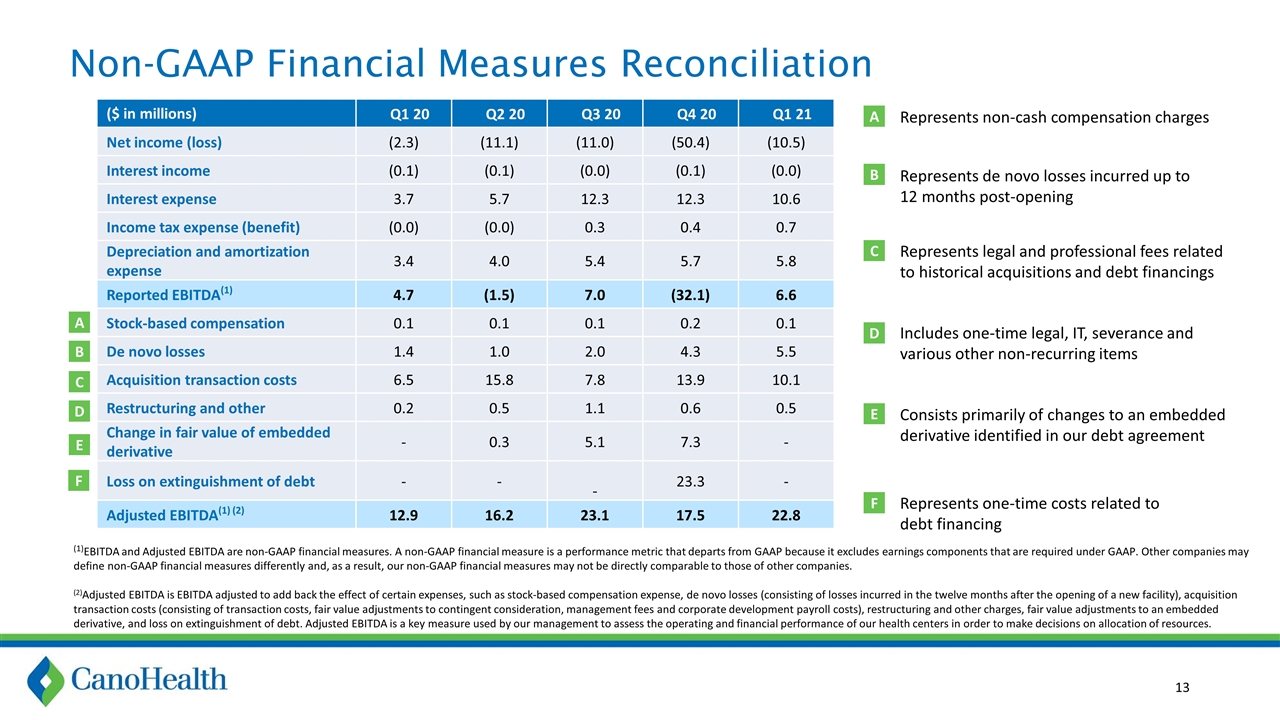
Non-GAAP Financial Measures Reconciliation ($ in millions) Q1 20 Q2 20 Q3 20 Q4 20 Q1 21 Net income (loss) (2.3) (11.1) (11.0) (50.4) (10.5) Interest income (0.1) (0.1) (0.0) (0.1) (0.0) Interest expense 3.7 5.7 12.3 12.3 10.6 Income tax expense (benefit) (0.0) (0.0) 0.3 0.4 0.7 Depreciation and amortization expense 3.4 4.0 5.4 5.7 5.8 Reported EBITDA(1) 4.7 (1.5) 7.0 (32.1) 6.6 Stock-based compensation 0.1 0.1 0.1 0.2 0.1 De novo losses 1.4 1.0 2.0 4.3 5.5 Acquisition transaction costs 6.5 15.8 7.8 13.9 10.1 Restructuring and other 0.2 0.5 1.1 0.6 0.5 Change in fair value of embedded derivative - 0.3 5.1 7.3 - Loss on extinguishment of debt - - - 23.3 - Adjusted EBITDA(1) (2) 12.9 16.2 23.1 17.5 22.8 A B C D E F Represents non-cash compensation charges Represents de novo losses incurred up to 12 months post-opening Represents legal and professional fees related to historical acquisitions and debt financings Includes one-time legal, IT, severance and various other non-recurring items Consists primarily of changes to an embedded derivative identified in our debt agreement Represents one-time costs related to debt financing A B C D E F (1)EBITDA and Adjusted EBITDA are non-GAAP financial measures. A non-GAAP financial measure is a performance metric that departs from GAAP because it excludes earnings components that are required under GAAP. Other companies may define non-GAAP financial measures differently and, as a result, our non-GAAP financial measures may not be directly comparable to those of other companies. (2)Adjusted EBITDA is EBITDA adjusted to add back the effect of certain expenses, such as stock-based compensation expense, de novo losses (consisting of losses incurred in the twelve months after the opening of a new facility), acquisition transaction costs (consisting of transaction costs, fair value adjustments to contingent consideration, management fees and corporate development payroll costs), restructuring and other charges, fair value adjustments to an embedded derivative, and loss on extinguishment of debt. Adjusted EBITDA is a key measure used by our management to assess the operating and financial performance of our health centers in order to make decisions on allocation of resources.
