Attached files
| file | filename |
|---|---|
| 8-K - 8-K - William Penn Bancorporation | tmb-20210608x8k.htm |
Exhibit 99.1
| Investor Presentation June 8, 2021 |
| Safe Harbor Statement • THIS PRESENTATION CONTAINS FORWARD‐LOOKING STATEMENTS WITHIN THE MEANING OF THE PRIVATE SECURITIES LITIGATION REFORM ACT OF 1995 REGARDING WILLIAM PENN BANCORPORATION’S EXPECTATIONS OR PREDICTIONS OF FUTURE FINANCIAL OR BUSINESS PERFORMANCE OR CONDITIONS. FORWARD‐LOOKING STATEMENTS ARE TYPICALLY IDENTIFIED BY WORDS SUCH AS “BELIEVE,” “EXPECT,” “ANTICIPATE,” “INTEND,” “TARGET,” “ESTIMATE,” “CONTINUE,” “POSITIONS,” “PROSPECTS” OR “POTENTIAL,” BY FUTURE CONDITIONAL VERBS “WILL,” “WOULD,” “SHOULD,” “COULD” OR SUCH AS “WILL”, “WOULD”, “SHOULD”, “COULD”, “MAY”, OR BY VARIATIONS OF SUCH WORDS OR BY SIMILAR EXPRESSIONS. THESE FORWARD‐LOOKING STATEMENTS ARE SUBJECT TO NUMEROUS ASSUMPTIONS, RISKS AND UNCERTAINTIES, WHICH CHANGE OVER TIME. FORWARD‐LOOKING STATEMENTS SPEAK ONLY AS OF THE DATE THEY ARE MADE AND WE ASSUME NO DUTY TO UPDATE FORWARD‐LOOKING STATEMENTS. ACTUAL RESULTS MAY DIFFER MATERIALLY FROM CURRENT PROJECTIONS. • IN ADDITION TO FACTORS PREVIOUSLY DISCLOSED IN WILLIAM PENN BANCORPORATION’S REPORTS FILED WITH THE U.S. SECURITIES AND EXCHANGE COMMISSION AND THOSE IDENTIFIED ELSEWHERE IN THIS PRESENTATION, THE FOLLOWING FACTORS AMONG OTHERS, COULD CAUSE ACTUAL RESULTS TO DIFFER MATERIALLY FROM FORWARD‐LOOKING STATEMENTS OR HISTORICAL PERFORMANCE: THE EFFECT OF THE COVID‐19 PANDEMIC INCLUDING ITS IMPACT ON OUR BORROWERS AND THEIR ABILITY TO REPAY THEIR LOANS, AND ON THE LOCAL AND NATIONAL ECONOMIES; CHANGES IN ASSET QUALITY AND CREDIT RISK; THE INABILITY TO SUSTAIN REVENUE AND EARNINGS GROWTH; OUR ABILITY TO CONTROL COSTS AND EXPENSES; CHANGES IN INTEREST RATES AND CAPITAL MARKETS; LOAN DELINQUENCY RATES; INFLATION; CUSTOMER ACCEPTANCE OF WILLIAM PENN BANK PRODUCTS AND SERVICES; CUSTOMER BORROWING, REPAYMENT, INVESTMENT AND DEPOSIT PRACTICES; CUSTOMER DISINTERMEDIATION; THE INTRODUCTION, WITHDRAWAL, SUCCESS AND TIMING OF BUSINESS INITIATIVES; COMPETITIVE CONDITIONS AND OUR ABILITY TO OFFER COMPETITIVE PRODUCTS AND PRICING; THE INABILITY TO REALIZE COST SAVINGS OR REVENUES OR TO IMPLEMENT INTEGRATION PLANS AND OTHER CONSEQUENCES ASSOCIATED WITH MERGERS, ACQUISITIONS AND DIVESTITURES; NATIONAL, REGIONAL AND LOCAL ECONOMIC CONDITIONS; AND THE IMPACT, EXTENT AND TIMING OF TECHNOLOGICAL CHANGES, CAPITAL MANAGEMENT ACTIVITIES, AND OTHER ACTIONS OF THE FEDERAL RESERVE BOARD AND OTHER LEGISLATIVE AND REGULATORY ACTIONS AND REFORMS. THESE FACTORS SHOULD BE CONSIDERED IN EVALUATING THE FORWARD‐LOOKING STATEMENTS AND UNDUE RELIANCE SHOULD NOT BE PLACED ON SUCH STATEMENTS. • THIS PRESENTATION ALSO INCLUDES INTERIM AND UNAUDITED FINANCIAL INFORMATION THAT IS SUBJECT TO FURTHER REVIEW BY WILLIAM PENN BANCORPORATION’S INDEPENDENT REGISTERED PUBLIC ACCOUNTING FIRM. 1 |
| Non‐GAAP Financial Measures • THIS PRESENTATION CONTAINS FINANCIAL INFORMATION PRESENTED IN ACCORDANCE WITH U.S. GENERALLY ACCEPTED ACCOUNTING PRINCIPLES (“GAAP”). THIS PRESENTATION ALSO CONTAINS NON‐GAAP INFORMATION THAT THE COMPANY’S MANAGEMENT USES IN ITS ANALYSIS OF THE COMPANY’S FINANCIAL RESULTS. SPECIFICALLY, THE COMPANY PROVIDES MEASURES BASED ON WHAT IT BELIEVES ARE ITS OPERATING EARNINGS ON A CONSISTENT BASIS, AND EXCLUDES MATERIAL NON‐ROUTINE OPERATING ITEMS WHICH AFFECT THE GAAP REPORTING OF RESULTS OF OPERATIONS. THE COMPANY’S MANAGEMENT BELIEVES THAT PROVIDING THIS INFORMATION TO ANALYSTS AND INVESTORS ALLOWS THEM TO BETTER UNDERSTAND AND EVALUATE THE COMPANY’S CORE FINANCIAL RESULTS FOR THE PERIODS PRESENTED. BECAUSE NON‐GAAP FINANCIAL MEASURES ARE NOT STANDARIZED, IT MAY NOT BE POSSIBLE TO COMPARE THESE FINANCIAL MEASURES WITH OTHER COMPANIES’ NON‐GAAP FINANCIAL MEASURES HAVING THE SAME OR SIMILAR NAMES. • THE COMPANY ALSO PROVIDES MEASUREMENTS AND RATIOS BASED ON TANGIBLE STOCKHOLDERS’ EQUITY. THESE MEASURES ARE COMMONLY UTILIZED BY REGULATORS AND MARKET ANALYSTS TO EVALUATE THE COMPANY’S FINANCIAL CONDITION AND, THEREFORE THE COMPANY’S MANAGEMENT TEAM BELIEVES THAT SUCH INFORMATION IS USEFUL TO INVESTORS. • A RECONCILIATION OF THE NON‐GAAP MEASURES USED IN THIS PRESENTATION TO THE MOST DIRECTLY COMPARABLE GAAP MEASURES IS PROVIDED IN THE APPENDIX TO THIS PRESENTATION. 2 |
| Executive Management Team Kenneth J. Stephon, Chairman, President & Chief Executive Officer Mr. Stephon has over 40 years of banking industry experience and previously served as President and Chief Executive Officer, as well as a director, of Audubon Savings Bank from October 2013 until its merger with William Penn Bank on July 1, 2018. Mr. Stephon also serves as adirector of the Pennsylvania Association of Community Bankers and the Insured Financial Institutions of the Delaware Valley. Mr. Stephon held awide range of executive roles in the banking industry, including CEO at Liberty Savings Bank in Pottsville, PA and Clover Bank in Pennsauken, NJ. Alan B. Turner, Executive Vice President & Chief Lending Officer Mr. Turner previously served as the Senior Vice President and Regional Commercial Manager for OceanFirst Bank, successor to Two River Community Bank, where he served as the Executive Vice President and Senior Loan Officer for 20 years. Mr. Turner began his banking career in 1987 with Chemical Bank as a Credit and Loan Review Analyst. Amy J. Hannigan, Executive Vice President & Director of Corporate Development Ms. Hannigan previously served as Senior Vice President and Corporate Controller of WSFS Bank, following the acquisition of Beneficial Bank, where she served as Senior Vice President and Chief Accounting Officer. Ms. Hannigan joined Beneficial Bank in 2007 following the acquisition of Farmers & Mechanics Bank, where she served as the Vice President and Corporate Controller. Ms. Hannigan began her career with Coopers &Lybrand where she served as an Audit Manager in the financial services industry. Jonathan T. Logan, Executive Vice President & Chief Financial Officer Mr. Logan previously served as Vice President and Corporate Controller of Beneficial Bank in Philadelphia, Pennsylvania from April 2011 to March 2019. Mr. Logan began his career with Ernst Young where he served as an Audit Manager in the financial services industry. Our Executive Management Team includes experienced professionals with robust backgrounds in banking that have the expertise to take William Penn Bank to the next level as a publicly‐traded community bank. 3 |

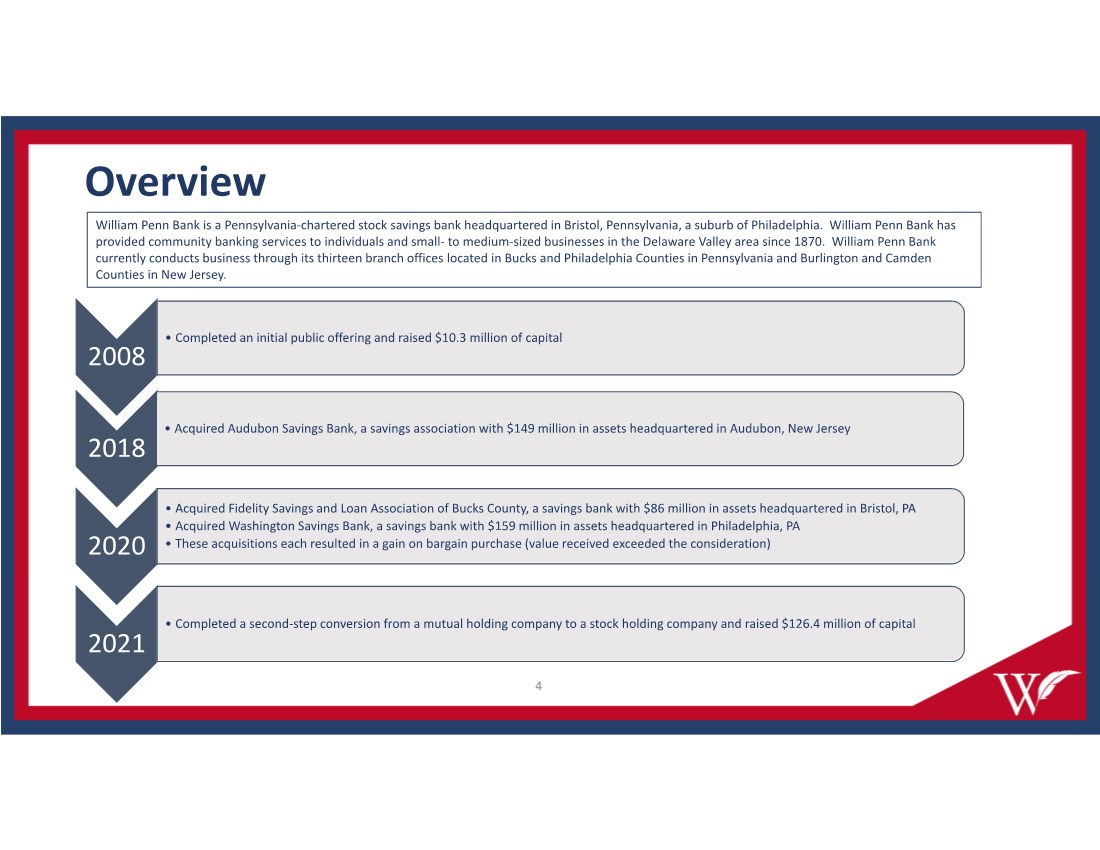
| Overview 2018 • Acquired Audubon Savings Bank, a savings association with $149 million in assets headquartered in Audubon, New Jersey 2020 • Acquired Fidelity Savings and Loan Association of Bucks County, a savings bank with $86 million in assets headquartered in Bristol, PA • Acquired Washington Savings Bank, a savings bank with $159 million in assets headquartered in Philadelphia, PA •These acquisitions each resulted in a gain on bargain purchase (value received exceeded the consideration) 2021 •Completed a second‐step conversion from a mutual holding company to a stock holding company and raised $126.4 million of capital William Penn Bank is a Pennsylvania‐chartered stock savings bank headquartered in Bristol, Pennsylvania, a suburb of Philadelphia. William Penn Bank has provided community banking services to individuals and small‐ to medium‐sized businesses in the Delaware Valley area since 1870. William Penn Bank currently conducts business through its thirteen branch offices located in Bucks and Philadelphia Counties in Pennsylvania and Burlington and Camden Counties in New Jersey. 4 2008 •Completed an initial public offering and raised $10.3 million of capital |
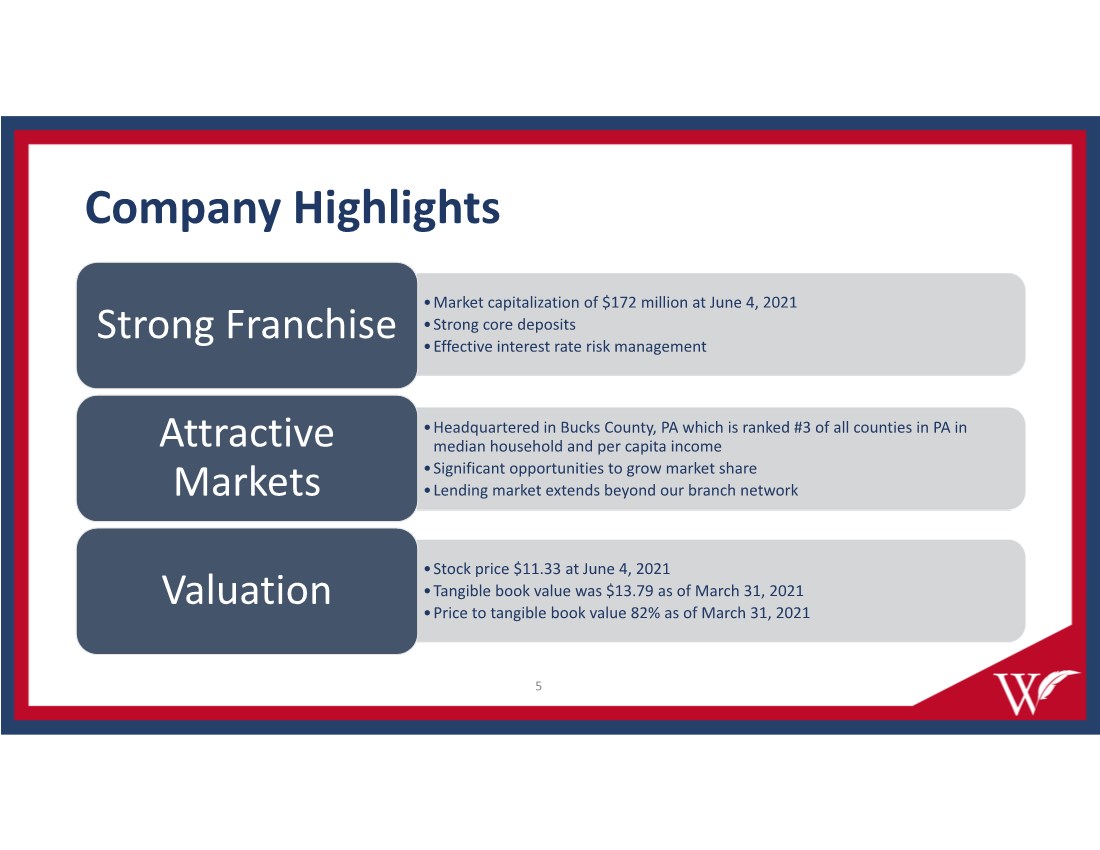
| Company Highlights •Market capitalization of $172 million at June 4, 2021 •Strong core deposits •Effective interest rate risk management Strong Franchise •Headquartered in Bucks County, PA which is ranked #3 of all counties in PA in median household and per capita income •Significant opportunities to grow market share •Lending market extends beyond our branch network Attractive Markets •Stock price $11.33 at June 4, 2021 •Tangible book value was $13.79 as of March 31, 2021 •Price to tangible book value 82% as of March 31, 2021 Valuation 5 |
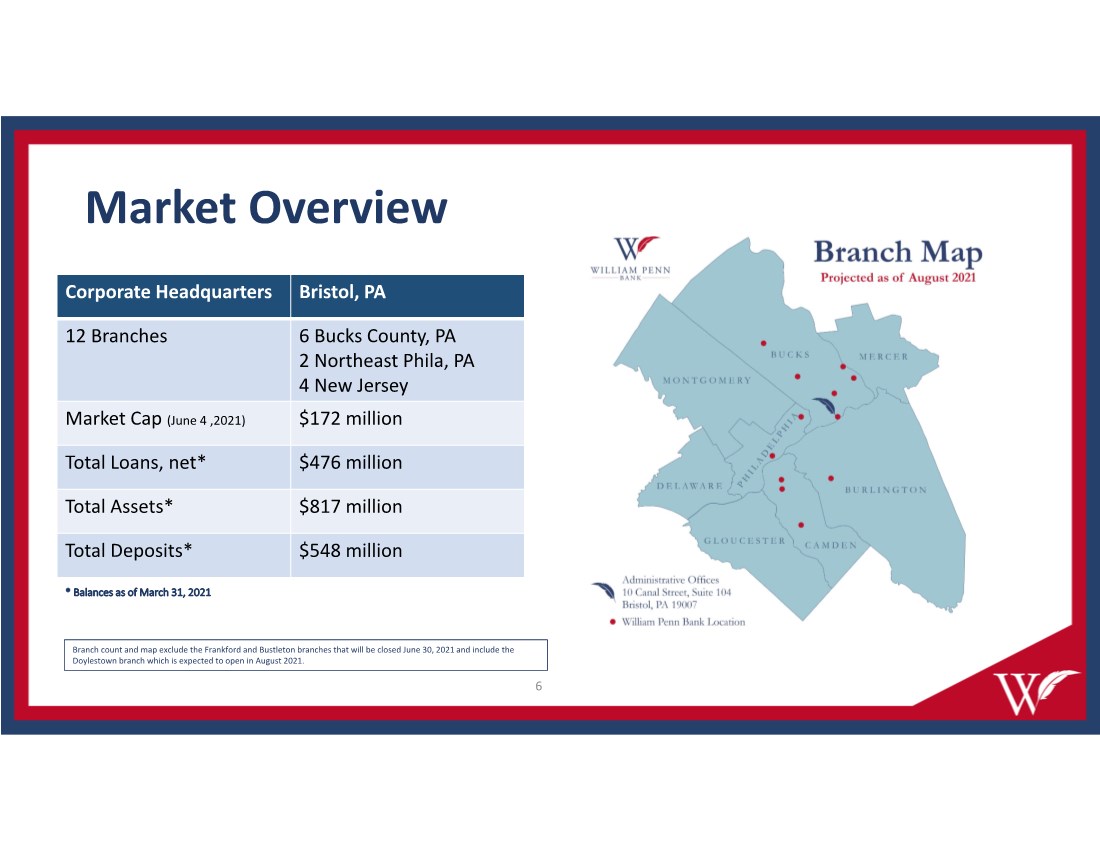
| Market Overview Corporate Headquarters Bristol, PA 12 Branches 6 Bucks County, PA 2 Northeast Phila, PA 4 New Jersey Market Cap (June 4 ,2021) $172 million Total Loans, net* $476 million Total Assets* $817 million Total Deposits* $548 million * Balances as of March 31, 2021 Branch count and map exclude the Frankford and Bustleton branches that will be closed June 30, 2021 and include the Doylestown branch which is expected to open in August 2021. 6 |
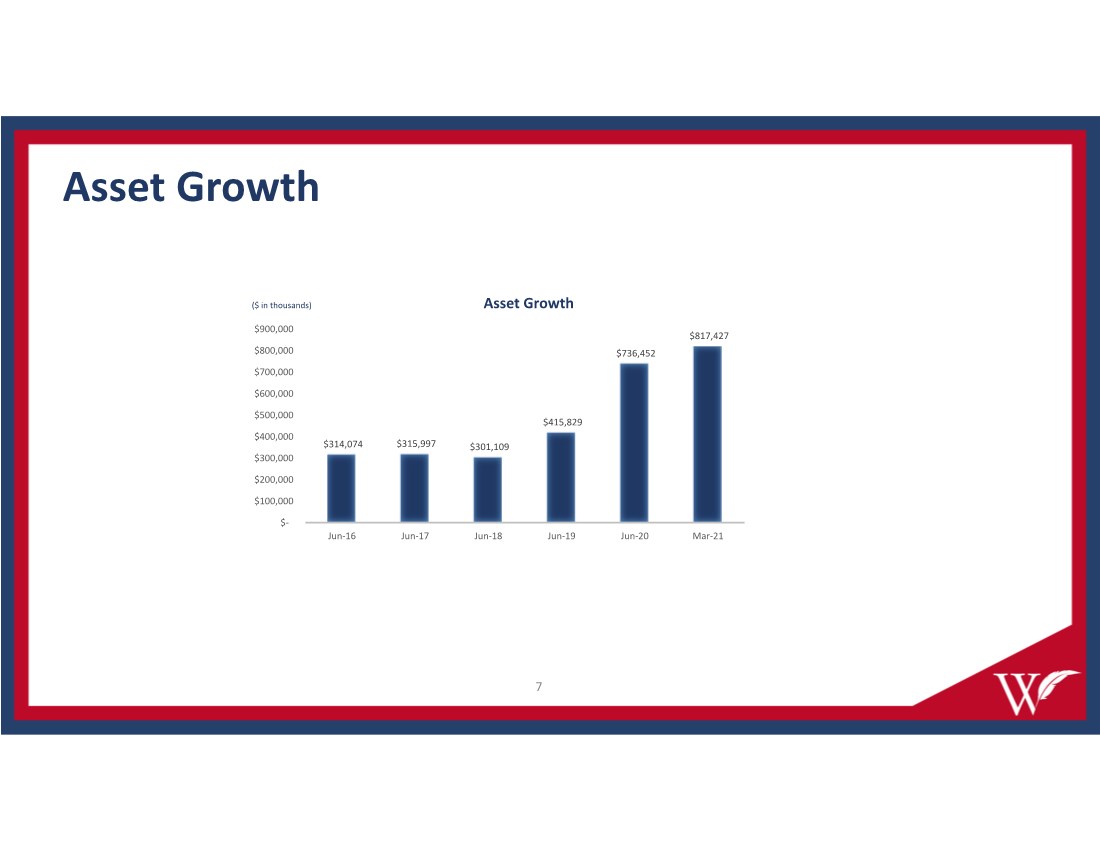
| 7 Asset Growth ($ in thousands) $314,074 $315,997 $301,109 $415,829 $736,452 $817,427 $‐ $100,000 $200,000 $300,000 $400,000 $500,000 $600,000 $700,000 $800,000 $900,000 Jun‐16 Jun‐17 Jun‐18 Jun‐19 Jun‐20 Mar‐21 Asset Growth |
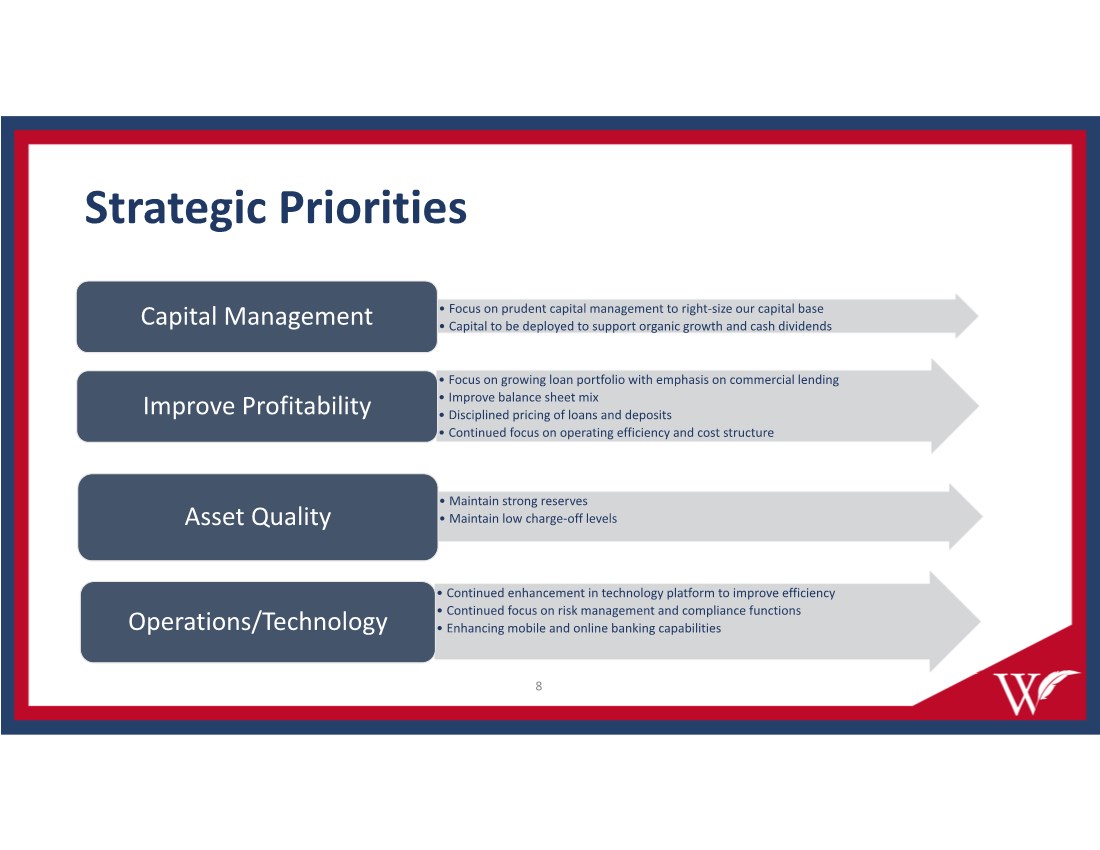
| Strategic Priorities •Focus on prudent capital management to right‐size our capital base • Capital to be deployed to support organic growth and cash dividends Capital Management •Focus on growing loan portfolio with emphasis on commercial lending •Improve balance sheet mix • Disciplined pricing of loans and deposits • Continued focus on operating efficiency and cost structure Improve Profitability • Maintain strong reserves • Maintain low charge‐off levels Asset Quality • Continued enhancement in technology platform to improve efficiency • Continued focus on risk management and compliance functions • Enhancing mobile and online banking capabilities Operations/Technology 8 |
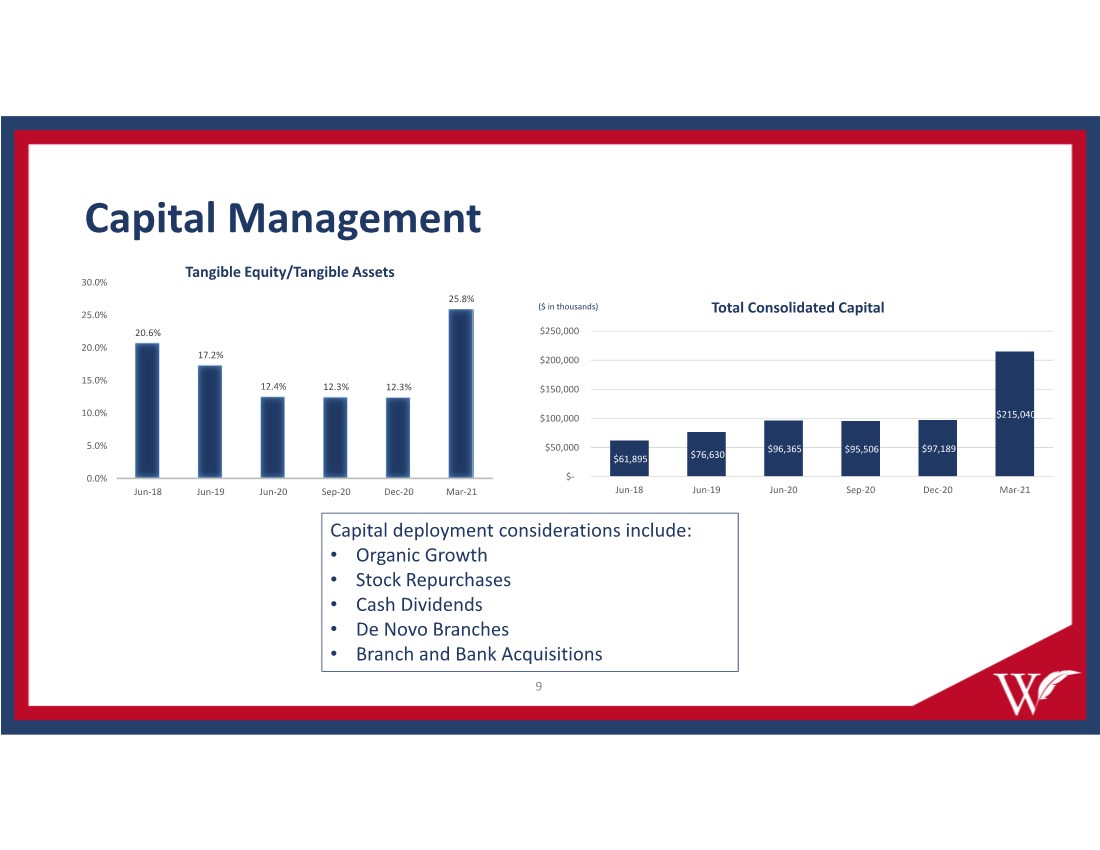
| Capital Management Capital deployment considerations include: • Organic Growth • Stock Repurchases • Cash Dividends • De Novo Branches • Branch and Bank Acquisitions ($ in thousands) 9 $61,895 $76,630 $96,365 $95,506 $97,189 $215,040 $‐ $50,000 $100,000 $150,000 $200,000 $250,000 Jun‐18 Jun‐19 Jun‐20 Sep‐20 Dec‐20 Mar‐21 Total Consolidated Capital 20.6% 17.2% 12.4% 12.3% 12.3% 25.8% 0.0% 5.0% 10.0% 15.0% 20.0% 25.0% 30.0% Jun‐18 Jun‐19 Jun‐20 Sep‐20 Dec‐20 Mar‐21 Tangible Equity/Tangible Assets |
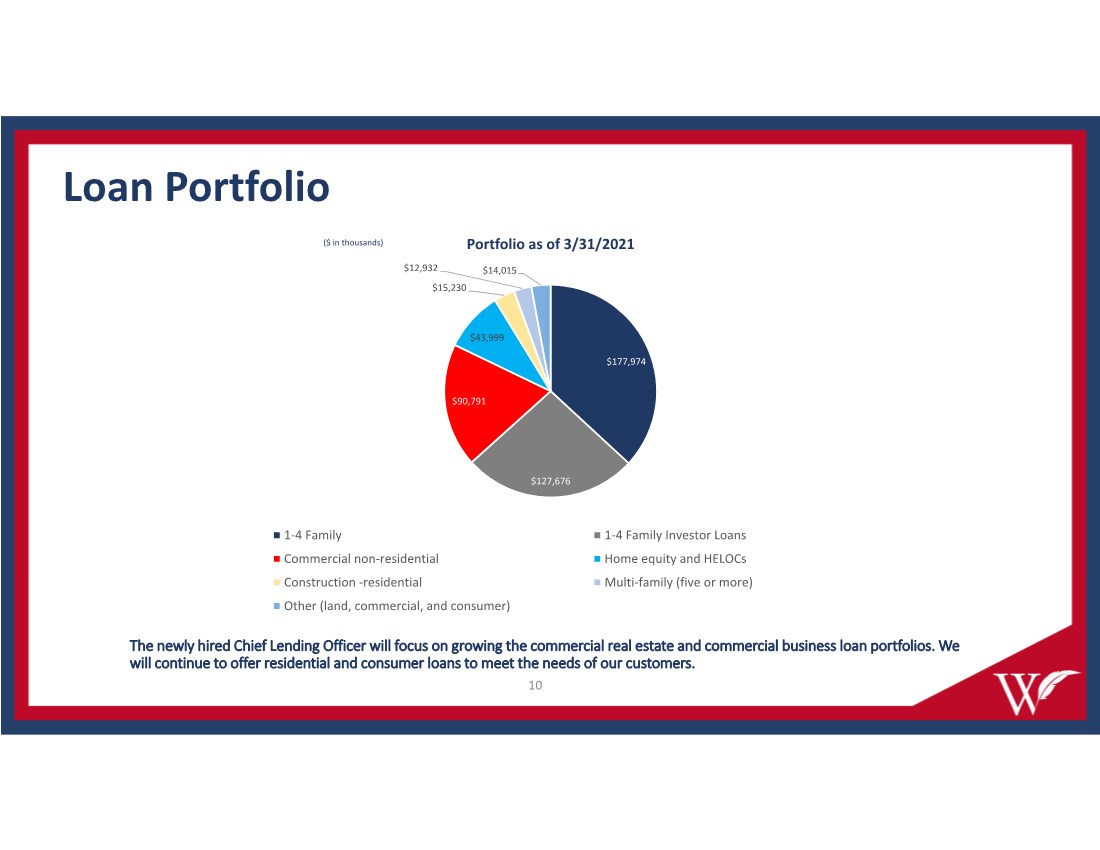
| Loan Portfolio The newly hired Chief Lending Officer will focus on growing the commercial real estate and commercial business loan portfolios. We will continue to offer residential and consumer loans to meet the needs of our customers. ($ in thousands) $177,974 $127,676 $90,791 $43,999 $15,230 $12,932 $14,015 Portfolio as of 3/31/2021 1‐4 Family 1‐4 Family Investor Loans Commercial non‐residential Home equity and HELOCs Construction ‐residential Multi‐family (five or more) Other (land, commercial, and consumer) 10 |
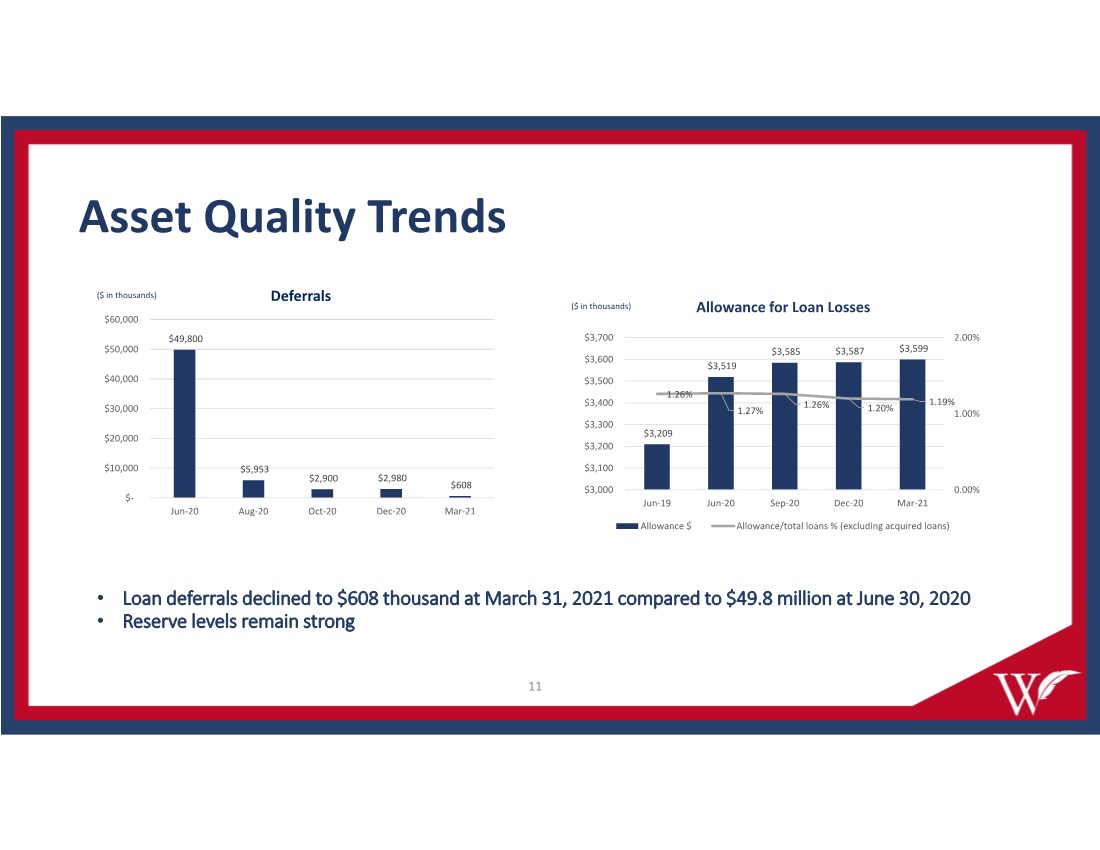
| Asset Quality Trends • Loan deferrals declined to $608 thousand at March 31, 2021 compared to $49.8 million at June 30, 2020 • Reserve levels remain strong 11 ($ in thousands) ($ in thousands) $3,209 $3,519 $3,585 $3,587 $3,599 1.26% 1.27% 1.26% 1.20% 1.19% 0.00% 1.00% 2.00% $3,000 $3,100 $3,200 $3,300 $3,400 $3,500 $3,600 $3,700 Jun‐19 Jun‐20 Sep‐20 Dec‐20 Mar‐21 Allowance for Loan Losses Allowance $ Allowance/total loans % (excluding acquired loans) $49,800 $5,953 $2,900 $2,980 $608 $‐ $10,000 $20,000 $30,000 $40,000 $50,000 $60,000 Jun‐20 Aug‐20 Oct‐20 Dec‐20 Mar‐21 Deferrals |
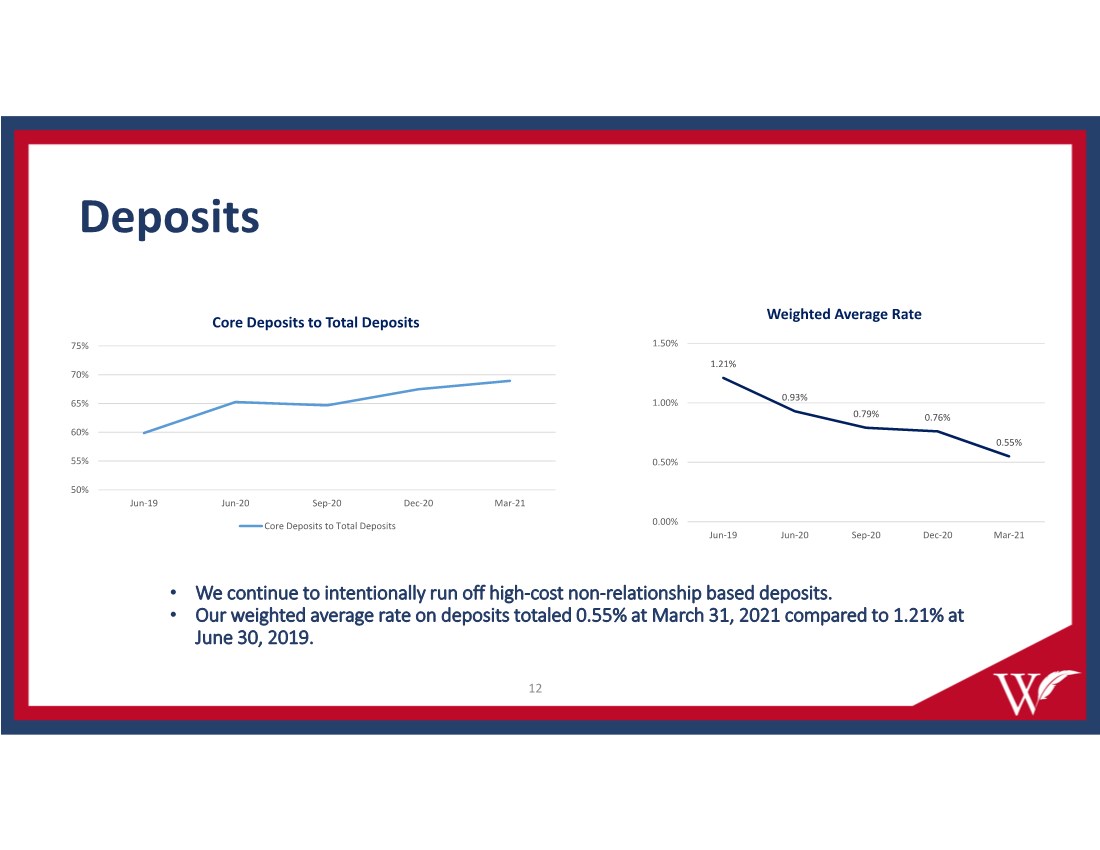
| Deposits • We continue to intentionally run off high‐cost non‐relationship based deposits. • Our weighted average rate on deposits totaled 0.55% at March 31, 2021 compared to 1.21% at June 30, 2019. 50% 55% 60% 65% 70% 75% Jun‐19 Jun‐20 Sep‐20 Dec‐20 Mar‐21 Core Deposits to Total Deposits Core Deposits to Total Deposits 1.21% 0.93% 0.79% 0.76% 0.55% 0.00% 0.50% 1.00% 1.50% Jun‐19 Jun‐20 Sep‐20 Dec‐20 Mar‐21 Weighted Average Rate 12 |
| Appendix 13 |

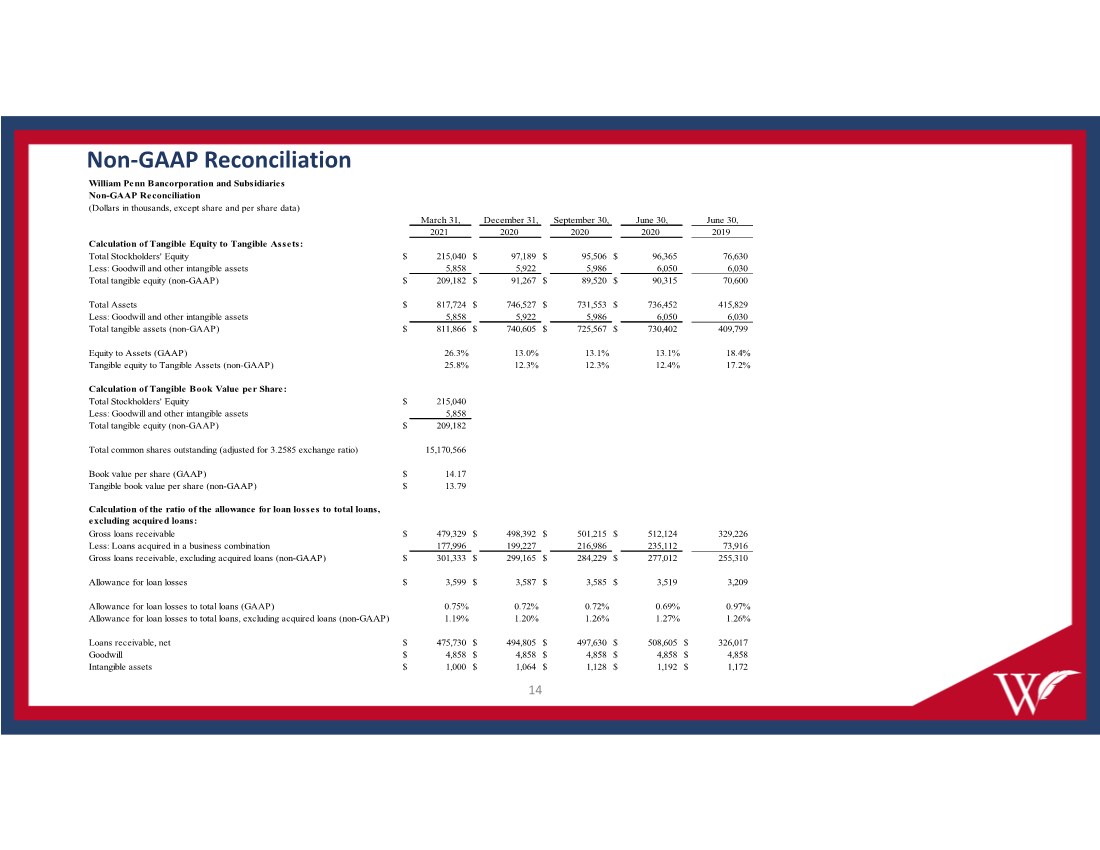
| Non‐GAAP Reconciliation William Penn Bancorporation and Subsidiaries Non-GAAP Reconciliation (Dollars in thousands, except share and per share data) March 31, December 31, September 30, June 30, June 30, 2021 2020 2020 2020 2019 Calculation of Tangible Equity to Tangible Assets: Total Stockholders' Equity $ 215,040 $ 97,189 $ 95,506 $ 96,365 76,630 Less: Goodwill and other intangible assets 5,858 5,922 5,986 6,050 6,030 Total tangible equity (non-GAAP) $ 209,182 $ 91,267 $ 89,520 $ 90,315 70,600 Total Assets $ 817,724 $ 746,527 $ 731,553 $ 736,452 415,829 Less: Goodwill and other intangible assets 5,858 5,922 5,986 6,050 6,030 Total tangible assets (non-GAAP) $ 811,866 $ 740,605 $ 725,567 $ 730,402 409,799 Equity to Assets (GAAP) 26.3% 13.0% 13.1% 13.1% 18.4% Tangible equity to Tangible Assets (non-GAAP) 25.8% 12.3% 12.3% 12.4% 17.2% Calculation of Tangible Book Value per Share: Total Stockholders' Equity $ 215,040 Less: Goodwill and other intangible assets 5,858 Total tangible equity (non-GAAP) $ 209,182 Total common shares outstanding (adjusted for 3.2585 exchange ratio) 15,170,566 Book value per share (GAAP) $ 14.17 Tangible book value per share (non-GAAP) $ 13.79 Calculation of the ratio of the allowance for loan losses to total loans, excluding acquired loans: Gross loans receivable $ 479,329 $ 498,392 $ 501,215 $ 512,124 329,226 Less: Loans acquired in a business combination 177,996 199,227 216,986 235,112 73,916 Gross loans receivable, excluding acquired loans (non-GAAP) $ 301,333 $ 299,165 $ 284,229 $ 277,012 255,310 Allowance for loan losses $ 3,599 $ 3,587 $ 3,585 $ 3,519 3,209 Allowance for loan losses to total loans (GAAP) 0.75% 0.72% 0.72% 0.69% 0.97% Allowance for loan losses to total loans, excluding acquired loans (non-GAAP) 1.19% 1.20% 1.26% 1.27% 1.26% Loans receivable, net $ 475,730 $ 494,805 $ 497,630 $ 508,605 $ 326,017 Goodwill $ 4,858 $ 4,858 $ 4,858 $ 4,858 $ 4,858 Intangible assets $ 1,000 $ 1,064 $ 1,128 $ 1,192 $ 1,172 14 |