Attached files
| file | filename |
|---|---|
| 8-K - FORM 8-K - Bluerock Residential Growth REIT, Inc. | tm2119111d1_8k.htm |
Exhibit 99.1

NAREIT June 2021

2 Forward - Looking Statements The information in this presentation has been prepared solely for informational purposes by Bluerock Residential Growth REIT, Inc . (“BRG”) and does not constitute an offer to sell or the solicitation of an offer to purchase any securities . This presentation is not, and should not be assumed to be, complete . This presentation has been prepared to assist interested parties in making their own evaluation of BRG and does not purport to contain all of the information that may be relevant . In all cases, interested parties should conduct their own investigation and analysis of BRG and the data set forth in this presentation and other information provided by or on behalf of BRG . In addition, certain of the information contained herein may be derived from information provided by industry sources . BRG believes that such information is accurate and that the sources from which it has been obtained are reliable . BRG cannot guarantee the accuracy of such information, however, and has not independently verified such information . The information presented herein remains subject to change . Statements in this presentation are made as of the date of this presentation unless stated otherwise . This presentation also contains statements that, to the extent they are not recitations of historical fact, constitute “forward - looking statements . ” Forward - looking statements are typically identified by the use of terms such as “may,” “should,” “expect,” “could,” “intend,” “plan,” “anticipate,” “estimate,” “believe,” “continue,” “predict,” “potential” or the negative of such terms and other comparable terminology . The forward - looking statements included herein are based upon BRG’s current expectations, plans, estimates, assumptions and beliefs that involve numerous risks and uncertainties . Assumptions relating to the foregoing involve judgments with respect to, among other things, future economic, competitive and market conditions and future business decisions, all of which are difficult or impossible to predict accurately and many of which are beyond BRG’s control . Although BRG believes that the expectations reflected in such forward - looking statements are based on reasonable assumptions, BRG’s actual results and performance and the value of its securities could differ materially from those set forth in the forward - looking statements due to the impact of many factors . Currently, one of the most significant factors, however, is the potential adverse effect of the current pandemic of the novel coronavirus (“COVID - 19 ”) on the financial condition, results of operations, cash flows and performance of the Company and its tenants of our properties, business partners within our network and service providers, as well as the real estate market and the global economy and financial markets . The extent to which COVID - 19 impacts the Company and its tenants will depend on future developments, which are highly uncertain and cannot be predicted with confidence, including the scope, severity and duration of the pandemic, the actions taken to contain the pandemic or mitigate its impact (including governmental actions that may vary by jurisdiction, such as mandated business closing ; “stay - at - home” orders ; limits on group activity ; and actions to protect residential tenants from eviction), and the direct and indirect economic effects of the pandemic and containment measures, among others . Other factors include, but are not limited to, the uncertainties of real estate development, acquisition and disposition activity, the ability of our joint venture partners to satisfy their obligations, the costs and availability of financing, the effects of local economic and market conditions, the effects of acquisitions and dispositions, the impact of newly adopted accounting principles on BRG’s accounting policies and on period - to - period comparisons of financial results, regulatory changes and other risks and uncertainties detailed in the “Risk Factors” in Item 1 . A . Risk Factors section of the Company’s Annual Report on Form 10 - K filed with the U . S . Securities and Exchange Commission on February 23 , 2021 , and other discussions of risk factors contained in BRG’s periodic filings . BRG claims the safe harbor protection for forward looking statements contained in the Private Securities Litigation Reform Act of 1995 . BRG undertakes no obligation to update or revise any such information for any reason after the date of this presentation, unless required by law .
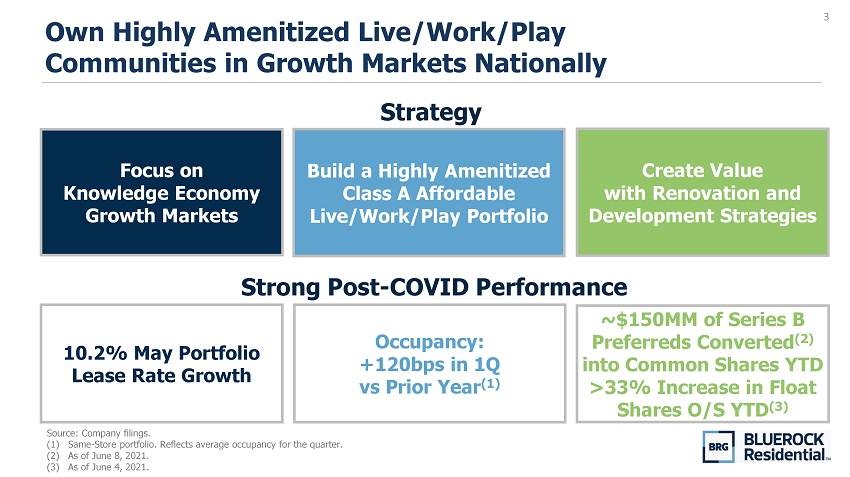
3 Own Highly Amenitized Live/Work/Play Communities in Growth Markets Nationally Create Value with Renovation and Development Strategies Focus on Knowledge Economy Growth Markets Build a Highly Amenitized Class A Affordable Live/Work/Play Portfolio Strategy 10.2% May Portfolio Lease Rate Growth ~$150MM of Series B Preferreds Converted (2) into Common Shares YTD >33% Increase in Float Shares O/S YTD (3) Occupancy: +120bps in 1Q vs Prior Year (1) Strong Post - COVID Performance Source: Company filings. (1) Same - Store portfolio. Reflects average occupancy for the quarter. (2) As of June 8, 2021. (3) As of June 4, 2021.

4 Well - Aligned Management with 28 Years Average Experience and ~30% Equity Ownership (1) 32 18 Ramin Kamfar CHAIRMAN & CEO Jordan Ruddy PRESIDENT & COO 34 18 Ryan MacDonald CHIEF INVESTMENT OFFICER 15 12 Mike DiFranco EXECUTIVE VICE PRESIDENT OF PROPERTY OPERATIONS 24 3 James Babb CHIEF STRATEGY OFFICER 33 13 Years at Bluerock Years in the Industry Source: Company filings. (1) Ownership percentages calculated as shares and units held divided by diluted shares and units outstanding as of 3/31/21. Includes direct and indirect ownership including through irrevocable family trusts.
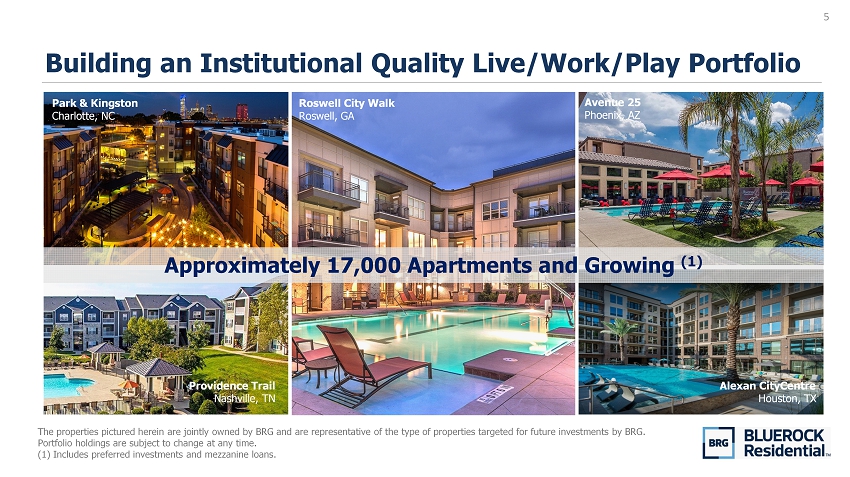
5 Building an Institutional Quality Live/Work/Play Portfolio The properties pictured herein are jointly owned by BRG and are representative of the type of properties targeted for future inv estments by BRG. Portfolio holdings are subject to change at any time. (1) Includes preferred investments and mezzanine loans. Park & Kingston Charlotte, NC Providence Trail Nashville, TN Roswell City Walk Roswell, GA Avenue 25 Phoenix, AZ Approximately 17,000 Apartments and Growing (1) Alexan CityCentre Houston, TX

6 Generational Demographics Create a Long Tailwind for Residential Real Estate Sources: U.S. Census Bureau and National Multifamily Housing Council Market Trends, August 2018. 20 20 21 21 22 24 22 22 20 21 21 22 20 17 13 9 6 7 <5 5 – 9 10 – 14 15 – 19 20 – 24 25 – 29 30 – 34 35 – 39 40 – 44 45 – 49 50 – 54 55 – 59 60 – 64 65 – 69 70 – 74 75 – 79 80 – 84 >85 Millennials Baby Boomers Generation X Generation Z AGE Active Adult │ MOB │ Manufactured Housing Multifamily | SFR │ Self Storage │ Student Housing Eisenhower Generation STUDENT HOUSING STUDENT HOUSING MULTIFAMILY ACTIVE ADULT ACTIVE ADULT ACTIVE ADULT ACTIVE ADULT SR LIVING Millions of People We believe Millennial and Baby Boomer generations contribute to favorable supply / demand fundamentals for demographic - driven property sectors Generations by Age Cohort 82 90 62 72 22 MULTIFAMILY MULTIFAMILY | SFR SFR

7 Knowledge Economy Jobs Deliver Significant Wage Growth and Should Prove Defensive in a Downturn Source: Bureau of Labor Statistics and U.S. Census Bureau; The Brookings Institution – America’s advanced industries: New Trends . Wage growth in knowledge - based jobs ~4x greater than non - knowledge - based jobs since 1975 Average earnings per worker (inflation adjusted) Advanced Industries: +68% Non - Advanced Industries: +25%
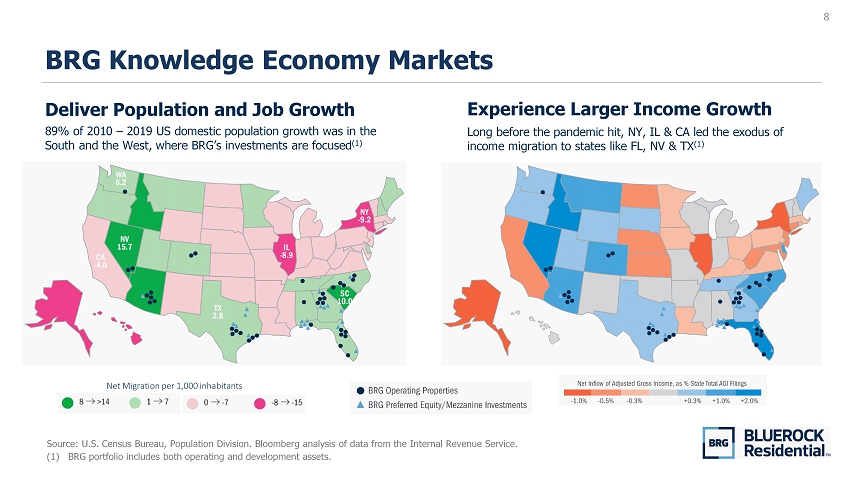
8 BRG Knowledge Economy Markets Deliver Population and Job Growth 89% of 2010 – 2019 US domestic population growth was in the South and the West, where BRG’s investments are focused (1) Long before the pandemic hit, NY, IL & CA led the exodus of income migration to states like FL, NV & TX (1) Experience Larger Income Growth Net Migration per 1,000 inhabitants Source: U.S. Census Bureau, Population Division . Bloomberg analysis of data from the Internal Revenue Service. (1) BRG portfolio includes both operating and development assets.

9 5% 95% ASSET TYPE Mid-Rise Garden Strategy Overview and Execution Charts represent BRG operating portfolio, including pending transactions. 100% 0% MARKET Sun Belt Gateway Primarily First - Ring Suburban Neighborhoods ▪ High barriers to entry ▪ “Live / Work / Play” characteristics Institutional Quality Portfolio with Class A - Affordable Rent Levels ▪ ~$1,100 - $1,300 average rents offer Class A product at affordable price point ▪ Full - cycle performance – downside rent protection with value - add upside Proactive Portfolio Management ▪ Accretive disposition cap rates of ~ 4 % with reinvestment cap rates stabilizing at ~ 6 % 94% 6% LOCATION 1st Ring Suburban Urban
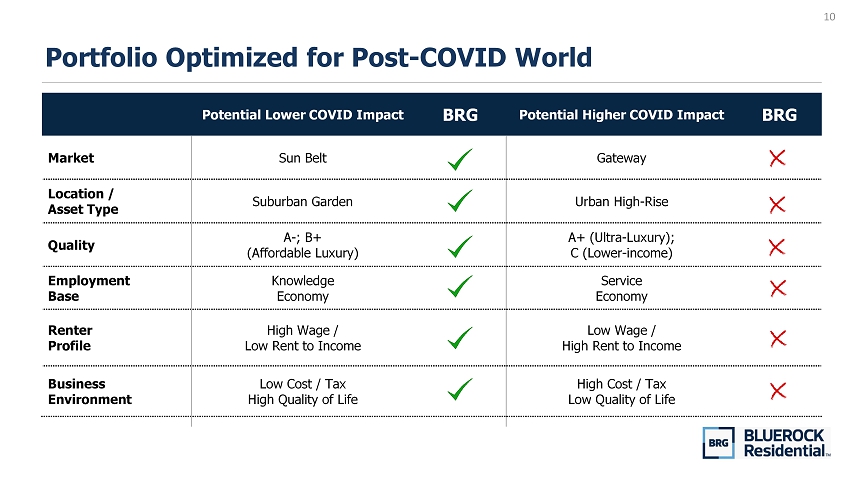
10 Portfolio Optimized for Post - COVID World Potential Lower COVID Impact BRG Potential Higher COVID Impact BRG Market Sun Belt Gateway Location / Asset Type Suburban Garden Urban High - Rise Quality A - ; B+ (Affordable Luxury) A+ (Ultra - Luxury); C (Lower - income) Employment Base Knowledge Economy Service Economy Renter Profile High Wage / Low Rent to Income Low Wage / High Rent to Income Business Environment Low Cost / Tax High Quality of Life High Cost / Tax Low Quality of Life

11 Capital Allocation Strategy ▪ Primarily Class A - / B+ assets with value - add growth opportunity ▪ Target above trend market NOI growth ▪ Target 70% - 90% of portfolio ▪ Provides stable income stream with lower LTV basis profile ▪ Higher yielding investments ▪ Built - in pipeline ▪ Target 10% - 30% of portfolio Mezz / Preferred Portfolio UNITS Lease - up/Stabilized Under Construction Operating Mezz / Preferred As of 6/1/21. Operating Portfolio

12 1 Q’21 Performance Snapshot Source: Company filings. (1) Same - Store portfolio. Reflects average occupancy for the quarter. (2) As of 3/31/21. (3) Including payment plans. Rents Collected 97% 24% Average ROI Series T Preferred vs. 97% in 4Q (3) $400MM+ Annual Run Rate 7 .3% Availability (2) 95.4% Occupancy +120bps Year - Over - Year (1) 3 ,027 Value - Add Renovations to Date (2) Average Lease Rate Growth in May +10.2%

13 1.5% 3.5% 5.8% 7.7% 10.2% 0.0% 1.5% 3.0% 4.5% 6.0% 7.5% 9.0% 10.5% Jan-21 Feb-21 Mar-21 Apr-21 May-21 2021 Monthly Average Lease Rate Growth Continues to Accelerate Note: BRG lease rate growth figures reflect total portfolio.
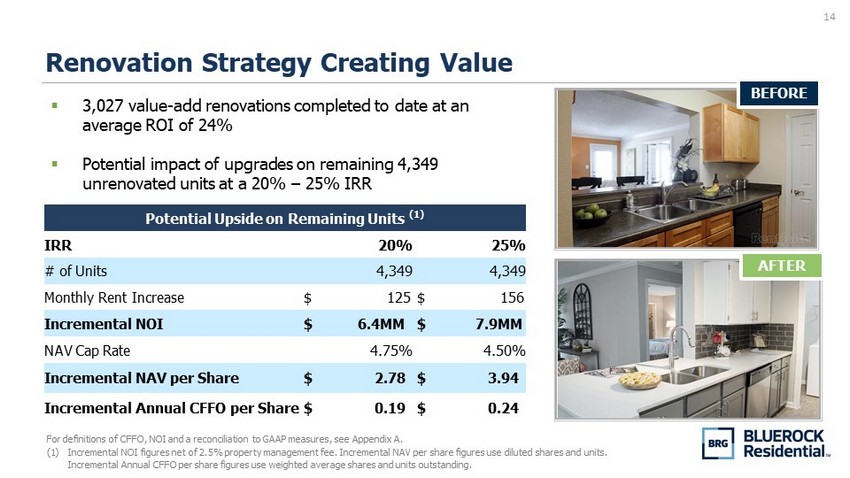
14 Potential Upside on Remaining Units (1) IRR 20% 25% # of Units 4,349 4,349 Monthly Rent Increase $ 125 $ 156 Incremental NOI $ 6.4MM $ 7.9MM NAV Cap Rate 4.75% 4.50% Incremental NAV per Share $ 2.78 $ 3.94 Incremental Annual CFFO per Share $ 0.19 $ 0.24 Renovation Strategy Creating Value For definitions of CFFO, NOI and a reconciliation to GAAP measures, see Appendix A. (1) Incremental NOI figures net of 2.5% property management fee. Incremental NAV per share figures use diluted shares and units. Incremental Annual CFFO per share figures use weighted average shares and units outstanding. BEFORE AFTER ▪ 3,027 value - add renovations completed to date at an average ROI of 24% ▪ Potential impact of upgrades on remaining 4,349 unrenovated units at a 20% – 25% IRR

15 Smart Home Technology Creating Value For definitions of CFFO, NOI and a reconciliation to GAAP measures, see Appendix A. (1) Incremental NOI figures net of 2.5% property management fee, 5% vacant unit estimate, and a $5 monthly recurring expense per uni t for Smart Home technology. Incremental NAV per share figures use diluted shares and units. Incremental Annual CFFO per share figures use weighted average shares and units outstanding. Technology includes, integrated smart locks, integrated thermostats, leak sensors, and app access from resident smartphones granting in - unit control Potential Upside on Smart Home Technology (1) Monthly Rent Increase $ 25 $ 35 # of Units 11,426 11,426 Incremental NOI $ 2.5MM $ 3.8MM NAV Cap Rate 4.75% 4.50% Incremental NAV per Share $ 1.21 $ 2.06 Incremental Annual CFFO per Share $ 0.08 $ 0.11 BEFORE AFTER ▪ Currently implementing Smart Home technology within our properties ▪ Technology also helps automate self - guided tours and monitor vacant apartments
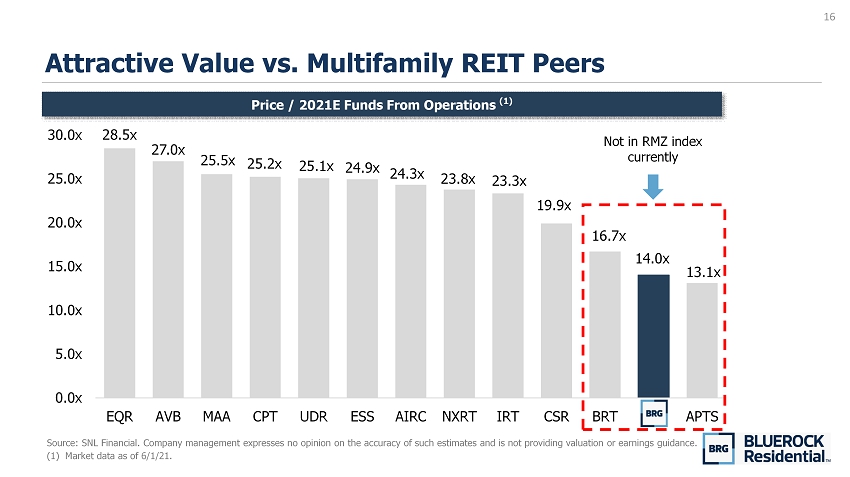
16 28.5x 27.0x 25.5x 25.2x 25.1x 24.9x 24.3x 23.8x 23.3x 19.9x 16.7x 14.0x 13.1x 0.0x 5.0x 10.0x 15.0x 20.0x 25.0x 30.0x EQR AVB MAA CPT UDR ESS AIRC NXRT IRT CSR BRT BRG APTS Attractive Value vs. Multifamily REIT Peers Source: SNL Financial. Company management expresses no opinion on the accuracy of such estimates and is not providing valuati on or earnings guidance. (1) Market data as of 6/1/21. Price / 2021E Funds From Operations (1) Not in RMZ index currently

17 APPENDIX A

18 ESG: Bluerock’s Publicly Stated Commitment to Honor and Protect Human Rights and Create a Positive and Diverse Workplace • Human Rights and Sensitivity Training for all employees • Support our Communities : arts funding, charitable giving programs in our communities • Listen to Staff : first engagement survey – 87 % of employees ‘Proud to work at Bluerock’ Reduce Energy Consumption, Improve Waste & Water Management • 100 % of New Developments built to reduce energy and water use and waste to landfills • Green Upgrades in Place at 75 % of operating properties • Smart Thermostat Installations at 85 % of units by early 3 Q Environmental Responsibility Social Responsibility Corporate Governance Uphold Our Fiduciary Responsibility to Maintain the Highest Level of Governance • Prioritize Ethical Behavior and a focus on creating shareholder value • Well - Aligned Management with substantial equity ownership • Board Diversity by gender and ethnicity ; 80 % director independence

19 $82 $14 $126 $202 $369 $668 $0 $200 $400 $600 $800 2021 2022 2023 2024 2025 Thereafter Source: Company filings. $’s in MM’s. (1) Includes available cash capacity on revolving credit facilities. (2) Property level debt excludes outstanding balances on revolving credit facilities. Fair value adjustments and net deferred fin anc ing costs reflected in ‘Thereafter’ bar. (3) $74.7MM represents a loan in connection with The District at Scottsdale. The loan has a June 2021 maturity date and contains two three - month extension options, subject to certain conditions. No Corporate Level Debt and Limited Near - Term Debt Maturities Cash availability of $260.5MM, as of 3/31/21 with well laddered debt maturities (1) Debt Maturity Schedule (2) (3)
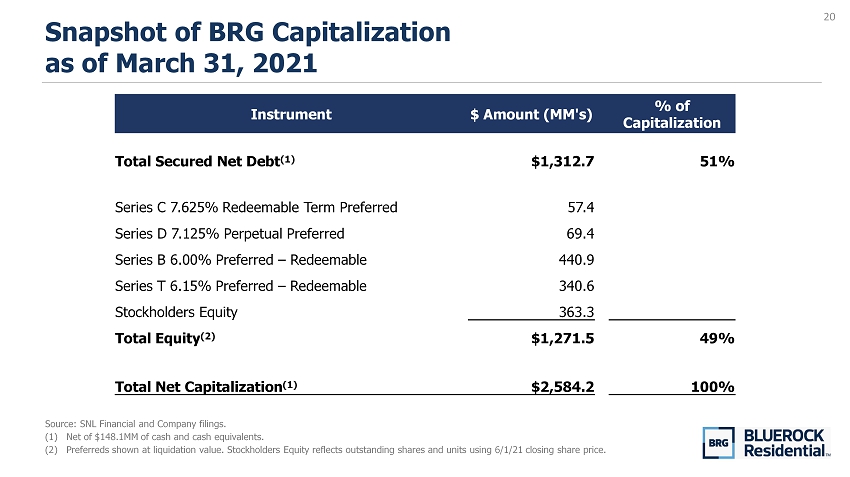
20 Snapshot of BRG Capitalization as of March 31, 2021 Source: SNL Financial and Company filings. (1) Net of $148.1MM of cash and cash equivalents. (2) Preferreds shown at liquidation value. Stockholders Equity reflects outstanding shares and units using 6/1/21 closing share p ric e. Instrument $ Amount (MM's) % of Capitalization Total Secured Net Debt (1) $1,312.7 51% Series C 7.625% Redeemable Term Preferred 57.4 Series D 7.125% Perpetual Preferred 69.4 Series B 6.00% Preferred – Redeemable 440.9 Series T 6.15% Preferred – Redeemable 340.6 Stockholders Equity 363.3 Total Equity (2) $1,271.5 49% Total Net Capitalization (1) $2,584.2 100%

21 NOI Reconciliation NOI reconciliation footnotes on page 22. We believe that net operating income, or NOI, is a useful measure of our operating performance . We define NOI as total property revenues less total property operating expenses, excluding depreciation and amortization and interest . Other REITs may use different methodologies for calculating NOI, and accordingly, our NOI may not be comparable to other REITs . We believe that this measure provides an operating perspective not immediately apparent from GAAP operating income or net income . We use NOI to evaluate our performance on a same store and non - same store basis ; NOI measures the core operations of property performance by excluding corporate level expenses and other items not related to property operating performance and captures trends in rental housing and property operating expenses . However, NOI should only be used as a supplemental measure of our financial performance . The following table reflects net income (loss) attributable to common stockholders together with a reconciliation to NOI and to same store and non - same store contributions to consolidated NOI, as computed in accordance with GAAP for the periods presented (unaudited and amounts in thousands) : Mar 31, Jun 30, Sep 30, Dec 31, Mar 31, June 30, Sep 30, Dec 31, Mar 31, 2019 (1) 2019 (2) 2019 (3) 2019 (4) 2020 (5) 2020 (6) 2020 (7) 2020 (8) 2021 (9) Net income (loss) attributable to common stockholders (12,093)$ (10,990)$ 17,160$ (13,827)$ (16,493)$ 15,090$ (17,058)$ (26,213)$ 23,581$ Add back: Net income (loss) attributable to Operating Partnership Units (4,051) (3,887) 6,191 (5,032) (5,822) 5,413 (6,270) (10,634) 10,160 Net income (loss) attributable to common stockholders and unit holders (16,144)$ (14,877)$ 23,351$ (18,859)$ (22,315)$ 20,503$ (23,328)$ (36,847)$ 33,741$ Add common stockholders and Operating Partnership Units pro-rata share of: Real estate depreciation and amortization 16,142 15,290 16,755 18,483 19,900 19,144 18,309 18,373 19,405 Non-real estate depreciation and amortization 86 84 157 121 120 122 122 122 122 Non-cash interest expense 775 786 787 826 845 747 731 701 604 Unrealized (gain) loss on derivatives 1,635 652 131 32 (26) (5) 98 48 (30) Loss on extinguishment of debt and debt modification costs - - 6,864 335 - 13,590 - 647 2,564 Provision for credit losses 16,369 542 Property management fees 1,148 1,170 1,193 1,135 1,232 1,135 1,173 1,211 1,223 Acquisition and pursuit costs 58 70 217 210 1,269 423 2,242 219 11 Corporate operating expenses 5,554 4,975 6,187 5,545 6,296 5,166 5,817 6,490 6,570 Weather-related losses, net - 249 57 7 - - - - 360 Preferred dividends 10,384 11,019 11,887 12,868 13,547 14,237 15,003 15,676 14,617 Preferred stock accretion 1,887 2,316 2,717 3,415 3,925 3,602 4,451 4,873 7,022 Less common stockholders and Operating Partnership Units pro-rata share of: Other income, net - - - 68 40 (43) 52 25 51 Preferred returns on unconsolidated real estate joint ventures 2,289 2,492 2,316 2,700 2,574 2,834 2,935 3,037 2,287 Interest income from mezzanine loan and ground lease investments 5,776 5,973 6,125 6,720 5,888 5,338 5,923 6,177 4,721 Gain on sale of real estate investments - - 48,172 - 110 55,250 - 1,417 62,427 Gain on sale of non-depreciable real estate investments 679 - - - - - - - - Pro-rata share of properties' income 12,781 13,269 13,690 14,630 16,181 15,285 15,708 17,226 17,265 Add: Noncontrolling interest pro-rata share of partially owned property income 729 690 668 724 803 750 725 799 637 Total property income 13,510 13,959 14,358 15,354 16,984 16,035 16,433 18,025 17,902 Add: Interest expense 13,578 13,637 13,687 12,846 14,070 13,089 12,662 12,924 13,247 Net operating income 27,088 27,596 28,045 28,200 31,054 29,124 29,095 30,949 31,149 Less: Non-same store net operating income 4,217 3,752 7,288 6,450 7,144 7,908 6,878 5,403 7,188 Same store net operating income 22,871$ 23,844$ 20,757$ 21,750$ 23,910$ 21,216$ 22,217$ 25,546$ 23,961$

22 NOI Reconciliation Footnotes NOI reconciliation on page 21. (1) Same store portfolio for the three months ended March 31, 2019 consists of 28 properties, which represent 9,608 units. (2) Same store portfolio for the three months ended June 30, 2019 consists of 29 properties, which represent 9,872 units. (3) Same store portfolio for the three months ended September 30, 2019 consists of 25 properties, which represent 8,379 units . (4) Same store portfolio for the three months ended December 31, 2019 consists of 26 properties, which represent 8,779 units. (5) Same store portfolio for the three months ended March 31, 2020 consists of 27 properties, which represent 9,291 units. (6) Same store portfolio for the three months ended June 30, 2020 consists of 24 properties, which represent 8,459 units. (7) Same store portfolio for the three months ended September 30, 2020 consists of 26 properties, which represent 8,993 units . (8) Same store portfolio for the three months ended December 31, 2020 consists of 28 properties, which represent 9,958 units. (9) Same store portfolio for the three months ended March 31, 2021 consists of 26 properties, which represent 9,116 units.
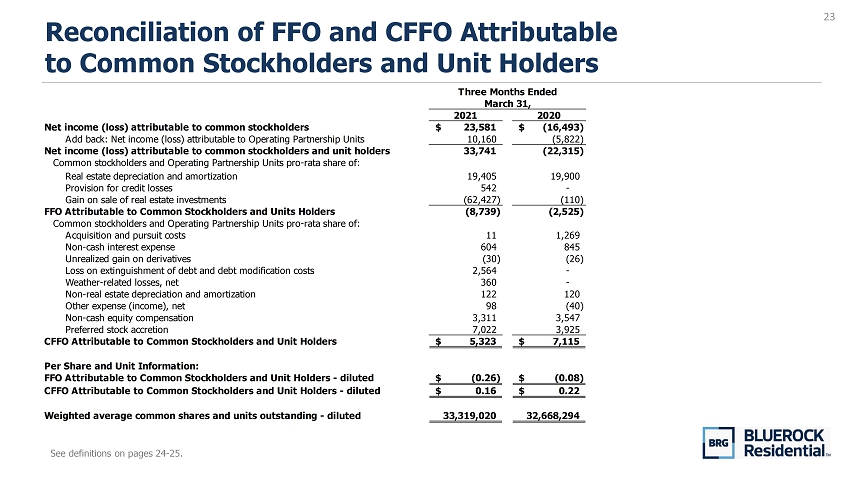
23 Reconciliation of FFO and CFFO Attributable to Common Stockholders and Unit Holders See definitions on pages 24 - 25. 2021 2020 Net income (loss) attributable to common stockholders 23,581$ (16,493)$ Add back: Net income (loss) attributable to Operating Partnership Units 10,160 (5,822) Net income (loss) attributable to common stockholders and unit holders 33,741 (22,315) Common stockholders and Operating Partnership Units pro-rata share of: Real estate depreciation and amortization 19,405 19,900 Provision for credit losses 542 - Gain on sale of real estate investments (62,427) (110) FFO Attributable to Common Stockholders and Units Holders (8,739) (2,525) Common stockholders and Operating Partnership Units pro-rata share of: Acquisition and pursuit costs 11 1,269 Non-cash interest expense 604 845 Unrealized gain on derivatives (30) (26) Loss on extinguishment of debt and debt modification costs 2,564 - Weather-related losses, net 360 - Non-real estate depreciation and amortization 122 120 Other expense (income), net 98 (40) Non-cash equity compensation 3,311 3,547 Preferred stock accretion 7,022 3,925 CFFO Attributable to Common Stockholders and Unit Holders 5,323$ 7,115$ Per Share and Unit Information: FFO Attributable to Common Stockholders and Unit Holders - diluted (0.26)$ (0.08)$ CFFO Attributable to Common Stockholders and Unit Holders - diluted 0.16$ 0.22$ Weighted average common shares and units outstanding - diluted 33,319,020 32,668,294 Three Months Ended March 31,

24 Definitions FFO and Core FFO reconciliation on page 23. Funds from Operations and Core Funds from Operations, Attributable to Common Stockholders and Unit Holders We believe that funds from operations (“FFO”), as defined by the National Association of Real Estate Investment Trusts (“NAREIT”), and core funds from operations (“CFFO”) are important non - GAAP supplemental measures of operating performance for a REIT . FFO attributable to common stockholders and unit holders is a non - GAAP financial measure that is widely recognized as a measure of REIT operating performance . We consider FFO to be an appropriate supplemental measure of our operating performance as it is based on a net income analysis of property portfolio performance that excludes non - cash items such as depreciation . The historical accounting convention used for real estate assets requires straight - line depreciation of buildings and improvements, which implies that the value of real estate assets diminishes predictably over time . Since real estate values historically rise and fall with market conditions, presentations of operating results for a REIT, using historical accounting for depreciation, could be less informative . We define FFO, consistent with the NAREIT definition, as net (loss) income, computed in accordance with GAAP, excluding gains or losses on sales of depreciable real estate property, plus depreciation and amortization of real estate assets, plus impairment write - downs of certain real estate assets and investments in entities where the impairment is directly attributable to decreases in the value of depreciable real estate held by the entity, and after adjustments for unconsolidated partnerships and joint ventures . Adjustments for unconsolidated partnerships and joint ventures will be calculated to reflect FFO on the same basis . CFFO makes certain adjustments to FFO, removing the effect of items that do not reflect ongoing property operations such as acquisition expenses, non - cash interest expense, unrealized gains or losses on derivatives, losses on extinguishment of debt and debt modification costs (includes prepayment penalties incurred and the write - off of unamortized deferred financing costs and fair market value adjustments of assumed debt), one - time weather - related costs, stock compensation expense and preferred stock accretion . We believe that CFFO is helpful to investors as a supplemental performance measure because it excludes the effects of certain items which can create significant earnings volatility, but which do not directly relate to our core recurring property operations . As a result, we believe that CFFO can help facilitate comparisons of operating performance between periods and provides a more meaningful predictor of future earnings potential . Our calculation of CFFO differs from the methodology used for calculating CFFO by certain other REITs and, accordingly, our CFFO may not be comparable to CFFO reported by other REITs . Our management utilizes FFO and CFFO as measures of our operating performance after adjustment for certain non - cash items, such as depreciation and amortization expenses, and acquisition and pursuit costs that are required by GAAP to be expensed but may not necessarily be indicative of current operating performance and that may not accurately compare our operating performance between periods . Furthermore, although FFO and CFFO and other supplemental performance measures are defined in various ways throughout the REIT industry, we also believe that FFO and CFFO may provide us and our stockholders with an additional useful measure to compare our financial performance to certain other REITs .

25 Definitions continued… Neither FFO nor CFFO is equivalent to net income, including net income attributable to common stockholders, or cash generated from operating activities determined in accordance with GAAP . Furthermore, FFO and CFFO do not represent amounts available for management's discretionary use because of needed capital replacement or expansion, debt service obligations or other commitments or uncertainties . Neither FFO nor CFFO should be considered as an alternative to net income, including net income attributable to common stockholders, as an indicator of our operating performance or as an alternative to cash flow from operating activities as a measure of our liquidity . We have acquired four operating properties, made six property investments through preferred equity or mezzanine loan investme nts , sold seven operating properties and received our full mezzanine loan or preferred equity in four investments subsequent to March 31, 2020.The resu lts presented are not directly comparable and should not be considered an indication of our future operating performance (unaudited and dollars in thousands, except share and per sh are data). FFO and Core FFO reconciliation on page 23.

26