Attached files
| file | filename |
|---|---|
| 8-K - 8-K - ALERUS FINANCIAL CORP | alrs-20210607x8k.htm |
Exhibit 99.1
| INVESTOR PRESENTATION JUNE 2021 Alerus |
| 1 Forward-Looking Statements This presentation contains “forward-looking statements” within the meaning of the safe harbor provisions of the U.S. Private Securities Litigation Reform Act of 1995. Forward-looking statements include, without limitation, statements concerning plans, estimates, calculations, forecasts and projections with respect to the anticipated future performance of Alerus Financial Corporation. These statements are often, but not always, identified by words such as “may”, “might”, “should”, “could”, “predict”, “potential”, “believe”, “expect”, “continue”, “will”, “anticipate”, “seek”, “estimate”, “intend”, “plan”, “projection”, “would”, “annualized”, “target” and “outlook”, or the negative version of those words or other comparable words of a future or forward-looking nature. Examples of forward-looking statements include, among others, statements we make regarding our projected growth, anticipated future financial performance, financial condition, credit quality, management’s long-term performance goals and the future plans and prospects of Alerus Financial Corporation. Forward-looking statements are neither historical facts nor assurances of future performance. Instead, they are based only on our current beliefs, expectations and assumptions regarding the future of our business, future plans and strategies, projections, anticipated events and trends, the economy and other future conditions. Because forward-looking statements relate to the future, they are subject to inherent uncertainties, risks and changes in circumstances that are difficult to predict and many of which are outside of our control. Our actual results and financial condition may differ materially from those indicated in the forward-looking statements. Therefore, you should not rely on any of these forward-looking statements. Important factors that could cause our actual results and financial condition to differ materially from those indicated in the forward-looking statements include, among others, the following: the effects of the COVID-19 pandemic, including its effects on the economic environment, our clients and our operations, as well as any changes to federal, state or local government laws, regulations or orders in connection with the pandemic; our ability to successfully manage credit risk and maintain an adequate level of allowance for loan losses; new or revised accounting standards, including as a result of the future implementation of the new Current Expected Credit Loss Standard; business and economic conditions generally and in the financial services industry, nationally and within our market areas; the overall health of the local and national real estate market; concentrations within our loan portfolio; the level of nonperforming assets on our balance sheet; our ability to implement our organic and acquisition growth strategies; the impact of economic or market conditions on our fee-based services; our ability to continue to grow our retirement and benefit services business; our ability to continue to originate a sufficient volume of residential mortgages; the occurrence of fraudulent activity, breaches or failures of our information security controls or cybersecurity related incidents; interruptions involving our information technology and telecommunications systems or third-party servicers; potential losses incurred in connection with mortgage loan repurchases; the composition of our executive management team and our ability to attract and retain key personnel; rapid technological change in the financial services industry; increased competition in the financial services industry; our ability to successfully manage liquidity risk; the effectiveness of our risk management framework; the commencement and outcome of litigation and other legal proceedings and regulatory actions against us or to which we may become subject; potential impairment to the goodwill we recorded in connection with our past acquisitions; the extensive regulatory framework that applies to us; the impact of recent and future legislative and regulatory changes; interest rate risks associated with our business; fluctuations in the values of the securities held in our securities portfolio; governmental monetary, trade and fiscal policies; severe weather, natural disasters, widespread disease or pandemics, such as the COVID-19 global pandemic, acts of war or terrorism or other adverse external events; any material weaknesses in our internal control over financial reporting; developments and uncertainty related to the future use and availability of some reference rates, such as the London Interbank Offered Rate, as well as other alternative rates; changes to U.S. tax laws, regulations and guidance; our success at managing the risks involved in the foregoing items; and any other risks described in the “Risk Factors” sections of the reports filed by Alerus Financial Corporation with the Securities and Exchange Commission. Any forward-looking statement made by us in this presentation is based only on information currently available to us and speaks only as of the date on which it is made. We undertake no obligation to publicly update any forward-looking statement, whether written or oral, that may be made from time to time, whether as a result of new information, future developments or otherwise. Non-GAAP Financial Measures This presentation includes certain ratios and amounts that do not conform to U.S. Generally Accepted Accounting Principles, or GAAP. Management uses certain non-GAAP financial measures to evaluate financial performance and business trends from period to period and believes that disclosure of these non-GAAP financial measures will help investors, rating agencies and analysts evaluate the financial performance and condition of Alerus Financial Corporation. This presentation includes a reconciliation of each non-GAAP financial measure to the most comparable GAAP equivalent. Miscellaneous Except as otherwise indicated, this presentation speaks as of the date hereof. The delivery of this presentation shall not, under any circumstances, create any implication that there has been no change in the affairs of Alerus Financial Corporation after the date hereof. Certain of the information contained herein may be derived from information provided by industry sources. We believe that such information is accurate and that the sources from which it has been obtained are reliable. We cannot guarantee the accuracy of such information, however, and we have not independently verified such information. DISCLAIMERS |
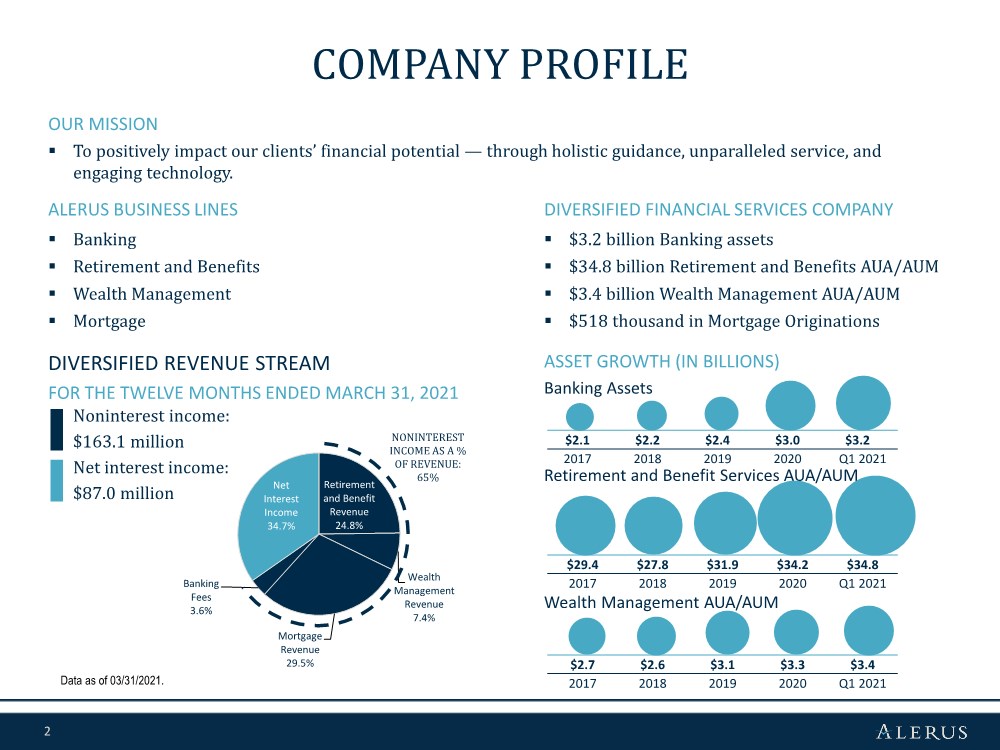
| 2 Retirement and Benefit Revenue 24.8% Wealth Management Revenue 7.4% Mortgage Revenue 29.5% Banking Fees 3.6% Net Interest Income 34.7% FOR THE TWELVE MONTHS ENDED MARCH 31, 2021 Noninterest income: $163.1 million Net interest income: $87.0 million $29.4 $27.8 $31.9 $34.2 $34.8 2017 2018 2019 2020 Q1 2021 OUR MISSION ▪ To positively impact our clients’ financial potential — through holistic guidance, unparalleled service, and engaging technology. COMPANY PROFILE Data as of 03/31/2021. DIVERSIFIED REVENUE STREAM ASSET GROWTH (IN BILLIONS) $2.1 $2.2 $2.4 $3.0 $3.2 2017 2018 2019 2020 Q1 2021 Banking Assets Retirement and Benefit Services AUA/AUM Wealth Management AUA/AUM $2.7 $2.6 $3.1 $3.3 $3.4 2017 2018 2019 2020 Q1 2021 NONINTEREST INCOME AS A % OF REVENUE: 65% DIVERSIFIED FINANCIAL SERVICES COMPANY ▪ $3.2 billion Banking assets ▪ $34.8 billion Retirement and Benefits AUA/AUM ▪ $3.4 billion Wealth Management AUA/AUM ▪ $518 thousand in Mortgage Originations ALERUS BUSINESS LINES ▪ Banking ▪ Retirement and Benefits ▪ Wealth Management ▪ Mortgage |
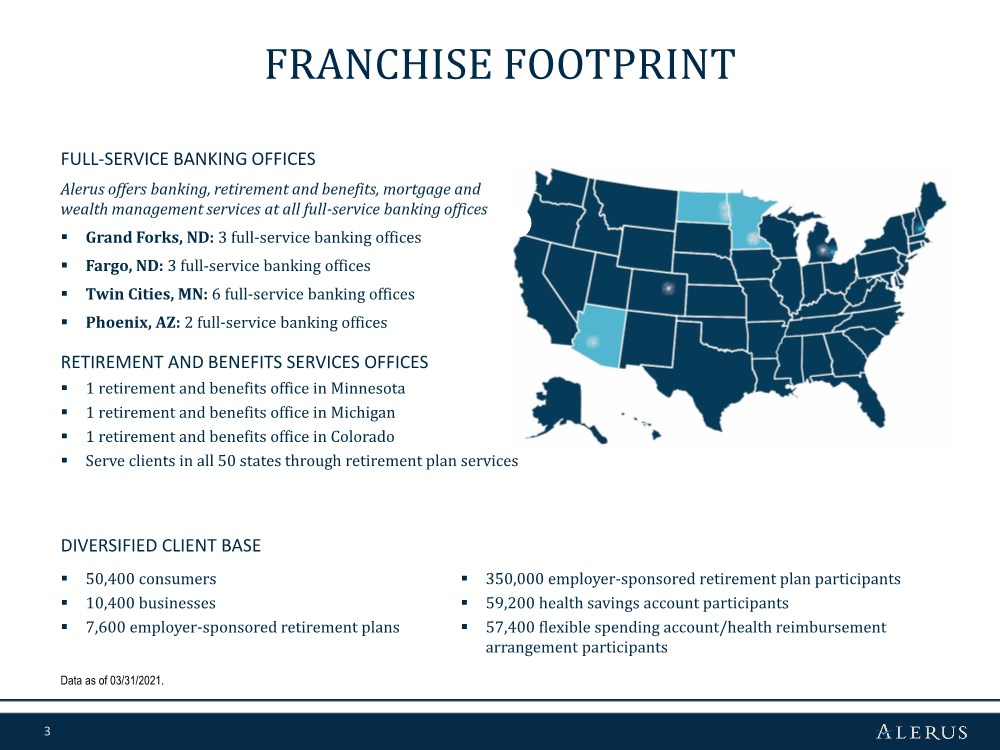
| 3 FRANCHISE FOOTPRINT FULL-SERVICE BANKING OFFICES Alerus offers banking, retirement and benefits, mortgage and wealth management services at all full-service banking offices ▪ Grand Forks, ND: 3 full-service banking offices ▪ Fargo, ND: 3 full-service banking offices ▪ Twin Cities, MN: 6 full-service banking offices ▪ Phoenix, AZ: 2 full-service banking offices RETIREMENT AND BENEFITS SERVICES OFFICES ▪ 1 retirement and benefits office in Minnesota ▪ 1 retirement and benefits office in Michigan ▪ 1 retirement and benefits office in Colorado ▪ Serve clients in all 50 states through retirement plan services DIVERSIFIED CLIENT BASE ▪ 50,400 consumers ▪ 10,400 businesses ▪ 7,600 employer-sponsored retirement plans Data as of 03/31/2021. ▪ 350,000 employer-sponsored retirement plan participants ▪ 59,200 health savings account participants ▪ 57,400 flexible spending account/health reimbursement arrangement participants |
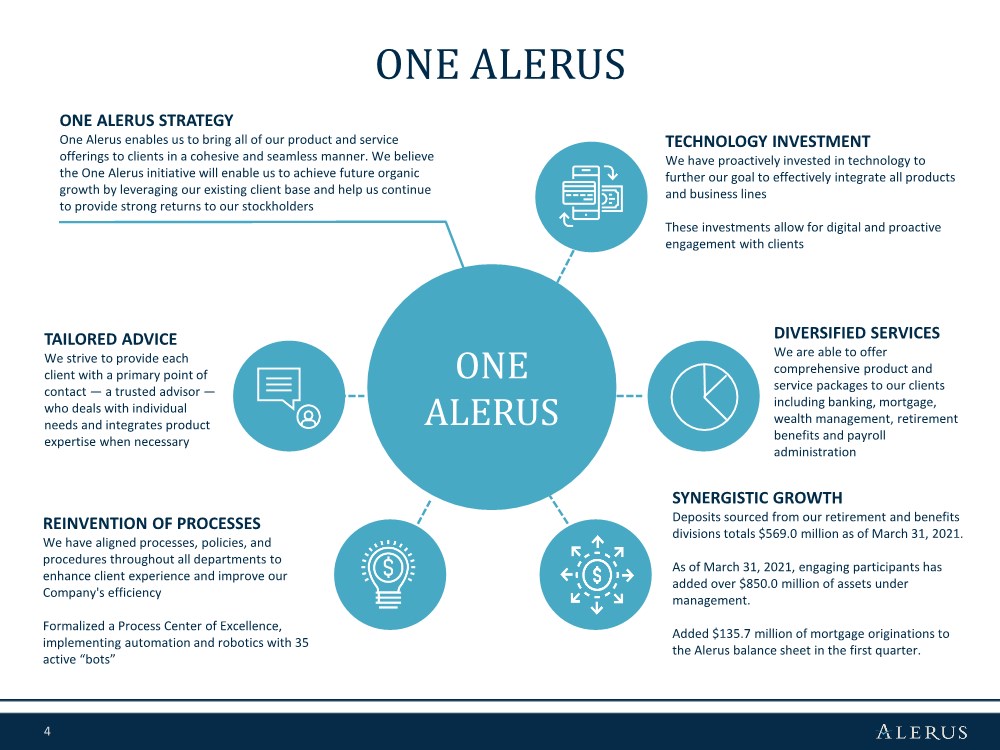
| 4 ONE ALERUS REINVENTION OF PROCESSES We have aligned processes, policies, and procedures throughout all departments to enhance client experience and improve our Company's efficiency Formalized a Process Center of Excellence, implementing automation and robotics with 35 active “bots” TAILORED ADVICE We strive to provide each client with a primary point of contact — a trusted advisor — who deals with individual needs and integrates product expertise when necessary SYNERGISTIC GROWTH Deposits sourced from our retirement and benefits divisions totals $569.0 million as of March 31, 2021. As of March 31, 2021, engaging participants has added over $850.0 million of assets under management. Added $135.7 million of mortgage originations to the Alerus balance sheet in the first quarter. TECHNOLOGY INVESTMENT We have proactively invested in technology to further our goal to effectively integrate all products and business lines These investments allow for digital and proactive engagement with clients DIVERSIFIED SERVICES We are able to offer comprehensive product and service packages to our clients including banking, mortgage, wealth management, retirement benefits and payroll administration ONE ALERUS STRATEGY One Alerus enables us to bring all of our product and service offerings to clients in a cohesive and seamless manner. We believe the One Alerus initiative will enable us to achieve future organic growth by leveraging our existing client base and help us continue to provide strong returns to our stockholders ONE ALERUS |
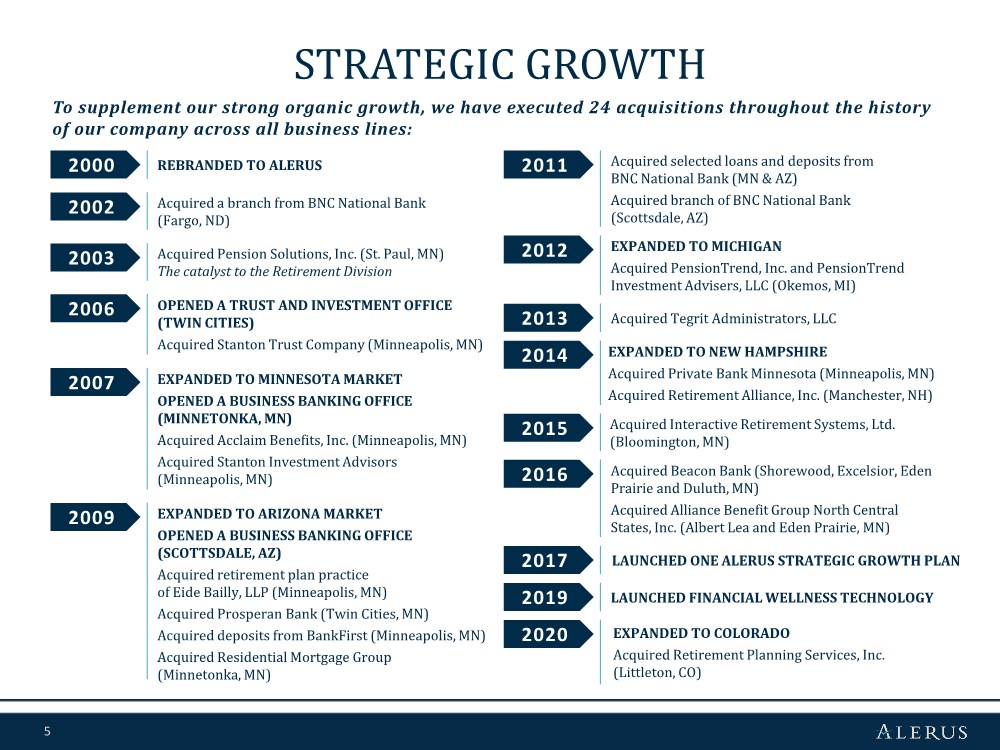
| 5 EXPANDED TO COLORADO Acquired Retirement Planning Services, Inc. (Littleton, CO) To supplement our strong organic growth, we have executed 24 acquisitions throughout the history of our company across all business lines: STRATEGIC GROWTH 2000 2002 2003 2006 2007 2019 2009 2016 2015 2014 2013 2012 2011 REBRANDED TO ALERUS Acquired a branch from BNC National Bank (Fargo, ND) Acquired Pension Solutions, Inc. (St. Paul, MN) The catalyst to the Retirement Division OPENED A TRUST AND INVESTMENT OFFICE (TWIN CITIES) Acquired Stanton Trust Company (Minneapolis, MN) EXPANDED TO MINNESOTA MARKET OPENED A BUSINESS BANKING OFFICE (MINNETONKA, MN) Acquired Acclaim Benefits, Inc. (Minneapolis, MN) Acquired Stanton Investment Advisors (Minneapolis, MN) EXPANDED TO ARIZONA MARKET OPENED A BUSINESS BANKING OFFICE (SCOTTSDALE, AZ) Acquired retirement plan practice of Eide Bailly, LLP (Minneapolis, MN) Acquired Prosperan Bank (Twin Cities, MN) Acquired deposits from BankFirst (Minneapolis, MN) Acquired Residential Mortgage Group (Minnetonka, MN) Acquired selected loans and deposits from BNC National Bank (MN & AZ) Acquired branch of BNC National Bank (Scottsdale, AZ) EXPANDED TO MICHIGAN Acquired PensionTrend, Inc. and PensionTrend Investment Advisers, LLC (Okemos, MI) Acquired Tegrit Administrators, LLC EXPANDED TO NEW HAMPSHIRE Acquired Private Bank Minnesota (Minneapolis, MN) Acquired Retirement Alliance, Inc. (Manchester, NH) Acquired Interactive Retirement Systems, Ltd. (Bloomington, MN) Acquired Beacon Bank (Shorewood, Excelsior, Eden Prairie and Duluth, MN) Acquired Alliance Benefit Group North Central States, Inc. (Albert Lea and Eden Prairie, MN) LAUNCHED FINANCIAL WELLNESS TECHNOLOGY 2017 LAUNCHED ONE ALERUS STRATEGIC GROWTH PLAN 2020 |
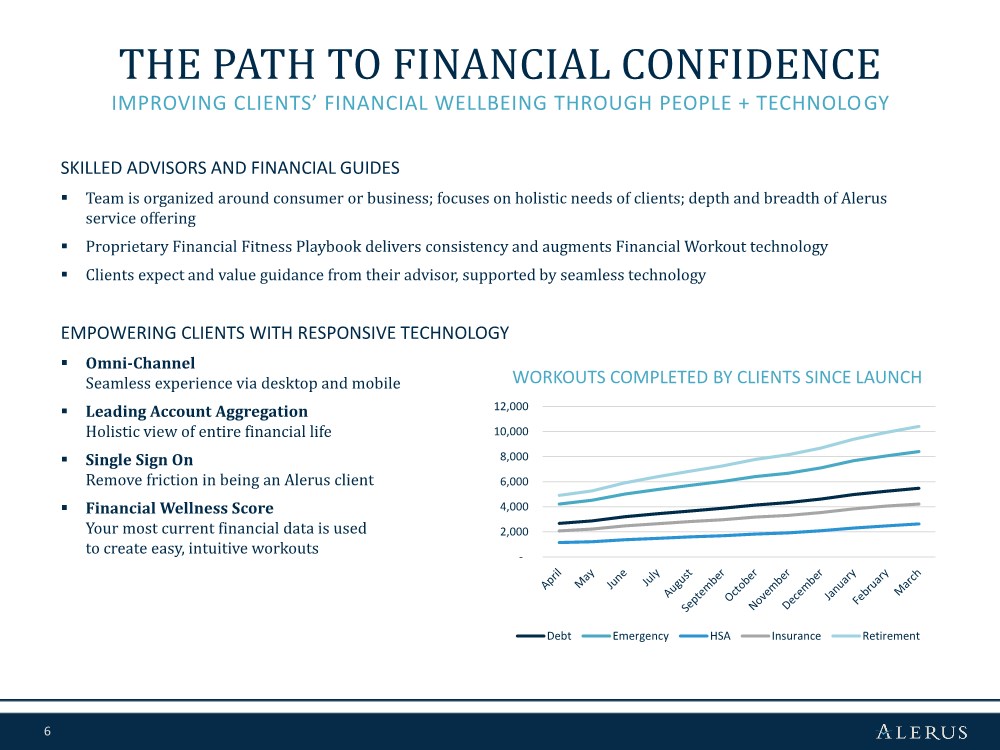
| 6 SKILLED ADVISORS AND FINANCIAL GUIDES ▪ Team is organized around consumer or business; focuses on holistic needs of clients; depth and breadth of Alerus service offering ▪ Proprietary Financial Fitness Playbook delivers consistency and augments Financial Workout technology ▪ Clients expect and value guidance from their advisor, supported by seamless technology EMPOWERING CLIENTS WITH RESPONSIVE TECHNOLOGY ▪ Omni-Channel Seamless experience via desktop and mobile ▪ Leading Account Aggregation Holistic view of entire financial life ▪ Single Sign On Remove friction in being an Alerus client ▪ Financial Wellness Score Your most current financial data is used to create easy, intuitive workouts IMPROVING CLIENTS’ FINANCIAL WELLBEING THROUGH PEOPLE + TECHNOLOGY THE PATH TO FINANCIAL CONFIDENCE WORKOUTS COMPLETED BY CLIENTS SINCE LAUNCH - 2,000 4,000 6,000 8,000 10,000 12,000 Debt Emergency HSA Insurance Retirement |
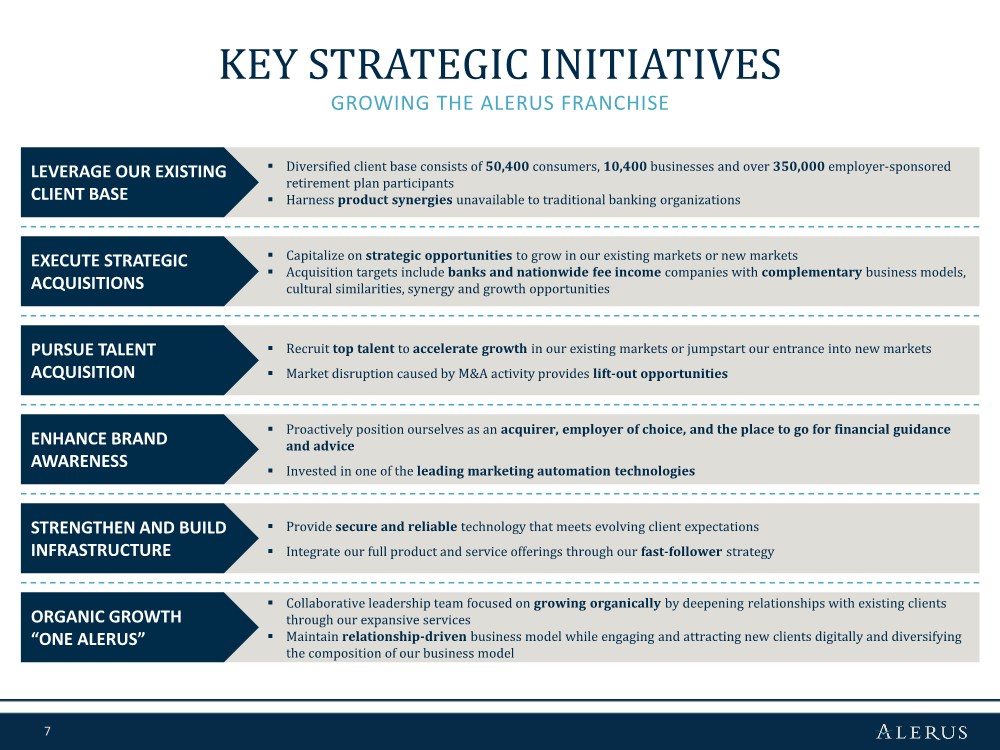
| 7 ▪ Diversified client base consists of 50,400 consumers, 10,400 businesses and over 350,000 employer-sponsored retirement plan participants ▪ Harness product synergies unavailable to traditional banking organizations ▪ Capitalize on strategic opportunities to grow in our existing markets or new markets ▪ Acquisition targets include banks and nationwide fee income companies with complementary business models, cultural similarities, synergy and growth opportunities ▪ Recruit top talent to accelerate growth in our existing markets or jumpstart our entrance into new markets ▪ Market disruption caused by M&A activity provides lift-out opportunities ▪ Proactively position ourselves as an acquirer, employer of choice, and the place to go for financial guidance and advice ▪ Invested in one of the leading marketing automation technologies ▪ Provide secure and reliable technology that meets evolving client expectations ▪ Integrate our full product and service offerings through our fast-follower strategy ▪ Collaborative leadership team focused on growing organically by deepening relationships with existing clients through our expansive services ▪ Maintain relationship-driven business model while engaging and attracting new clients digitally and diversifying the composition of our business model KEY STRATEGIC INITIATIVES GROWING THE ALERUS FRANCHISE LEVERAGE OUR EXISTING CLIENT BASE EXECUTE STRATEGIC ACQUISITIONS PURSUE TALENT ACQUISITION ENHANCE BRAND AWARENESS STRENGTHEN AND BUILD INFRASTRUCTURE ORGANIC GROWTH “ONE ALERUS” |
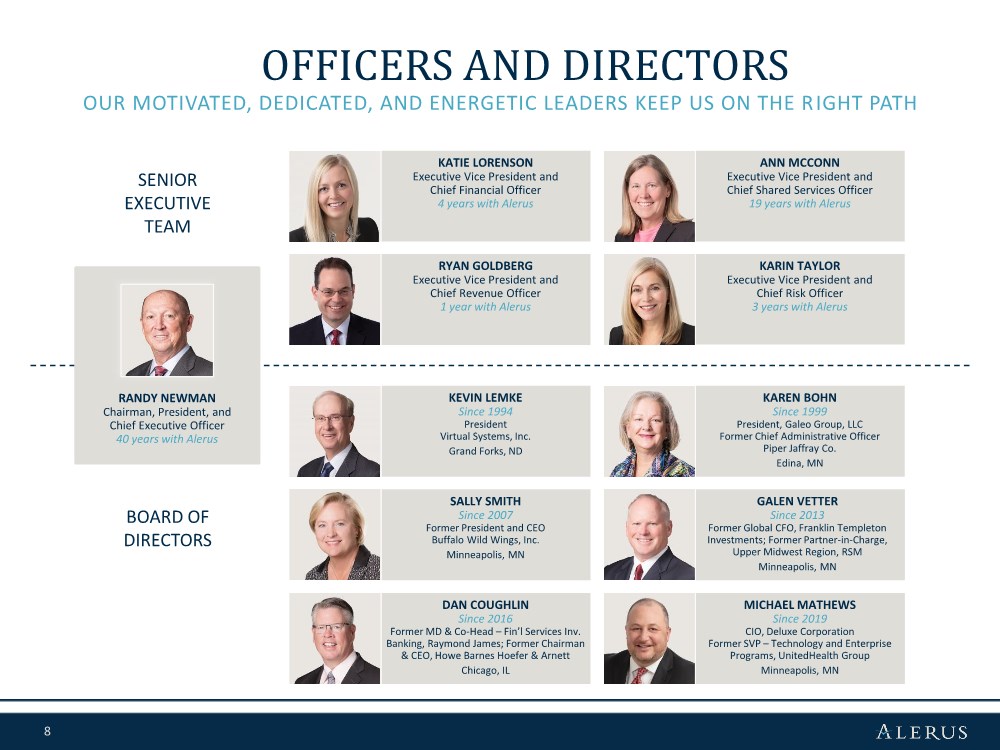
| 8 OFFICERS AND DIRECTORS OUR MOTIVATED, DEDICATED, AND ENERGETIC LEADERS KEEP US ON THE RIGHT PATH SENIOR EXECUTIVE TEAM BOARD OF DIRECTORS DAN COUGHLIN Since 2016 Former MD & Co-Head – Fin’l Services Inv. Banking, Raymond James; Former Chairman & CEO, Howe Barnes Hoefer & Arnett Chicago, IL MICHAEL MATHEWS Since 2019 CIO, Deluxe Corporation Former SVP – Technology and Enterprise Programs, UnitedHealth Group Minneapolis, MN GALEN VETTER Since 2013 Former Global CFO, Franklin Templeton Investments; Former Partner-in-Charge, Upper Midwest Region, RSM Minneapolis, MN KATIE LORENSON Executive Vice President and Chief Financial Officer 4 years with Alerus ANN MCCONN Executive Vice President and Chief Shared Services Officer 19 years with Alerus RYAN GOLDBERG Executive Vice President and Chief Revenue Officer 1 year with Alerus KARIN TAYLOR Executive Vice President and Chief Risk Officer 3 years with Alerus SALLY SMITH Since 2007 Former President and CEO Buffalo Wild Wings, Inc. Minneapolis, MN KAREN BOHN Since 1999 President, Galeo Group, LLC Former Chief Administrative Officer Piper Jaffray Co. Edina, MN KEVIN LEMKE Since 1994 President Virtual Systems, Inc. Grand Forks, ND RANDY NEWMAN Chairman, President, and Chief Executive Officer 40 years with Alerus |
| 9 2021 HIGHLIGHTS |

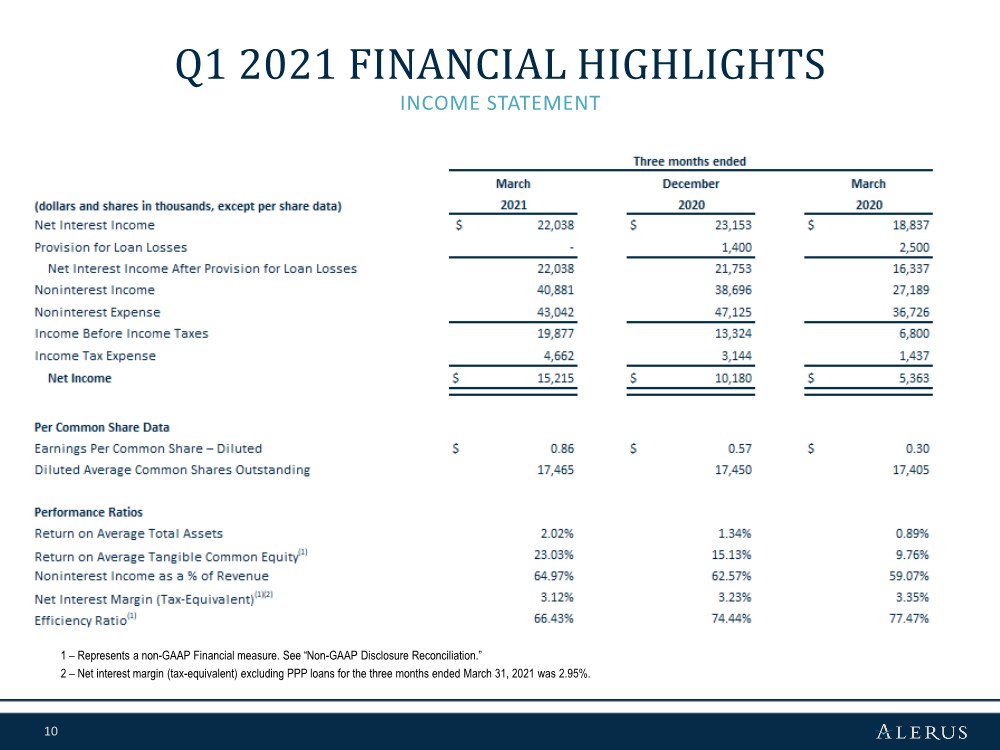
| 10 INCOME STATEMENT Q1 2021 FINANCIAL HIGHLIGHTS 1 – Represents a non-GAAP Financial measure. See “Non-GAAP Disclosure Reconciliation.” 2 – Net interest margin (tax-equivalent) excluding PPP loans for the three months ended March 31, 2021 was 2.95%. |
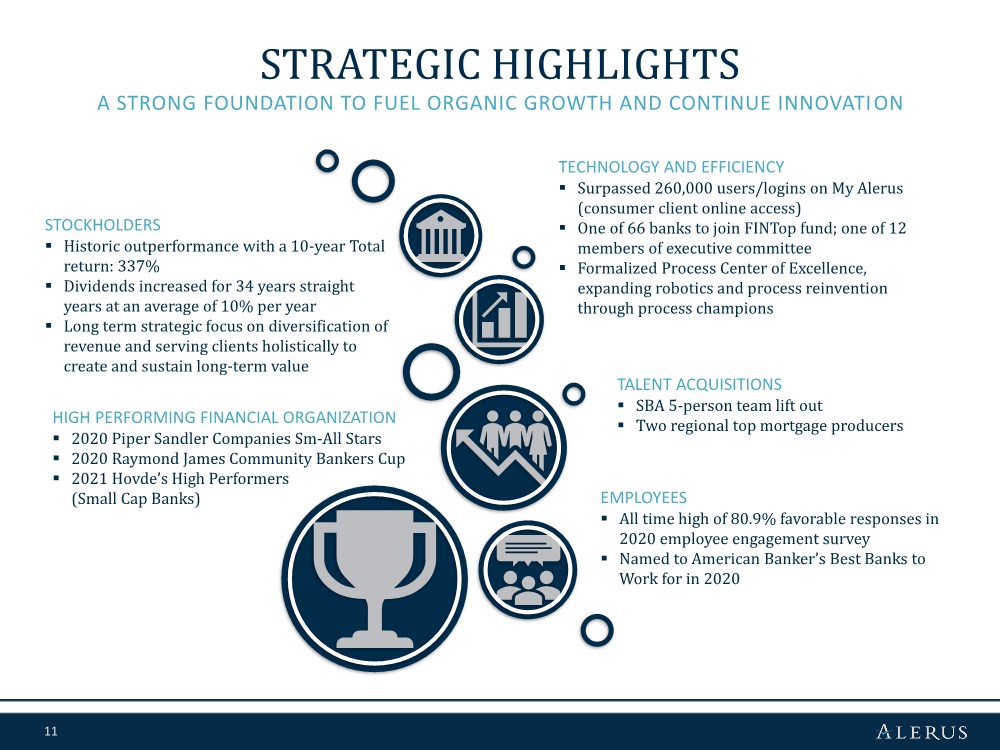
| 11 EMPLOYEES ▪ All time high of 80.9% favorable responses in 2020 employee engagement survey ▪ Named to American Banker’s Best Banks to Work for in 2020 STOCKHOLDERS ▪ Historic outperformance with a 10-year Total return: 337% ▪ Dividends increased for 34 years straight years at an average of 10% per year ▪ Long term strategic focus on diversification of revenue and serving clients holistically to create and sustain long-term value TALENT ACQUISITIONS ▪ SBA 5-person team lift out ▪ Two regional top mortgage producers HIGH PERFORMING FINANCIAL ORGANIZATION ▪ 2020 Piper Sandler Companies Sm-All Stars ▪ 2020 Raymond James Community Bankers Cup ▪ 2021 Hovde’s High Performers (Small Cap Banks) A STRONG FOUNDATION TO FUEL ORGANIC GROWTH AND CONTINUE INNOVATION STRATEGIC HIGHLIGHTS TECHNOLOGY AND EFFICIENCY ▪ Surpassed 260,000 users/logins on My Alerus (consumer client online access) ▪ One of 66 banks to join FINTop fund; one of 12 members of executive committee ▪ Formalized Process Center of Excellence, expanding robotics and process reinvention through process champions |
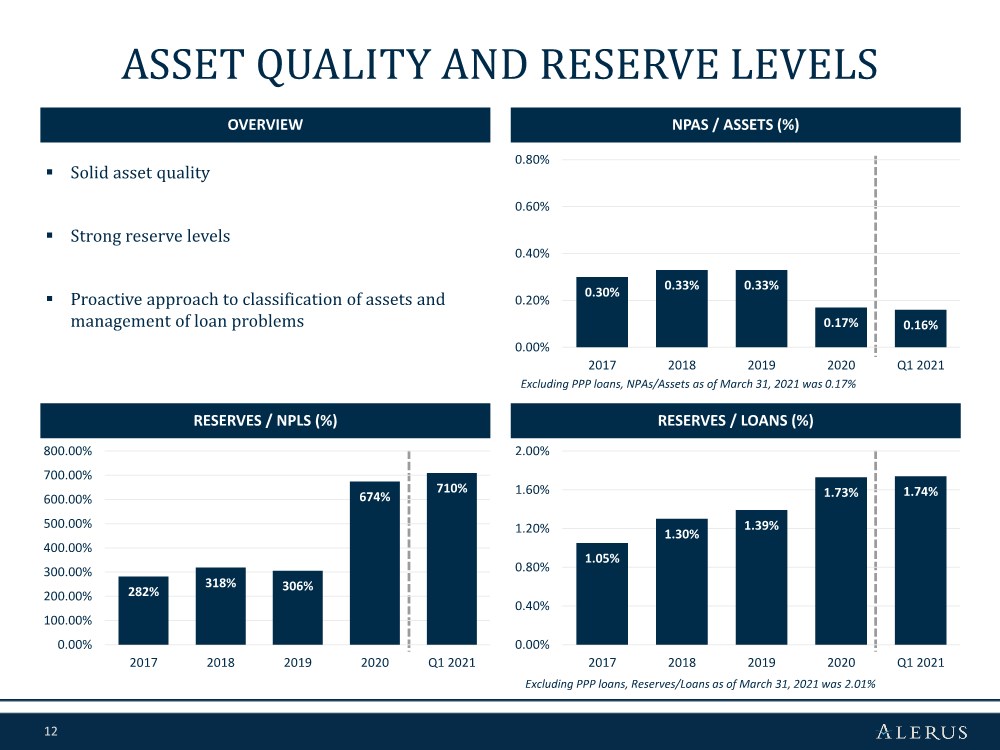
| 12 ASSET QUALITY AND RESERVE LEVELS OVERVIEW NPAS / ASSETS (%) RESERVES / LOANS (%) RESERVES / NPLS (%) ▪ Solid asset quality ▪ Strong reserve levels ▪ Proactive approach to classification of assets and management of loan problems Excluding PPP loans, NPAs/Assets as of March 31, 2021 was 0.17% Excluding PPP loans, Reserves/Loans as of March 31, 2021 was 2.01% 0.30% 0.33% 0.33% 0.17% 0.16% 0.00% 0.20% 0.40% 0.60% 0.80% 2017 2018 2019 2020 Q1 2021 1.05% 1.30% 1.39% 1.73% 1.74% 0.00% 0.40% 0.80% 1.20% 1.60% 2.00% 2017 2018 2019 2020 Q1 2021 282% 318% 306% 674% 710% 0.00% 100.00% 200.00% 300.00% 400.00% 500.00% 600.00% 700.00% 800.00% 2017 2018 2019 2020 Q1 2021 |
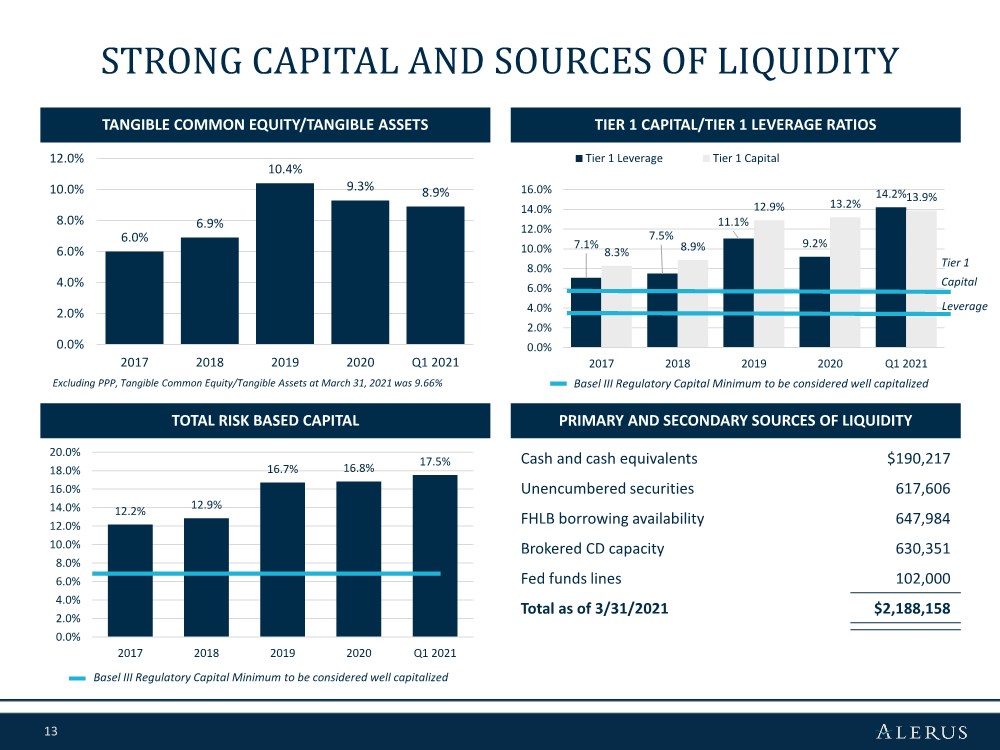
| 13 12.2% 12.9% 16.7% 16.8% 17.5% 0.0% 2.0% 4.0% 6.0% 8.0% 10.0% 12.0% 14.0% 16.0% 18.0% 20.0% 2017 2018 2019 2020 Q1 2021 7.1% 7.5% 11.1% 9.2% 14.2% 8.3% 8.9% 12.9% 13.2% 13.9% 0.0% 2.0% 4.0% 6.0% 8.0% 10.0% 12.0% 14.0% 16.0% 2017 2018 2019 2020 Q1 2021 Tier 1 Leverage Tier 1 Capital 6.0% 6.9% 10.4% 9.3% 8.9% 0.0% 2.0% 4.0% 6.0% 8.0% 10.0% 12.0% 2017 2018 2019 2020 Q1 2021 STRONG CAPITAL AND SOURCES OF LIQUIDITY TANGIBLE COMMON EQUITY/TANGIBLE ASSETS TIER 1 CAPITAL/TIER 1 LEVERAGE RATIOS PRIMARY AND SECONDARY SOURCES OF LIQUIDITY TOTAL RISK BASED CAPITAL Basel III Regulatory Capital Minimum to be considered well capitalized Cash and cash equivalents $190,217 Unencumbered securities 617,606 FHLB borrowing availability 647,984 Brokered CD capacity 630,351 Fed funds lines 102,000 Total as of 3/31/2021 $2,188,158 Tier 1 Capital Leverage Excluding PPP, Tangible Common Equity/Tangible Assets at March 31, 2021 was 9.66% Basel III Regulatory Capital Minimum to be considered well capitalized |
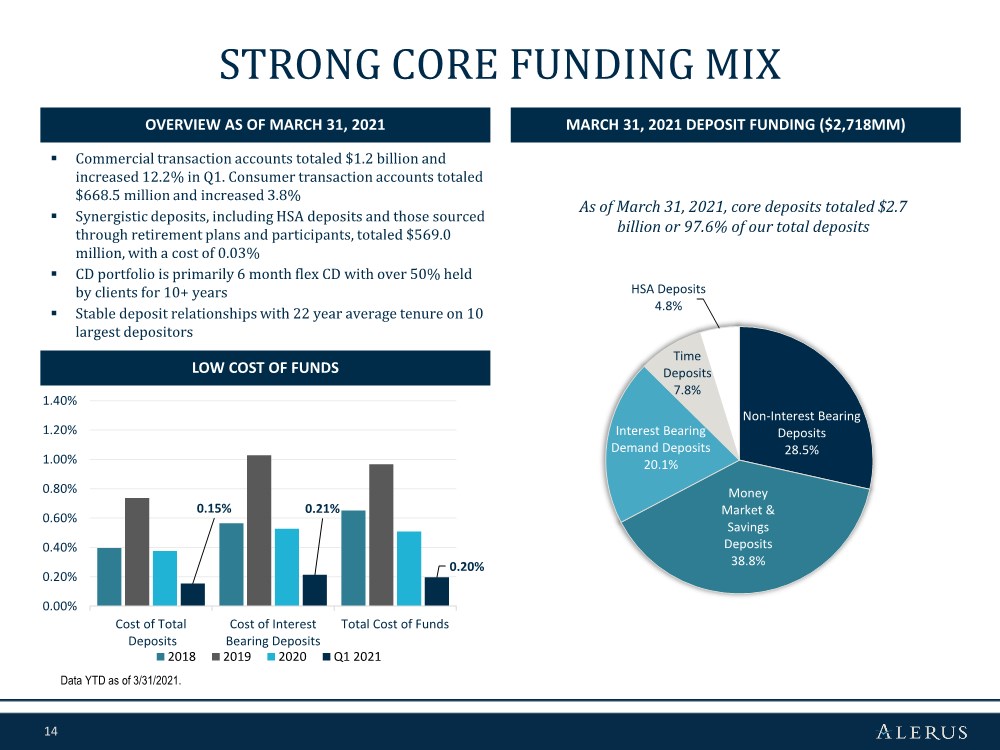
| 14 STRONG CORE FUNDING MIX ▪ Commercial transaction accounts totaled $1.2 billion and increased 12.2% in Q1. Consumer transaction accounts totaled $668.5 million and increased 3.8% ▪ Synergistic deposits, including HSA deposits and those sourced through retirement plans and participants, totaled $569.0 million, with a cost of 0.03% ▪ CD portfolio is primarily 6 month flex CD with over 50% held by clients for 10+ years ▪ Stable deposit relationships with 22 year average tenure on 10 largest depositors As of March 31, 2021, core deposits totaled $2.7 billion or 97.6% of our total deposits OVERVIEW AS OF MARCH 31, 2021 MARCH 31, 2021 DEPOSIT FUNDING ($2,718MM) LOW COST OF FUNDS Data YTD as of 3/31/2021. Non-Interest Bearing Deposits 28.5% Money Market & Savings Deposits 38.8% Interest Bearing Demand Deposits 20.1% Time Deposits 7.8% HSA Deposits 4.8% 0.15% 0.21% 0.20% 0.00% 0.20% 0.40% 0.60% 0.80% 1.00% 1.20% 1.40% Cost of Total Deposits Cost of Interest Bearing Deposits Total Cost of Funds 2018 2019 2020 Q1 2021 |
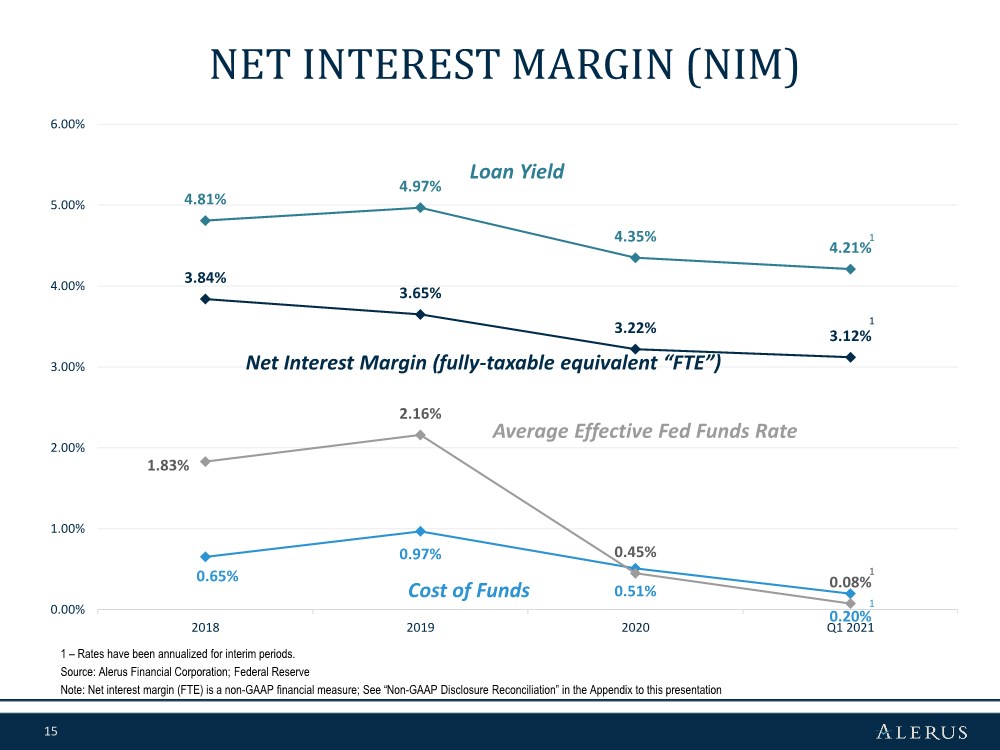
| 15 0.65% 0.97% 0.51% 0.20% 1.83% 2.16% 0.45% 0.08% 3.84% 3.65% 3.22% 3.12% 4.81% 4.97% 4.35% 4.21% 0.00% 1.00% 2.00% 3.00% 4.00% 5.00% 6.00% 2018 2019 2020 Q1 2021 NET INTEREST MARGIN (NIM) 1 – Rates have been annualized for interim periods. Source: Alerus Financial Corporation; Federal Reserve Note: Net interest margin (FTE) is a non-GAAP financial measure; See “Non-GAAP Disclosure Reconciliation” in the Appendix to this presentation Loan Yield Net Interest Margin (fully-taxable equivalent “FTE”) Average Effective Fed Funds Rate Cost of Funds 1 1 1 1 |
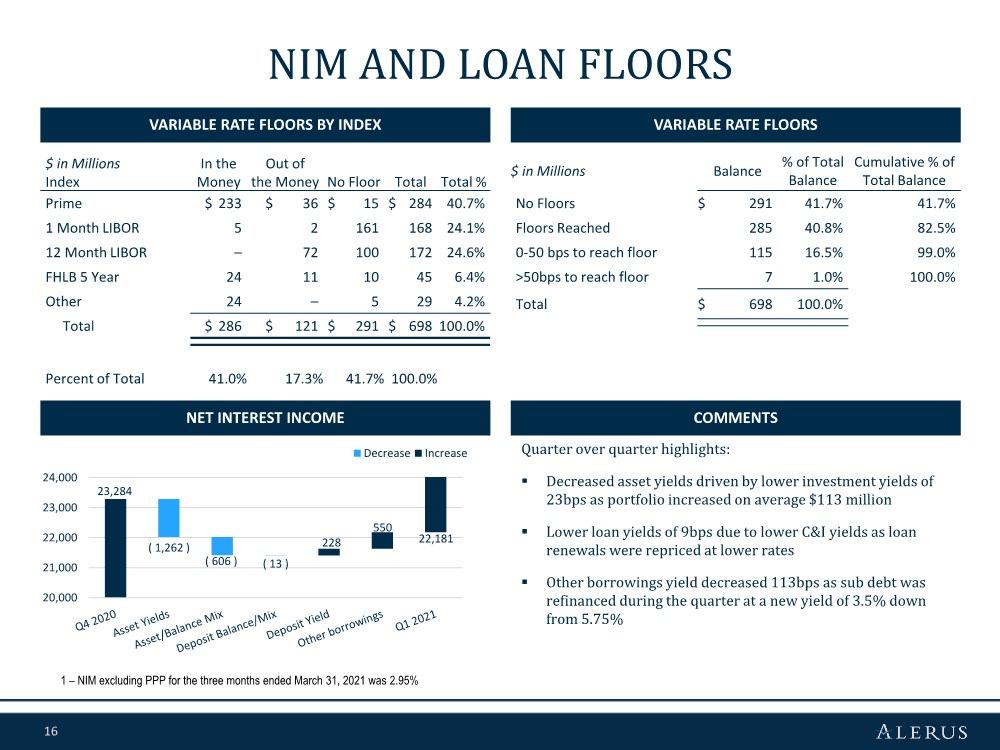
| 16 22,181 ( 1,262 ) ( 606 )( 13 ) 23,284 228 550 20,000 21,000 22,000 23,000 24,000 Decrease Increase NIM AND LOAN FLOORS VARIABLE RATE FLOORS BY INDEX VARIABLE RATE FLOORS COMMENTS $ in Millions Balance % of Total Balance Cumulative % of Total Balance No Floors $ 291 41.7% 41.7% Floors Reached 285 40.8% 82.5% 0-50 bps to reach floor 115 16.5% 99.0% >50bps to reach floor 7 1.0% 100.0% Total $ 698 100.0% Quarter over quarter highlights: ▪ Decreased asset yields driven by lower investment yields of 23bps as portfolio increased on average $113 million ▪ Lower loan yields of 9bps due to lower C&I yields as loan renewals were repriced at lower rates ▪ Other borrowings yield decreased 113bps as sub debt was refinanced during the quarter at a new yield of 3.5% down from 5.75% $ in Millions Index In the Money Out of the Money No Floor Total Total % Prime $ 233 $ 36 $ 15 $ 284 40.7% 1 Month LIBOR 5 2 161 168 24.1% 12 Month LIBOR – 72 100 172 24.6% FHLB 5 Year 24 11 10 45 6.4% Other 24 – 5 29 4.2% Total $ 286 $ 121 $ 291 $ 698 100.0% Percent of Total 41.0% 17.3% 41.7% 100.0% 1 – NIM excluding PPP for the three months ended March 31, 2021 was 2.95% NET INTEREST INCOME |
| 17 DIVERSIFIED |

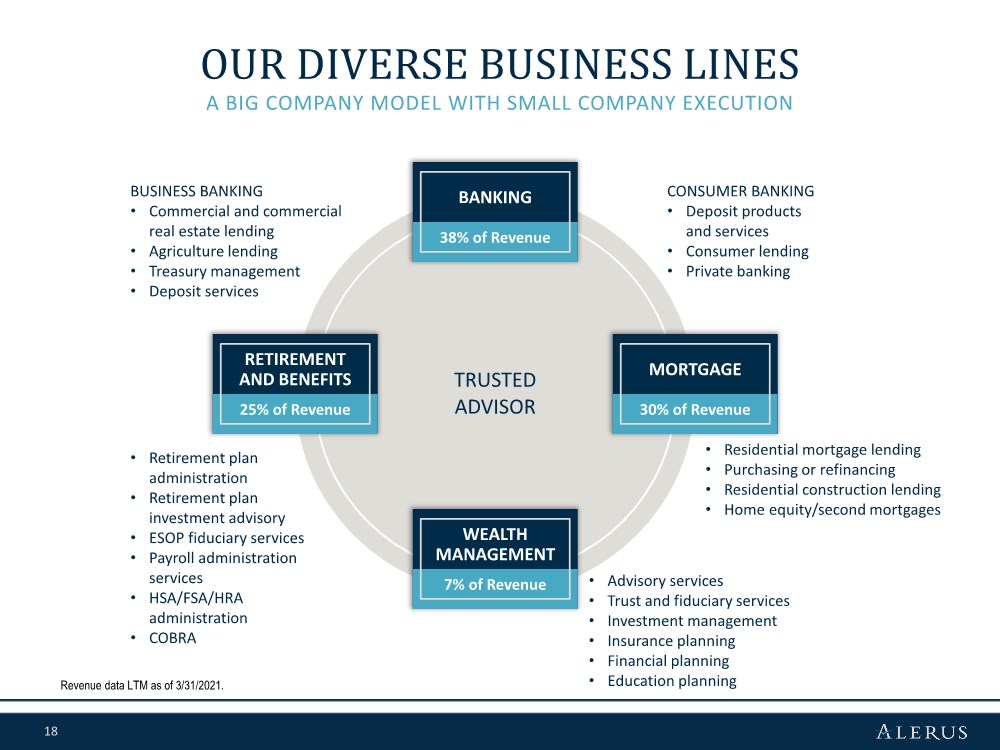
| 18 A BIG COMPANY MODEL WITH SMALL COMPANY EXECUTION OUR DIVERSE BUSINESS LINES Revenue data LTM as of 3/31/2021. TRUSTED ADVISOR BANKING WEALTH MANAGEMENT • Residential mortgage lending • Purchasing or refinancing • Residential construction lending • Home equity/second mortgages • Advisory services • Trust and fiduciary services • Investment management • Insurance planning • Financial planning • Education planning • Retirement plan administration • Retirement plan investment advisory • ESOP fiduciary services • Payroll administration services • HSA/FSA/HRA administration • COBRA BUSINESS BANKING • Commercial and commercial real estate lending • Agriculture lending • Treasury management • Deposit services CONSUMER BANKING • Deposit products and services • Consumer lending • Private banking MORTGAGE RETIREMENT AND BENEFITS 25% of Revenue 30% of Revenue 7% of Revenue 38% of Revenue |
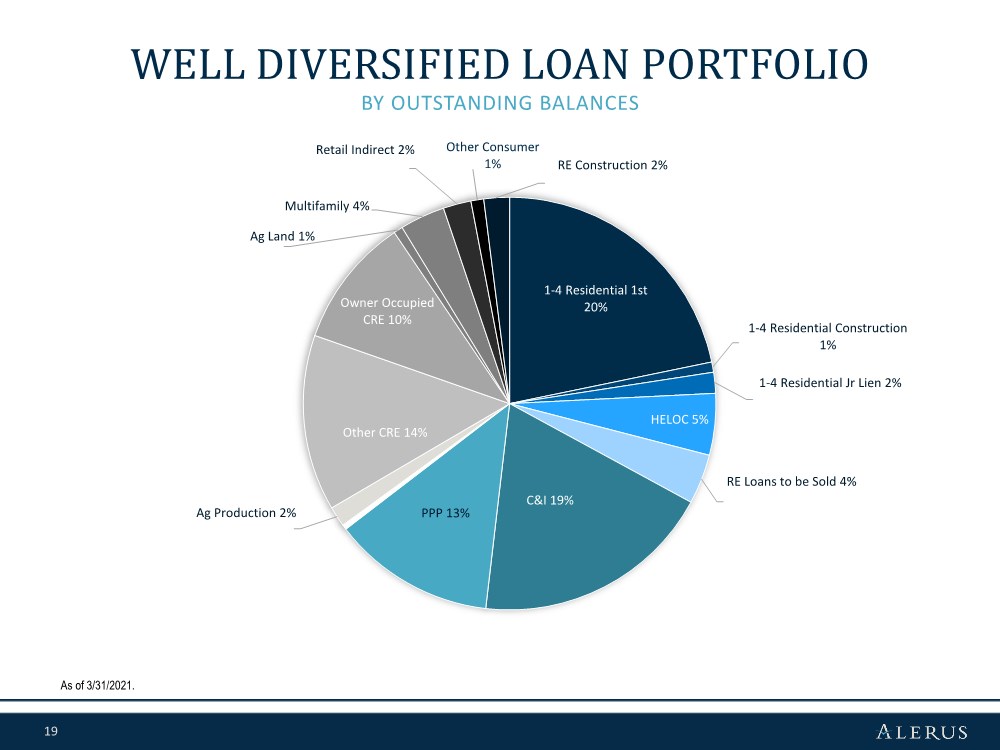
| 19 BY OUTSTANDING BALANCES WELL DIVERSIFIED LOAN PORTFOLIO As of 3/31/2021. 1-4 Residential 1st 20% 1-4 Residential Construction 1% 1-4 Residential Jr Lien 2% HELOC 5% RE Loans to be Sold 4% C&I 19% PPP 13% Ag Production 2% Other CRE 14% Owner Occupied CRE 10% Ag Land 1% Multifamily 4% Retail Indirect 2% Other Consumer 1% RE Construction 2% |
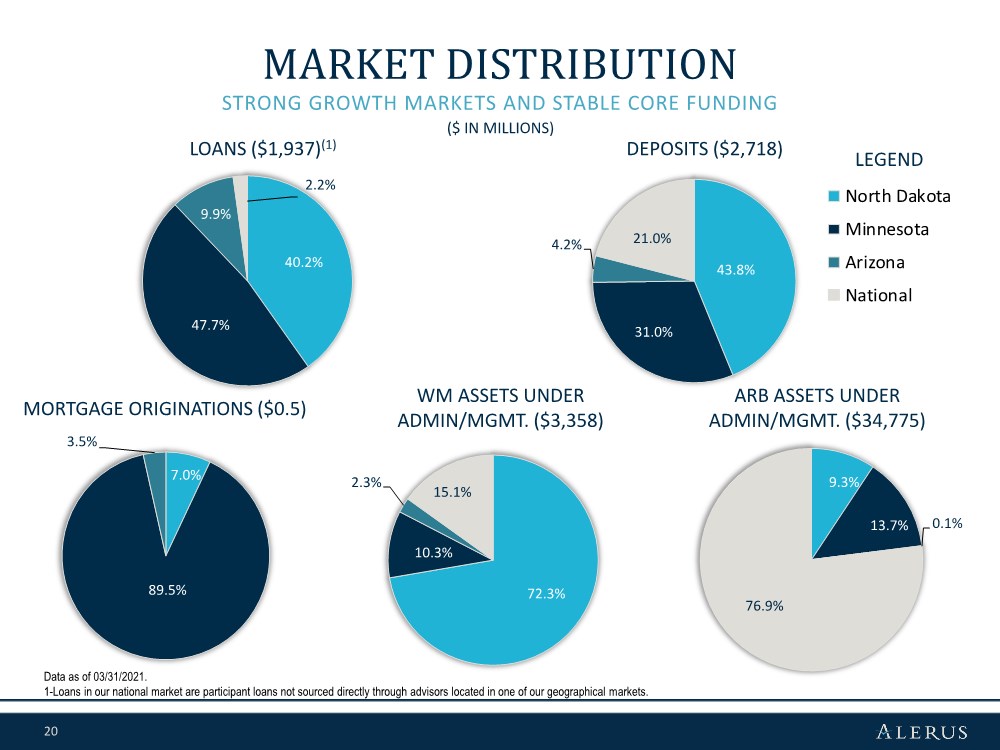
| 20 North Dakota Minnesota Arizona National STRONG GROWTH MARKETS AND STABLE CORE FUNDING MARKET DISTRIBUTION DEPOSITS ($2,718) LOANS ($1,937)(1) ARB ASSETS UNDER ADMIN/MGMT. ($34,775) WM ASSETS UNDER ADMIN/MGMT. ($3,358) MORTGAGE ORIGINATIONS ($0.5) ($ IN MILLIONS) Data as of 03/31/2021. 1-Loans in our national market are participant loans not sourced directly through advisors located in one of our geographical markets. LEGEND 7.0% 89.5% 3.5% 9.3% 13.7% 0.1% 76.9% 72.3% 10.3% 2.3% 15.1% 40.2% 47.7% 9.9% 2.2% 43.8% 31.0% 4.2% 21.0% |
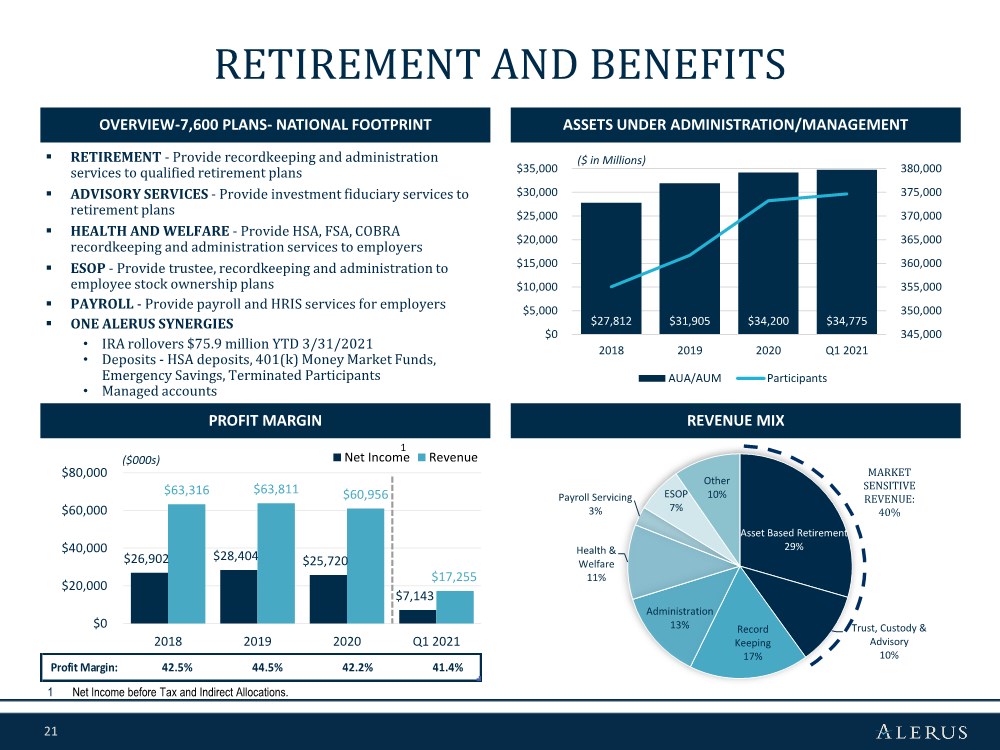
| 21 Asset Based Retirement 29% Trust, Custody & Advisory 10% Record Keeping 17% Administration 13% Health & Welfare 11% Payroll Servicing 3% ESOP 7% Other 10% $26,902 $28,404 $25,720 $7,143 $63,316 $63,811 $60,956 $17,255 $0 $20,000 $40,000 $60,000 $80,000 2018 2019 2020 Q1 2021 Net Income Revenue $27,812 $31,905 $34,200 $34,775 345,000 350,000 355,000 360,000 365,000 370,000 375,000 380,000 $0 $5,000 $10,000 $15,000 $20,000 $25,000 $30,000 $35,000 2018 2019 2020 Q1 2021 AUA/AUM Participants RETIREMENT AND BENEFITS OVERVIEW-7,600 PLANS- NATIONAL FOOTPRINT ASSETS UNDER ADMINISTRATION/MANAGEMENT PROFIT MARGIN REVENUE MIX MARKET SENSITIVE REVENUE: 40% 1 1 Net Income before Tax and Indirect Allocations. ▪ RETIREMENT - Provide recordkeeping and administration services to qualified retirement plans ▪ ADVISORY SERVICES - Provide investment fiduciary services to retirement plans ▪ HEALTH AND WELFARE - Provide HSA, FSA, COBRA recordkeeping and administration services to employers ▪ ESOP - Provide trustee, recordkeeping and administration to employee stock ownership plans ▪ PAYROLL - Provide payroll and HRIS services for employers ▪ ONE ALERUS SYNERGIES • IRA rollovers $75.9 million YTD 3/31/2021 • Deposits - HSA deposits, 401(k) Money Market Funds, Emergency Savings, Terminated Participants • Managed accounts ($ in Millions) ($000s) Profit Margin: 42.5% 44.5% 42.2% 41.4% |
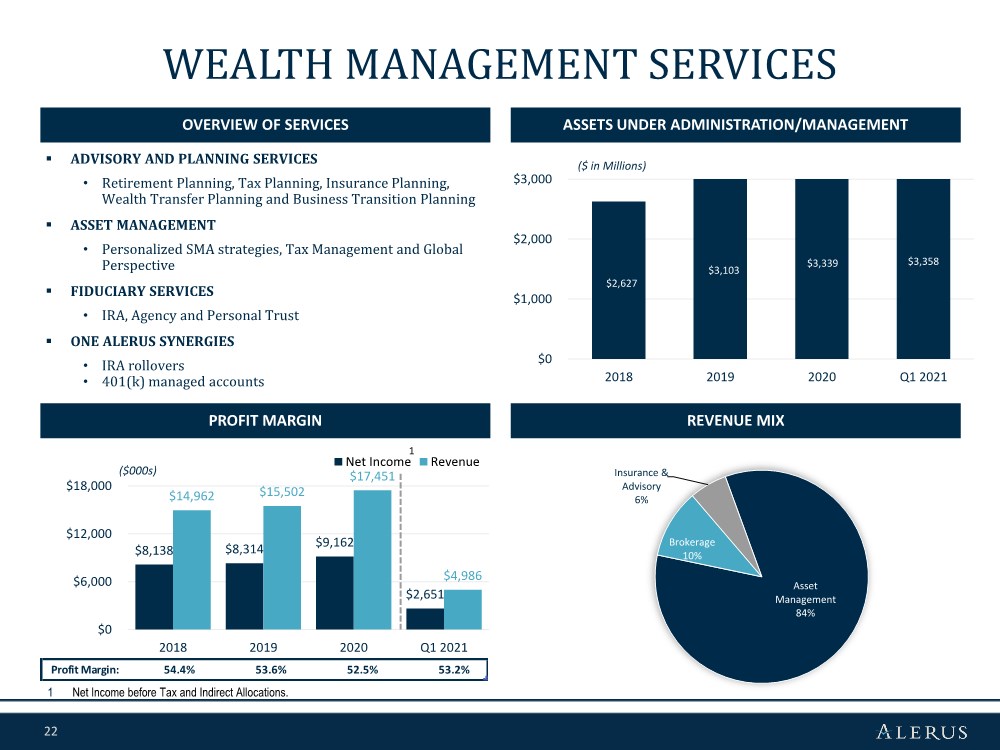
| 22 Profit Margin: 54.4% 53.6% 52.5% 53.2% $8,138 $8,314 $9,162 $2,651 $14,962 $15,502 $17,451 $4,986 $0 $6,000 $12,000 $18,000 2018 2019 2020 Q1 2021 Net Income Revenue WEALTH MANAGEMENT SERVICES OVERVIEW OF SERVICES ASSETS UNDER ADMINISTRATION/MANAGEMENT PROFIT MARGIN REVENUE MIX 1 Net Income before Tax and Indirect Allocations. ▪ ADVISORY AND PLANNING SERVICES • Retirement Planning, Tax Planning, Insurance Planning, Wealth Transfer Planning and Business Transition Planning ▪ ASSET MANAGEMENT • Personalized SMA strategies, Tax Management and Global Perspective ▪ FIDUCIARY SERVICES • IRA, Agency and Personal Trust ▪ ONE ALERUS SYNERGIES • IRA rollovers • 401(k) managed accounts 1 ($ in Millions) ($000s) $2,627 $3,103 $3,339 $3,358 $0 $1,000 $2,000 $3,000 2018 2019 2020 Q1 2021 Asset Management 84% Brokerage 10% Insurance & Advisory 6% |
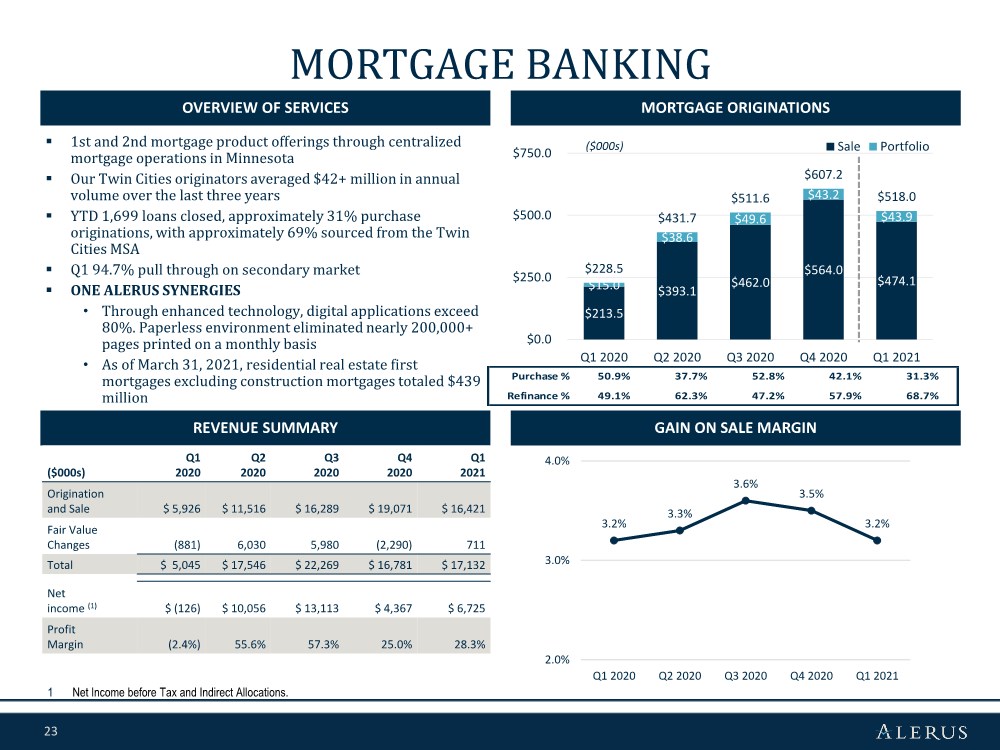
| 23 $213.5 $393.1 $462.0 $564.0 $474.1 $15.0 $38.6 $49.6 $43.2 $43.9 $228.5 $431.7 $511.6 $607.2 $518.0 $0.0 $250.0 $500.0 $750.0 Q1 2020 Q2 2020 Q3 2020 Q4 2020 Q1 2021 Sale Portfolio MORTGAGE BANKING OVERVIEW OF SERVICES MORTGAGE ORIGINATIONS GAIN ON SALE MARGIN ($000s) REVENUE SUMMARY ▪ 1st and 2nd mortgage product offerings through centralized mortgage operations in Minnesota ▪ Our Twin Cities originators averaged $42+ million in annual volume over the last three years ▪ YTD 1,699 loans closed, approximately 31% purchase originations, with approximately 69% sourced from the Twin Cities MSA ▪ Q1 94.7% pull through on secondary market ▪ ONE ALERUS SYNERGIES • Through enhanced technology, digital applications exceed 80%. Paperless environment eliminated nearly 200,000+ pages printed on a monthly basis • As of March 31, 2021, residential real estate first mortgages excluding construction mortgages totaled $439 million 1 Net Income before Tax and Indirect Allocations. ($000s) Q1 2020 Q2 2020 Q3 2020 Q4 2020 Q1 2021 Origination and Sale $ 5,926 $ 11,516 $ 16,289 $ 19,071 $ 16,421 Fair Value Changes (881) 6,030 5,980 (2,290) 711 Total $ 5,045 $ 17,546 $ 22,269 $ 16,781 $ 17,132 Net income (1) $ (126) $ 10,056 $ 13,113 $ 4,367 $ 6,725 Profit Margin (2.4%) 55.6% 57.3% 25.0% 28.3% 3.2% 3.3% 3.6% 3.5% 3.2% 2.0% 3.0% 4.0% Q1 2020 Q2 2020 Q3 2020 Q4 2020 Q1 2021 Purchase % 50.9% 37.7% 52.8% 42.1% 31.3% Refinance % 49.1% 62.3% 47.2% 57.9% 68.7% |
| 24 LOAN PORTFOLIO AND CREDIT QUALITY |

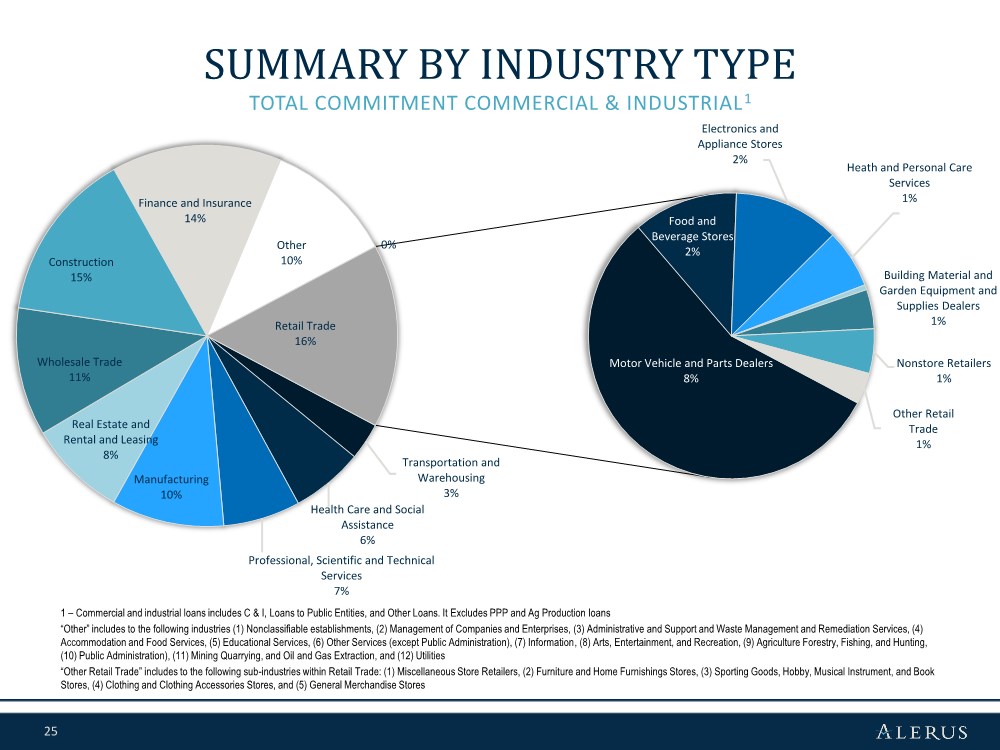
| 25 Transportation and Warehousing 3% Health Care and Social Assistance 6% Professional, Scientific and Technical Services 7% Manufacturing 10% Real Estate and Rental and Leasing 8% Wholesale Trade 11% Construction 15% Finance and Insurance 14% Other 10% 0% Motor Vehicle and Parts Dealers 8% Food and Beverage Stores 2% Electronics and Appliance Stores 2% Heath and Personal Care Services 1% Building Material and Garden Equipment and Supplies Dealers 1% Nonstore Retailers 1% Other Retail Trade 1% Retail Trade 16% SUMMARY BY INDUSTRY TYPE TOTAL COMMITMENT COMMERCIAL & INDUSTRIAL1 1 – Commercial and industrial loans includes C & I, Loans to Public Entities, and Other Loans. It Excludes PPP and Ag Production loans “Other” includes to the following industries (1) Nonclassifiable establishments, (2) Management of Companies and Enterprises, (3) Administrative and Support and Waste Management and Remediation Services, (4) Accommodation and Food Services, (5) Educational Services, (6) Other Services (except Public Administration), (7) Information, (8) Arts, Entertainment, and Recreation, (9) Agriculture Forestry, Fishing, and Hunting, (10) Public Administration), (11) Mining Quarrying, and Oil and Gas Extraction, and (12) Utilities “Other Retail Trade” includes to the following sub-industries within Retail Trade: (1) Miscellaneous Store Retailers, (2) Furniture and Home Furnishings Stores, (3) Sporting Goods, Hobby, Musical Instrument, and Book Stores, (4) Clothing and Clothing Accessories Stores, and (5) General Merchandise Stores |
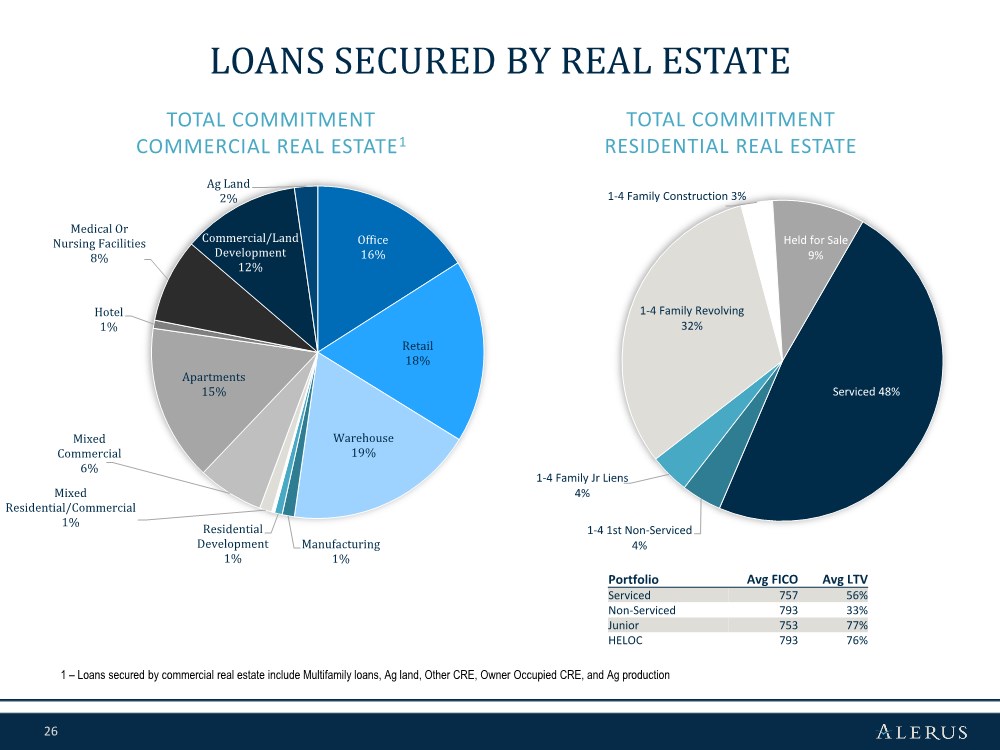
| 26 Office 16% Retail 18% Warehouse 19% Manufacturing 1% Residential Development 1% Mixed Residential/Commercial 1% Mixed Commercial 6% Apartments 15% Hotel 1% Medical Or Nursing Facilities 8% Commercial/Land Development 12% Ag Land 2% LOANS SECURED BY REAL ESTATE TOTAL COMMITMENT COMMERCIAL REAL ESTATE1 1 – Loans secured by commercial real estate include Multifamily loans, Ag land, Other CRE, Owner Occupied CRE, and Ag production Portfolio Avg FICO Avg LTV Serviced 757 56% Non-Serviced 793 33% Junior 753 77% HELOC 793 76% TOTAL COMMITMENT RESIDENTIAL REAL ESTATE Serviced 48% 1-4 1st Non-Serviced 4% 1-4 Family Jr Liens 4% 1-4 Family Revolving 32% 1-4 Family Construction 3% Held for Sale 9% |
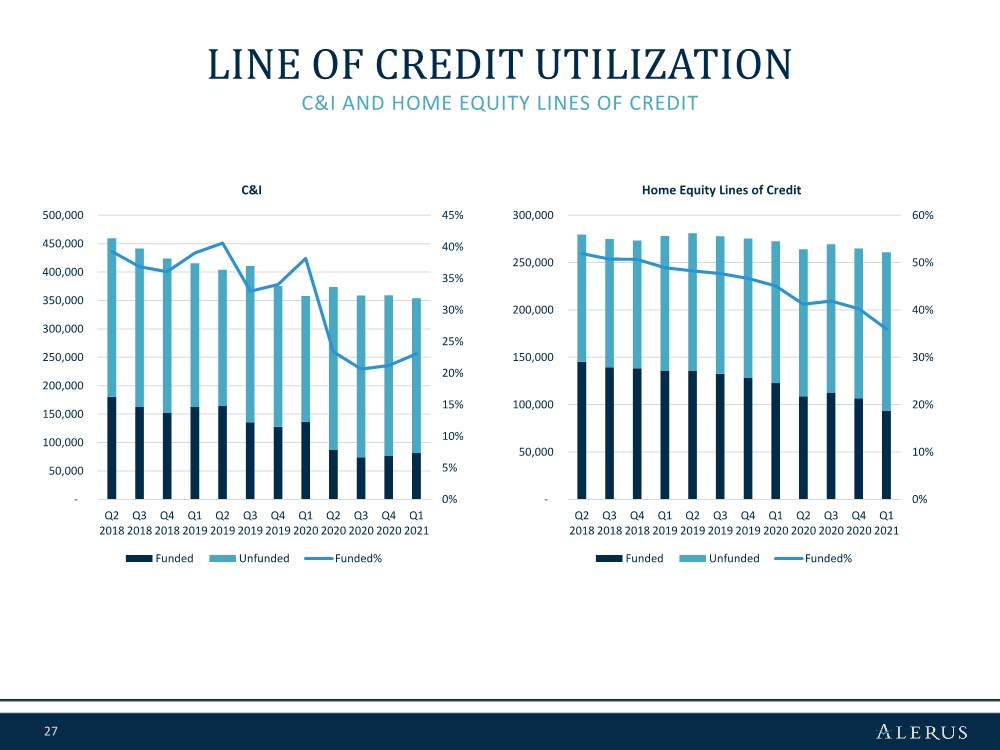
| 27 LINE OF CREDIT UTILIZATION C&I AND HOME EQUITY LINES OF CREDIT 0% 5% 10% 15% 20% 25% 30% 35% 40% 45% - 50,000 100,000 150,000 200,000 250,000 300,000 350,000 400,000 450,000 500,000 Q2 2018 Q3 2018 Q4 2018 Q1 2019 Q2 2019 Q3 2019 Q4 2019 Q1 2020 Q2 2020 Q3 2020 Q4 2020 Q1 2021 C&I Funded Unfunded Funded% 0% 10% 20% 30% 40% 50% 60% - 50,000 100,000 150,000 200,000 250,000 300,000 Q2 2018 Q3 2018 Q4 2018 Q1 2019 Q2 2019 Q3 2019 Q4 2019 Q1 2020 Q2 2020 Q3 2020 Q4 2020 Q1 2021 Home Equity Lines of Credit Funded Unfunded Funded% |
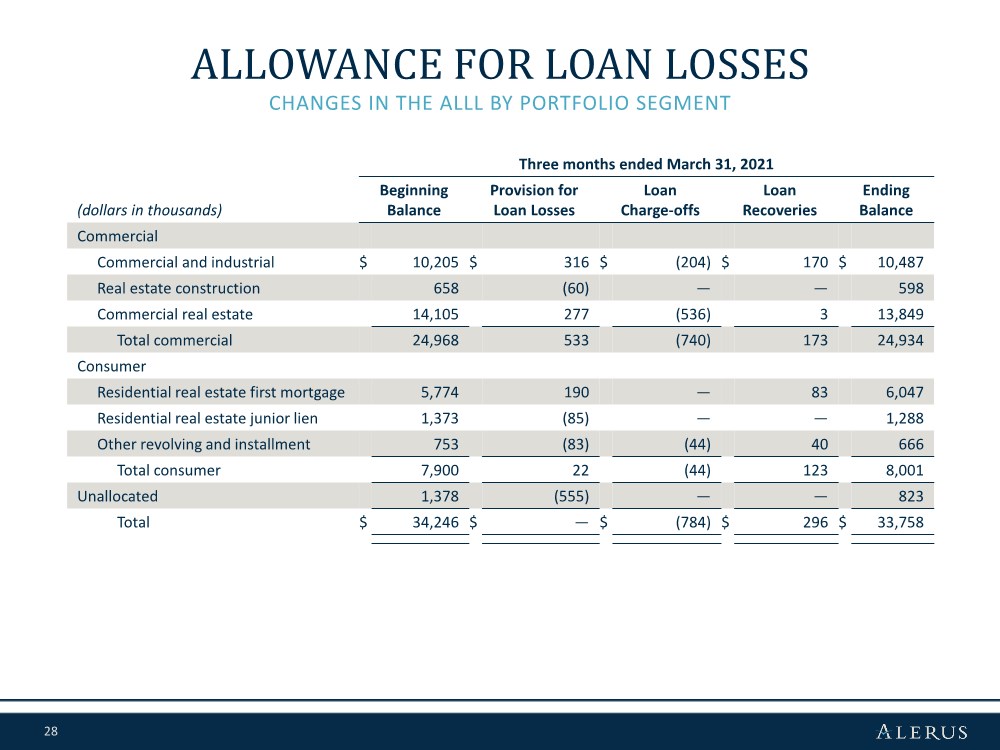
| 28 CHANGES IN THE ALLL BY PORTFOLIO SEGMENT ALLOWANCE FOR LOAN LOSSES Three months ended March 31, 2021 (dollars in thousands) Beginning Balance Provision for Loan Losses Loan Charge-offs Loan Recoveries Ending Balance Commercial Commercial and industrial $ 10,205 $ 316 $ (204) $ 170 $ 10,487 Real estate construction 658 (60) —— 598 Commercial real estate 14,105 277 (536) 3 13,849 Total commercial 24,968 533 (740) 173 24,934 Consumer Residential real estate first mortgage 5,774 190 — 83 6,047 Residential real estate junior lien 1,373 (85) —— 1,288 Other revolving and installment 753 (83) (44) 40 666 Total consumer 7,900 22 (44) 123 8,001 Unallocated 1,378 (555) —— 823 Total $ 34,246 $ — $ (784) $ 296 $ 33,758 |
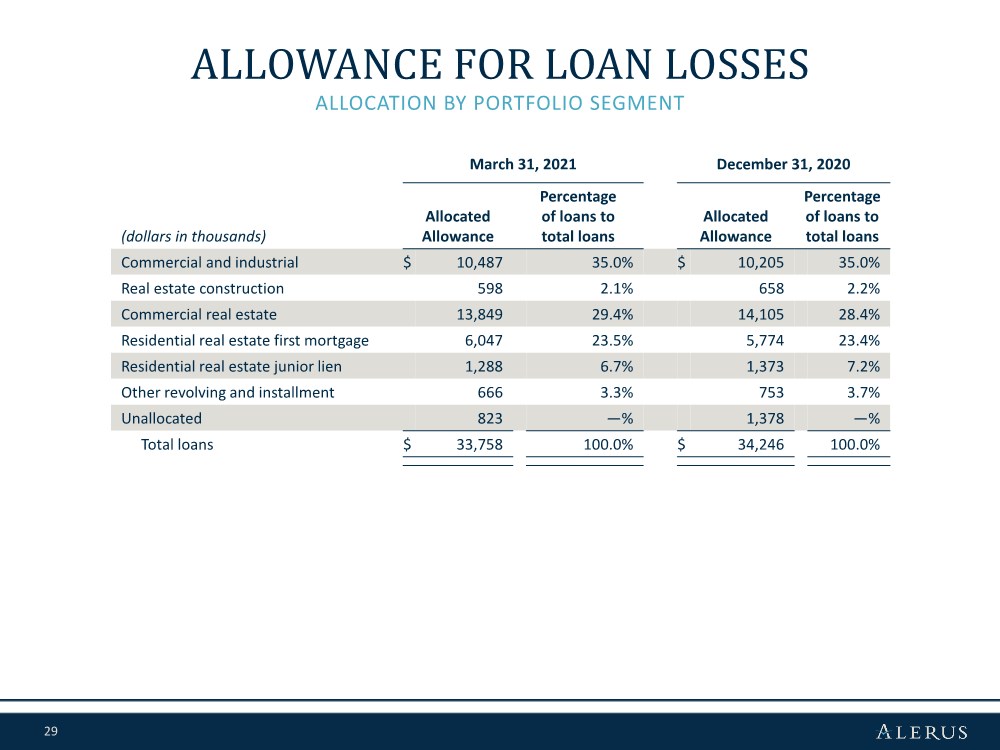
| 29 ALLOCATION BY PORTFOLIO SEGMENT ALLOWANCE FOR LOAN LOSSES March 31, 2021 December 31, 2020 (dollars in thousands) Allocated Allowance Percentage of loans to total loans Allocated Allowance Percentage of loans to total loans Commercial and industrial $ 10,487 35.0% $ 10,205 35.0% Real estate construction 598 2.1% 658 2.2% Commercial real estate 13,849 29.4% 14,105 28.4% Residential real estate first mortgage 6,047 23.5% 5,774 23.4% Residential real estate junior lien 1,288 6.7% 1,373 7.2% Other revolving and installment 666 3.3% 753 3.7% Unallocated 823 —% 1,378 —% Total loans $ 33,758 100.0% $ 34,246 100.0% |
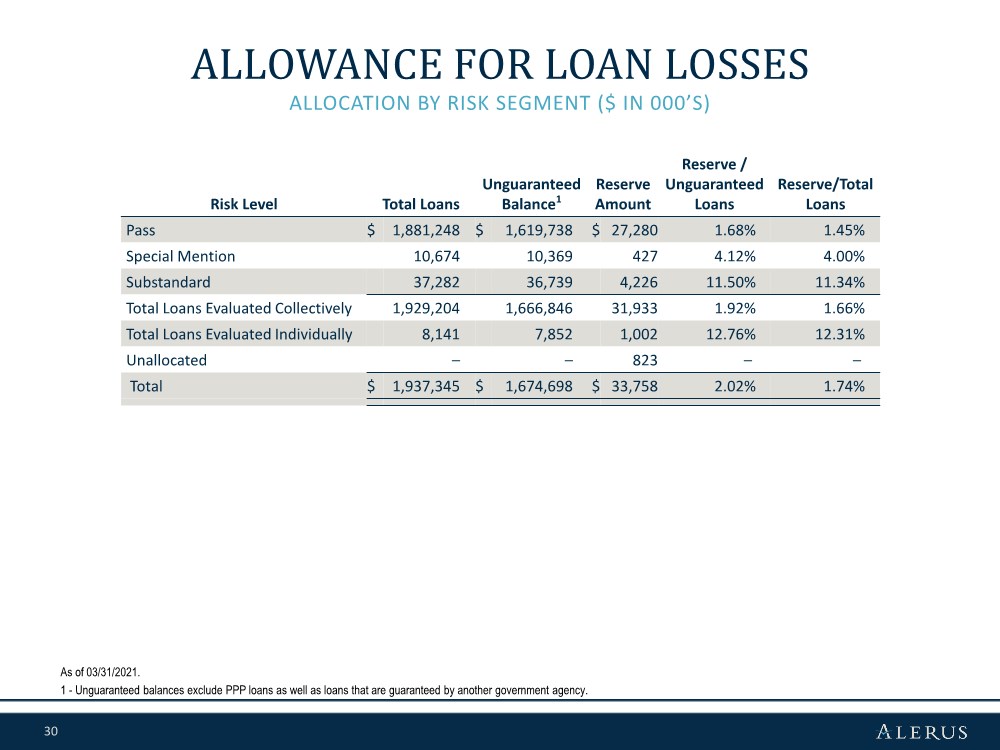
| 30 Risk Level Total Loans Unguaranteed Balance1 Reserve Amount Reserve / Unguaranteed Loans Reserve/Total Loans Pass $ 1,881,248 $ 1,619,738 $ 27,280 1.68% 1.45% Special Mention 10,674 10,369 427 4.12% 4.00% Substandard 37,282 36,739 4,226 11.50% 11.34% Total Loans Evaluated Collectively 1,929,204 1,666,846 31,933 1.92% 1.66% Total Loans Evaluated Individually 8,141 7,852 1,002 12.76% 12.31% Unallocated –– 823 –– Total $ 1,937,345 $ 1,674,698 $ 33,758 2.02% 1.74% ALLOCATION BY RISK SEGMENT ($ IN 000’S) ALLOWANCE FOR LOAN LOSSES As of 03/31/2021. 1 - Unguaranteed balances exclude PPP loans as well as loans that are guaranteed by another government agency. |
| 31 COVID-19 RESPONSE |

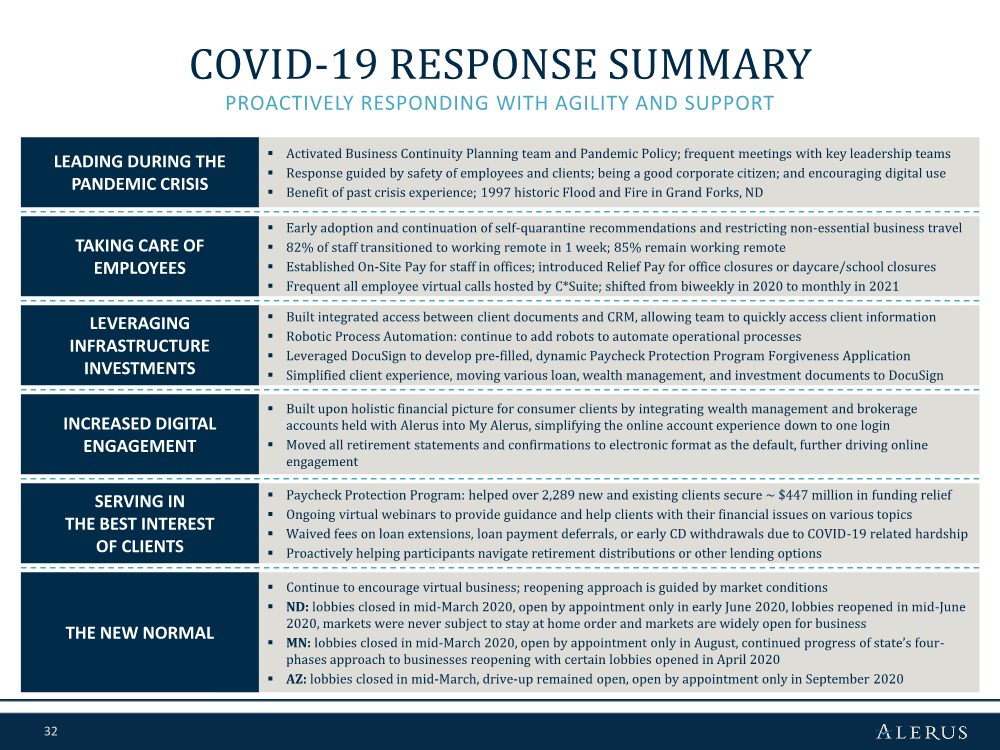
| 32 ▪ Activated Business Continuity Planning team and Pandemic Policy; frequent meetings with key leadership teams ▪ Response guided by safety of employees and clients; being a good corporate citizen; and encouraging digital use ▪ Benefit of past crisis experience; 1997 historic Flood and Fire in Grand Forks, ND ▪ Early adoption and continuation of self-quarantine recommendations and restricting non-essential business travel ▪ 82% of staff transitioned to working remote in 1 week; 85% remain working remote ▪ Established On-Site Pay for staff in offices; introduced Relief Pay for office closures or daycare/school closures ▪ Frequent all employee virtual calls hosted by C*Suite; shifted from biweekly in 2020 to monthly in 2021 ▪ Built integrated access between client documents and CRM, allowing team to quickly access client information ▪ Robotic Process Automation: continue to add robots to automate operational processes ▪ Leveraged DocuSign to develop pre-filled, dynamic Paycheck Protection Program Forgiveness Application ▪ Simplified client experience, moving various loan, wealth management, and investment documents to DocuSign ▪ Built upon holistic financial picture for consumer clients by integrating wealth management and brokerage accounts held with Alerus into My Alerus, simplifying the online account experience down to one login ▪ Moved all retirement statements and confirmations to electronic format as the default, further driving online engagement ▪ Paycheck Protection Program: helped over 2,289 new and existing clients secure ~ $447 million in funding relief ▪ Ongoing virtual webinars to provide guidance and help clients with their financial issues on various topics ▪ Waived fees on loan extensions, loan payment deferrals, or early CD withdrawals due to COVID-19 related hardship ▪ Proactively helping participants navigate retirement distributions or other lending options ▪ Continue to encourage virtual business; reopening approach is guided by market conditions ▪ ND: lobbies closed in mid-March 2020, open by appointment only in early June 2020, lobbies reopened in mid-June 2020, markets were never subject to stay at home order and markets are widely open for business ▪ MN: lobbies closed in mid-March 2020, open by appointment only in August, continued progress of state’s four- phases approach to businesses reopening with certain lobbies opened in April 2020 ▪ AZ: lobbies closed in mid-March, drive-up remained open, open by appointment only in September 2020 COVID-19 RESPONSE SUMMARY PROACTIVELY RESPONDING WITH AGILITY AND SUPPORT LEADING DURING THE PANDEMIC CRISIS TAKING CARE OF EMPLOYEES LEVERAGING INFRASTRUCTURE INVESTMENTS INCREASED DIGITAL ENGAGEMENT SERVING IN THE BEST INTEREST OF CLIENTS THE NEW NORMAL |
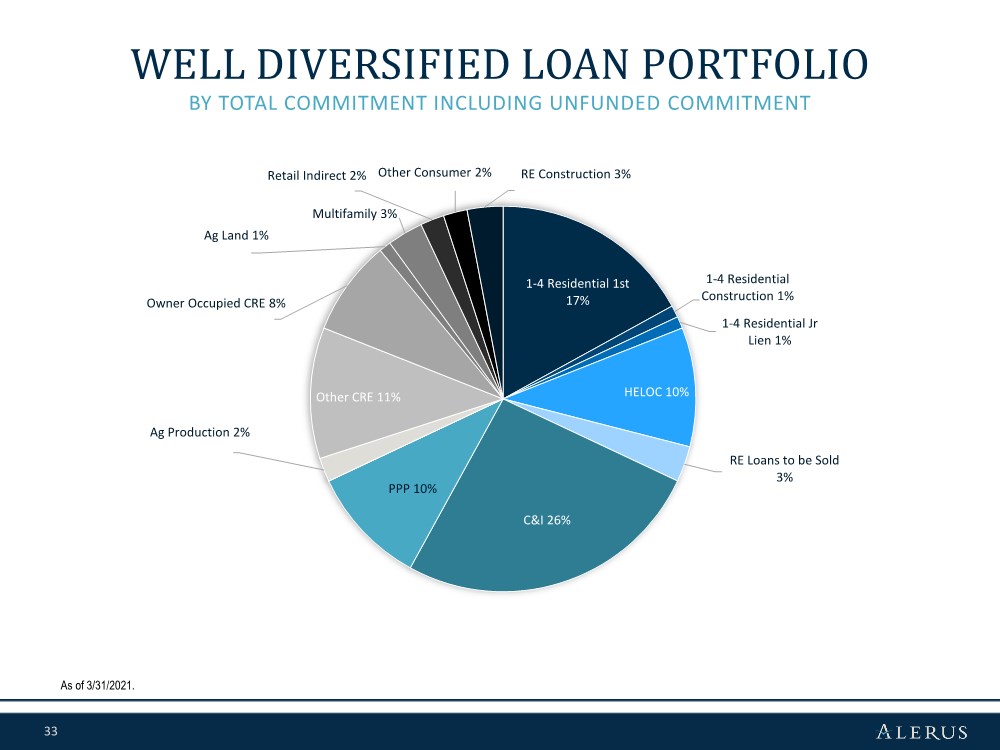
| 33 BY TOTAL COMMITMENT INCLUDING UNFUNDED COMMITMENT WELL DIVERSIFIED LOAN PORTFOLIO As of 3/31/2021. 1-4 Residential 1st 17% 1-4 Residential Construction 1% 1-4 Residential Jr Lien 1% HELOC 10% RE Loans to be Sold 3% C&I 26% PPP 10% Ag Production 2% Other CRE 11% Owner Occupied CRE 8% Ag Land 1% Multifamily 3% Retail Indirect 2% Other Consumer 2% RE Construction 3% |
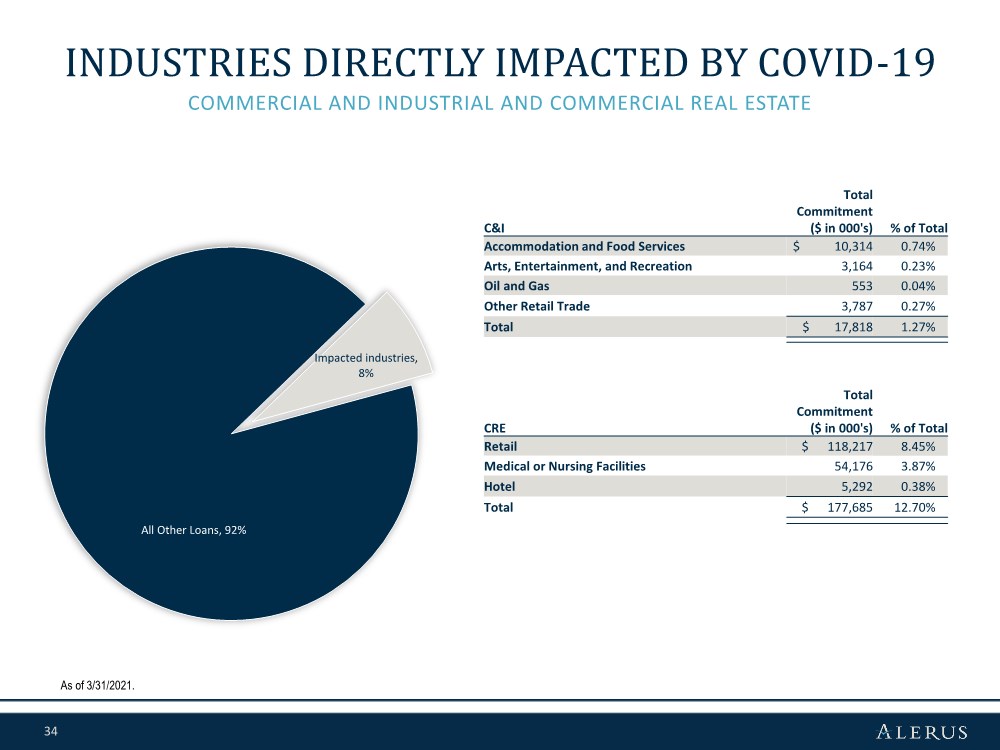
| 34 Impacted industries, 8% All Other Loans, 92% COMMERCIAL AND INDUSTRIAL AND COMMERCIAL REAL ESTATE INDUSTRIES DIRECTLY IMPACTED BY COVID-19 As of 3/31/2021. C&I Total Commitment ($ in 000's) % of Total Accommodation and Food Services $ 10,314 0.74% Arts, Entertainment, and Recreation 3,164 0.23% Oil and Gas 553 0.04% Other Retail Trade 3,787 0.27% Total $ 17,818 1.27% CRE Total Commitment ($ in 000's) % of Total Retail $ 118,217 8.45% Medical or Nursing Facilities 54,176 3.87% Hotel 5,292 0.38% Total $ 177,685 12.70% |
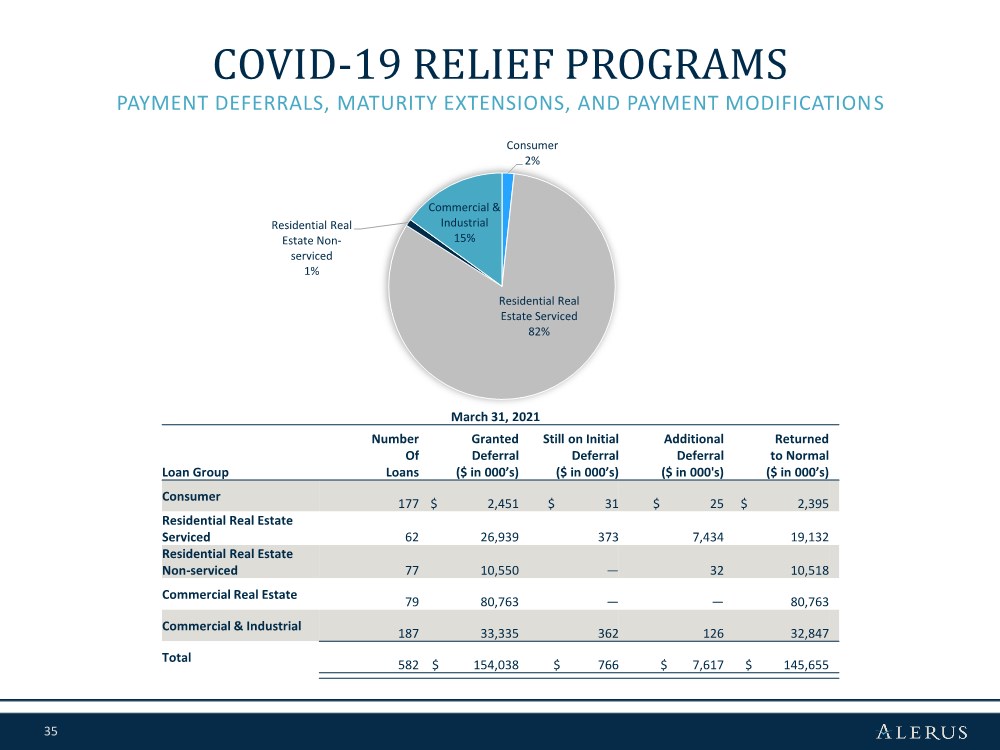
| 35 PAYMENT DEFERRALS, MATURITY EXTENSIONS, AND PAYMENT MODIFICATIONS COVID-19 RELIEF PROGRAMS March 31, 2021 Loan Group Number Of Loans Granted Deferral ($ in 000’s) Still on Initial Deferral ($ in 000’s) Additional Deferral ($ in 000's) Returned to Normal ($ in 000’s) Consumer 177 $ 2,451 $ 31 $ 25 $ 2,395 Residential Real Estate Serviced 62 26,939 373 7,434 19,132 Residential Real Estate Non-serviced 77 10,550 — 32 10,518 Commercial Real Estate 79 80,763 —— 80,763 Commercial & Industrial 187 33,335 362 126 32,847 Total 582 $ 154,038 $ 766 $ 7,617 $ 145,655 Consumer 2% Residential Real Estate Serviced 82% Residential Real Estate Non- serviced 1% Commercial & Industrial 15% |
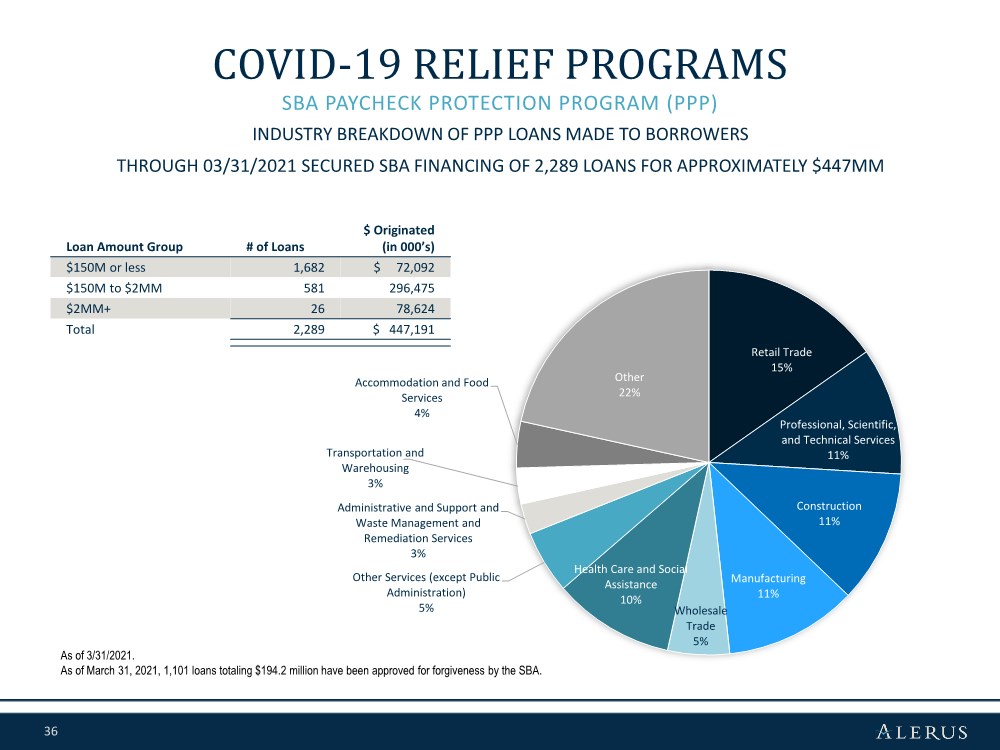
| 36 Retail Trade 15% Professional, Scientific, and Technical Services 11% Construction 11% Manufacturing 11% Wholesale Trade 5% Health Care and Social Assistance 10% Other Services (except Public Administration) 5% Administrative and Support and Waste Management and Remediation Services 3% Transportation and Warehousing 3% Accommodation and Food Services 4% Other 22% SBA PAYCHECK PROTECTION PROGRAM (PPP) COVID-19 RELIEF PROGRAMS As of 3/31/2021. As of March 31, 2021, 1,101 loans totaling $194.2 million have been approved for forgiveness by the SBA. Loan Amount Group # of Loans $ Originated (in 000’s) $150M or less 1,682 $ 72,092 $150M to $2MM 581 296,475 $2MM+ 26 78,624 Total 2,289 $ 447,191 INDUSTRY BREAKDOWN OF PPP LOANS MADE TO BORROWERS THROUGH 03/31/2021 SECURED SBA FINANCING OF 2,289 LOANS FOR APPROXIMATELY $447MM |
| 37 APPENDIX |
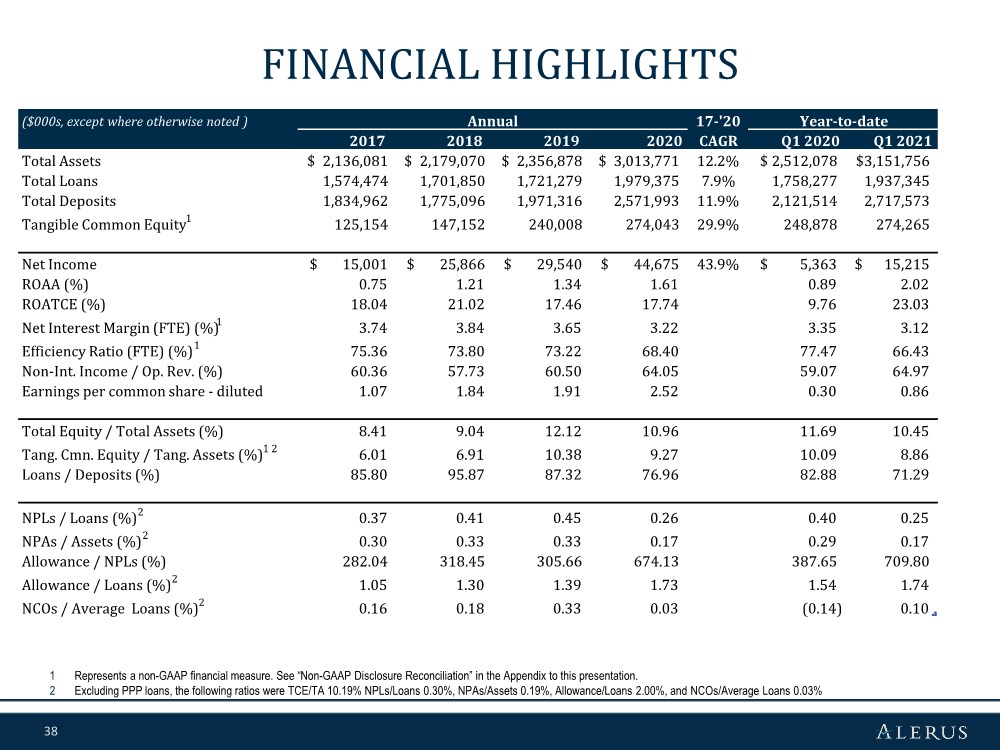
| 38 FINANCIAL HIGHLIGHTS 1 Represents a non-GAAP financial measure. See “Non-GAAP Disclosure Reconciliation” in the Appendix to this presentation. 2 Excluding PPP loans, the following ratios were TCE/TA 10.19% NPLs/Loans 0.30%, NPAs/Assets 0.19%, Allowance/Loans 2.00%, and NCOs/Average Loans 0.03% ($000s, except where otherwise noted ) Annual 17-'20 Year-to-date 2017 2018 2019 2020 CAGR Q1 2020 Q1 2021 Total Assets 2,136,081 $ 2,179,070 $ 2,356,878 $ 3,013,771 $ 12.2% 2,512,078 $ 3,151,756 $ Total Loans 1,574,474 1,701,850 1,721,279 1,979,375 7.9% 1,758,277 1,937,345 Total Deposits 1,834,962 1,775,096 1,971,316 2,571,993 11.9% 2,121,514 2,717,573 Tangible Common Equity1 125,154 147,152 240,008 274,043 29.9% 248,878 274,265 Net Income 15,001 $ 25,866 $ 29,540 $ 44,675 $ 43.9% 5,363 $ 15,215 $ ROAA (%) 0.75 1.21 1.34 1.61 0.89 2.02 ROATCE (%) 18.04 21.02 17.46 17.74 9.76 23.03 Net Interest Margin (FTE) (%) 1 3.74 3.84 3.65 3.22 3.35 3.12 Efficiency Ratio (FTE) (%)1 75.36 73.80 73.22 68.40 77.47 66.43 Non-Int. Income / Op. Rev. (%) 60.36 57.73 60.50 64.05 59.07 64.97 Earnings per common share - diluted 1.07 1.84 1.91 2.52 0.30 0.86 Total Equity / Total Assets (%) 8.41 9.04 12.12 10.96 11.69 10.45 Tang. Cmn. Equity / Tang. Assets (%)1 2 6.01 6.91 10.38 9.27 10.09 8.86 Loans / Deposits (%) 85.80 95.87 87.32 76.96 82.88 71.29 NPLs / Loans (%)2 0.37 0.41 0.45 0.26 0.40 0.25 NPAs / Assets (%)2 0.30 0.33 0.33 0.17 0.29 0.17 Allowance / NPLs (%) 282.04 318.45 305.66 674.13 387.65 709.80 Allowance / Loans (%)2 1.05 1.30 1.39 1.73 1.54 1.74 NCOs / Average Loans (%)2 0.16 0.18 0.33 0.03 (0.14) 0.10 |
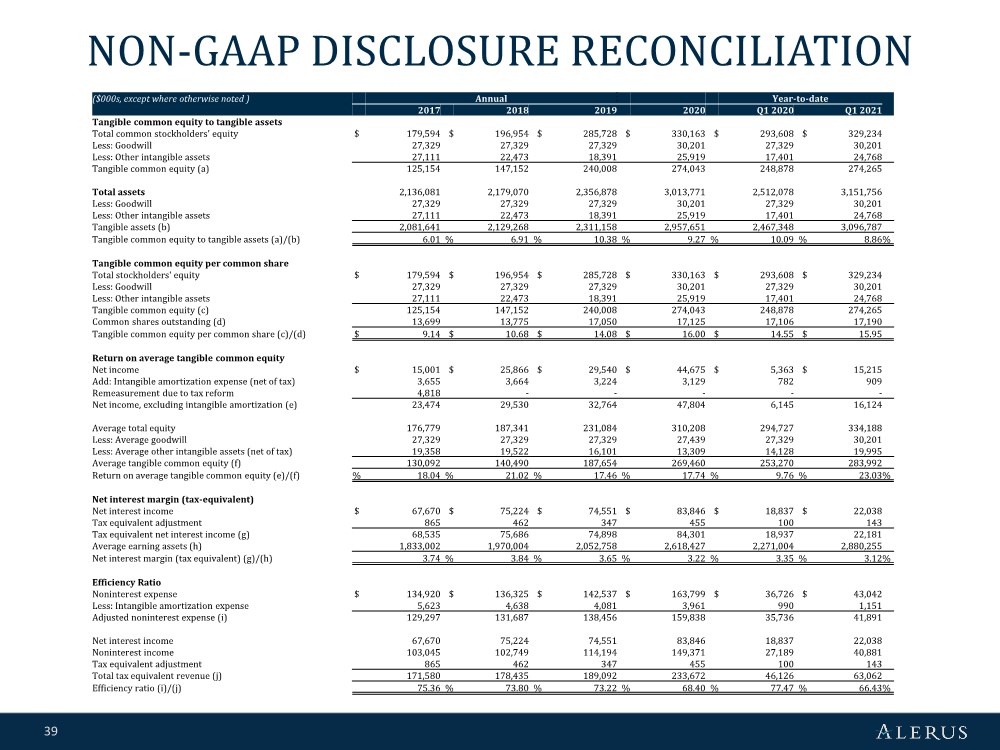
| 39 NON-GAAP DISCLOSURE RECONCILIATION ($000s, except where otherwise noted ) Annual Year-to-date 2017 2018 2019 2020 Q1 2020 Q1 2021 Tangible common equity to tangible assets Total common stockholders' equity $ 179,594 $ 196,954 $ 285,728 $ 330,163 $ 293,608 $ 329,234 Less: Goodwill 27,329 27,329 27,329 30,201 27,329 30,201 Less: Other intangible assets 27,111 22,473 18,391 25,919 17,401 24,768 Tangible common equity (a) 125,154 147,152 240,008 274,043 248,878 274,265 Total assets 2,136,081 2,179,070 2,356,878 3,013,771 2,512,078 3,151,756 Less: Goodwill 27,329 27,329 27,329 30,201 27,329 30,201 Less: Other intangible assets 27,111 22,473 18,391 25,919 17,401 24,768 Tangible assets (b) 2,081,641 2,129,268 2,311,158 2,957,651 2,467,348 3,096,787 Tangible common equity to tangible assets (a)/(b) 6.01 % 6.91 % 10.38 % 9.27 % 10.09 % 8.86 % Tangible common equity per common share Total stockholders' equity $ 179,594 $ 196,954 $ 285,728 $ 330,163 $ 293,608 $ 329,234 Less: Goodwill 27,329 27,329 27,329 30,201 27,329 30,201 Less: Other intangible assets 27,111 22,473 18,391 25,919 17,401 24,768 Tangible common equity (c) 125,154 147,152 240,008 274,043 248,878 274,265 Common shares outstanding (d) 13,699 13,775 17,050 17,125 17,106 17,190 Tangible common equity per common share (c)/(d) $ 9.14 $ 10.68 $ 14.08 $ 16.00 $ 14.55 $ 15.95 Return on average tangible common equity Net income $ 15,001 $ 25,866 $ 29,540 $ 44,675 $ 5,363 $ 15,215 Add: Intangible amortization expense (net of tax) 3,655 3,664 3,224 3,129 782 909 Remeasurement due to tax reform 4,818 ----- Net income, excluding intangible amortization (e) 23,474 29,530 32,764 47,804 6,145 16,124 Average total equity 176,779 187,341 231,084 310,208 294,727 334,188 Less: Average goodwill 27,329 27,329 27,329 27,439 27,329 30,201 Less: Average other intangible assets (net of tax) 19,358 19,522 16,101 13,309 14,128 19,995 Average tangible common equity (f) 130,092 140,490 187,654 269,460 253,270 283,992 Return on average tangible common equity (e)/(f) % 18.04 % 21.02 % 17.46 % 17.74 % 9.76 % 23.03 % Net interest margin (tax-equivalent) Net interest income $ 67,670 $ 75,224 $ 74,551 $ 83,846 $ 18,837 $ 22,038 Tax equivalent adjustment 865 462 347 455 100 143 Tax equivalent net interest income (g) 68,535 75,686 74,898 84,301 18,937 22,181 Average earning assets (h) 1,833,002 1,970,004 2,052,758 2,618,427 2,271,004 2,880,255 Net interest margin (tax equivalent) (g)/(h) 3.74 % 3.84 % 3.65 % 3.22 % 3.35 % 3.12 % Efficiency Ratio Noninterest expense $ 134,920 $ 136,325 $ 142,537 $ 163,799 $ 36,726 $ 43,042 Less: Intangible amortization expense 5,623 4,638 4,081 3,961 990 1,151 Adjusted noninterest expense (i) 129,297 131,687 138,456 159,838 35,736 41,891 Net interest income 67,670 75,224 74,551 83,846 18,837 22,038 Noninterest income 103,045 102,749 114,194 149,371 27,189 40,881 Tax equivalent adjustment 865 462 347 455 100 143 Total tax equivalent revenue (j) 171,580 178,435 189,092 233,672 46,126 63,062 Efficiency ratio (i)/(j) 75.36 % 73.80 % 73.22 % 68.40 % 77.47 % 66.43 % |