Attached files
| file | filename |
|---|---|
| 8-K - 8-K - WHITE MOUNTAINS INSURANCE GROUP LTD | wtm-20210604.htm |

White Mountains Insurance Group, Ltd. Annual Investor Presentation Exhibit 99.1

1 Forward-Looking Statements Forward-Looking Statements This presentation may contain “forward-looking statements” within the meaning of Section 27A of the Securities Act of 1933 and Section 21E of the Securities Exchange Act of 1934. All statements, other than statements of historical facts, included or referenced in this presentation which address activities, events or developments which White Mountains expects or anticipates will or may occur in the future are forward-looking statements. The words “could”, “will,” “believe,” “intend,” “expect,” “anticipate,” “project,” “estimate,” “predict” and similar expressions are also intended to identify forward-looking statements. These forward- looking statements include, among others, statements with respect to White Mountains’s: (i) change in book value or adjusted book value per share or return on equity; (ii) business strategy; (iii) financial and operating targets or plans; (iv) incurred loss and loss adjustment expenses and the adequacy of its loss and loss adjustment expense reserves and related reinsurance (v) projections of revenues, income (or loss), earnings (or loss) per share, EBITDA, adjusted EBITDA, dividends, market share or other financial forecasts; (vi) expansion and growth of its business and operations; and (vii) future capital expenditures. These statements are based on certain assumptions and analyses made by White Mountains in light of its experience and perception of historical trends, current conditions and expected future developments, as well as other factors believed to be appropriate in the circumstances. However, whether actual results and developments will conform to its expectations and predictions is subject to risks and uncertainties that could cause actual results to differ materially from expectations, including: (i) the risk factors set forth in our Form 10-K for the year ended December 31, 2020; (ii) claims arising from catastrophic events, such as hurricanes, earthquakes, floods, fires, terrorist attacks or severe winter weather; (iii) the market value of White Mountains’s investment in MediaAlpha; (iv) the trends and uncertainties from the COVID-19 pandemic, including the judicial interpretations on the extent of insurance coverage provided by insurers for COVID-19 pandemic-related claims; (v) business opportunities (or lack thereof) that may be presented to it and pursued; (vi) actions taken by ratings agencies from time to time, such as financial strength or credit ratings downgrades or placing ratings on negative watch; (vii) the continued availability of capital and financing; (viii) deterioration of general economic, market or business conditions, including due to outbreaks of contagious disease (including the COVID-19 pandemic) and corresponding mitigation efforts; (ix) competitive forces, including the conduct of other insurers; (x) changes in domestic or foreign laws or regulations, or their interpretation, applicable to White Mountains, its competitors or its customers; and (xi) other factors, most of which are beyond White Mountains’s control. Consequently, all of the forward-looking statements made in this presentation are qualified by these cautionary statements, and there can be no assurance that the actual results or developments anticipated by White Mountains will be realized or, even if substantially realized, that they will have the expected consequences to, or effects on, White Mountains or its business or operations. White Mountains assumes no obligation to publicly update any such forward-looking statements, whether as a result of new information, future events or otherwise.

2 Notes and Non-GAAP Financial Measures Notes Management has adjusted certain amounts within this presentation. Management believes the adjusted amounts to be useful to management and investors in depicting and evaluating White Mountains's financial condition and performance. The adjusted amounts are noted and described on p. 43 in the Appendices. Non-GAAP Financial Measures Management believes the non-GAAP measures included in this presentation to be useful to management and investors in depicting and evaluating White Mountains's financial condition and performance. The non-GAAP financial measures included in this presentation, and the number of the page on which each measure is first shown, are listed below. • Growth in ABVPS (p. 5) • Owners’ capital per share (p. 10) • ABVPS (p. 10) • BAM Total premiums (p. 13) • Ark Adjusted combined ratio (p. 18) • NSM Pro forma adjusted EBITDA (p. 20) • Kudu Adjusted EBITDA and Annualized adjusted EBITDA (p. 23) • Total portfolio (p. 34) • Fixed income (p. 36) • Equities (p. 36) • Equity exposure (p. 36) • Total return on investment portfolio (p. 37) • Fixed income return (p. 37) • Equity return (p. 37) Please see p. 44-53 in the Appendices for a reconciliation of each non-GAAP measure to its most closely comparable GAAP financial measure. Electronic Copy of Presentation An electronic copy of this presentation can be found at our website: www.whitemountains.com

3 Introductions WTM Board of Directors WTM senior team Senior teams of: – HG Global / BAM – Ark – NSM – Kudu – MediaAlpha – PassportCard / DavidShield – Elementum

Year in Review

5 Performance Recap Years ended ($ in millions) 2018 2019 2020 1Q21 Growth in ABVPS -2.8% 14.8% 24.2% -1.7% Growth in MVPS 0.9% 30.2% -10.2% 11.5%

6 2020 Returns in Context Book value returns Market value returns WTM ABVPS 24.2% WTM -10.2% Dowling & Partners Composite TVC [1] 13.9% Dowling & Partners Composite [2] -0.3% S&P 500 18.4% Business Insurance Index [3] -11.0% S&P Financials -2.1%

7 Key Milestones Ark: closed significant “scale-up” transaction – Back in the balance sheet business in a hard market – Control position; strong alignment with founders / management MediaAlpha: executed IPO and secondary sale – MOIC of 22x and IRR of 75% (at the end of 1Q21) – Remaining 26% stake valued at $600 million (at the end of 1Q21) Capital deployment: completed the post-OneBeacon agenda – Deployed and distributed $3.3 billion between 2017 and 1Q21 COVID-19: responded to challenges with employee well-being as our top priority

8 $0.0 $1.0 $1.8 $2.2 $3.3 $3.3 $0.0 $0.5 $1.0 $1.5 $2.0 $2.5 $3.0 $3.5 $4.0 1Q17 2017 2018 2019 2020 1Q21 Capital distributions, cumulative New capital deployments, cumulative Undeployed capital Distributions and Deployments ($ in billions) [4] [5] [5]

Operating Businesses

10 Owners’ Capital Per Share at the End of 1Q21 [6] Total: $1,242 ABVPS $139Ark $267 HG Global $265 MediaAlpha $195 NSM $151 Kudu $124 PC/DS $31 Elementum $18 Other operating businesses $31 Strategic investments / other $59 Undeployed capital $101

11 Key Businesses Today Company Initial investment year WTM ownership [7] Management ownership [7] ABV [6] ($ in millions) Per share [6] ($) 2012 97% 3% $818 $265 2021 63% 37% 623 / 823 202 / 267 2018 90% 10% 467 151 2018 85% 15% 382 124 2014 26% 27% 600 195 2015 54% 46% 95 31 2019 30% 70% 57 18

12 HG Global / BAM: Overview Financial guarantor, insuring only essential public purpose municipal bonds BAM is a mutual company owned by its municipality policyholders HG Re is a stock company owned by WTM; provides first-loss reinsurance to BAM WTM economics come in two forms: – Surplus note interest – HG Re reinsurance profits

13 HG Global / BAM: Recent Results Total premiums [8] of $131 million in 2020, up 23% YOY – Par insured hit all-time high of $17.3 billion (up 35% YOY) ● Credit volatility drove robust demand for insurance ● Market share grew, reflecting “COVID-hustle” – Absolute pricing down slightly; risk-adjusted pricing up $30 million regular cash payment of surplus note P&I (up 36% YOY) Total premiums [8] of $26 million in 1Q21; BAM’s best 1Q ever State and local government financial stress could pressure certain BAM-insured bonds No missed payments in portfolio; no credits currently on watch list
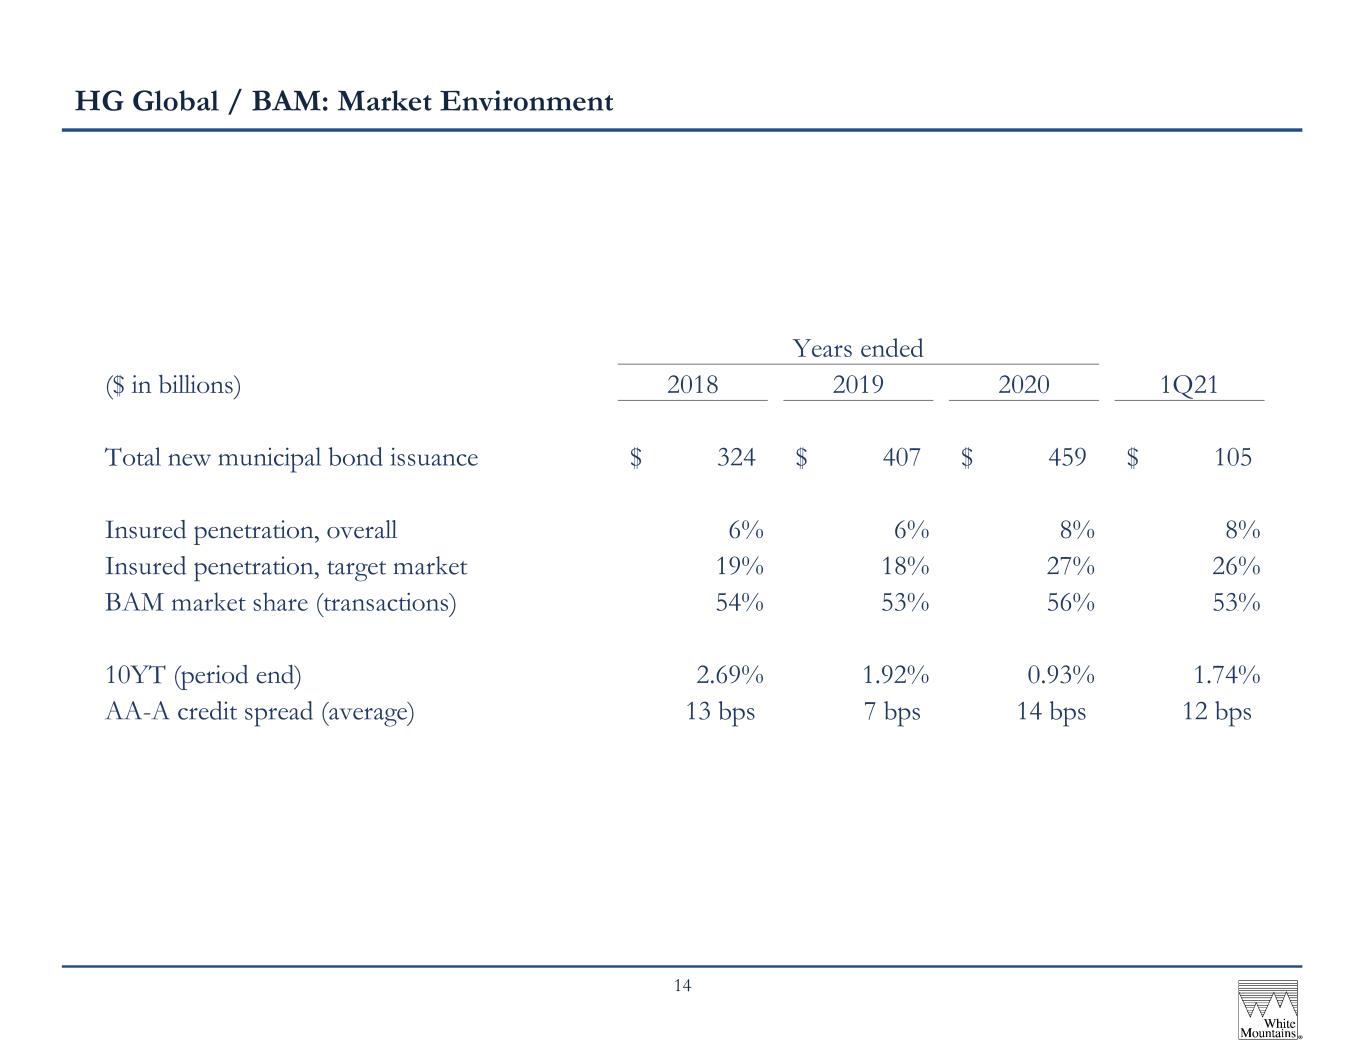
14 HG Global / BAM: Market Environment ($ in billions) 2018 2019 2020 1Q21 Total new municipal bond issuance 324$ 407$ 459$ 105$ Insured penetration, overall 6% 6% 8% 8% Insured penetration, target market 19% 18% 27% 26% BAM market share (transactions) 54% 53% 56% 53% 10YT (period end) 2.69% 1.92% 0.93% 1.74% AA-A credit spread (average) 13 bps 7 bps 14 bps 12 bps Years ended

15 HG Global / BAM: Financial Highlights ($ in millions, except where stated) 2018 2019 2020 1Q21 Par insured ($ in billions) 12.0$ 12.8$ 17.3$ 3.5$ Total pricing [8] 93 bps 83 bps 76 bps 74 bps Primary + surety 71 bps 53 bps 61 bps 60 bps Secondary and assumed reinsurance 150 bps 219 bps 197 bps 118 bps Total premiums [8] 111$ 107$ 131$ 26$ Primary + surety 63 54 91 15 Secondary and assumed reinsurance 48 53 40 11 S&P RAP 4.44% 4.07% 4.25% 5.13% Claims paying resources 871$ 938$ 987$ 1,144$ 97% of HG Global's UPR, net of DAC 102$ 115$ 138$ 141$ Years ended

16 Ark: Overview Global P&C (re)insurance business Founded in 2007 by Ian Beaton and Nick Bonnar Covers property and specialty lines (A&H, energy, marine, political) Writes business via: – Lloyd’s Syndicates 4020 and 3902 – Bermuda-based reinsurer Group Ark Insurance Ltd. Consistently top-quartile underwriter at Lloyd’s – High profitability; managed volatility

17 Ark: Transaction First broad-based hard market in a decade Rekindled conversations with Ian and Nick, two of the best in the business – Valued management’s proven track record and “underwriting comes first” mindset – Believed Ark’s scale-up strategy would improve speed to market and reduce execution risk Acquired a controlling interest in Ark – Purchased additional $41 million of shares from existing owners – Contributed $605 million of equity capital at a pre-money valuation of $300 million – Committed up to $200 million of additional equity capital in 1H21

18 Ark: Recent Results Strong 2020 results 98% COR, outperforming the Lloyd’s market by 12 points Strong operational execution to date – AM Best rating of “A/stable,” highest in the Class of 2020 – All underwriting platforms up and running for 1/1 renewals – Key hires in place Off to a good start in 1Q21 – Gross premiums of $405 million (up 2.1x YOY) – Blended renewal pricing up over 10% – Adjusted combined ratio of 108%, driven by elevated cats (Winter Storm Uri)
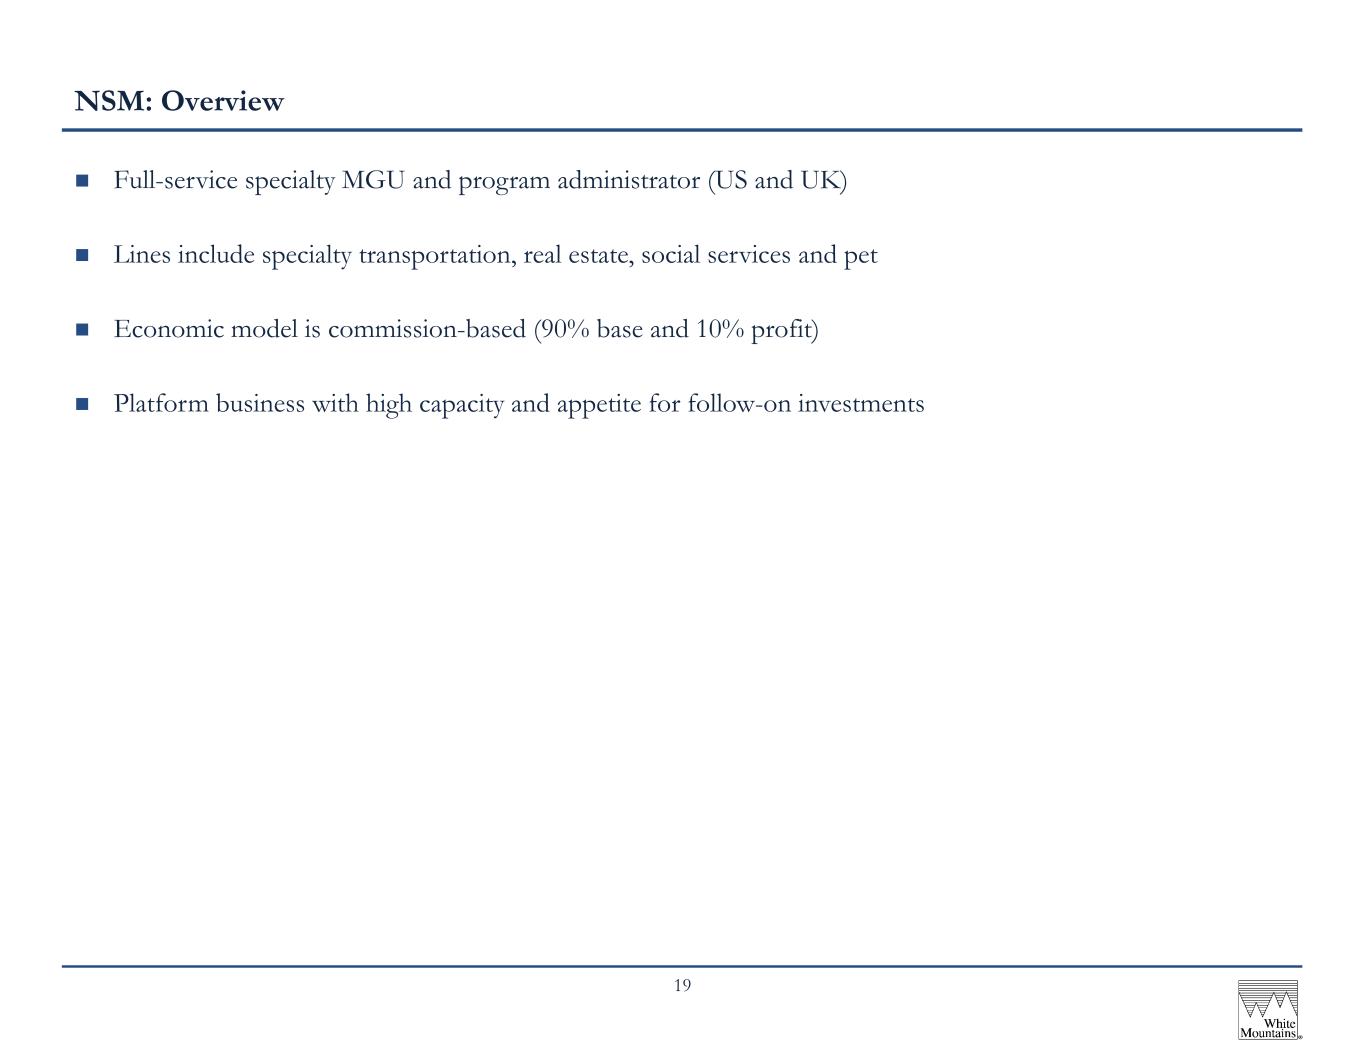
19 NSM: Overview Full-service specialty MGU and program administrator (US and UK) Lines include specialty transportation, real estate, social services and pet Economic model is commission-based (90% base and 10% profit) Platform business with high capacity and appetite for follow-on investments

20 NSM: Recent Results Good results in 2020 – Pro forma Controlled Premiums [9] crossed $1 billion threshold (up 12% YOY organically) – TTM Pro forma adjusted EBITDA [10] of $62 million (up 5% YOY organically) – US business had an outstanding year; UK business had a tough year – Closed Kingsbridge acquisition in April 2020 Off to a good start in 1Q21 – TTM Pro forma adjusted EBITDA [10] of $63 million (up 2% QOQ) – US business lines generally performing well – UK results improving; exited underperforming Fresh motor business in April 2021
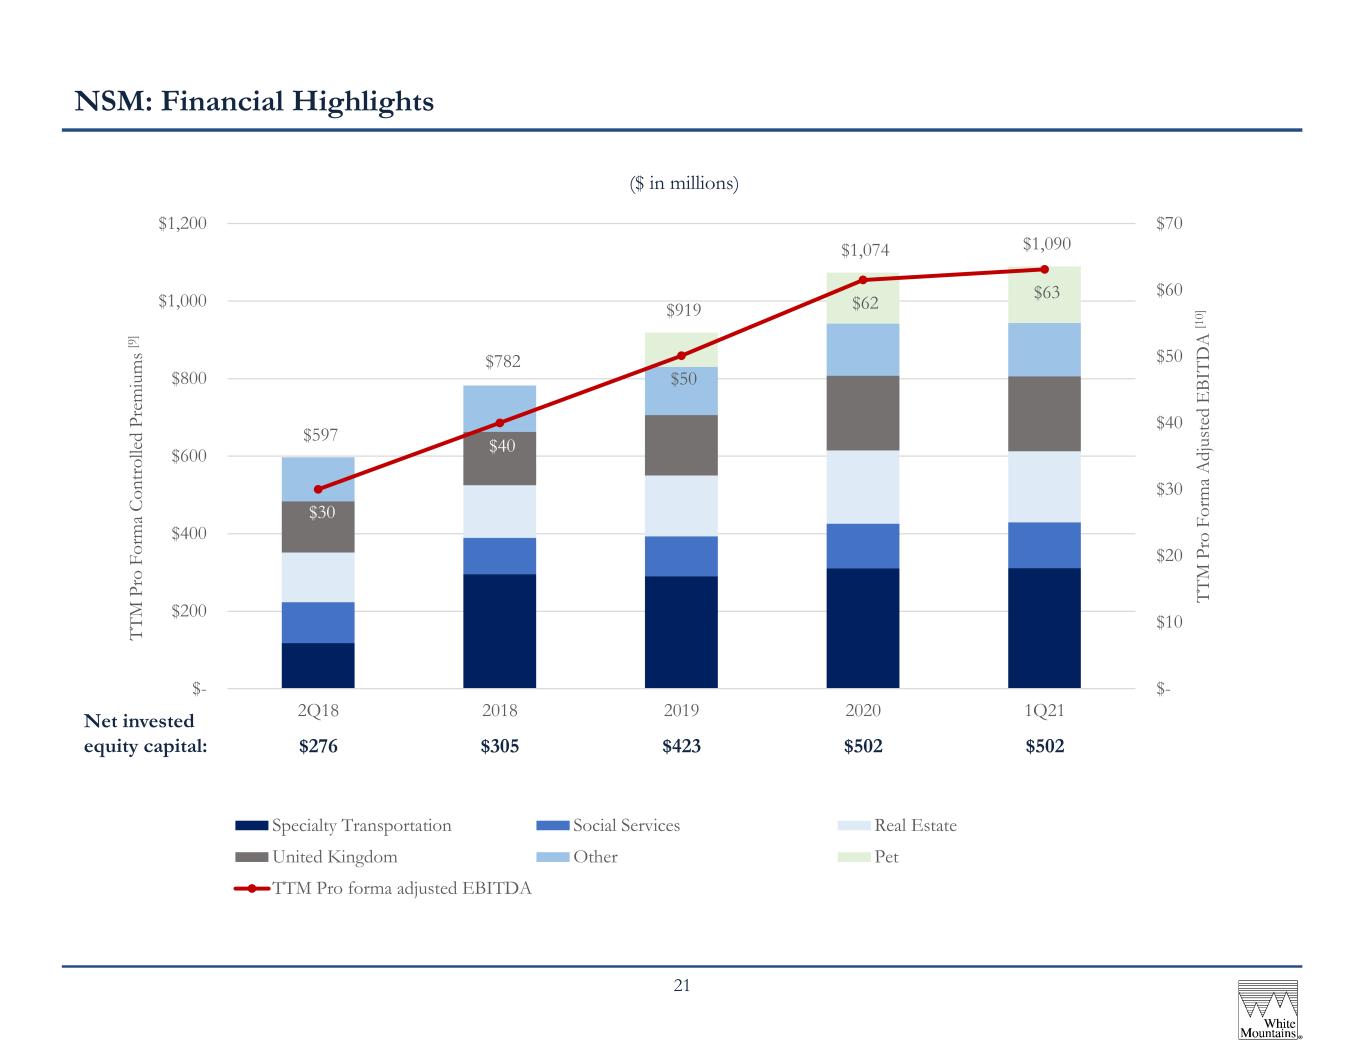
21 $597 $782 $919 $1,074 $1,090 $30 $40 $50 $62 $63 $- $10 $20 $30 $40 $50 $60 $70 $- $200 $400 $600 $800 $1,000 $1,200 2Q18 2018 2019 2020 1Q21 T T M P ro F or m a A dj us te d E B IT D A [1 0] T T M P ro F or m a C on tr ol le d Pr em iu m s [9 ] Specialty Transportation Social Services Real Estate United Kingdom Other Pet TTM Pro forma adjusted EBITDA NSM: Financial Highlights ($ in millions) $276 Net invested equity capital: $305 $423 $502 $502
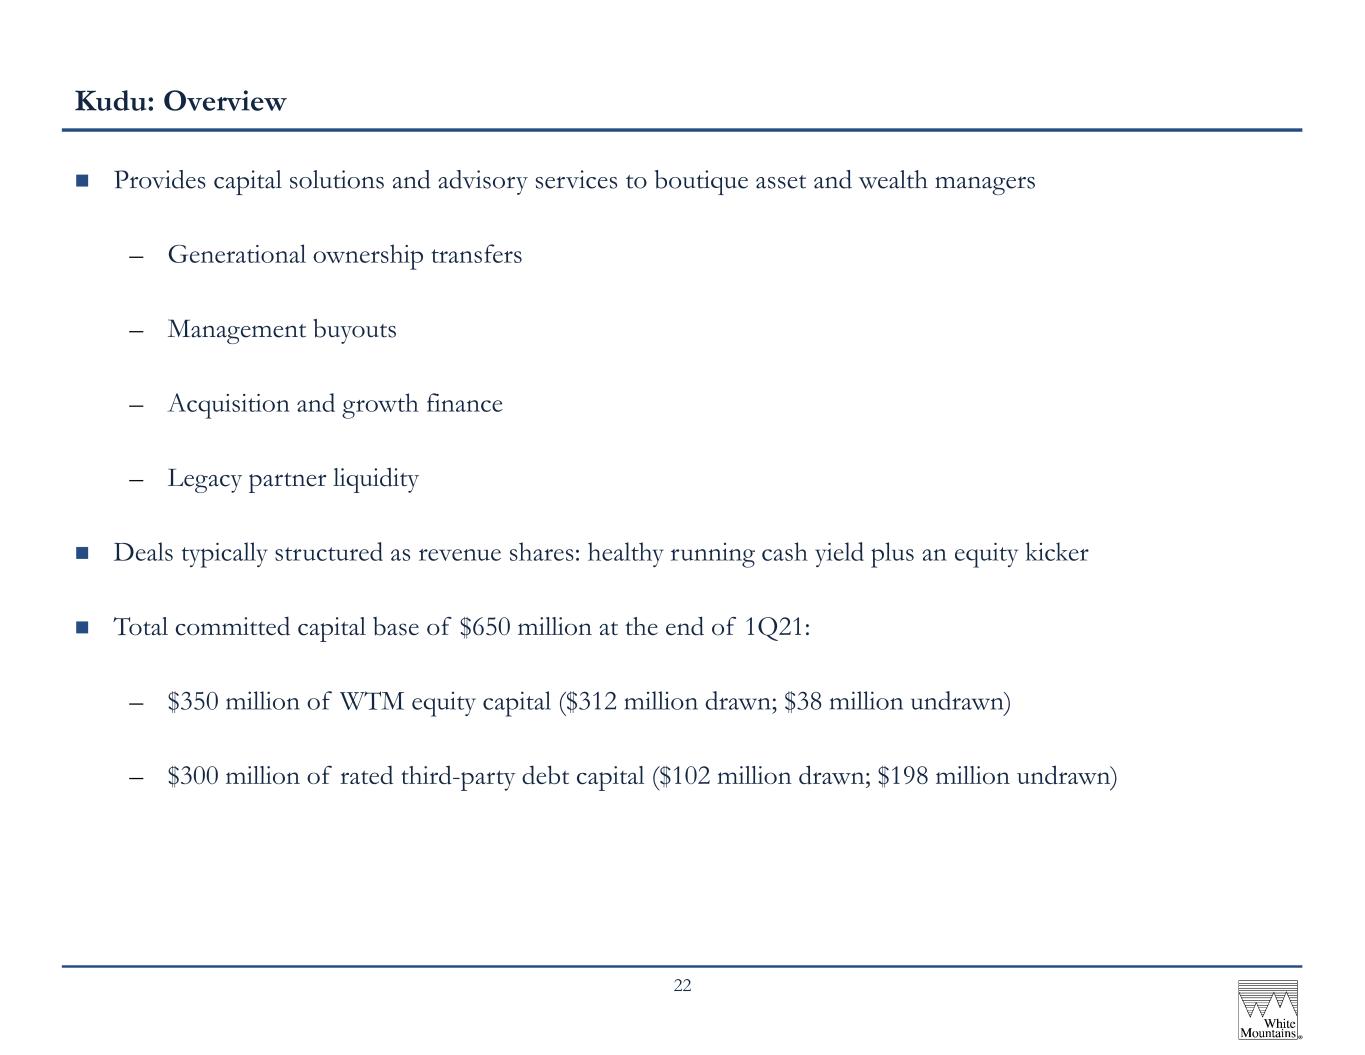
22 Kudu: Overview Provides capital solutions and advisory services to boutique asset and wealth managers – Generational ownership transfers – Management buyouts – Acquisition and growth finance – Legacy partner liquidity Deals typically structured as revenue shares: healthy running cash yield plus an equity kicker Total committed capital base of $650 million at the end of 1Q21: – $350 million of WTM equity capital ($312 million drawn; $38 million undrawn) – $300 million of rated third-party debt capital ($102 million drawn; $198 million undrawn)

23 Kudu: Recent Results Solid 2020 results – Deployed $121 million into four new deals and one follow-on – Portfolio generated positive investment performance and grew AUM by 4% – Fair value of Kudu’s participation contracts increased by 3% – Cash revenue yield on total capital of 10% – Adjusted EBITDA of $22 million, up 2.3x YOY Strong results in 1Q21 – TTM Adjusted EBITDA of $23 million (up 3% QOQ) – TTM Annualized Adjusted EBITDA of $29 million

24 $142 $142 $219 $266 $263 $316 $326 $401 $427 $(1) $2 $5 $10 $15 $16 $17 $22 $23 $(5) $- $5 $10 $15 $20 $25 $- $50 $100 $150 $200 $250 $300 $350 $400 $450 1Q19 2Q19 3Q19 4Q19 1Q20 2Q20 3Q20 4Q20 1Q21 T T M A dj us te d E B IT D A Fa ir V al ue o f P ar tic ip at io n C on tr ac ts Fair Value TTM Adjusted EBITDA Kudu: Financial Highlights ($ in millions) Participation contracts: Total capital drawn: Total equity drawn: 5 $145 $145 5 $145 $145 8 $221 $221 9 $278 $221 10 $297 $228 11 $330 $256 11 $330 $256 13 $392 $303 13 $414 $312
25 MediaAlpha: Overview Online customer acquisition technology platform Industry-leading marketplaces for real-time transactions across clicks, calls, and leads Multiple verticals, including P&C, health and life insurance Fee-based economic model with a percentage taken from all marketplace transactions Executed successful IPO (NYSE: MAX) in 2020 – Sold 3.6 million shares for $64 million ($19 per share gross) in IPO – Sold 3.6 million shares for $160 million ($46 per share gross) in secondary offering – Continue to own 26% on a fd/fc basis; position valued at roughly $700 million as of June 3

26 MediaAlpha: Recent Results Record operating results in 2020 – Adjusted EBITDA grew to $58 million, up 35% YOY – Record year in auto insurance, with revenues up 81% Good start in 1Q21 – TTM Adjusted EBITDA grew to $62 million, up 29% year-over-year – Continued strong momentum in P&C and H&L verticals Business is well positioned for continued growth – Large addressable market with favorable trends still in early innings – Marketers as a whole spend 65% of advertising budgets online; insurance category only at 21% – Insurance digital distribution market expected to grow from $9 billion in 2020 to $22 billion by 2025

27 $38 $85 $106 $117 $163 $297 $408 $585 $639 $1 $6 $7 $7 $11 $32 $43 $58 $62 $0 $5 $10 $15 $20 $25 $30 $35 $40 $45 $50 $55 $60 $65 $0 $50 $100 $150 $200 $250 $300 $350 $400 $450 $500 $550 $600 $650 2013 2014 2015 2016 2017 2018 2019 2020 1Q21 TTM A dj us te d E B IT D A R ev en ue s Revenues - p&c Revenues - health & life Revenues - other Adjusted EBITDA MediaAlpha: Financial Snapshot ($ in millions) $28Net invested capital: $27 $16 $22 $31 $21 $(77) $(201) $(361)
28 PassportCard / DavidShield: Overview Offers travel and expat medical insurance Delivers coverage and services in 200+ territories around the world Real-time, paperless insurance solution, delivered via debit card technology Superior customer experience, premium pricing and high reactivation rates Originally launched in Israel; select international expansion Economic model is commission-based (base and profit); no net risk retention

29 PassportCard / DavidShield: Recent Results Record results in 2019 and early 2020, then significant COVID disruption – 2020 Core EBITDA of $2 million (down from $17 million in 2019) – 2020 core premiums of $75 million (down 51% YOY) ● Travel premiums of $12 million (down 87% YOY) ● Expat medical premiums of $49 million (up 18% YOY) WTM injected $15 million of equity capital, increasing our ownership to 54% We reprioritized international growth initiatives: – Australian travel operations hibernated – German expat medical buildout continues Strong results since TLV airport reopened in March; expect continued recovery

30 Elementum: Overview One of the largest independent managers of insurance-linked securities (ILS) Manages institutional investment portfolios exposed to natural catastrophe event risk Delivers range of risk/return and liquidity profiles through various instruments – Catastrophe bonds – Collateralized reinsurance investments – Primary insurance Fee-based business (management fees and performance fees) WTM owns 30% of the Elementum business Separately, WTM has invested $50 million in four Elementum funds

31 Elementum: Recent Results Flattish results in 2020 – AUM grew 4% to $4.4 billion – Adjusted EBITDA shrank 4% to $13 million – We received cash dividends of $4 million, implying a cash yield of 7% – Our investments in four Elementum funds generated a blended return of +0.7% In 2019 and 2020, the ILS market has shrunk but Elementum has grown Steady start to 1Q21 – TTM Adjusted EBITDA up 2% to $13 million – Market conditions for ILS investing are attractive – Elementum is well-positioned

Financial Position & Investment Portfolio

33 Current Financial Position Total capital of $4.5 billion, substantially all in common shareholders’ equity Undeployed capital [6] of $310 million, or 7% of total capital No parent company financial leverage Total debt to total capital of 10%
34 Investments: Philosophy and Approach Invest for total return $2.4 billion Total portfolio [11] at 1Q21 – $0.9 billion of policyholder funds (Ark and HG Global) – $1.5 billion of shareholder funds Investment decisions take into account broader capital position and corporate needs Low equity exposure currently given: – Limited undeployed capital at parent – Limited equity capacity at core balance sheet businesses, chiefly Ark and HG Global

35 Investments: Mandates Mandate Total portfolio [11] Current position Objectives Parent $0.7 billion Fixed income Alternatives Safeguard known capital commitments Manage for total return HG Re $0.4 billion Fixed income Preserve claims paying resources and liquidity Ark $1.3 billion Fixed income Modest equity exposure Preserve capital and provide sufficient liquidity to meet insurance obligations Manage for total return
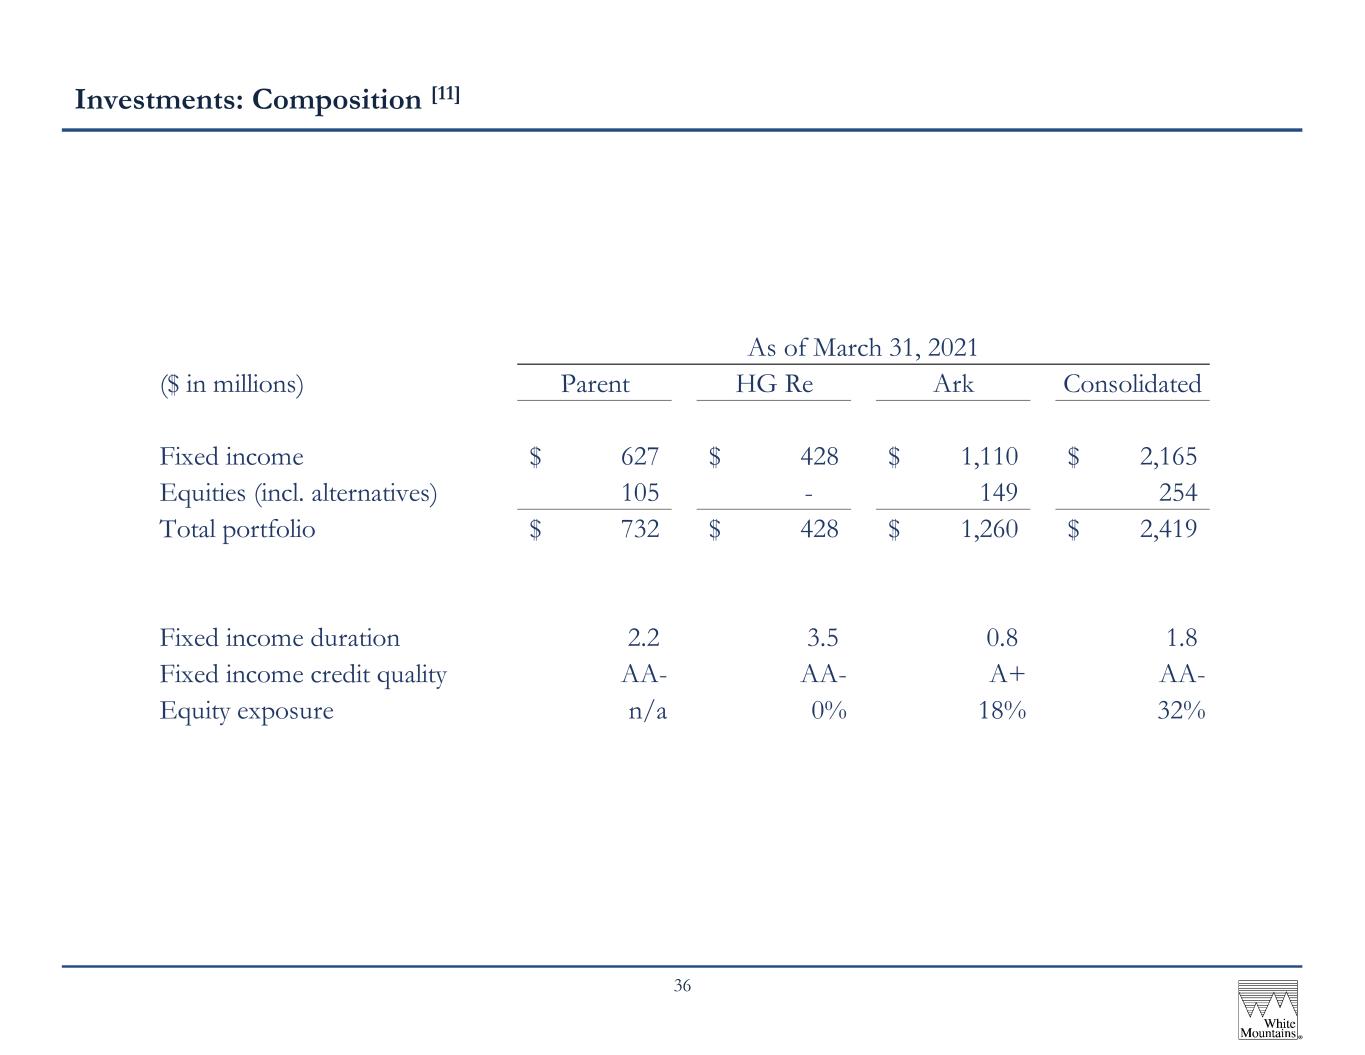
36 Investments: Composition [11] ($ in millions) Parent HG Re Ark Consolidated Fixed income 627$ 428$ 1,110$ 2,165$ Equities (incl. alternatives) 105 - 149 254 Total portfolio 732$ 428$ 1,260$ 2,419$ Fixed income duration 2.2 3.5 0.8 1.8 Fixed income credit quality AA- AA- A+ AA- Equity exposure n/a 0% 18% 32% As of March 31, 2021

37 Investments: Performance [12] 2019 2020 1Q21 Total return on investment portfolio 16.3% 3.5% 0.1% ICE BofAML 10YT + 150 bps 10.4% 12.1% -6.7% Conventional Wisdom Benchmark [13] 12.0% 9.5% -2.0% Fixed income return 6.2% 4.8% -0.7% BBG Intermediate U.S. Aggregate Index 6.7% 5.6% -1.6% Equity return 26.1% 2.7% 7.0% S&P 500 Index 31.5% 18.4% 6.2% Years ended

What to Expect

39 What to Expect from Us More of the same Focused on growing per share values over long periods of time Not focused on near-term GAAP results Adhering to our core operating principles: – Underwriting comes first – Maintain a disciplined balance sheet – Invest for total return – Think like owners Deploying/distributing capital patiently and intelligently

40 Wise Words… 1-year 5-year 10-year 20-year Since WTM IPO (1985) WTM - ABVPS 24.2% 12.8% 11.3% 10.6% 13.7% WTM - MVPS -10.2% 6.7% 11.7% 6.4% 11.7% S&P 500 18.4% 15.2% 13.9% 7.5% 11.3% Return periods ended December 31, 2020
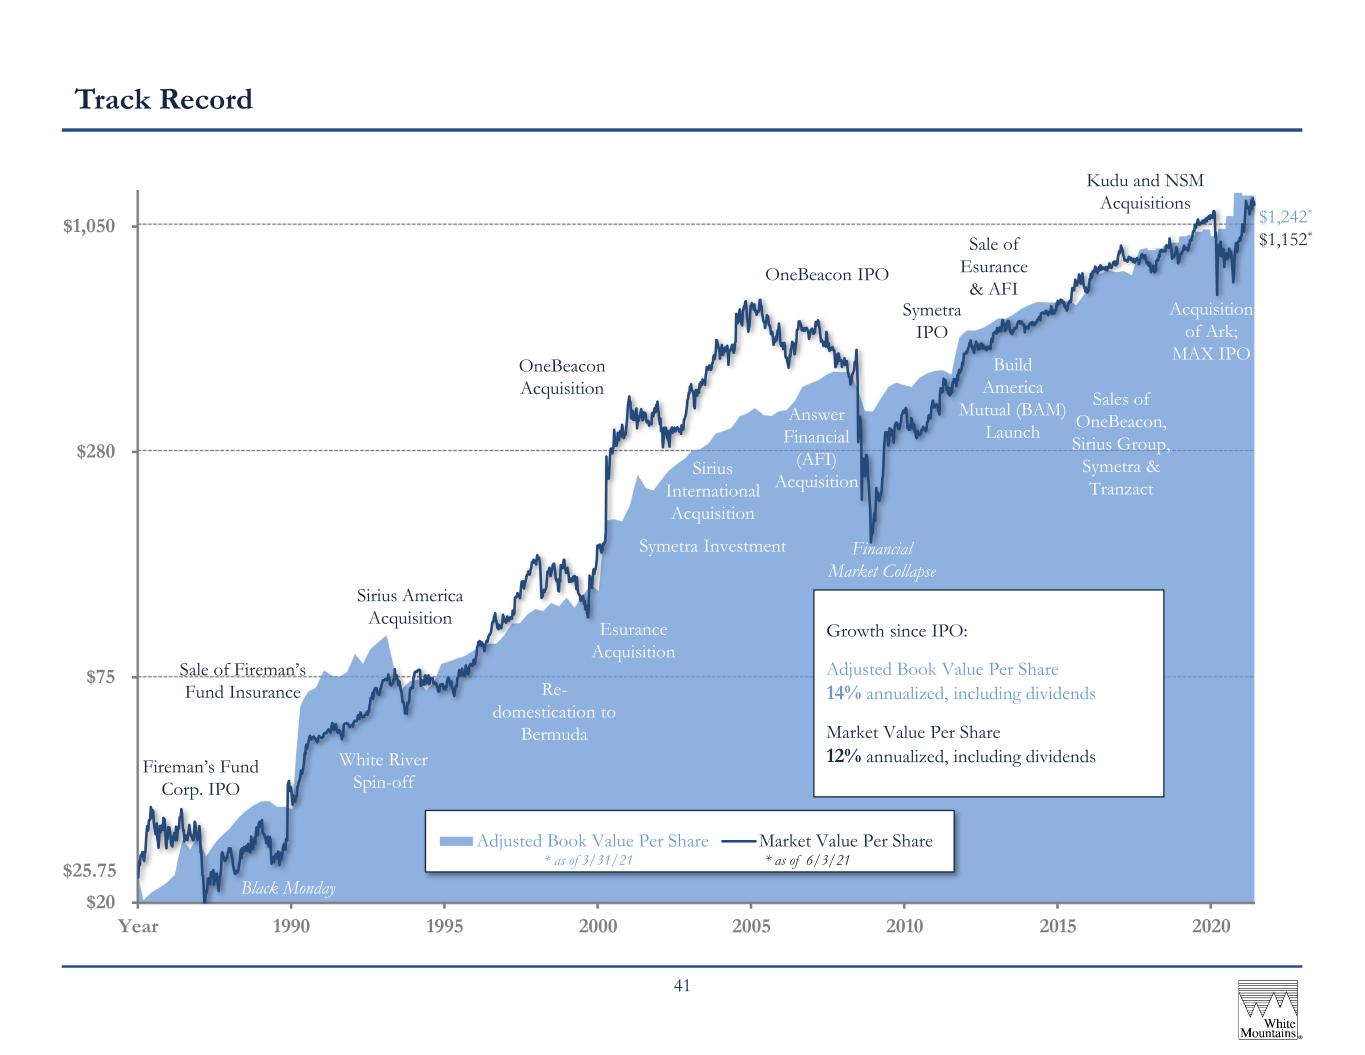
41 $20 $75 $280 $1,050 Year 1990 1995 2000 2005 2010 2015 2020 Adjusted Book Value Per Share Market Value Per Share * Growth since IPO: Adjusted Book Value Per Share 14% annualized, including dividends Market Value Per Share 12% annualized, including dividends Black Monday Financial Market Collapse * as of 6/3/21 Fireman’s Fund Corp. IPO $25.75 Sale of Fireman’s Fund Insurance Sirius America Acquisition OneBeacon Acquisition OneBeacon IPO Symetra IPO Sale of Esurance & AFI Sales of OneBeacon, Sirius Group, Symetra & Tranzact $1,242* $1,152* White River Spin-off Re- domestication to Bermuda Esurance Acquisition Sirius International Acquisition Symetra Investment Answer Financial (AFI) Acquisition Build America Mutual (BAM) Launch * as of 3/31/21 Track Record Kudu and NSM Acquisitions Acquisition of Ark; MAX IPO

Appendices 1. Notes (p. 43) 2. Non-GAAP Financial Measures (p. 44)
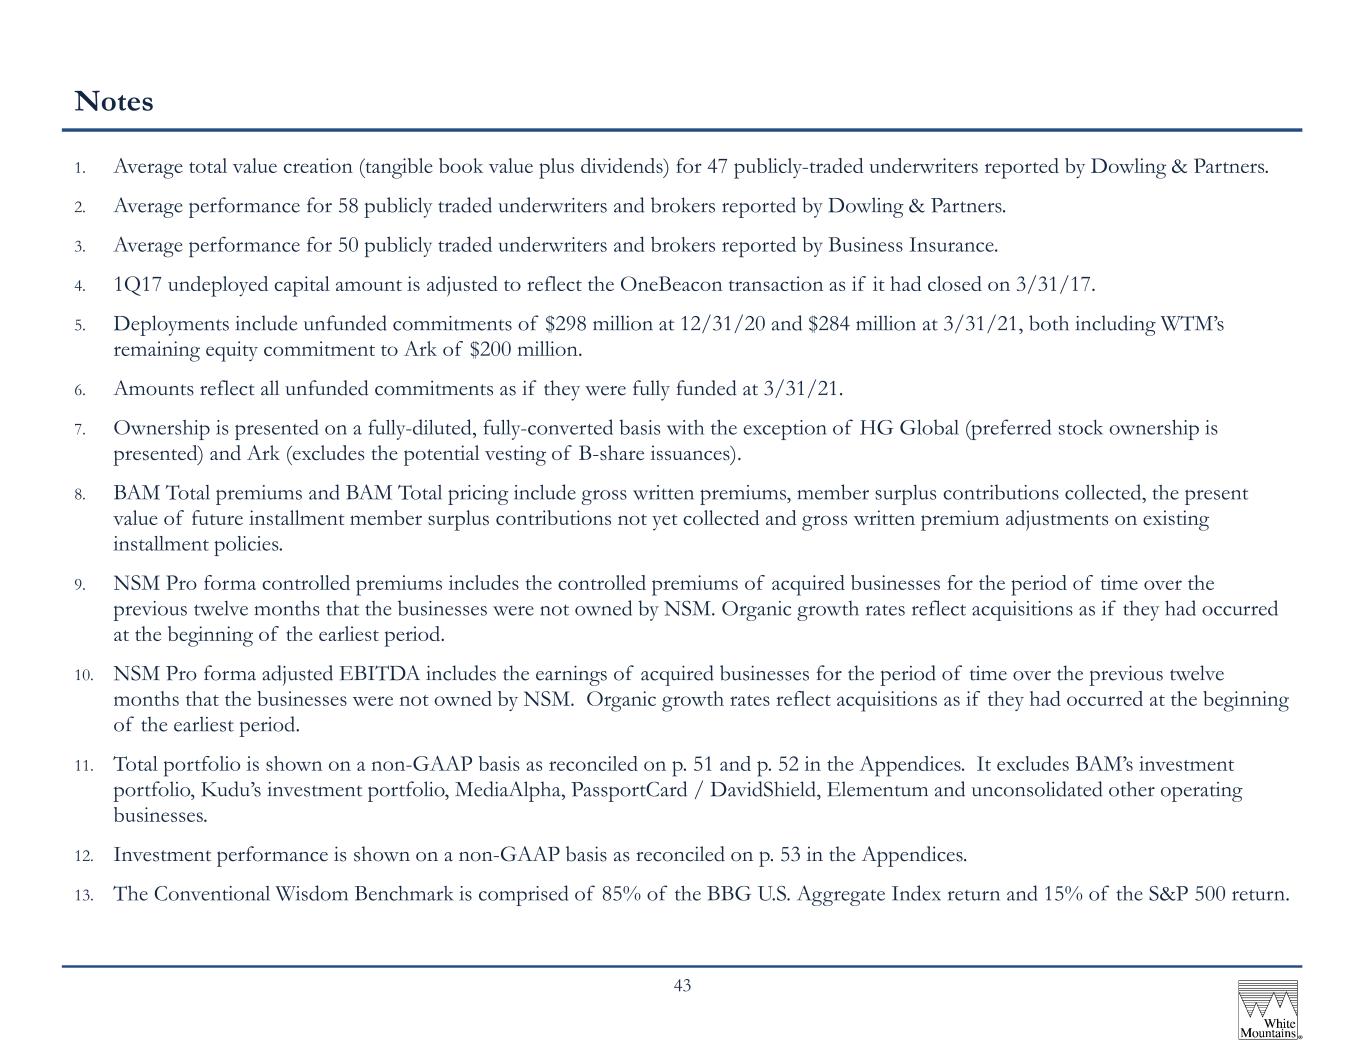
43 Notes 1. Average total value creation (tangible book value plus dividends) for 47 publicly-traded underwriters reported by Dowling & Partners. 2. Average performance for 58 publicly traded underwriters and brokers reported by Dowling & Partners. 3. Average performance for 50 publicly traded underwriters and brokers reported by Business Insurance. 4. 1Q17 undeployed capital amount is adjusted to reflect the OneBeacon transaction as if it had closed on 3/31/17. 5. Deployments include unfunded commitments of $298 million at 12/31/20 and $284 million at 3/31/21, both including WTM’s remaining equity commitment to Ark of $200 million. 6. Amounts reflect all unfunded commitments as if they were fully funded at 3/31/21. 7. Ownership is presented on a fully-diluted, fully-converted basis with the exception of HG Global (preferred stock ownership is presented) and Ark (excludes the potential vesting of B-share issuances). 8. BAM Total premiums and BAM Total pricing include gross written premiums, member surplus contributions collected, the present value of future installment member surplus contributions not yet collected and gross written premium adjustments on existing installment policies. 9. NSM Pro forma controlled premiums includes the controlled premiums of acquired businesses for the period of time over the previous twelve months that the businesses were not owned by NSM. Organic growth rates reflect acquisitions as if they had occurred at the beginning of the earliest period. 10. NSM Pro forma adjusted EBITDA includes the earnings of acquired businesses for the period of time over the previous twelve months that the businesses were not owned by NSM. Organic growth rates reflect acquisitions as if they had occurred at the beginning of the earliest period. 11. Total portfolio is shown on a non-GAAP basis as reconciled on p. 51 and p. 52 in the Appendices. It excludes BAM’s investment portfolio, Kudu’s investment portfolio, MediaAlpha, PassportCard / DavidShield, Elementum and unconsolidated other operating businesses. 12. Investment performance is shown on a non-GAAP basis as reconciled on p. 53 in the Appendices. 13. The Conventional Wisdom Benchmark is comprised of 85% of the BBG U.S. Aggregate Index return and 15% of the S&P 500 return.

44 Non-GAAP Financial Measures White Mountains Insurance Group, Ltd. Reconciliation of GAAP book value per share (BVPS) to adjusted book value per share (ABVPS) and growth in ABVPS ($ millions, except per share amounts; shares in thousands) 2018 2019 2020 1Q21 Numerator GAAP common shareholders' equity (GAAP BVPS numerator) 2,843$ 3,262$ 3,906$ 3,826$ Time value of money discount on BAM surplus notes [a] (141) (152) (143) (138) HG Global's unearned premium reserve [a] 137 157 190 195 HG Global's net deferred acquisition costs [a] (35) (41) (52) (54) Adjusted common shareholders' equity (ABVPS numerator) 2,804$ 3,225$ 3,901$ 3,829$ Denominator Common shares outstanding (GAAP BVPS denominator) 3,173 3,185 3,102 3,107 Less: unearned restricted common shares (15) (18) (15) (23) ABVPS denominator 3,158 3,167 3,087 3,084 GAAP book value per share 896$ 1,024$ 1,259$ 1,231$ Adjusted book value per share 888$ 1,018$ 1,264$ 1,242$ Growth in GAAP BVPS, including dividends [b] -3.7% 14.4% 23.1% -2.1% Growth in ABVPS, including dividends [b] -2.8% 14.8% 24.2% -1.7% [a] Amount reflects White Mountains's preferred share ownership of HG Global of 97%. [b] White Mountains declared a $1.00 per share dividend in the first quarter of each period shown.

45 Non-GAAP Financial Measures White Mountains Insurance Group, Ltd. Comparison of GAAP book value per share (BVPS) return to adjusted book value per share (ABVPS) returns Return period ended March 31, 2021 1-year 5-year 10-year 20-year Since WTM IPO (1985) Since WTM IPO (1985) WTM - BVPS 23.1% 12.8% 11.1% 10.9% 13.7% 13.6% WTM - ABVPS 24.2% 12.8% 11.3% 10.6% 13.7% 13.6% Return periods ended December 31, 2020

46 Non-GAAP Financial Measures White Mountains Insurance Group, Ltd. Reconciliation of GAAP book value and GAAP book value per share allocation of capital to adjusted book value and adjusted book value per share allocation of capital ($ millions, except per share amounts) GAAP Book Value Adjustments Adjusted Book Value Allocation of Commitments Allocated Adjusted Book Value GAAP Book Value Allocated Adjusted Book Value HG Global 814$ 3$ [a] 818$ -$ 818$ $ 262 265$ Ark 623 - 623 200 823 200 267 NSM 467 - 467 - 467 150 151 Kudu 344 - 344 38 [b] 382 111 124 MediaAlpha 600 - 600 - 600 193 195 PassportCard / DavidShield 95 - 95 - 95 31 31 Elementum 57 - 57 - 57 18 18 Strategic investments / other 425 - 425 (242) [b] 183 137 59 Other operating businesses 90 - 90 4 [b] 94 29 31 Undeployed capital 310 - 310 - 310 100 101 Total 3,826$ 3$ 3,829$ -$ 3,829$ 1,231$ 1,242$ [a] Adjusted book value is adjusted for (i) time value of money discount on BAM surplus notes and (ii) HG Global's unearned premium reserve and deferred acquisition costs. [b] Allocated adjusted book value includes unfunded commitments. 1Q21 Value Per Share1Q21 Value

47 Non-GAAP Financial Measures White Mountains Insurance Group, Ltd. Reconciliation of BAM GAAP gross written premiums and member surplus contributions (MSC) collected to gross written premiums and MSC from new business (total premiums) ($ millions, unless otherwise noted) 2018 2019 2020 1Q21 GAAP gross written premiums and member surplus contributions (MSC) collected 107$ 107$ 131$ 26$ Present value of future installment MSC collections 3 0 - - Gross written premium adjustments on existing installment policies 1 (0) - - Gross written premiums and MSC from new business (Total premiums) 111$ 107$ 131$ 26$ Memo: Total gross par value of market policies issued ($ billions) 12.0$ 12.8$ 17.3$ 3.5$ Memo: Total pricing 93 bps 83 bps 76 bps 74 bps
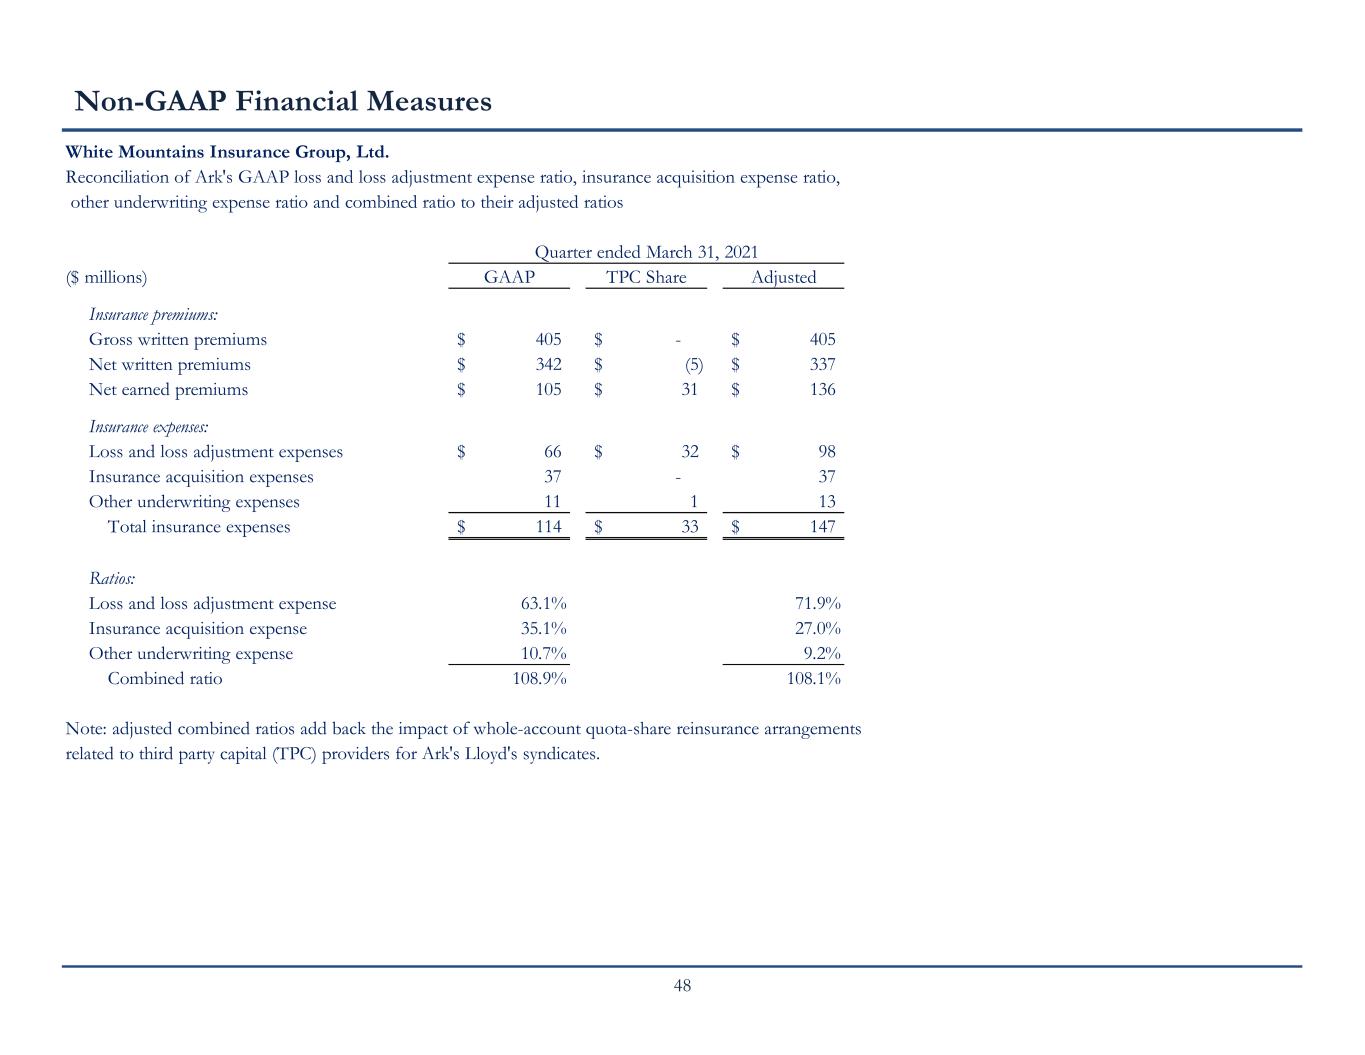
48 Non-GAAP Financial Measures White Mountains Insurance Group, Ltd. Reconciliation of Ark's GAAP loss and loss adjustment expense ratio, insurance acquisition expense ratio, other underwriting expense ratio and combined ratio to their adjusted ratios Quarter ended March 31, 2021 ($ millions) GAAP TPC Share Adjusted Insurance premiums: Gross written premiums 405$ -$ 405$ Net written premiums 342$ (5)$ 337$ Net earned premiums 105$ 31$ 136$ Insurance expenses: Loss and loss adjustment expenses 66$ 32$ 98$ Insurance acquisition expenses 37 - 37 Other underwriting expenses 11 1 13 Total insurance expenses 114$ 33$ 147$ Ratios: Loss and loss adjustment expense 63.1% 71.9% Insurance acquisition expense 35.1% 27.0% Other underwriting expense 10.7% 9.2% Combined ratio 108.9% 108.1% Note: adjusted combined ratios add back the impact of whole-account quota-share reinsurance arrangements related to third party capital (TPC) providers for Ark's Lloyd's syndicates.

49 Non-GAAP Financial Measures White Mountains Insurance Group, Ltd. Reconciliation of NSM TTM GAAP net income (loss) to NSM TTM EBITDA, TTM Adjusted EBITDA and TTM Pro Forma Adjusted EBITDA ($ millions) 2Q18 2018 2019 2020 1Q21 TTM GAAP net income (loss) (12)$ (18)$ (2)$ (7)$ (32)$ Add back: Interest expense 11 14 17 22 24 Income tax (benefit) expense - 1 (1) (6) (13) General and administrative expenses - depreciation 4 5 5 Amortization of other intangible assets 14 14 19 27 31 TTM EBITDA 13 11 37 41 14 Add back: Change in fair value of contingent consideration earnout liabilities (1) 4 2 (3) (3) Non-cash equity-based compensation expense - - - 2 - Impairments of intangible assets - - - 6 6 Loss on assets held for sale - - - - 29 Acquisition-related transaction expenses 12 12 6 7 6 Fair value purchase accounting adjustment for deferred revenue - - 1 - - Investments made in the development of new business lines 1 2 - 1 - Restructuring expenses - - 2 5 11 TTM Adjusted EBITDA 25 29 48 59 63 Add: Impact of Fresh 5 2 - - - Impact of KBK - 8 - - - Impact of Embrace - - 2 - - Impact of Kingsbridge - - - 3 - TTM Pro forma adjusted EBITDA 30$ 40$ 50$ 62$ 63$ Note: Pro forma adjusted EBITDA includes the earnings of acquired businesses for the period of time over the previous 12 months that the businesses were not owned by White Mountains.
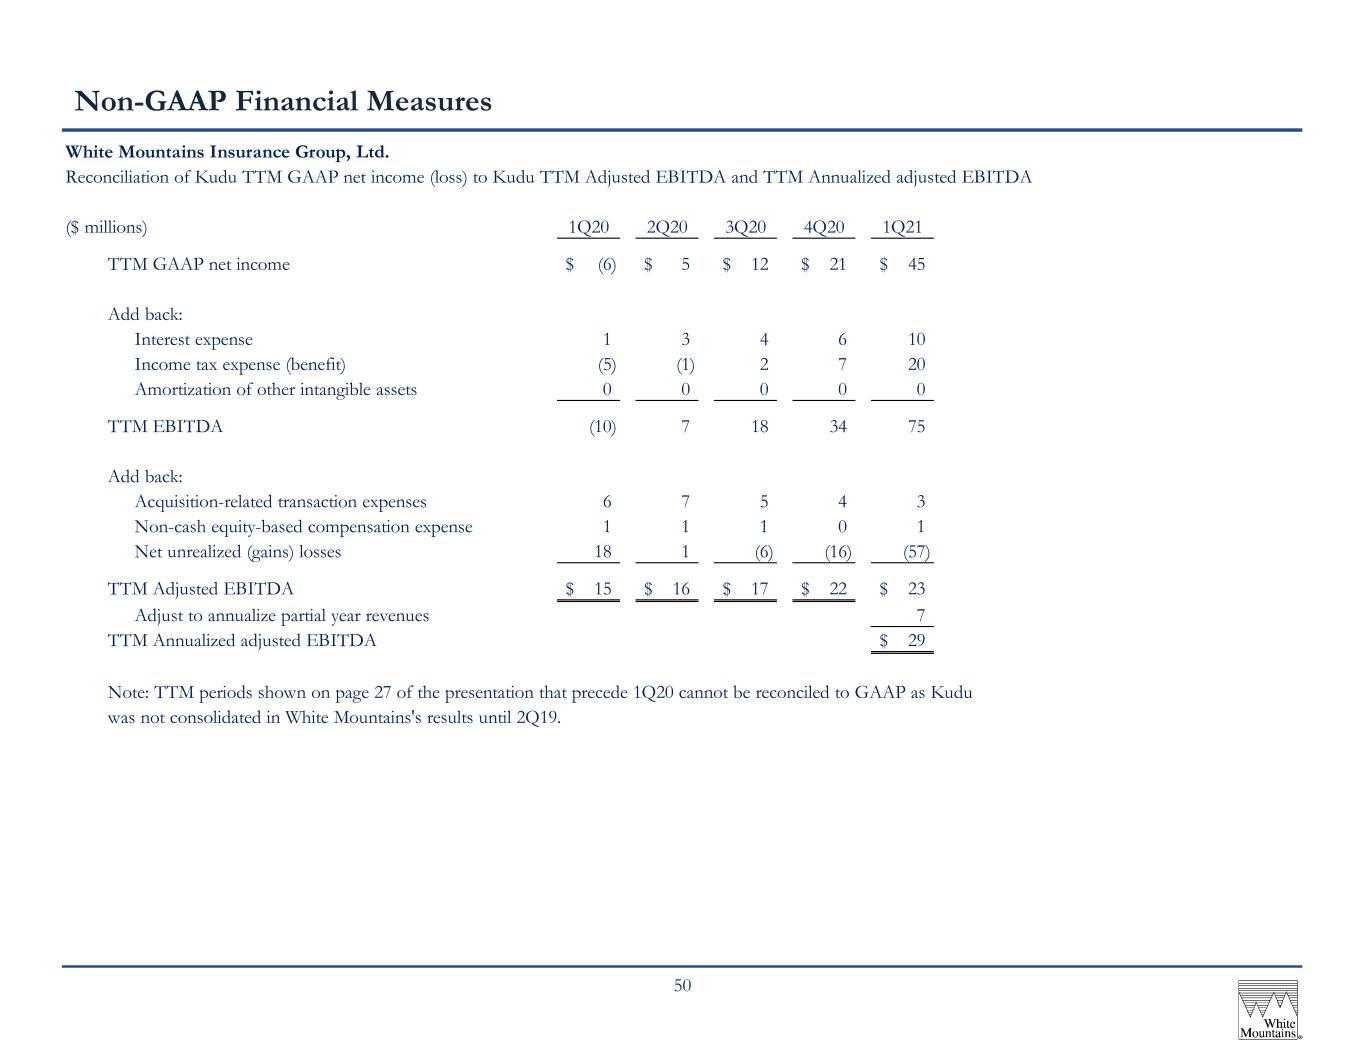
50 Non-GAAP Financial Measures White Mountains Insurance Group, Ltd. Reconciliation of Kudu TTM GAAP net income (loss) to Kudu TTM Adjusted EBITDA and TTM Annualized adjusted EBITDA ($ millions) 1Q20 2Q20 3Q20 4Q20 1Q21 TTM GAAP net income (6)$ 5$ 12$ 21$ 45$ Add back: Interest expense 1 3 4 6 10 Income tax expense (benefit) (5) (1) 2 7 20 Amortization of other intangible assets 0 0 0 0 0 TTM EBITDA (10) 7 18 34 75 Add back: Acquisition-related transaction expenses 6 7 5 4 3 Non-cash equity-based compensation expense 1 1 1 0 1 Net unrealized (gains) losses 18 1 (6) (16) (57) TTM Adjusted EBITDA 15$ 16$ 17$ 22$ 23$ Adjust to annualize partial year revenues 7 TTM Annualized adjusted EBITDA 29$ Note: TTM periods shown on page 27 of the presentation that precede 1Q20 cannot be reconciled to GAAP as Kudu was not consolidated in White Mountains's results until 2Q19.
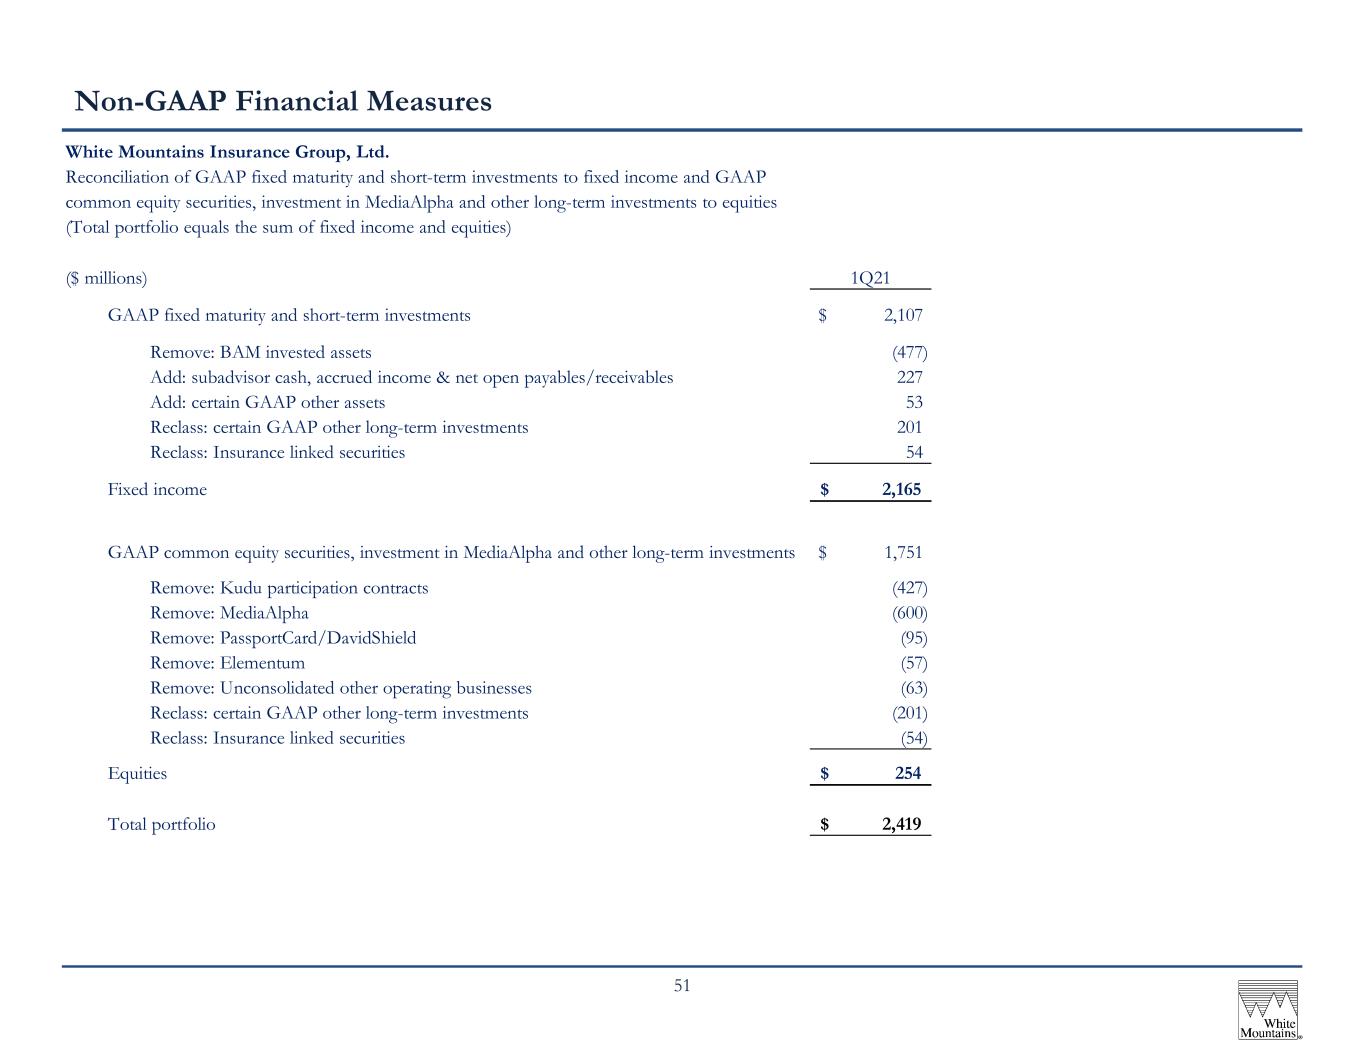
51 Non-GAAP Financial Measures White Mountains Insurance Group, Ltd. Reconciliation of GAAP fixed maturity and short-term investments to fixed income and GAAP common equity securities, investment in MediaAlpha and other long-term investments to equities (Total portfolio equals the sum of fixed income and equities) ($ millions) 1Q21 GAAP fixed maturity and short-term investments 2,107$ Remove: BAM invested assets (477) Add: subadvisor cash, accrued income & net open payables/receivables 227 Add: certain GAAP other assets 53 Reclass: certain GAAP other long-term investments 201 Reclass: Insurance linked securities 54 Fixed income 2,165$ GAAP common equity securities, investment in MediaAlpha and other long-term investments 1,751$ Remove: Kudu participation contracts (427) Remove: MediaAlpha (600) Remove: PassportCard/DavidShield (95) Remove: Elementum (57) Remove: Unconsolidated other operating businesses (63) Reclass: certain GAAP other long-term investments (201) Reclass: Insurance linked securities (54) Equities 254$ Total portfolio 2,419$

52 Non-GAAP Financial Measures White Mountains Insurance Group, Ltd. Reconciliation of GAAP common equity securities, investment in MediaAlpha and other long-term investments to equities and equity exposure ($ millions) 1Q21 Numerator GAAP common equity securities, investment in MediaAlpha and other long-term investments 1,751$ Remove: Kudu participation contracts (427) Remove: MediaAlpha (600) Remove: PassportCard/DavidShield (95) Remove: Elementum (57) Remove: Unconsolidated other operating businesses (63) Reclass: Certain GAAP other long-term investments (201) Reclass: Insurance linked securities (54) Equities 254 Add: Kudu participation contracts 427 Add: MediaAlpha 600 Equity exposure numerator 1,282$ Denominator Common shareholders' equity 3,826$ Non-controlling interest in Ark 211 Time value of money discount on BAM surplus notes [a] (138) HG Global's unearned premium reserve [a] 195 HG Global's net deferred acquisition costs [a] (54) Adjusted shareholders' equity 4,040$ GAAP common equity securities, investment in MediaAlpha and other long term investments exposure 46% Equity exposure 32% [a] Amount reflects White Mountains's preferred share ownership of HG Global of 97%.

53 Non-GAAP Financial Measures White Mountains Insurance Group, Ltd. Reconciliation of GAAP investment returns to total return on investment portfolio, fixed income return and equity return (returns in USD) 2019 2020 1Q21 GAAP total return on investment portfolio 20.4% 31.9% -0.3% Remove: BAM invested assets 2.3% -0.2% 0.2% Remove: Kudu participation contracts -0.2% -1.6% -0.7% Remove: MediaAlpha -7.8% -29.4% 1.2% Remove: PassportCard/DavidShield, Elementum and unconsolidated other operating businesses 1.5% 2.6% 0.0% All other 0.1% 0.2% -0.3% Total return on investment portfolio 16.3% 3.5% 0.1% GAAP fixed maturity and short-term investment return 6.1% 4.9% -1.0% Remove: BAM invested assets 0.1% 0.0% 0.1% Reclass: certain GAAP other long-term investments & insurance linked securities 0.0% -0.1% 0.1% All other 0.0% 0.0% 0.1% Fixed income return 6.2% 4.8% -0.7% GAAP common equity securities, investment in MediaAlpha and other long-term investments return 36.9% 80.0% 0.8% Remove Kudu participation contracts 1.2% -5.3% 0.9% Remove: MediaAlpha -18.9% -99.5% 6.3% Remove: PassportCard/DavidShield, Elementum and unconsolidated other operating businesses 6.1% 21.7% -0.2% Reclass: certain GAAP other long-term investments & insurance linked securities 0.5% 4.9% -0.8% All other 0.3% 0.9% 0.0% Equity return 26.1% 2.7% 7.0%
