Attached files
| file | filename |
|---|---|
| 8-K - 8-K - SoFi Technologies, Inc. | ipoe-super8xk.htm |
| EX-99.3 - EX-99.3 - SoFi Technologies, Inc. | exhibit993-super8xk.htm |
| EX-99.1 - EX-99.1 - SoFi Technologies, Inc. | exhibit991-super8xk.htm |
| EX-21.1 - EX-21.1 - SoFi Technologies, Inc. | exhibit211-super8xk.htm |
| EX-16.1 - EX-16.1 - SoFi Technologies, Inc. | exhibit161-super8xk.htm |
| EX-10.8 - EX-10.8 - SoFi Technologies, Inc. | exhibit108-super8xk.htm |
| EX-10.6 - EX-10.6 - SoFi Technologies, Inc. | exhibit106-super8xk.htm |
| EX-10.5 - EX-10.5 - SoFi Technologies, Inc. | exhibit105-super8xk.htm |
| EX-10.4 - EX-10.4 - SoFi Technologies, Inc. | exhibit104-super8xk.htm |
| EX-10.2 - EX-10.2 - SoFi Technologies, Inc. | exhibit102-super8xk.htm |
| EX-10.1 - EX-10.1 - SoFi Technologies, Inc. | exhibit101-super8xk.htm |
| EX-3.2 - EX-3.2 - SoFi Technologies, Inc. | exhibit32-super8xk.htm |
| EX-3.1 - EX-3.1 - SoFi Technologies, Inc. | exhibit31-super8xk.htm |
Exhibit 99.2
MANAGEMENT’S DISCUSSION AND ANALYSIS OF FINANCIAL CONDITION AND RESULTS OF OPERATIONS
Unless the context otherwise requires, all references in this section to “we”, “us” or “our” refer to the combined business of Social Finance, Inc. and its consolidated subsidiaries (collectively, “SoFi”) prior to closing the business combination pursuant to the business combination agreement by and among SoFi, Social Capital Hedosophia Holdings Corp. V (“SCH”) and Plutus Merger Sub Inc. (the “Business Combination”), as further described in Note 2 to the accompanying unaudited condensed consolidated financial statements included elsewhere in this Current Report on Form 8-K.
The following discussion and analysis provides information that management believes is relevant to an assessment and understanding of our consolidated results of operations and financial condition. You should read this discussion and analysis in conjunction with the accompanying unaudited condensed consolidated financial statements and notes thereto included elsewhere in this Current Report on Form 8-K and our unaudited pro forma financial information as of and for the three months ended March 31, 2021 included elsewhere in this Current Report on Form 8-K, of which this Management’s Discussion and Analysis of Financial Condition and Results of Operations forms a part. Certain amounts may not foot due to rounding. This discussion and analysis contains forward-looking statements and involves numerous risks and uncertainties, including, but not limited to, those described under the sections entitled “Risk Factors” and “Cautionary Note Regarding Forward-Looking Statements” included elsewhere in this Current Report on Form 8-K and in the final prospectus and definitive proxy statement, dated May 7, 2021 (the “Proxy Statement/Prospectus”) and filed with the Securities and Exchange Commission. We assume no obligation to update any of these forward-looking statements. Actual results may differ materially from those contained in any forward-looking statements.
Business Overview
We are a member-centric, one-stop shop for digital financial services that allows members to borrow, save, spend, invest and protect their money. Our mission is to help our members achieve financial independence in order to realize their ambitions. To us, financial independence does not mean being wealthy, but rather represents the ability of our members to have the financial means to achieve their personal objectives at each stage of life, such as owning a home, having a family, or having a career of their choice — more simply stated, to have enough money to do what they want. We were founded in 2011 and have developed a suite of financial products that offers the speed, selection, content, and convenience that only an integrated digital platform can provide. In order for us to achieve our mission, we have to help people get their money right, which means providing them with the ability to borrow better, save better, spend better, invest better and protect better. Everything we do today is geared toward helping our members “Get Your Money Right” and we strive to innovate and build ways for our members to achieve this goal.
Our three reportable segments and their respective products as of March 31, 2021 were as follows:
| Lending | Financial Services | Technology Platform | ||||||||||||
• Student Loans (in school and student loan refinancing) • Personal Loans • Home Loans | • SoFi Money • SoFi Invest (1) • SoFi Relay • SoFi Credit Card • SoFi At Work • SoFi Protect • Lantern Credit | • Technology Platform Services (Galileo) | ||||||||||||
__________________
(1)Our SoFi Invest service is comprised of three products: active investing accounts, robo-advisory accounts and cryptocurrency accounts.
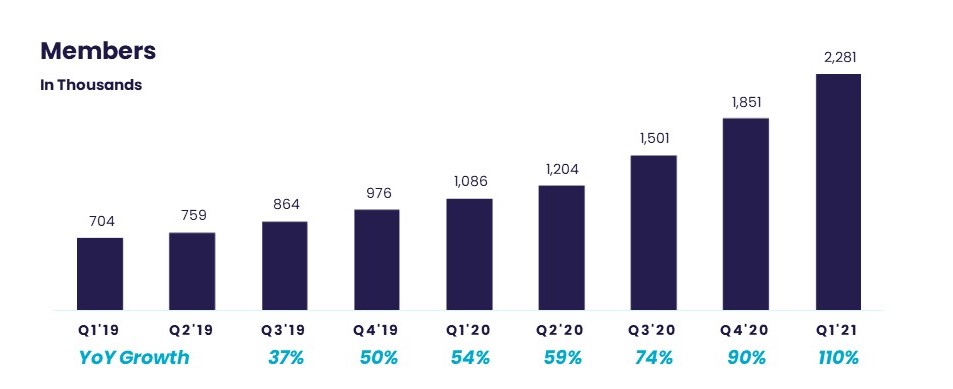
We refer to our customers as “members”. We define a member as someone who has a lending relationship with us through origination or servicing, opened a financial services account, linked an external account to our platform, or signed up for our credit score monitoring service. Once someone becomes a member, they are always considered a member unless they violate our terms of service given our members have continuous access to our CFPs, our career advice services, our member events, all of our content, educational material, news, tools and calculators at no cost to the member. Additionally, our mobile app and website have a member home feed that is personalized and delivers content to a member about what they must do that day in their financial life, what they should consider doing that day in their financial life, and what they can do that day in their financial life. Since our inception through March 31, 2021, we have served approximately 2.3 million members who have used approximately 3.2 million products on the SoFi platform and have experienced accelerating year-over-year member growth for the past seven consecutive quarters. We believe we are in the early stages of the digital transformation of financial services and,
as a result, have a substantial opportunity to continue to grow our member base and increase the number of products that our members use on the SoFi platform.
We offer our members a suite of financial products and services, enabling them to borrow, save, spend, invest and protect within one integrated platform. Our aim is to create a best-in-class, integrated financial services platform that will generate a virtuous cycle whereby positive member experiences will lead to more products adopted per member and enhanced profitability for each additional product by lowering overall member acquisition costs and increasing the lifetime value of our members. We refer to this virtuous cycle as our “Financial Services Productivity Loop.”
We believe that developing a relationship with our members and gaining their trust is central to our success as a financial services platform. Moreover, we believe that some of the current frictions faced by other financial institutions are caused by a disjointed and non-seamless product experience, a lack of digital acquisition, subpar mobile web products instead of digital native apps and incomplete product offerings to meet a customer’s holistic financial needs. Through our mobile technology and continuous effort to improve our financial services products, we are seeking to build a financial services platform that members can access for all of their financial services needs.
We believe we are in the early stages of realizing the benefits of the Financial Services Productivity Loop, as increasing numbers of our members are using multiple products on our platform. From the first quarter of 2020 through the first quarter of 2021, the number of our members who have used more than one of our product offerings grew 171% from approximately 216,000 to approximately 585,000.
In addition to benefiting our members, our products and capabilities are also designed to appeal to enterprises, such as financial services institutions that subscribe to our enterprise services called SoFi At Work, and have become interconnected with the SoFi platform. While these enterprises are not considered members, they are important contributors to the growth of the SoFi platform, and also have their own constituents who might benefit from our products in the future. Further, Galileo has over 69 million total accounts on its platform (excluding SoFi accounts). Galileo started contributing new accounts to the SoFi ecosystem during the second quarter of 2020.
While we primarily operate in the United States, in 2020, we expanded into Hong Kong with our acquisition of 8 Limited, an investment business. Additionally, with the acquisition of Galileo in May 2020, we gained clients in Mexico.
National Bank Charter. A key element of our long-term strategy is to secure a national bank charter, which we believe would enhance the profitability of our Lending segment and SoFi Money. While we currently rely on third-party bank holding companies to provide banking services to our members, securing a national bank charter would, among other things, allow us to provide members and prospective members broader and more competitive options across their financial services needs, including deposit accounts, and lower our cost to fund loans (by utilizing our SoFi Money members’ deposits to fund our loans), which would enable us to offer lower interest rates on loans to members as well as offer higher interest rates on SoFi Money accounts, all while continuing not to charge non-interest based fees.
2
In October 2020, we received preliminary, conditional approval from the OCC for our application for a national bank charter. Final OCC approval is subject to a number of preopening requirements. In March 2021, we entered into an agreement to acquire Golden Pacific Bancorp, Inc., a bank holding company (“Golden Pacific”), and its wholly-owned subsidiary, Golden Pacific Bank, National Association, a national bank (“Golden Pacific Bank”), for a total cash purchase price of $22.3 million. The acquisition is subject to regulatory approval, including approval from the OCC of a revised business plan for the acquiree national bank, and approval from the Federal Reserve to become a bank holding company and for a change of control, and other customary closing conditions. In March 2021, we submitted an application to the Federal Reserve to become a bank holding company. The application review process is ongoing.
In order to be compliant with all applicable regulations, to operate to the satisfaction of the banking regulators, and to successfully execute our business plan for the bank, SoFi has been building out the required infrastructure to run the bank and to operate as a bank holding company. This effort spans our people and organization, technology, marketing/product management, risk management, compliance, and control functions. We have invested and expect to continue to invest substantial time, money and human resources towards bank readiness, and towards the regulatory approval process. During the three months ended March 31, 2021, we incurred direct costs associated with securing a national bank charter of $5.5 million, which consisted primarily of professional fees and compensation and benefits costs. While largely dependent on the timing of the regulatory approvals, we estimate that we could incur additional costs of approximately $6 million to $10 million through the remainder of the regulatory approval process.
IPO Investment Center. Through our registered broker-dealer subsidiary, SoFi Securities LLC, we are licensed to underwrite securities offerings. In March 2021, we launched an IPO investment center that may allow members with a SoFi active Invest account that has at least $3,000 in total account value across SoFi Invest (inclusive of automated and active investing) to invest in initial public offerings before they trade on an exchange. As we receive mandates for any such initial public offerings, and as such offerings are registered with the SEC and then price and close, we serve as an underwriter or member of the selling group with respect to such offerings, which may include offerings involving SCH Sponsor V LLC or its affiliates. In the event the conditions above are satisfied, we expect to generate revenues in future periods for our IPO investment center activities in the form of underwriting fees.
Our Reportable Segments
We conduct our business through three reportable segments: Lending, Financial Services and Technology Platform. Below is a discussion of our segments and their corresponding products.
Lending Segment
Through our Lending segment, we offer student loans, personal loans, home loans and related services.
Student Loans. We primarily operate in the student loan refinance space, with a focus on super-prime graduate school loans. Subsequently, we expanded into “in-school” lending, which allows members to borrow funds while they attend school. We offer flexible loan sizes and repayment options, as well as competitive rates, on our student loan refinancing and in-school loan products.
Personal Loans. We primarily originate personal loans for debt consolidation purposes and home improvement projects. We offer fixed and variable rate loans with no origination fees and flexible repayment terms, such as unemployment protection. There are other personal loan purposes or channels that we have not aggressively pursued, which we believe could represent opportunities for us in the future.
Home Loans. We have historically offered agency and non-agency loans for members purchasing a home or refinancing an existing mortgage. On our home loan products, we offer competitive rates, flexible down-payment options for as little as 5% and educational tools and calculators.
A key element of our underwriting process is the ability to facilitate risk-based interest rates that are appropriate for each loan. Using SoFi’s proprietary risk models, we project quarterly loan performance results, including expected losses and prepayments. The outcome of this process helps us determine a more data-driven, risk-based interest rate that we can offer our members.
SoFi has built a comprehensive underwriting process across each lending product that is focused on willingness to pay (credit), ability to pay (income verification), and capacity to pay (debt service in relation to other loans). Our student loan and
3
personal loan underwriting models consider credit reports, industry credit and bankruptcy prediction models, custom credit assessment models, and debt capacity analysis, as indicated by borrower free cash flow (defined as borrower monthly net income less revolving and installment payments less housing payments). Our minimum FICO requirements are 650 for student loan refinancing, 680 for in-school loans (primary or co-signer) and 680 for personal loans. Home loans originated by SoFi that are agency conforming loans are subject to Automated Underwriting System credit, debt service, and collateral eligibility established by Fannie Mae. Existing members generally experience a higher approval rate than new members, subject to the member being in good standing on their existing products. Home loans originated by SoFi that are non-agency are subject to SoFi Home Loans credit criteria, including minimum tri-bureau credit score, established credit history requirements, income verification, as well as maximum qualified mortgage limits on debt to income service and caps on LTV (loan to value) based on an accredited appraisal. We also leverage SoFi data to allow existing members to have a streamlined application process through automation.
Our lending business is primarily a gain-on-sale model, whereby we originate loans and recognize a gain from these loans when we sell them into either our whole loan or securitization channels. We sell our whole loans primarily to large financial institutions, such as bank holding companies, typically at a premium to par, and in excess of our costs to originate the loans. Our loan premiums fluctuate from time to time based on benchmark rates and credit spreads, and we are not guaranteed a gain on all or any of our loan sales. When securitizing loans, we first isolate the underlying loans in a trust and then sell the beneficial interests in the trust to a bankruptcy-remote entity. In securitization transactions that do not qualify for sale accounting, the related assets remain on our balance sheet and cash proceeds received are reported as liabilities, with related interest expense recognized over the life of the related borrowing. In securitization transactions that qualify for sale accounting, we typically have insignificant continuing involvement as an investor. In the case of both whole loan sales and securitizations, we also typically continue to retain servicing rights following transfer. We, therefore, view servicing as an integral component of the Lending segment.
Prior to selling our loans, we hold them on our balance sheet at fair value and rely upon warehouse financing arrangements. Net interest income, which we define as the difference between the earned interest income and interest expense to finance loans, is a key component of the profitability of our Lending segment.
With the exception of certain of our home loans, we retain servicing rights to our originated loans, and believe our servicing function is an important asset because of the connection to the member it affords us throughout the life of the loan. We directly service all of the personal loans that we originate. We act as master servicer for, and rely on sub-servicers to directly service, all of our student loans, credit cards and FNMA conforming home loans. We believe this ongoing relationship with our members enhances the effectiveness of our Financial Services Productivity Loop by increasing member touchpoints and driving the number of products per member.
Furthermore, our platform supports the full transaction lifecycle, including credit application, underwriting, approval, funding and servicing. Through data derived at loan origination and throughout the servicing process, SoFi has life of loan performance data on each loan in its ecosystem, which provides a meaningful data asset.
Financial Services Segment
Our Financial Services segment consists of cash management, investment and other related services.
SoFi Money
Through SoFi Money, a digital, mobile cash management experience for our members, we invest in member acquisition and marketing activities to attract new members, including by offering rewards to incentivize prospective members to house their cash management activities on the SoFi platform.
We generate interest income from deposits sitting in the various Member Banks, which is reduced by the interest fees paid to members. We also earn payment network fees on member expenditures via SoFi-branded debit cards issued by one of our member bank holding companies (each a “Member Bank”). Payment network fees are reduced by direct fees payable to card associations and the Member Bank.
The Bancorp Bank (“Bancorp”) is the issuer of all SoFi Money debit cards and sponsors access to debit networks for payment transactions, funding transactions and associated settlement of funds under a sponsorship agreement with SoFi Securities. Additionally, Bancorp provides sponsorship and support for ACH, check, and wire transactions along with associated funds settlement. The SoFi Money product also utilizes a sweep administrator, UMB Bank, National Association
4
(“UMB”), to sweep funds to and from the SoFi Money program banks, as necessary, under a program broker agreement between SoFi Securities and UMB and program account and program bank agreements with a variety of sweep program banks. The SoFi Securities agreement with Bancorp provides for receipt by Bancorp of program revenue and transaction fees, and is subject to a minimum monthly card activity fee. The agreement with Bancorp is terminable by SoFi Securities with 120 days prior notice. The program broker agreement between SoFi Securities and UMB provides for one-year terms that automatically renew and is terminable by either party with at least 90 days’ written notice prior to the end of the current term. The program account agreements and program bank agreements between SoFi Securities, UMB and the sweep banks provide for the rate of interest payable on the balances in a member’s SoFi Money account and include certain maximum transfer requirements on transfers. These arrangements are generally terminable upon termination of SoFi Securities’ sweep arrangement with UMB.
SoFi Invest
We also provide introductory brokerage services to our members, and have invested significantly in creating SoFi Invest, a streamlined mobile investing experience through which we offer multiple ways to invest and give members access to active investing, robo-advisory and cryptocurrency services. While we do not charge trading fees, other than for cryptocurrency trading, our platform benefits from increasing assets under management as we generate interest income on cash balances that we hold, and we also earn brokerage revenue through share lending and pay for order flow arrangements. We also believe there are opportunities to generate incremental future revenue through margin lending and options. Through our acquisition of 8 Limited in 2020, we expanded SoFi Invest into the Hong Kong market. With respect to our cryptocurrency trading activities, which we initiated in 2019, we do not hold or store members' cryptocurrencies, but instead rely on a third party custodian, and we hold an immaterial amount of cryptocurrencies in order to facilitate paying new cryptocurrency member bonuses when members initiate their first cryptocurrency trade. We do this for member convenience to facilitate a seamless payment of cryptocurrency. Historically, cryptocurrency buy and sell volume has had an immaterial impact on our results of operations.
Furthermore, our innovative “stock bits” feature allows members to purchase fractional shares in various companies. Through our “stock bits” offering, members with SoFi Invest active brokerage accounts may buy or sell fractional shares in a variety of equity securities. Members can place orders in dollars or shares. During the course of a trading day, all member orders are consolidated into a single order for each equity security, which may be a sell or buy order. These fractional orders are rounded up to the next whole share and executed as a market order prior to market close on a standard trading day. Following market close, we allocate the trades to each individual member. We maintain an insignificant stock inventory of between two and ten shares for each issuer for whose securities we provide fractional trading in order to facilitate “stock bits” trades. This stock inventory is recorded within other assets in our balance sheet and was not material as of any of the balance sheet dates presented in the accompanying unaudited condensed consolidated financial statements included elsewhere in this Current Report on Form 8-K, nor were our revenues earned and expenses incurred associated with the “stock bits” feature material during any of the income statement periods presented.
Other
In August 2020, we began offering the SoFi Credit Card, which we expanded to a broader market in the fourth quarter of 2020. Additionally, we developed SoFi Relay within the SoFi mobile application, a personal finance management product which allows members to track all of their financial accounts in one place and utilize credit score monitoring services. Further, we leverage our technology and information infrastructure to offer services to other enterprises, such as loan referrals and SoFi At Work, which is a platform we offer to enterprises that are looking for a seamless way to provide financial benefits to their employees, such as student loan payments made on their employees’ behalf, for which we earn a fee. We have also developed a financial services marketplace platform branded Lantern Credit to help applicants that do not qualify for SoFi products with alternative products, as well as providing a product comparison experience.
We earn revenues in connection with our Financial Services segment through various partnerships and our SoFi Money and SoFi Invest products in the following ways:
•Referral fees: Through strategic partnerships, we earn a specified referral fee in connection with referral activity we facilitate through our platform, which is not directly tied to a particular Financial Services product. The referral fee is paid to us by third-party partners that offer services to end users who do not use one of our product offerings, but who were referred to the partners through our platform. As such, the third-party enterprise partners are our customers in these referral arrangements.
•Payment network fees: We earn payment network fees, which primarily constitute interchange fees, from our SoFi Money product. These fees are remitted by merchants and are calculated by multiplying a set fee percentage (as
5
stipulated by the debit card payment network) by the transaction volume processed through such network. We arrange for performance by a card association and the bank issuer to enable certain aspects of the SoFi branded transaction card process. We enter into contracts with both parties that establish the shared economics of SoFi Money branded transaction cards. Historically, these fees have not been a significant portion of total net revenue.
•Enterprise service fees: These fees are earned in connection with services we provide to enterprise partners to facilitate transactions for the benefit of their employees, such as 529 plan contributions or student loan payments through our At Work product, which represents our single performance obligation in the arrangements. Historically, these fees have been an immaterial component of our total net revenue.
•Brokerage fees: We earn brokerage fees from our share lending and pay for order flow arrangements related to our SoFi Invest product (for which Apex serves as principal), exchange conversion services and digital assets activity. In our share lending arrangements and pay for order flow arrangements with Apex, we do not oversee the execution of the transactions by our members, but benefit through a negotiated multi-year revenue sharing arrangement, since our members' brokerage activity drives the share lending and pay for order flow volume. Apex connects with market makers (order flow) and institutions (share lending) to facilitate the service and is responsible for execution. Apex carries inventory risk with the share lending program and ultimately is responsible for successful order routing to market makers that trigger the pay for order flow revenue. Apex sets the gross price and negotiates with market makers and institutions as part of our order flow and share lending arrangements. We have no discretion or visibility into this pricing and, instead, negotiate a net fee for our order flow and share lending arrangements, which is settled with Apex rather than with market makers or other institutions. In our digital assets arrangements, our fee is calculated as a negotiated percentage of the transaction volume. In our exchange conversion arrangements, we earn fees for exchanging one currency for another. Historically, these fees have not been a significant portion of our total net revenue. Our arrangements with Apex are governed by an agreement which contains certain minimum monthly requirements and which is terminable by either party upon notice. Although we no longer have an equity method investment in Apex as of the balance sheet date, Apex will continue to provide the services under this agreement.
•Net interest income: Our SoFi Invest and SoFi Money products also generate net interest income based on the cash balances held in these accounts. Historically, this income has not been a significant portion of our total net revenue.
Technology Platform Segment
Our Technology Platform segment consists of Galileo, and historically included our minority ownership of Apex, a technology-enabled provider of investment custody and clearing brokerage services, in which we invested in December 2018. During January 2021, the seller exercised its call rights on our Apex investment. Therefore, we did not recognize any Apex equity method investment income during the three months ended March 31, 2021, nor will we have such equity method investment income in future periods. Additionally, we measured the carrying value of the Apex equity method investment as of December 31, 2020 equal to the call payment that we received in January 2021. Although following the seller call we no longer have an equity method investment in Apex or recognize equity method investment income, Apex continues to provide investment custody and clearing services for SoFi Invest, including for our brokerage activities, under a multi-year revenue sharing arrangement.
In May 2020, we acquired Galileo, a provider of technology platform services to financial and non-financial institutions. Through Galileo, we provide services through a suite of program, event and authorization application programming interfaces for financial and non-financial institutions. Additionally, Galileo provides vertical integration benefits with SoFi Money. In addition to growth in its U.S. client base, Galileo is increasingly focused on international opportunities, including in Latin America and Asia.
We earn revenue on Galileo’s platform in the following two ways:
•Technology Platform Fees: The platform fees we earn are based on access to the platform and are specific to the type of transaction. For example, we offer “event pricing”, which includes a specific charge for an account setup, an active account on file, use of Program, Event and Authorization Application Programming Interfaces (“APIs”), card activation, authorizations and processing, and card loads. In addition, we offer “partner pricing”, which is the back-end support we provide to Galileo’s clients, such as live agent customer service, chargeback and fraud analysis and credit bureau reporting, all within one integrated solution for our clients.
6
•Program Management Fees: Also referred to as “card program fees”, these transaction fees are generated from the creation and management of card programs issued by banks and requested by enterprise partners. In these arrangements, Galileo performs card management services and the revenue stems from the payment network and card program fees generated by the card program. This revenue is reduced by association and bank issuer costs, and a revenue share passed along to the enterprise partner that markets the card program. We categorize this class of revenue as payment network fees.
Galileo typically enters into multi-year service contracts with its clients. The contracts provide for a variety of integrated platform services, which vary by client and are generally either non-cancellable or cancellable with a substantive payment. Pricing structures under these contracts are typically volume-based, or a combination of activity- and volume-based, and payment terms are predominantly monthly in arrears. Most of Galileo’s contracts contain minimum monthly payments with agreed upon monthly service levels and may contain penalties if service levels are not met.
COVID-19 Pandemic
Although the long-term effects of the novel coronavirus (“COVID-19”) pandemic globally and in the United States remain unknown, we are seeing signs of recovery from the impacts of the pandemic due to the increased availability of vaccinations and evolving government stimulus programs, particularly in the U.S., including businesses and schools reopening, improved employment metrics, and increased consumer spending and confidence levels. Through our business continuity program, which was expanded in response to the COVID-19 pandemic, we continue to monitor the recommendations and protocols published by the U.S. Centers for Disease Control and Prevention (“CDC”) and the World Health Organization, as well as state and local governments, and to communicate with employees on a regular basis to provide updated information and corporate policies for a safe return to the office. Notably, in May 2021, the CDC issued guidance advising that people fully vaccinated against COVID-19 do not need to wear masks or practice social distancing indoors or outdoors, except under certain circumstances. As the guidance issued by governments and regulators continues to evolve, we will likewise continue to assess the impacts on us and to adjust our business operations, policies and procedures as needed to best accommodate our ecosystem of members and prospective members, Member Banks and employees. See “— Key Factors Affecting Operating Results — Industry Trends and General Economic Conditions” for discussion of the impacts to our business of measures taken in response to the economic and financial effects of the COVID-19 pandemic.
Since the onset of the COVID-19 pandemic, we have continued to adapt our response and strategies to navigate uncertain economic, workplace and market conditions. We have taken a number of measures to proactively support our members, applicants for new loans, employees and investors.
Members: We have and will continue to approach hardship programs from a member-first perspective. In addition to our Unemployment Protection Plan, which remains available to all eligible members, we launched comprehensive forbearance programs that provided meaningful Federal Emergency Management Agency (“FEMA”) disaster hardship relief. Starting in March 2020, we made available a web-enabled self-service forbearance request process to enable members who faced unemployment, reduction in income or general economic uncertainty to defer their loan payment for an initial period with options to extend. For student loans and personal loans, when a forbearance request was accepted, interest on the loan continued to accrue and is amortized over the remaining life of the loan, and the maturity date of the loan is extended for the length of the deferment. Home loans are subject to FNMA servicing guidelines, which provide certain options to the borrower. For home loans, after the forbearance period has ended, members are required to repay the amount that was suspended, but are not required to repay the amount all at once, though they have that option. Other potential options allow members to make an additional payment each month for a period of time until the past due amounts are repaid, move the deferred amount to the end of the loan term, or set up a loan modification, if they are eligible. In all instances, interest continues to accrue during the forbearance period. In response to the hardship brought on by the COVID-19 pandemic, we also deferred certain collection recovery activities, while taking every opportunity to work with our members to find a path to repayment. We discontinued enrollment in our COVID-19 forbearance programs, which were designed to be temporary in nature, for personal loans and student loans on March 31, 2021 and April 30, 2021, respectively. Subject to eligibility, members may participate in other customary hardship programs.
7
The following table presents information about our loan products that were in active short-term hardship relief or payment deferral as of March 31, 2021 due to the COVID-19 pandemic or that were classified as performing (current or paid in full) as of March 31, 2021 after exiting payment deferral due to the COVID-19 pandemic:
| As of March 31, 2021 | Student Loans | Personal Loans | Home Loans | |||||||||||||||||
| Active short-term hardship relief or payment deferral due to COVID-19 pandemic | ||||||||||||||||||||
| Number of loans | 3,450 | 12 | 108 | |||||||||||||||||
| Aggregate balance ($ in millions) | $ | 249.4 | $ | 0.3 | $ | 31.0 | ||||||||||||||
| Classified as performing after exiting payment deferral due to COVID-19 pandemic | ||||||||||||||||||||
| Number of loans ever enrolled in COVID-19 forbearance program | 38,771 | 44,046 | 317 | |||||||||||||||||
| Number of loans enrolled classified as performing at measurement date | 33,436 | 37,692 | 212 | |||||||||||||||||
| Aggregate balance of loans ever enrolled in COVID-19 forbearance program ($ in billions) | $ | 2.90 | $ | 1.21 | $ | 0.07 | ||||||||||||||
| Aggregate balance of loans enrolled classified as performing at measurement date ($ in billions) | $ | 2.53 | $ | 1.02 | $ | 0.04 | ||||||||||||||
During the first quarter of 2021, we experienced lower enrollment rates into hardship programs across all loan products, indicating that our members are regaining financial confidence as we continue the economic recovery from the pandemic. Additionally, as indicated in the table above, those members who were distressed at the time of enrolling in a hardship program have demonstrated continued strong resiliency, with 86%, 86% and 67% of personal loan, student loan and home loan accounts, respectively, either current or paid-in-full as of March 31, 2021. Based on the combination of these factors, the number of loans in active short-term hardship relief or payment deferral due to the pandemic decreased by 38% as of March 31, 2021 compared to December 31, 2020.
Applicants: In response to deteriorating economic conditions and market uncertainty amid the pandemic, in 2020 we proactively executed our recession readiness credit risk strategies. This included introducing elevated credit eligibility requirements for personal loans, thorough validation of income and income continuity, and limiting loan amounts. We expected originations incorporating credit risk strategy changes, when stressed using external loss forecasting models with stressed econometric scenarios, to perform similarly to previous vintages. Our student loan refinance business is substantially comprised of applicants refinancing federal loans and/or existing private student loans. We developed objective content and calculators to educate applicants about the Federal relief available to them through the CARES Act and subsequent extensions, which enabled them to maximize their savings. Throughout the first quarter of 2021, we eased our elevated credit eligibility requirements for personal loans through phases of reopening.
Employees: In order to safeguard the health and safety of our team members and their families, we virtualized our entire organization beginning in March 2020, enabling all of our team members to work virtually. We have taken a proactive approach to enable ongoing communication and engagement. In February 2021, we announced that our employees may work with their managers to determine the best place for them to work from, including continuing to work virtually. Additionally, based on feedback we received from an employee engagement survey, we intend to move forward with a pilot reopening of our U.S. offices in the summer of 2021 on a voluntary basis. We will continue to align our protocols with evolving CDC, state and local guidelines to continue to safeguard the health and safety of our team members and their families. We are proud to offer these flexible work arrangements to our employees.
Investors: Durability of, and confidence in, the performance of our originated asset classes has never been more important. Despite uncertain market and economic conditions, our serviced assets continue to perform at historic low delinquency and loss metrics for our Company, even when adjusted for forbearance. The majority of our members have validated their income resiliency and have returned to making full or partial payments on their loan or have paid in full. We have identified members who have sustained hardships and we have worked constructively with the investor community to establish expanded loss mitigation tools to maximize recovery while providing empathy for distressed members. Our team has worked to provide greater transparency to our investor community through access to our Capital Markets and Risk Management team and by providing internal and external analytical and stress testing forecasts, which provide a range of economic scenarios that could manifest in performance of their owned assets. Investors continue to not only have demand for our assets, but have grown their demand for our assets in light of their demonstrated performance.
8
Delinquencies: Members enrolled in forbearance or hardship relief programs do not appear in delinquency metrics and are not subject to collection activity. Despite this, during any re-enrollment, SoFi works with members to determine when a short-term hardship becomes long-term, which requires differing solutions to ensure a member has the best chance for repayment success. At the onset of the COVID-19 pandemic, we provided online self-service opportunities to members to request initial relief and subsequently extend that short-term forbearance relief as needed (subject to approval). COVID-19 hardship relief was available to members that were current or delinquent at the time of request, although the majority of student loan and personal loan initial enrollments were members that were “current” at the time of enrollment. As indicated in the table above, the majority of members that entered COVID-19 hardship programs have exited such programs.
Liquidity: We took action to prepare for potential liquidity needs resulting from the COVID-19 pandemic by securing additional committed warehouse capacity in May 2020. We were able to manage these needs along with other liquidity needs of our business by relying on our strong liquidity position going into the crisis, having a deep and diversified portfolio of warehouse lenders, being proactive and forward looking as it related to anticipated liquidity risks and needs, and managing decisions conservatively with regard to loan origination growth and loan sales.
The COVID-19 pandemic had a significant impact on consumer spending and money management behavior that has, in turn, impacted our business. See “— Key Factors Affecting Operating Results — Industry Trends and General Economic Conditions” for more information.
We remain committed to serving our members, applicants and investors, while caring for the safety of our employees and their families. See “Risk Factors — COVID-19 Pandemic Risks” included elsewhere in this Current Report on Form 8-K for additional discussion of the risks and uncertainties associated with the repercussions of the COVID-19 pandemic.
9
Executive Overview
The following tables display key financial measures for our three reportable segments and our consolidated company that are used, along with our key business metrics, by management to evaluate our business, measure our performance, identify trends and make strategic decisions. Contribution profit (loss) is the primary measure of segment-level profit and loss reviewed by management and is defined as total net revenue for each reportable segment less expenses directly attributable to the corresponding reportable segment and, in the case of our Lending segment, less fair value adjustments attributable to assumption changes associated with our servicing rights and residual interests classified as debt. See “— Results of Operations”, “— Summary Results by Segment” and “— Non-GAAP Financial Measures” herein for discussion and analysis of these key financial measures.
| Three Months Ended March 31, | ||||||||||||||
($ in thousands) | 2021 | 2020 | ||||||||||||
Lending | ||||||||||||||
| Total interest income | $ | 81,547 | $ | 93,177 | ||||||||||
| Total interest expense | (29,770) | (47,516) | ||||||||||||
| Total noninterest income | 96,200 | 28,217 | ||||||||||||
| Total net revenue | 147,977 | 73,878 | ||||||||||||
Adjusted net revenue(1)(2) | 168,037 | 81,755 | ||||||||||||
Contribution profit(1) | 87,686 | 4,095 | ||||||||||||
Financial Services | ||||||||||||||
| Total interest income | 540 | 1,737 | ||||||||||||
| Total interest expense | (311) | (1,522) | ||||||||||||
| Total noninterest income | 6,234 | 1,939 | ||||||||||||
Total net revenue(1) | 6,463 | 2,154 | ||||||||||||
| Contribution loss | (35,519) | (26,983) | ||||||||||||
Technology Platform(3) | ||||||||||||||
| Total interest expense | (36) | — | ||||||||||||
| Total noninterest income | 46,101 | 997 | ||||||||||||
Total net revenue(1) | 46,065 | 997 | ||||||||||||
Contribution profit | 15,685 | 997 | ||||||||||||
Other(4) | ||||||||||||||
| Total interest income | 441 | 2,368 | ||||||||||||
| Total interest expense | (5,131) | (1,095) | ||||||||||||
| Total noninterest income | 169 | — | ||||||||||||
| Total net revenue (loss) | (4,521) | 1,273 | ||||||||||||
Consolidated | ||||||||||||||
| Total interest income | $ | 82,528 | $ | 97,282 | ||||||||||
| Total interest expense | (35,248) | (50,133) | ||||||||||||
| Total noninterest income | 148,704 | 31,153 | ||||||||||||
| Total net revenue | 195,984 | 78,302 | ||||||||||||
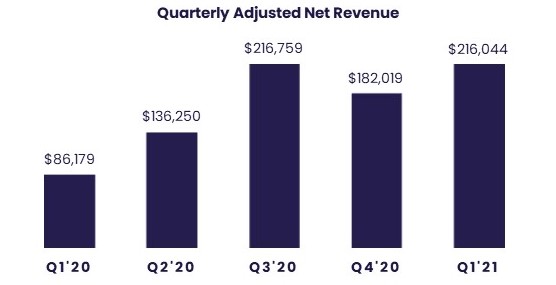
Adjusted net revenue(1)(2) | 216,044 | 86,179 | ||||||||||||
| Net loss | (177,564) | (106,367) | ||||||||||||
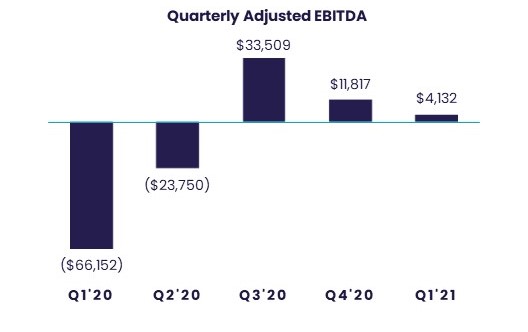
Adjusted EBITDA(2) | 4,132 | (66,152) | ||||||||||||
___________________
(1)Adjusted net revenue within our Lending segment is used by management to evaluate our Lending segment and our consolidated results. For the Lending segment, total net revenue is adjusted to exclude the fair value changes in servicing rights and residual interests classified as debt due to valuation inputs and assumption changes (including conditional prepayment and default and discount rates). We use this adjusted measure in our determination of contribution profit (loss) in the Lending segment, as well as to evaluate our consolidated results, as it removes non-cash charges that are not realized during the period and, therefore, do not impact the cash available to fund our operations, and our overall liquidity position. For our Financial Services and Technology Platform segments, there are no adjustments from total net revenue to arrive at the consolidated adjusted net revenue shown in this table.
10
(2)Adjusted net revenue and adjusted EBITDA are non-GAAP financial measures. For information regarding our uses and definitions of these measures and for reconciliations to the most directly comparable GAAP measures, net loss and total net revenue, respectively, see “— Non-GAAP Financial Measures”.
(3)There was no interest income recorded within our Technology Platform segment for any of the periods presented.
(4)“Other” includes total net revenue associated with corporate functions that are not directly related to a reportable segment. For further discussion, see Note 16 included in the accompanying unaudited condensed consolidated financial statements included elsewhere in this Current Report on Form 8-K.
| Quarter Ended | ||||||||||||||||||||||||||||||||||||||||||||||||||
($ in thousands) | March 31, 2021 | December 31, 2020 | September 30, 2020 | June 30, 2020 | March 31, 2020 | December 31, 2019 | September 30, 2019 | June 30, 2019 | ||||||||||||||||||||||||||||||||||||||||||
Lending | ||||||||||||||||||||||||||||||||||||||||||||||||||
| Total interest income | $ | 81,547 | $ | 90,753 | $ | 86,468 | $ | 83,985 | $ | 93,177 | $ | 125,041 | $ | 161,926 | $ | 153,956 | ||||||||||||||||||||||||||||||||||
| Total interest expense | (29,770) | (33,626) | (34,246) | (39,650) | (47,516) | (57,497) | (67,989) | (68,609) | ||||||||||||||||||||||||||||||||||||||||||
| Total noninterest income (loss) | 96,200 | 91,865 | 109,890 | 51,549 | 28,217 | (6,655) | 33,133 | 71,294 | ||||||||||||||||||||||||||||||||||||||||||
| Total net revenue | 147,977 | 148,992 | 162,112 | 95,884 | 73,878 | 60,889 | 127,070 | 156,641 | ||||||||||||||||||||||||||||||||||||||||||
Adjusted net revenue(1)(3) | 168,037 | 159,520 | 178,084 | 117,182 | 81,755 | 58,602 | 135,402 | 154,971 | ||||||||||||||||||||||||||||||||||||||||||
Contribution profit (loss)(1) | 87,686 | 85,204 | 103,011 | 49,419 | 4,095 | (33,362) | 35,674 | 67,283 | ||||||||||||||||||||||||||||||||||||||||||
Financial Services | ||||||||||||||||||||||||||||||||||||||||||||||||||
| Total interest income | 540 | 378 | 365 | 316 | 1,737 | 1,924 | 2,071 | 1,406 | ||||||||||||||||||||||||||||||||||||||||||
| Total interest expense | (311) | (290) | (267) | (233) | (1,522) | (1,798) | (1,798) | (1,242) | ||||||||||||||||||||||||||||||||||||||||||
| Total noninterest income | 6,234 | 3,963 | 3,139 | 2,345 | 1,939 | 1,524 | 760 | 609 | ||||||||||||||||||||||||||||||||||||||||||
Total net revenue(1) | 6,463 | 4,051 | 3,237 | 2,428 | 2,154 | 1,650 | 1,033 | 773 | ||||||||||||||||||||||||||||||||||||||||||
Contribution loss | (35,519) | (36,067) | (37,467) | (30,893) | (26,983) | (34,517) | (33,533) | (27,855) | ||||||||||||||||||||||||||||||||||||||||||
Technology Platform(6) | ||||||||||||||||||||||||||||||||||||||||||||||||||
| Total interest expense | (36) | (42) | (47) | (18) | — | — | — | — | ||||||||||||||||||||||||||||||||||||||||||
| Total noninterest income | 46,101 | 36,838 | 38,865 | 19,037 | 997 | 325 | 206 | 149 | ||||||||||||||||||||||||||||||||||||||||||
Total net revenue(1) | 46,065 | 36,796 | 38,818 | 19,019 | 997 | 325 | 206 | 149 | ||||||||||||||||||||||||||||||||||||||||||
Contribution profit | 15,685 | 16,120 | 23,986 | 12,100 | 997 | 325 | 206 | 149 | ||||||||||||||||||||||||||||||||||||||||||
Other(2) | ||||||||||||||||||||||||||||||||||||||||||||||||||
| Total interest income | 441 | 942 | 1,284 | 1,764 | 2,368 | 2,533 | 2,434 | 2,316 | ||||||||||||||||||||||||||||||||||||||||||
| Total interest expense | (5,131) | (19,292) | (4,345) | (3,417) | (1,095) | (1,155) | (1,351) | (1,355) | ||||||||||||||||||||||||||||||||||||||||||
| Total noninterest income (loss) | 169 | 2 | (319) | (726) | — | — | — | — | ||||||||||||||||||||||||||||||||||||||||||
Total net revenue (loss)(5) | (4,521) | (18,348) | (3,380) | (2,379) | 1,273 | 1,378 | 1,083 | 961 | ||||||||||||||||||||||||||||||||||||||||||
Consolidated | ||||||||||||||||||||||||||||||||||||||||||||||||||
| Total interest income | $ | 82,528 | $ | 92,073 | $ | 88,117 | $ | 86,065 | $ | 97,282 | $ | 129,498 | $ | 166,431 | $ | 157,678 | ||||||||||||||||||||||||||||||||||
| Total interest expense | (35,248) | (53,250) | (38,905) | (43,318) | (50,133) | (60,450) | (71,138) | (71,206) | ||||||||||||||||||||||||||||||||||||||||||
| Total noninterest income (loss) | 148,704 | 132,668 | 151,575 | 72,205 | 31,153 | (4,806) | 34,099 | 72,052 | ||||||||||||||||||||||||||||||||||||||||||
Total net revenue(4) | 195,984 | 171,491 | 200,787 | 114,952 | 78,302 | 64,242 | 129,392 | 158,524 | ||||||||||||||||||||||||||||||||||||||||||
Adjusted net revenue(1)(3) | 216,044 | 182,019 | 216,759 | 136,250 | 86,179 | 61,955 | 137,724 | 156,854 | ||||||||||||||||||||||||||||||||||||||||||
| Net income (loss) | (177,564) | (82,616) | (42,878) | 7,808 | (106,367) | (122,541) | (57,559) | (10,218) | ||||||||||||||||||||||||||||||||||||||||||
Adjusted EBITDA(3) | 4,132 | 11,817 | 33,509 | (23,750) | (66,152) | (101,004) | (27,656) | 6,611 | ||||||||||||||||||||||||||||||||||||||||||
___________________
(1)Adjusted net revenue within our Lending segment is used by management to evaluate our Lending segment and our consolidated results. For the Lending segment, total net revenue is adjusted to exclude the fair value changes in servicing rights and residual interests classified as debt due to valuation inputs and assumption changes (including conditional prepayment and default and discount rates). We use this adjusted measure in our determination of contribution profit (loss) in the Lending segment, as well as to evaluate our consolidated results, as it removes non-cash charges that are not realized during the period and, therefore, do not impact the cash available to fund our operations, and our overall liquidity position. For the Financial Services and Technology Platform segments, there are no adjustments from total net revenue.
(2)“Other” includes total net revenue associated with corporate functions that are not directly related to a reportable segment. For further discussion, see Note 16 in the accompanying unaudited condensed consolidated financial statements included elsewhere in this Current Report on Form 8-K.
(3)Adjusted net revenue and adjusted EBITDA are non-GAAP financial measures. For information regarding our uses and definitions of these measures and for reconciliations to the most directly comparable GAAP measures, net income (loss) and total net revenue, respectively, see “— Non-GAAP Financial Measures”.
(4)The significant trends in consolidated total net revenue throughout the periods presented were attributable to the following:
•The $29.1 million decrease from the second quarter to the third quarter of 2019 was primarily attributable to an unfavorable change in securitization loans of $49.9 million resulting primarily from an increase in yields based on expected declines in personal loan securitization credit performance. In addition, securitization loan charge-offs increased by $5.0 million period over period. This negative trend was partially offset by a $31.2 million positive variance associated with our loan origination and sale activities, net of hedges, which reflected improved sales execution to whole loan buyers period over period and was a significant factor in our quarterly whole loan valuations.
•The $65.2 million decrease from the third quarter to the fourth quarter of 2019 was primarily attributable to a $38.7 million loss related to the deconsolidation of three personal loan securitizations. In addition, net interest income decreased $26.2 million period over period, which was primarily attributable to a decline in the average total loans held on our balance sheet.
11
•The $14.1 million increase from the fourth quarter of 2019 to the first quarter of 2020 was primarily attributable to a $33.7 million lower loss related to the deconsolidations of two personal loan securitizations during the first quarter of 2020 as compared to the aforementioned three deconsolidations in the fourth quarter of 2019. The positive trend was partially offset by a decrease in net interest income of $21.9 million, which was primarily attributable to a decline in the average total loans held on our balance sheet.
•The $36.7 million increase from the first quarter to the second quarter of 2020 was primarily attributable to increases in securitization loan fair values of $71.7 million related to credit loss performance expectations improving, when we determined that delinquencies were better than expected during the period. This increase was offset by a decline of $38.1 million in loan origination and sales activities, net of hedges, a significant portion of which was related to a $22.5 million gain on credit default swaps in the first quarter of 2020 (which position we then closed during the same quarter), and because credit spreads widened significantly during the escalation of the COVID-19 pandemic, positively impacting our derivatives position.
•The $85.8 million increase from the second quarter to the third quarter of 2020 was attributable to a $45.8 million increase in loan origination and sales activities, net of hedges, which was a function of us carrying a larger average loan balance on our balance sheet for all loan products and a meaningful increase in student loan fair values due to a decrease in expected prepayment speeds. This prepayment speed expectation also contributed to an improvement in servicing of $12.1 million period over period. The increased average loan balance also contributed to an increase in net interest income of $6.4 million. Moreover, the lower total net revenue in the second quarter was attributable to a loss on deconsolidation of securitizations of $8.6 million. Finally, securitization loan write-offs decreased $5.5 million, as we continued to see an improvement in credit performance from the early stages of the COVID-19 pandemic.
•The $29.3 million decrease from the third quarter to the fourth quarter of 2020 was primarily attributable to interest expense related to the Galileo seller note in our Technology Platform segment and a decrease in noninterest income in our Lending segment. On November 14, 2020, when the promotional period on the seller note lapsed and we did not pay off the note, we incurred incremental interest expense of $12.5 million. We incurred an additional $3.7 million of interest expense related to our outstanding seller note obligation during the fourth quarter of 2020. The primary driver of the decrease in noninterest income in our Lending segment was related to decreases of $12.6 million in the gains recognized related to securitization loan fair values as a result of securitization loan valuations remaining materially consistent from the third quarter to the fourth quarter of 2020 after two consecutive quarters of improvement related to credit loss expectations. Additionally, we recognized an impairment charge of $4.3 million during the fourth quarter to measure the carrying value of our Apex equity investment equal to the call payment that we received in January 2021 upon the seller exercising its call option on our equity interest in Apex.
•The $24.5 million increase from the fourth quarter of 2020 to the first quarter of 2021 was primarily attributable to $14.1 million lower corporate borrowing expense that was largely related to our seller note, as further discussed in footnote (5) below. Additionally, technology platform fees increased $7.1 million quarter over quarter, which was indicative of continued account growth and activity at Galileo. These increases were partially offset by a decrease in servicing income of $11.0 million, which was primarily due to the impact of prepayments on the fair value of our servicing rights. The remaining variance was primarily driven by our lending activities and was a function of our average loan balance, amounts pledged to our warehouse facilities and loan sale execution during the 2021 period.
(5)The significant trends in Other total net revenue (loss) during the periods presented were attributable to the following:
•Our cash balances, along with market interest rates, declined during the first three quarters of 2020, which resulted in declines in other total net revenue of: $0.2 million in the first quarter of 2020 compared to the fourth quarter of 2019; $0.4 million in the second quarter compared to the first quarter of 2020; and $0.4 million in the third quarter compared to the second quarter of 2020. From the third quarter of 2020 through the first quarter of 2021, interest income attributable to bank balances was lower each successive quarter due to declines in interest rates. Cash balances were higher in the fourth quarter of 2020 versus the third quarter of 2020, which offset some of the interest rate impact. Our cash balances were lower in the first quarter of 2021 versus the fourth quarter of 2020.
•Interest expense on our revolving credit facility increased by $0.7 million from the first quarter to the second quarter of 2020 due to an incremental $325.0 million borrowing and decreased by $0.5 million from the second quarter to the third quarter of 2020 due to decreases in one-month LIBOR.
•During the second quarter of 2020, we had a one-time investment impairment of $0.8 million.
•During the second quarter of 2020, we acquired Galileo and used a seller note to finance a portion of the purchase. We recorded seller note interest expense of $1.6 million, $3.0 million and $17.6 million during the second, third and fourth quarters of 2020, respectively, and $3.6 million during the first quarter of 2021. The fair value of the seller note was initially recorded below the stated face value, with the difference accreted into interest expense over time during 2020. Additionally, we incurred an incremental $12.5 million of interest during the fourth quarter of 2020 because we did not pay off the seller note before the promotional period ended. Finally, we paid off the seller note in February 2021 and, thus, did not incur a full quarter of seller note interest for the first quarter of 2021.
(6)There was no interest income recorded within our Technology Platform segment for any of the periods presented.
Key Recent Developments
We continue to execute on our growth and other strategic initiatives and in recent years, we have celebrated launches across our product suite and strategic partnerships, establishing ourselves as a platform that enables individuals to borrow, save, spend, invest, and protect their assets. Some of our key recent achievements are discussed below:
Acquisitions
During January 2021, Social Finance, Inc. entered into a business combination agreement (the “Agreement”) by and among SoFi, SCH, and Plutus Merger Sub Inc. (the “Business Combination”). The transactions contemplated by the terms of the Agreement were completed on May 28, 2021, upon which SoFi survived the merger and became a wholly owned subsidiary of SCH, which concurrently changed its name to “SoFi Technologies, Inc.” (“SoFi Technologies”). Shares of SoFi Technologies’ common stock and SoFi Technologies’ warrants began trading on the Nasdaq under the symbol “SOFI” and “SOFIW,” respectively, on June 1, 2021, in lieu of the ordinary shares, warrants and units of SCH. See Note 2 in the accompanying
12
unaudited condensed consolidated financial statements included elsewhere in this Current Report on Form 8-K for additional information on the transaction.
As an alternative to establishing a de novo bank, for which we received preliminary conditional approval from the U.S. Office of the Comptroller of the Currency (“OCC”) in October 2020, we evaluated the acquisition of a national bank. In March 2021, we entered into an agreement to acquire Golden Pacific Bancorp, Inc., a bank holding company, and its wholly-owned subsidiary, Golden Pacific Bank, National Association, a national bank, for a total cash purchase price of $22.3 million. The acquisition is subject to regulatory approval, including approval from the OCC of a revised business plan for Golden Pacific Bank, and approval from the Federal Reserve to become a bank holding company and for a change of control, and other customary closing conditions, which we anticipate can be completed by the end of 2021. In March 2021, we submitted an application to the Federal Reserve to become a bank holding company. The application review process is ongoing.
In May 2020, we completed our acquisition of Galileo for a purchase price of $1.2 billion. Galileo provides technology platform services to financial and non-financial institutions. Our acquisition of Galileo represents a material addition to our Technology Platform segment, but was not a significant acquisition under Regulation S-X, Rule 3-05, Financial Statements of Businesses Acquired or to be Acquired.
In April 2020, we acquired 8 Limited, a Hong Kong based investment business, for a purchase price of $16.1 million. Our acquisition of 8 Limited marked our first expansion outside the United States and enables our non-U.S. members to experience many of the product features we have developed in the United States for SoFi Invest, including zero commission non-cryptocurrency trading.
In December 2018, we acquired a 16.7% interest in Apex for $100.0 million, which enabled us to earn income from Apex’s customers and provided partial integration of transaction clearing and asset custody functions integral to SoFi Invest. During January 2021, the seller exercised its call rights on our Apex equity investment. Therefore, we will no longer recognize Apex equity method investment income subsequent to the date the option was called. Additionally, we measured the carrying value of the Apex equity method investment as of December 31, 2020 equal to the call payment that we received in January 2021, which resulted in the recognition of an impairment charge of $4.3 million during the fourth quarter of 2020. Although following the seller call we no longer have an equity method investment in Apex or recognize equity method investment income, Apex continues to provide investment custody and clearing services for SoFi Invest, including for our brokerage activities, under a multi-year revenue sharing arrangement.
Product Development and Partnerships
Through our registered broker-dealer subsidiary, SoFi Securities LLC, we are licensed to underwrite securities offerings. In March 2021, we launched an IPO investment center that may allow members with a SoFi active Invest account that has at least $3,000 in total account value across SoFi Invest (inclusive of automated and active investing) to invest in initial public offerings before they trade on an exchange. See “—Business Overview” above for additional information.
In 2020, we celebrated the official opening of SoFi Stadium and the establishment of a 20-year partnership with LA Stadium and Entertainment District at Hollywood Park in Inglewood, California, a multi-purpose sports and entertainment district that serves as the stadium for the National Football League teams the Los Angeles Chargers and Los Angeles Rams. SoFi's 20-year partnership with the LA Stadium and Entertainment District at Hollywood Park, across the naming rights and sponsorship agreements, collectively requires SoFi to pay sponsorship fees quarterly in each contract year beginning in 2020 and ending in 2040 for an aggregate total of $625.0 million, which includes operating lease obligations, finance lease obligations and sponsorship and advertising opportunities at the stadium complex. See Note 14 for discussion of an associated contingent matter.
In the second half of 2020, we launched our SoFi Credit Card, which carries no annual membership fee and provides up to two percent unlimited cash back when the cash back rewards are applied to a SoFi Money or SoFi Invest account, or used to pay down SoFi student loans or personal loans, as well as a one-percent annual percentage rate reduction after 12 consecutive on-time credit card payments, with the reduced rate sustained with continued on-time payments.
Non-GAAP Financial Measures
Our management and board of directors use adjusted net revenue and adjusted EBITDA, which are non-GAAP financial measures, to evaluate our operating performance, formulate business plans, help better assess our overall liquidity position, and make strategic decisions, including those relating to operating expenses and the allocation of internal resources. Accordingly,
13
we believe that adjusted net revenue and adjusted EBITDA provide useful information to investors and others in understanding and evaluating our operating results in the same manner as our management and board of directors.
Adjusted Net Revenue
Adjusted net revenue is defined as total net revenue, adjusted to exclude the fair value changes in servicing rights and residual interests classified as debt due to valuation inputs and assumptions changes, which relate only to our Lending segment. We adjust total net revenue to exclude these items, as they are non-cash charges that are not realized during the period, and therefore positive or negative changes do not impact the cash available to fund our operations. This measure helps provide our management with an understanding of the net revenue available to finance our operations and helps management better decide on the proper expenses to authorize for each of our operating segments, to ultimately help achieve target contribution profit margins, which are set by our CODM on an annual basis. Therefore, the measure of adjusted net revenue serves as both the starting point for how we think about the liquidity generated from our operations and also the starting point for our annual financial planning, the latter of which focuses on the cash we expect to generate from our operating segments to help fund the current year’s strategic objectives. Adjusted net revenue has limitations as an analytical tool and should not be considered in isolation from, or as a substitute for, the analysis of other GAAP financial measures, such as total net revenue. The primary limitation of adjusted net revenue is its lack of comparability to other companies that do not utilize this measure or that use a similar measure that is defined in a different manner. We reconcile adjusted net revenue to total net revenue, the most directly comparable GAAP measure, as presented for the periods indicated below:
| Three Months Ended March 31, | ||||||||||||||
($ in thousands) | 2021 | 2020 | ||||||||||||
Total net revenue | $ | 195,984 | $ | 78,302 | ||||||||||
Servicing rights – change in valuation inputs or assumptions(1) | 12,109 | (7,059) | ||||||||||||
Residual interests classified as debt – change in valuation inputs or assumptions(2) | 7,951 | 14,936 | ||||||||||||
Adjusted net revenue | $ | 216,044 | $ | 86,179 | ||||||||||
(1)Reflects changes in fair value inputs and assumptions on servicing rights, including conditional prepayment and default rates and discount rates. These assumptions are highly sensitive to market interest rate changes and are not indicative of our performance or results of operations. Moreover, these non-cash charges are unrealized during the period and, therefore, have no impact on our cash flows from operations. As such, these positive and negative changes are adjusted out of total net revenue to provide management and financial users with better visibility into the net revenue available to finance our operations and our overall performance.
(2)Reflects changes in fair value inputs and assumptions on residual interests classified as debt, including conditional prepayment and default rates and discount rates. When third parties finance our consolidated securitization VIEs by purchasing residual interests, we receive proceeds at the time of the closing of the securitization and, thereafter, pass along contractual cash flows to the residual interest owner. These residual debt obligations are measured at fair value on a recurring basis, but they have no impact on our initial financing proceeds, our future obligations to the residual interest owner (because future residual interest claims are limited to contractual securitization collateral cash flows), or the general operations of our business. As such, these positive and negative non-cash changes in fair value attributable to assumption changes are adjusted out of total net revenue to provide management and financial users with better visibility into the net revenue available to finance our operations.
14
| Quarter Ended | ||||||||||||||||||||||||||||||||
| ($ in thousands) | March 31, 2021 | December 31, 2020 | September 30, 2020 | June 30, 2020 | March 31, 2020 | |||||||||||||||||||||||||||
Total net revenue(1) | $ | 195,984 | $ | 171,491 | $ | 200,787 | $ | 114,952 | $ | 78,302 | ||||||||||||||||||||||
Servicing rights – change in valuation inputs or assumptions(2) | 12,109 | 1,127 | 4,671 | 18,720 | (7,059) | |||||||||||||||||||||||||||
Residual interests classified as debt – change in valuation inputs or assumptions(3) | 7,951 | 9,401 | 11,301 | 2,578 | 14,936 | |||||||||||||||||||||||||||
| Adjusted net revenue | $ | 216,044 | $ | 182,019 | $ | 216,759 | $ | 136,250 | $ | 86,179 | ||||||||||||||||||||||
___________________
(1)See “—Executive Summary” for a discussion of the significant trends in consolidated total net revenue.
(2)See footnote (1) to the table above.
(3)See footnote (2) to the table above.
The reconciling items to determine our non-GAAP measure of adjusted net revenue are applicable only to the Lending segment. The table below presents adjusted net revenue for the Lending segment for the periods indicated:
| Three Months Ended March 31, | ||||||||||||||
| ($ in thousands) | 2021 | 2020 | ||||||||||||
| Total net revenue – Lending | $ | 147,977 | $ | 73,878 | ||||||||||
Servicing rights – change in valuation inputs or assumptions(1) | 12,109 | (7,059) | ||||||||||||
Residual interests classified as debt – change in valuation inputs or assumptions(2) | 7,951 | 14,936 | ||||||||||||
| Adjusted net revenue – Lending | $ | 168,037 | $ | 81,755 | ||||||||||
(1)See footnote (1) to the table above.
(2)See footnote (2) to the table above.
Adjusted EBITDA
Adjusted EBITDA is defined as net income (loss), adjusted to exclude: (i) corporate borrowing-based interest expense (our adjusted EBITDA measure is not adjusted for warehouse or securitization-based interest expense, nor deposit interest expense and finance lease liability interest expense, as discussed further below), (ii) income taxes, (iii) depreciation and amortization, (iv) stock-based expense (inclusive of equity-based payments to non-employees), (v) impairment expense (inclusive of goodwill impairment and of property, equipment and software abandonments), (vi) transaction-related expenses, (vii) warrant fair value adjustments, and (viii) fair value changes in servicing rights and residual interests classified as debt due to valuation assumptions. We believe adjusted EBITDA provides a useful measure for period-over-period comparisons of our business, as it removes the effect of certain non-cash items and certain charges that are not indicative of our core operating performance or results of operations. It is also a measure that management relies upon to evaluate cash flows generated from operations, and therefore the extent of additional capital, if any, required to invest in strategic initiatives. Adjusted EBITDA has limitations as an analytical tool and should not be considered in isolation from, or as a substitute for, the analysis of other GAAP financial measures, such as net income (loss). Some of the limitations of adjusted EBITDA include that it does not reflect the impact of working capital requirements or capital expenditures and it is not a universally consistent calculation among companies in our industry, which limits its usefulness as a comparative measure.
15
We reconcile adjusted EBITDA to net loss, the most directly comparable GAAP measure, for the periods indicated below:
| Three Months Ended March 31, | ||||||||||||||
($ in thousands) | 2021 | 2020 | ||||||||||||
| Net loss | $ | (177,564) | $ | (106,367) | ||||||||||
Non-GAAP adjustments: | ||||||||||||||
Interest expense – corporate borrowings(1) | 5,008 | 1,088 | ||||||||||||
Income tax expense(2) | 1,099 | 57 | ||||||||||||
Depreciation and amortization(3) | 25,977 | 4,715 | ||||||||||||
Stock-based expense | 37,454 | 19,685 | ||||||||||||
Transaction-related expense(4) | 2,178 | 3,914 | ||||||||||||
Fair value changes in warrant liabilities(5) | 89,920 | 2,879 | ||||||||||||
Servicing rights – change in valuation inputs or assumptions(6) | 12,109 | (7,059) | ||||||||||||
Residual interests classified as debt – change in valuation inputs or assumptions(7) | 7,951 | 14,936 | ||||||||||||
| Total adjustments | 181,696 | 40,215 | ||||||||||||
| Adjusted EBITDA | $ | 4,132 | $ | (66,152) | ||||||||||
___________________
(1)Our adjusted EBITDA measure adjusts for corporate borrowing-based interest expense, which includes interest on our revolving credit facility and, for the three months ended March 31, 2021, the seller note issued in connection with our acquisition of Galileo and other financings assumed in the acquisition, as these expenses are a function of our capital structure. Our adjusted EBITDA measure does not adjust for interest expense on warehouse facilities and securitization debt, which are recorded within interest expense — securitizations and warehouses in the accompanying Unaudited Condensed Consolidated Statements of Operations and Comprehensive Loss, as these interest expenses are direct operating expenses driven by loan origination and sales activity. Additionally, our adjusted EBITDA measure does not adjust for interest expense on SoFi Money deposits or interest expense on our finance lease liability in connection with SoFi Stadium, which are recorded within interest expense — other, as these interest expenses are direct operating expenses driven by SoFi Money deposits and finance leases, respectively. As compared to the three months ended March 31, 2020, during the three months ended March 31, 2021, we had a higher average balance on our revolving credit facility as a result of the Galileo acquisition, as well as interest expense related to the Galileo seller note issued in May 2020, which we repaid in February 2021.
(2)The increase in income tax expense period over period was primarily a function of SoFi Lending Corp’s profitability in state jurisdictions where separate filing is required. See Note 12 in the accompanying unaudited condensed consolidated financial statements included elsewhere in this Current Report on Form 8-K for additional information.
(3)Depreciation and amortization expense for the three months ended March 31, 2021 increased compared to the same period in 2020 primarily due to: (i) amortization expense on intangible assets acquired during the second quarter of 2020 from Galileo and 8 Limited, (ii) acceleration of core banking infrastructure amortization, as Galileo’s infrastructure rendered the existing core banking infrastructure redundant, and (iii) amortization of purchased and internally-developed software.
(4)During the three months ended March 31, 2021, transaction-related expenses included financial advisory and professional services costs associated with our pending purchase of Golden Pacific Bancorp, Inc. During the three months ended March 31, 2020, transaction-related expenses included certain costs, such as financial advisory and professional services costs, associated with our acquisitions of Galileo and 8 Limited.
16
(5)We issued warrants in connection with certain redeemable preferred stock issuances, which are accounted for as liabilities and are measured at fair value on a recurring basis. Our adjusted EBITDA measure excludes the non-cash fair value changes in the warrants. The period-over-period change was primarily attributable to a significant increase in our assumed Series H redeemable preferred stock share price. See Note 9 in the accompanying unaudited condensed consolidated financial statements included elsewhere in this Current Report on Form 8-K for additional information.
(6)Reflects changes in fair value inputs and assumptions, including market servicing costs, conditional prepayment and default rates and discount rates. This non-cash change is unrealized during the period and, therefore, has no impact on our cash flows from operations. As such, these positive and negative changes in fair value attributable to assumption changes are adjusted out of net loss to provide management and financial users with better visibility into the earnings available to finance our operations.
(7)Reflects changes in fair value inputs and assumptions, including conditional prepayment and default rates and discount rates. When third parties finance our consolidated VIEs through purchasing residual interests, we receive proceeds at the time of the securitization close and, thereafter, pass along contractual cash flows to the residual interest owner. These obligations are measured at fair value on a recurring basis, which has no impact on our initial financing proceeds, our future obligations to the residual interest owner (because future residual interest claims are limited to contractual securitization collateral cash flows), or the general operations of our business. As such, these positive and negative non-cash changes in fair value attributable to assumption changes are adjusted out of net loss to provide management and financial users with better visibility into the earnings available to finance our operations.
| Quarter Ended | ||||||||||||||||||||||||||||||||
($ in thousands) | March 31, 2021 | December 31, 2020 | September 30, 2020 | June 30, 2020 | March 31, 2020 | |||||||||||||||||||||||||||
Net income (loss) | $ | (177,564) | $ | (82,616) | $ | (42,878) | $ | 7,808 | $ | (106,367) | ||||||||||||||||||||||
Non-GAAP adjustments: | ||||||||||||||||||||||||||||||||
Interest expense – corporate borrowings | 5,008 | 19,125 | 4,346 | 3,415 | 1,088 | |||||||||||||||||||||||||||
Income tax expense (benefit) | 1,099 | (4,949) | 192 | (99,768) | 57 | |||||||||||||||||||||||||||
| Depreciation and amortization | 25,977 | 25,486 | 24,676 | 14,955 | 4,715 | |||||||||||||||||||||||||||
| Stock-based expense | 37,454 | 30,089 | 26,551 | 24,453 | 19,685 | |||||||||||||||||||||||||||
| Transaction-related expenses | 2,178 | — | 297 | 4,950 | 3,914 | |||||||||||||||||||||||||||
| Fair value changes in warrant liabilities | 89,920 | 14,154 | 4,353 | (861) | 2,879 | |||||||||||||||||||||||||||
| Servicing rights – change in valuation inputs or assumptions | 12,109 | 1,127 | 4,671 | 18,720 | (7,059) | |||||||||||||||||||||||||||
| Residual interests classified as debt – change in valuation inputs or assumptions | 7,951 | 9,401 | 11,301 | 2,578 | 14,936 | |||||||||||||||||||||||||||
| Total adjustments | 181,696 | 94,433 | 76,387 | (31,558) | 40,215 | |||||||||||||||||||||||||||
| Adjusted EBITDA | $ | 4,132 | $ | 11,817 | $ | 33,509 | $ | (23,750) | $ | (66,152) | ||||||||||||||||||||||
Key Business Metrics
The table below presents the key business metrics that management uses to evaluate our business, measure our performance, identify trends and make strategic decisions.
| March 31, 2021 | March 31, 2020 | 2021 vs 2020 % Change | |||||||||||||||
Members | 2,281,092 | 1,086,409 | 110 | % | |||||||||||||
Total Products | 3,184,554 | 1,442,481 | 121 | % | |||||||||||||
Lending | |||||||||||||||||
Total Products | 945,227 | 841,615 | 12 | % | |||||||||||||
Financial Services | |||||||||||||||||
Total Products | 2,239,327 | 600,866 | 273 | % | |||||||||||||
| Technology Platform | |||||||||||||||||
| Total Accounts | 69,572,680 | — | n/m | ||||||||||||||
See “— Summary Results by Segment” for additional metrics we review at the segment level.
Members
We refer to our customers as “members”. We define a member as someone who has a lending relationship with us through origination or servicing, opened a financial services account, linked an external account to our platform, or signed up for our credit score monitoring service. Once someone becomes a member, they are always considered a member unless they violate our terms of service given our members have continuous access to our CFPs, our career advice services, our member events, all of our content, educational material, news, tools and calculators at no cost to the member. Additionally, our mobile app and website have been designed with a member home feed that is personalized and delivers content to a member about what they must do that day in their financial life, what they should consider doing that day in their financial life, and what they can do that
17
day in their financial life. We view members as an indication not only of the size and a measurement of growth of our business, but also as a measure of the significant value of the data we have collected over time. The data we collect from our members helps us to, among other things: (i) assess loan life performance data on each loan in our ecosystem, which can inform risk-based interest rates that we can offer our members, (ii) understand our members’ spending behavior to identify and suggest other products we offer that may align with the members’ financial needs; and (iii) enhance our opportunities to sell additional products to our members, as our members represent a vital source of marketing opportunities. When we provide additional products to members, it helps improve our unit economics per member, as we save on marketing costs we would otherwise incur to attract new members. It also increases the lifetime value of an individual member. This in turn enhances our Financial Services Productivity Loop. Member growth is generally an indicator of future revenue, but is not directly correlated with revenues, since not all members who sign up for one of our products fully utilize or continue to use our products, and not all of our products (such as our complementary product, SoFi Relay) provide direct sources of revenue.
Total Products
Total products refers to the aggregate number of lending and financial services products that our members have selected on our platform since our inception through the reporting date, whether or not the members are still registered for such products. In our Lending segment, total products refers to the number of home loans, personal loans and student loans that have been originated through our platform through the reporting date, whether or not such loans have been paid off. If a member has multiple loan products of the same loan product type, such as two personal loans, that is counted as a single product. However, if a member has multiple loan products across loan product types, such as one personal loan and one home loan, that is counted as two products. In our Financial Services segment, total products refers to the number of SoFi Money accounts, SoFi Invest accounts, SoFi Credit Card accounts, SoFi At Work accounts and SoFi Relay accounts (with either credit score monitoring enabled or external linked accounts) that have been opened through our platform through the reporting date. Our SoFi Invest service is comprised of three products: active investing accounts, robo-advisory accounts and cryptocurrency accounts. Our members can select any one or combination of the three types of SoFi Invest products. If a member has multiple SoFi Invest products of the same account type, such as two active investing accounts, that is counted as a single product. However, if a member has multiple SoFi Invest products across account types, such as one active investing account and one robo-advisory account, those separate account types are considered separate products. Total products is a primary indicator of the size and reach of our Lending and Financial Services segments. Management relies on total products metrics to understand the effectiveness of our member acquisition efforts and to gauge the propensity for members to use more than one product. As of March 31, 2021, we had 3,184,554 total products.
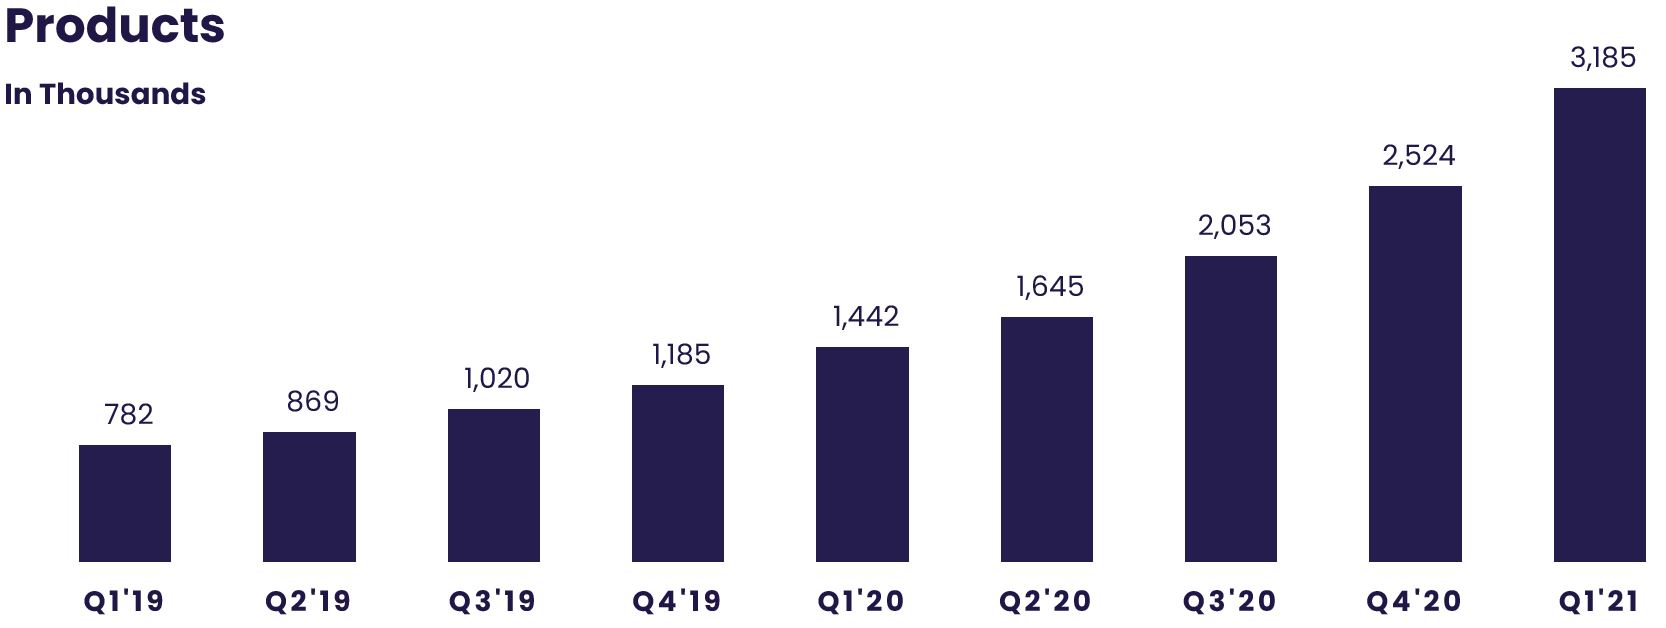
As of March 31, 2021, we had 945,227 total lending products, of which 517,042 were personal loans, 406,293 were student loans, 15,961 were home loans and 5,931 were in-school loans. The above growth in our lending products over time reflects our continued emphasis on origination of personal loans, student loans and home loans, inclusive of our entrance into in-school student lending in the third quarter of 2019.
As of March 31, 2021, we had 2,239,327 total financial services products, of which 823,003 were SoFi Money products, 854,383 were SoFi Invest products, 19,365 were SoFi Credit Card products, 523,451 were SoFi Relay products and 19,125 were SoFi At Work accounts. Growth in our financial services products over time reflects the impacts of our official launches of SoFi Money, SoFi Invest and SoFi Relay in early 2019 and SoFi Credit Card in late 2020.
18
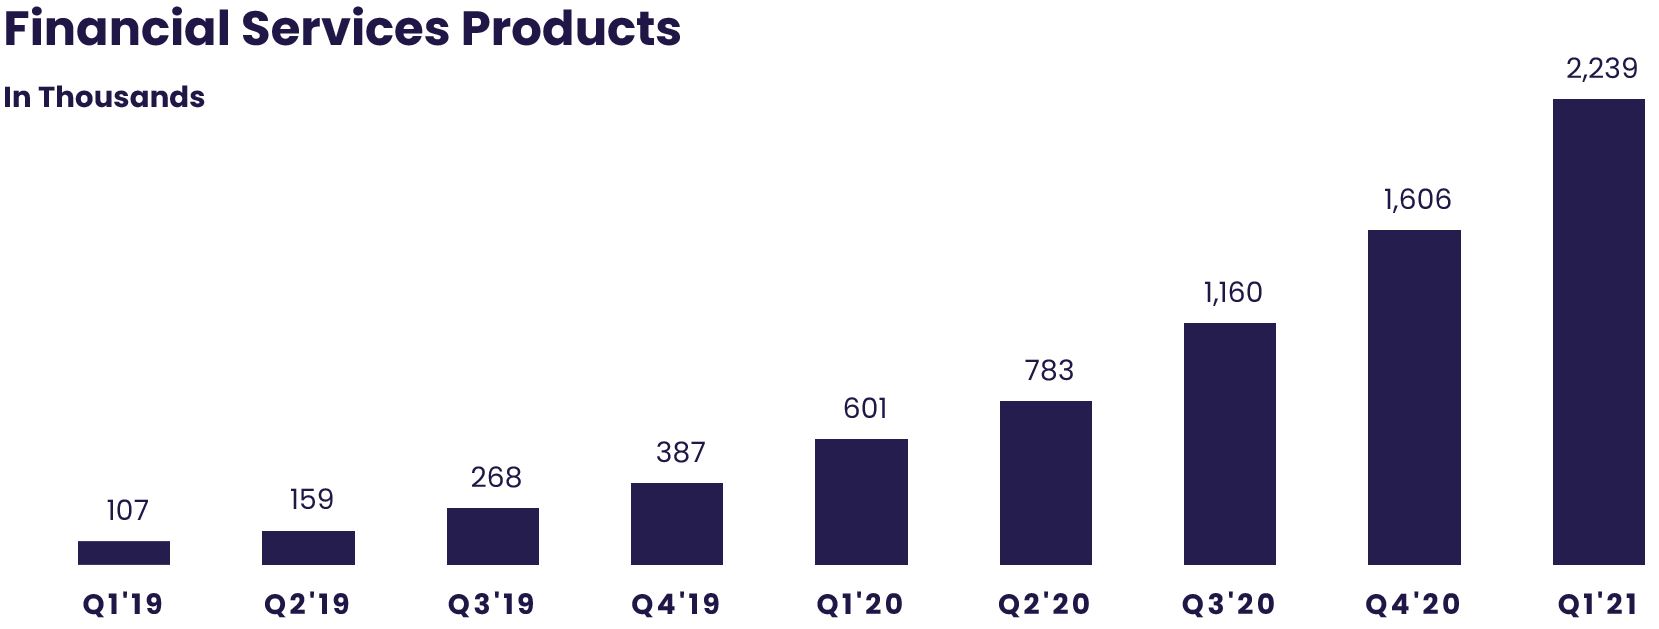
Technology Platform Total Accounts
In our Technology Platform segment, total accounts refers to the number of open accounts at Galileo as of the reporting date, excluding SoFi accounts. We exclude SoFi accounts because revenue generated by Galileo from the SoFi relationship is eliminated in consolidation. No information is reported prior to our acquisition of Galileo on May 14, 2020. Total accounts is a primary indicator of the accounts dependent upon Galileo’s technology platform to use virtual card products, virtual wallets, make peer-to-peer and bank-to-bank transfers, receive early paychecks, separate savings from spending balances, make debit transactions and rely upon real-time authorizations, all of which result in technology platform fees for the Technology Platform segment.
Key Factors Affecting Operating Results
Our future operating results and cash flows are dependent upon a number of opportunities, challenges and other factors, including our loan origination volume, financial services products and member activity on our platform, growth in Galileo accounts, competition and industry trends, general economic conditions and whether or not we are able to secure a national bank charter.
Origination Volume
Our Lending segment is our largest segment, comprising 76% and 94% of our total net revenue during the three months ended March 31, 2021 and 2020, respectively. We are dependent upon the addition of new members and new activity from existing members within our Lending segment to generate origination volume, which we believe is a contributor to Lending segment net revenue. We believe we have a high-quality loan portfolio, as indicated by our weighted average origination FICO score of 767 during the three months ended March 31, 2021. See “— Industry Trends and General Economic Conditions” below for the impact of specific economic factors, including the COVID-19 pandemic, on origination volume.
Member Growth and Activity
We have invested heavily in our platform and are dependent on continued member growth, as well as our ability to generate additional revenues from our existing members using additional products and services. Member growth and activity is critical to our ability to increase our scale and earn a return on our technology and product investments. Growth in members and member activity will depend heavily on our ability to continue to offer attractive products and services at sustainable costs and our continued member acquisition and marketing efforts.
Product Growth
Our aim is to develop and offer a best-in-class integrated financial services platform with products that meet the broad objectives of our members and the lifecycle of their financial needs. We have invested, and continue to invest, heavily in the development, improvement and marketing of our suite of lending and financial services products and are dependent on continued growth in the number of products selected by our members, as well as our ability to build trust and reliability between our members and our platform to reinforce the effects of the Financial Services Productivity Loop. In order to deliver
19
on our strategy, we aim to foster positive member experiences designed to lead to more products per member, leading to enhanced profitability for each additional product by lowering overall member acquisition costs.
Galileo Account Growth
During 2020, we acquired Galileo, which primarily provides technology platform services to financial and non-financial institutions, to enable us to diversify our business from a primarily consumer-based business to also serve enterprises that rely upon Galileo’s integrated platform as a service to serve their clients. We are dependent on growth in the number of accounts at Galileo, which is an indication of the amount of users that are dependent upon the technology platform for a variety of products and services, including virtual card products, virtual wallets, peer-to-peer and bank-to-bank transfers, early paychecks and relying on real-time authorizations, all of which generate revenues for Galileo.
Competition
We face competition from several financial services institutions given our status as a diversified financial services provider. In each of our reportable segments, we may compete with more established financial institutions, some of which have more financial resources than we do. We compete at multiple levels, including competition among other personal loan, student loan, credit card and residential mortgage lenders, competition for deposits in our SoFi Money product from traditional banks and other non-bank lenders, competition for investment accounts in our SoFi Invest product from other brokerage firms, including those based on online or mobile platforms, competition for subscribers to our financial services content, and competition with other technology platforms for the enterprise services we provide. Some of our competitors may at times seek to increase their market share by undercutting pricing terms prevalent in that market, which could adversely affect our market share for any of our products and services or require us to incur higher member acquisition costs. Furthermore, our competitors could offer relatively attractive benefits to our current members, which could limit members using more than one product.
Industry Trends and General Economic Conditions
Our results of operations have historically been relatively resilient to economic downturns but in the future may be impacted by the relative strength of the overall economy and its effect on unemployment, asset markets and consumer spending. As general economic conditions improve or deteriorate, the amount of consumer disposable income tends to fluctuate, which in turn impacts consumer spending levels and the willingness of consumers to take out loans to finance purchases or invest in financial assets. Specific economic factors, such as interest rate levels, changes in monetary and related policies, unemployment rates, market volatility and consumer confidence also influence consumer spending, saving, investing and borrowing patterns. Increased focus by policymakers and the new presidential administration on outstanding student loans has led to discussions of potential legislative and regulatory actions, among other possible steps, to reduce outstanding balances of loans, or cancel loans at a significant scale, including the potential forgiveness of federal student debt. Such actions resulting in forgiveness or cancellation at a meaningful scale would likely have an adverse impact on our results of operations and overall business.
Additionally, our business has been, and may continue to be, impacted by some of the national measures taken to counteract the economic impact of the COVID-19 pandemic. For example, the CARES Act and subsequent extensions of certain hardship provisions have led to decreased demand for our student loan refinancing products. The Federal Reserve’s actions to reduce interest rates to near-zero benchmark levels have led to increased demand for home loan refinancing and we believe have increased the attractiveness of our SoFi Invest product, as members look for alternative ways to earn higher returns on their cash. Conversely, these lower benchmark rates have reduced deposit interest rates we can offer on our SoFi Money product, which we believe has adversely impacted demand for the product. As consumer spending behavior has changed during the COVID-19 pandemic, we believe there has also been decreased demand for debt consolidation products, which negatively impacts our personal loan origination volume. The impacts of the COVID-19 pandemic on our products and measures we have taken to help our Company and our members navigate the uncertain economic environment caused by the COVID-19 pandemic are discussed further throughout this “Management’s Discussion and Analysis of Financial Condition and Results of Operations”.
National Bank Charter
A key element of our long-term strategy is to secure a national bank charter. In March 2021, we entered into an Agreement and Plan of Merger to acquire Golden Pacific, a registered bank holding company, and its wholly owned subsidiary Golden Pacific Bank, a national banking association. If we are successful in securing a national bank charter through the proposed acquisition, we expect to incur additional costs in our operation of the bank primarily associated with headcount, technology infrastructure, governance, compliance and risk management, marketing, and other general and administrative expenses.
20
The key expected financial benefits to us of obtaining a national bank charter include: (i) lowering our cost to fund loans, as we can utilize SoFi Money deposits to fund loans, which have a lower borrowing cost of funds than our current financing model, (ii) holding loans on our balance sheet for longer periods, thereby enabling us to earn interest on these loans for a longer period and increasing our net interest margin, and (iii) supporting origination volume growth by providing an alternative financing option, while also maintaining our warehouse capacity. There can be no guarantee that we will be able to secure a national bank charter, either through the proposed acquisition or through the formation of a de novo national bank or, if we do, that we will realize the anticipated benefits. See “Risk Factors” included elsewhere in this Current Report on Form 8-K.
Key Components of Results of Operations
Interest Income
Interest income is predominantly driven by loan origination volume, prevailing interest rates that we receive on the loans we make and the amount of time we hold loans on our balance sheet. Securitizations interest income is driven by our securitization-related investments in bonds and residual interest positions, which are required under securitization risk retention rules. See Note 1 in the accompanying unaudited condensed consolidated financial statements included elsewhere in this Current Report on Form 8-K for additional information on our securitization-related investments. Moreover, we earn other interest income on excess corporate cash balances and SoFi Money member balances. Related party interest income was derived from notes extended to Apex and one of our stockholders, and was not core to our operations. We received full repayment of all related party notes prior to the date of this filing.
Interest Expense
Interest expense primarily includes interest we incur under our warehouse facilities, inclusive of the amortization of debt issuance costs, and under our securitization debt, inclusive of debt issuance costs and discounts. We incur securitization-related interest expense when securitization transfers do not qualify as true sales pursuant to ASC 810, Consolidation. Securitization-related interest expense fluctuates depending on the level of our securitization activity, market rates and whether and how much such activity results in true sale treatment. We also incur interest expense related to our revolving credit facility and on the seller note issued in connection with our acquisition of Galileo in May 2020, which was fully repaid in February 2021, as well as on the other financings assumed in the acquisition. For our residual interests classified as debt, we recognize interest expense over the expected life using the effective yield method, which represents a portion of the overall fair value change in the residual interests classified as debt. On a quarterly basis, we reevaluate the cash flow estimates to determine if a change to the accretable yield is required on a prospective basis, which is a reclassification between two income statement line items, and therefore has no net impact on net income (loss). We also pay interest income to our members who have SoFi Money account balances, which is interest expense to us. Interest expense is dependent on market interest rates, such as LIBOR, interest rate spreads versus benchmark rates, the amount of warehouse capacity we can access, warehouse advance rates and the amount of loans we ultimately pledge to our warehouse facilities. Finally, we incur interest on our finance lease liabilities associated with SoFi Stadium, which relate to certain physical signage within the stadium. Our interest expense has historically fluctuated due to changes in the interest rate environment and we expect it will continue to fluctuate in future periods.
Noninterest Income
Noninterest income primarily consists of: (i) fair value changes in loans while we hold them on our balance sheet; (ii) gains on sales of loans transferred into the securitization or whole loan sale channels; (iii) the income we receive from our loan servicing activities; (iv) fair value changes related to our securitization activities; and (v) revenue recognized pursuant to ASC 606, Revenue from Contracts with Customers, which primarily relates to our Technology Platform fees.
When we originate a loan, we generally expect that we will sell the loan for more than its par value, which will result in positive loan origination and sales results. Moreover, loan origination and sales also includes recognized servicing assets at the time of a loan sale. The subsequent measurement of our servicing asset at fair value impacts the servicing line in our accompanying Unaudited Condensed Consolidated Statements of Operations and Comprehensive Loss. When we sell a loan into a securitization trust that qualifies for true sale accounting, the gain or loss on sale is recorded within loan origination and sales. The securitizations line item is impacted by fair value changes in securitization loan collateral, residual interests classified as debt and our securitization investments associated with our continuing interest in the securitization subsequent to the sale. Historically, revenue recognized in accordance with ASC 606 has been relatively immaterial given our significant lending operations. However, our acquisition of Galileo during 2020 led to increased revenue from contracts with customers, primarily
21
in the form of Technology Platform fees. Moreover, revenue generated in our Financial Services segment continues to grow over time.
Noninterest Expense
Noninterest expense relates to the following categories of expenses: (i) technology and product development, (ii) sales and marketing, (iii) cost of operations, and (iv) general and administrative. Certain costs are included within each of these line items, such as compensation and benefits-related expense (inclusive of stock-based compensation expense), professional services, depreciation and amortization and occupancy and travel-related costs. We allocate certain costs to each of these four categories based on department-level headcounts. We generally expect the expenses within each such category to increase in absolute dollars as our business continues to grow.
Directly Attributable Expenses
As presented within “—Summary Results by Segment”, in our determination of the contribution profit (loss) for our Lending, Financial Services and Technology Platform segments, we allocate certain expenses that are directly attributable to the corresponding segment. Directly attributable expenses primarily include compensation and benefits and sales and marketing, and vary based on the amount of activity within each segment. Directly attributable expenses also include loan origination and servicing expenses, professional services, occupancy and travel, tools and subscriptions, and bank service charge expenses. Expenses are attributed to the reportable segments using either direct costs of the segment or labor costs that can be attributed based upon the allocation of employee time for individual products.
22
Results of Operations
The following table sets forth condensed consolidated statements of income data for the periods indicated:
| Three Months Ended March 31, | 2021 vs 2020 % Change | |||||||||||||||||||
($ in thousands) | 2021 | 2020 | ||||||||||||||||||
| Interest income | ||||||||||||||||||||
| Loans | $ | 77,221 | $ | 86,116 | (10) | % | ||||||||||||||
| Securitizations | 4,467 | 7,061 | (37) | % | ||||||||||||||||
| Related party notes | 211 | 1,052 | (80) | % | ||||||||||||||||
| Other | 629 | 3,053 | (79) | % | ||||||||||||||||
| Total interest income | 82,528 | 97,282 | (15) | % | ||||||||||||||||
| Interest expense | ||||||||||||||||||||
| Securitizations and warehouses | 29,808 | 47,523 | (37) | % | ||||||||||||||||
| Corporate borrowings | 5,008 | 1,088 | 360 | % | ||||||||||||||||
| Other | 432 | 1,522 | (72) | % | ||||||||||||||||
| Total interest expense | 35,248 | 50,133 | (30) | % | ||||||||||||||||
| Net interest income | 47,280 | 47,149 | — | % | ||||||||||||||||
| Noninterest income | ||||||||||||||||||||
| Loan origination and sales | 110,345 | 104,255 | 6 | % | ||||||||||||||||
| Securitizations | (2,036) | (83,104) | (98) | % | ||||||||||||||||
| Servicing | (12,109) | 7,059 | (272) | % | ||||||||||||||||
| Technology Platform fees | 45,659 | — | n/m | |||||||||||||||||
| Other | 6,845 | 2,943 | 133 | % | ||||||||||||||||
| Total noninterest income | 148,704 | 31,153 | 377 | % | ||||||||||||||||
| Total net revenue | 195,984 | 78,302 | 150 | % | ||||||||||||||||
| Noninterest expense | ||||||||||||||||||||
| Technology and product development | 65,948 | 40,171 | 64 | % | ||||||||||||||||
| Sales and marketing | 87,234 | 62,670 | 39 | % | ||||||||||||||||
| Cost of operations | 57,570 | 32,657 | 76 | % | ||||||||||||||||
| General and administrative | 161,697 | 49,114 | 229 | % | ||||||||||||||||
| Total noninterest expense | 372,449 | 184,612 | 102 | % | ||||||||||||||||
| Loss before income taxes | (176,465) | (106,310) | 66 | % | ||||||||||||||||
| Income tax expense | (1,099) | (57) | n/m | |||||||||||||||||
| Net loss | $ | (177,564) | $ | (106,367) | 67 | % | ||||||||||||||
| Other comprehensive loss | ||||||||||||||||||||
| Foreign currency translation adjustments, net | $ | (80) | $ | (7) | n/m | |||||||||||||||
| Total other comprehensive loss | (80) | (7) | n/m | |||||||||||||||||
| Comprehensive loss | $ | (177,644) | $ | (106,374) | 67 | % | ||||||||||||||
23
Three Months Ended March 31, 2021 Compared to Three Months Ended March 31, 2020
Interest Income
The following table presents the components of our total interest income for the periods indicated:
| Three Months Ended March 31, | 2021 vs 2020 % Change | |||||||||||||||||||
($ in thousands) | 2021 | 2020 | ||||||||||||||||||
Loans | $ | 77,221 | $ | 86,116 | (10) | % | ||||||||||||||
Securitizations | 4,467 | 7,061 | (37) | % | ||||||||||||||||
Related party notes | 211 | 1,052 | (80) | % | ||||||||||||||||
Other | 629 | 3,053 | (79) | % | ||||||||||||||||
Total interest income | $ | 82,528 | $ | 97,282 | (15) | % | ||||||||||||||
Total interest income decreased by $14.8 million, or 15%, for the three months ended March 31, 2021 compared to the three months ended March 31, 2020 due to the following:
Loan interest income decreased by $8.9 million, or 10%, primarily driven by a decline of $29.3 million in interest income from consolidated securitizations, partially offset by increases in non-securitization personal loan and student loan interest income of $16.6 million and $3.6 million, respectively. The decrease in interest income from consolidated securitizations was impacted by a 50% decline in average balance, which was attributable to payment activity and partially the result of the deconsolidation of two securitizations in the first quarter of 2020. The increases in non-securitization loan interest income were primarily a function of increases in average balances for personal loans and student loans of 111% and 45%, respectively.
Securitizations interest income decreased by $2.6 million, or 37%, which was attributable to decreases in residual investment interest income of $0.8 million and asset-backed bonds of $0.8 million related to decreases in average securitization investment balances period over period, and a decrease in securitization float interest income of $1.0 million related to decreases in average securitization loan balances and a decline in interest rates period over period.
Related party notes interest income decreased by $0.8 million, or 80%, due to a decrease in interest income on a stockholder loan, which was fully settled in the fourth quarter of 2020, and a decrease in interest income related to our loans to Apex, which were fully settled in February 2021. See Note 13 in the accompanying unaudited condensed consolidated financial statements included elsewhere in this Current Report on Form 8-K for additional information on our related party notes.
Other interest income decreased by $2.4 million, or 79%, primarily due to interest rate decreases period over period, and a decrease in our cash balances. The interest rate decreases impacted the interest income we earn on both our bank balances and Member Bank deposits.
Interest Expense
The following table presents the components of our total interest expense for the periods indicated:
| Three Months Ended March 31, | 2021 vs 2020 % Change | |||||||||||||||||||
($ in thousands) | 2021 | 2020 | ||||||||||||||||||
Securitizations and warehouses | $ | 29,808 | $ | 47,523 | (37) | % | ||||||||||||||
| Corporate borrowings | 5,008 | 1,088 | 360 | % | ||||||||||||||||
Other | 432 | 1,522 | (72) | % | ||||||||||||||||
Total interest expense | $ | 35,248 | $ | 50,133 | (30) | % | ||||||||||||||
24
Total interest expense decreased by $14.9 million, or 30%, for the three months ended March 31, 2021 compared to the three months ended March 31, 2020, due to the following:
Interest expense related to securitizations and warehouses decreased by $17.7 million, or 37%. The following tables present the components of securitizations and warehouses interest expense and other pertinent information.
| Three Months Ended March 31, | 2021 vs 2020 % Change | |||||||||||||||||||
($ in thousands) | 2021 | 2020 | ||||||||||||||||||
| Securitization debt interest expense | $ | 10,948 | $ | 21,311 | (49) | % | ||||||||||||||
| Warehouse debt interest expense | 10,531 | 14,114 | (25) | % | ||||||||||||||||
| Residual interests classified as debt interest expense | 2,199 | 3,846 | (43) | % | ||||||||||||||||
| Debt issuance cost interest expense | 6,130 | 8,252 | (26) | % | ||||||||||||||||
Securitizations and warehouses interest expense | $ | 29,808 | $ | 47,523 | (37) | % | ||||||||||||||
| Three Months Ended March 31, | 2021 vs 2020 % Change | |||||||||||||||||||
| ($ in thousands) | 2021 | 2020 | ||||||||||||||||||
| Average debt balances | ||||||||||||||||||||
| Securitization debt | $ | 1,134,366 | $ | 2,289,941 | (50) | % | ||||||||||||||
| Warehouses facilities | 2,397,899 | 1,766,276 | 36 | % | ||||||||||||||||
| Residual interests classified as debt | 57,032 | 204,763 | (72) | % | ||||||||||||||||
Weighted average interest rates(1) | ||||||||||||||||||||
Securitization debt(2) | 3.9 | % | 3.7 | % | n/m | |||||||||||||||
Warehouse facilities(2) | 1.8 | % | 3.2 | % | n/m | |||||||||||||||
| Residual interests classified as debt | 15.4 | % | 7.5 | % | n/m | |||||||||||||||
___________________
(1)Calculated as annualized interest expense divided by average debt balance for the respective debt category.
(2)Interest rates on securitization debt and warehouse facilities exclude the effect of debt issuance cost interest expense.
The decrease in interest expense related to securitizations and warehouses was driven by the following:
•Securitization debt interest expense (exclusive of debt issuance and discount amortization) decreased by $10.4 million, which was correlated with the deconsolidation of securitizations discussed in the interest income section above. Further, our student loan securitization debt is primarily tied to one-month LIBOR, which decreased period over period;
•Warehouse debt interest expense (exclusive of debt issuance amortization) decreased by $3.6 million, which was related to decreases in one- and three-month LIBOR period over period, partially offset by a higher average warehouse debt balance outstanding period over period;
•Residual interests classified as debt interest expense decreased by $1.6 million, which was correlated with a lower balance of residual interests classified as debt during the 2021 period, a significant driver of which was the aforementioned deconsolidation of securitizations during the 2020 period; and
•Debt issuance cost interest expense decreased by $2.1 million, which was driven by the acceleration of the amortization of debt issuance costs of $1.0 million in the 2020 period upon the deconsolidation of two securitizations, and an acceleration of warehouse facility debt issuance cost amortization related to a reduction in warehouse facility capacity during the 2020 period, partially offset by interest expense from new debt issuance costs during the 2021 period.
25
Corporate borrowings interest expense increased by $3.9 million, or 360%, primarily due to the following:
•Interest expense incurred for a portion of the 2021 period on the Galileo seller note issued in May 2020 of $3.6 million, as the seller note was repaid in February 2021; and
•An increase of $0.2 million in revolving credit facility interest expense, which reflects a higher average balance during the 2021 period, as we drew $325.0 million on the facility during the second quarter of 2020, partially offset by a decline in one-month LIBOR period over period.
Other interest expense decreased by $1.1 million, or 72%, primarily due to a decrease of $1.2 million associated with SoFi Money balances, which was correlated with the decline in interest rates period over period.
Noninterest Income and Net Revenue
The following table presents the components of our total noninterest income and total net revenue for the periods indicated:
| Three Months Ended March 31, | 2021 vs 2020 % Change | |||||||||||||||||||
($ in thousands) | 2021 | 2020 | ||||||||||||||||||
Loan origination and sales | $ | 110,345 | $ | 104,255 | 6 | % | ||||||||||||||
Securitizations | (2,036) | (83,104) | (98) | % | ||||||||||||||||
Servicing | (12,109) | 7,059 | (272) | % | ||||||||||||||||
Technology Platform fees | 45,659 | — | n/m | |||||||||||||||||
Other | 6,845 | 2,943 | 133 | % | ||||||||||||||||
Total noninterest income | $ | 148,704 | $ | 31,153 | 377 | % | ||||||||||||||
Total net revenue | $ | 195,984 | $ | 78,302 | 150 | % | ||||||||||||||
Total noninterest income increased by $117.6 million, or 377%, for the three months ended March 31, 2021 compared to the three months ended March 31, 2020, due to the following:
Loan origination and sales increased by $6.1 million, or 6%. We experienced a $10.8 million period-over-period increase in home loan originations and sales related income, net of hedges and related interest rate lock commitments. The increase was primarily driven by a 112% increase in home loan origination volume and gains on mortgage pipeline hedges, as discussed further in the table below, which was partially offset by losses on interest rate lock commitments due to a decline in our home loan origination pipeline during the 2021 period. In addition, home loan origination fees increased by $2.3 million period over period in conjunction with the increase in origination volume.
These gains were offset by a decrease of $7.0 million in aggregate personal loan and student loan origination and sales income, which was attributable to lower gain on sale execution for both personal loan and student loan sales in the 2021 period, lower origination volume, and higher combined write-offs and repurchase expense of $4.4 million. Student loan origination volume declined 53% period over period, primarily due to lower demand for our student loan refinancing products as a result of the payment deferral period on federal student loans enacted through the CARES Act in late March 2020. Personal loan origination volume declined 11% period over period, primarily due to lower demand for personal loan financing, which we believe is a result of lower consumer spending behavior during the COVID-19 pandemic. Partially offsetting these decreases were period-over-period gains in our student loan and personal loan economic hedge positions, as discussed further in the table below. See “— Key Factors Affecting Operating Results — Industry Trends and General Economic Conditions”.
Securitization income increased by $81.1 million, or 98%, primarily due to a reduction in securitization loan write-offs of $14.8 million, which was correlated with the deconsolidation of securitizations in the 2020 period and stronger securitization loan credit performance during the 2021 period. The decrease in securitization loan write-offs also had the impact of improving our assumed future credit outlook for our securitization loans, which contributed to an aggregate increase of $62.6 million period over period in securitization loan fair market value changes.
These increases were offset by residual debt fair value increases of $13.5 million, which were correlated with underlying securitization performance and residual interest positions representing a greater percentage of securitization claims (which occurs over time as securitization loans are paid off and, accordingly, securitization debt gets paid off) period over period, of
26
which $7.0 million was related to non-cash favorable fair value changes in residual interests classified as debt valuation assumptions and inputs.
Lastly, the aggregate period-over-period increase was driven by a positive variance in our securitization investment earnings of $17.2 million, which was due to a $5.1 million loss realized in the 2020 period related to the deconsolidation of two personal loan securitizations and the aforementioned improvement in credit outlook, which resulted in lower period-over-period bond and residual investment yields, and therefore improved fair market values for both asset classes.
The table below presents additional information related to loan gains and losses and overall performance:
| Three Months Ended March 31, | 2021 vs 2020 % Change | |||||||||||||||||||
| ($ in thousands) | 2021 | 2020 | ||||||||||||||||||
| Gains from non-securitization loan transfers | $ | 70,900 | $ | 38,699 | 83 | % | ||||||||||||||
Gains from loan securitization transfers(1) | 29,027 | 110,307 | (74) | % | ||||||||||||||||
Economic derivative hedges of loan fair values(2) | 36,071 | (35,721) | (201) | % | ||||||||||||||||
Home loan origination fees(3) | 4,020 | 1,764 | 128 | % | ||||||||||||||||
Loan write-off expense – whole loans(4) | (5,125) | (2,299) | 123 | % | ||||||||||||||||
Loan write-off expense – securitization loans(5) | (4,381) | (19,155) | (77) | % | ||||||||||||||||
Loan repurchase (expense) benefit(6) | (1,483) | 79 | n/m | |||||||||||||||||
___________________
(1)Represents the gain recognized on loan securitization transfers qualifying for sale accounting treatment. For the three months ended March 31, 2020, the gain is exclusive of deconsolidation losses of $5.1 million.
(2)During the three months ended March 31, 2021, we had gains of $22.5 million on interest rate swap positions due to increases in interest rates during the period and a $13.5 million gain on mortgage pipeline hedges due to decreases in the underlying hedge price index. During the three months ended March 31, 2020, we had a $7.0 million loss on mortgage pipeline hedges due to increases in the underlying hedge price index and additional losses of $51.2 million on interest rate swap positions due to declines in interest rates during the period. These losses were offset by a gain on our credit default swaps of $22.5 million. Amounts presented herein exclude interest rate lock commitments, as they are not an economic hedge of loan fair values. We had a (loss) gain of $(8.5) million and $10.7 million during the three months ended March 31, 2021 and 2020, respectively, related to interest rate lock commitments. The period-over-period change was largely a function of quarterly changes in the home loan origination pipeline during each respective period.
(3)This variance was correlated with an increase in home loan origination volume period over period.
(4)Includes gross write-offs of $7.4 million and $4.7 million for the three months ended March 31, 2021 and 2020, respectively. During the 2021 period, $0.5 million of the $2.3 million of recoveries were captured via loan sales to a third-party collection agency. During the 2020 period, $0.3 million of the $2.4 million of recoveries were captured via loan sales to a third-party collection agency.
(5)Includes gross write-offs of $7.4 million and $23.3 million for the three months ended March 31, 2021 and 2020, respectively. During the 2021 period, $1.3 million of the $3.0 million of recoveries were captured via loan sales to a third-party collection agency. During the 2020 period, $2.0 million of the $4.1 million of recoveries were captured via loan sales to a third-party collection agency.
(6)Represents the expense or benefit associated with our estimated loan repurchase obligation. See Note 14 in the accompanying unaudited condensed consolidated financial statements included elsewhere in this Current Report on Form 8-K for additional information.
Servicing income decreased by $19.2 million, or 272%, and was primarily related to fair value changes in our servicing assets that were largely attributable to an increase in servicing asset prepayment speed assumptions period over period. We experienced an increase in loan prepayments during the 2021 period, which we believe is correlated with the market interest rate declines compared to the 2020 period, and is related to the effects of the COVID-19 pandemic. We expect prepayments to continue to remain at a higher than historical level in the current low interest rate environment.
27
We own the master servicing on all the servicing rights that we retain and, in each case, recognize the gross servicing rate applicable to each serviced loan. Subservicers are utilized for all serviced student loans and home loans, which represents a cost to SoFi, but these arrangements do not impact our calculation of the weighted average basis points earned for each loan type serviced. Further, there is no impact on servicing income due to forbearance and moratoriums on certain debt collection activities, and there are no waivers of late fees. The table below presents additional information related to our loan servicing activities:
______________
| Three Months Ended March 31, | 2021 vs 2020 % Change | |||||||||||||||||||
| ($ in thousands) | 2021 | 2020 | ||||||||||||||||||
| Servicing income recognized | ||||||||||||||||||||
Home loans(1) | $ | 1,744 | $ | 891 | 96 | % | ||||||||||||||
Student loans(2) | 12,160 | 13,037 | (7) | % | ||||||||||||||||
Personal loans(3) | 8,475 | 11,341 | (25) | % | ||||||||||||||||
| Servicing rights fair value change | ||||||||||||||||||||
Home loans(4) | 8,124 | 1,259 | 545 | % | ||||||||||||||||
Student loans(5) | 5,701 | 9,208 | (38) | % | ||||||||||||||||
Personal loans(6) | (2,182) | (2,166) | (1) | % | ||||||||||||||||
(1)The weighted average basis points ("bps") earned for home loan servicing during the three months ended March 31, 2021 and 2020 was 24 bps and 25 bps, respectively.
(2)The weighted average bps earned for student loan servicing during the three months ended March 31, 2021 and 2020 was 41 bps and 37 bps, respectively.
(3)The weighted average bps earned for personal loan servicing during the three months ended March 31, 2021 and 2020 was 70 bps and 71 bps, respectively.
(4)The impact on the fair value change resulting from changes in valuation inputs and assumptions was $3.3 million and $(1.0) million during the three months ended March 31, 2021 and 2020, respectively.
(5)The impact of the fair value change resulting from changes in valuation inputs and assumptions was $(15.7) million and $4.6 million during the three months ended March 31, 2021 and 2020, respectively. The 2020 period included the impact of the derecognition of servicing due to loan purchases, which had an effect of $(0.2) million on the total fair value change.
(6)The impact of the fair value change resulting from changes in valuation inputs and assumptions was $0.3 million and $3.4 million during the three months ended March 31, 2021 and 2020, respectively.
Technology Platform fees of $45.7 million during the three months ended March 31, 2021 were earned by Galileo, which we acquired on May 14, 2020 and, therefore, had no impact during the three months ended March 31, 2020. We earn Technology Platform revenues for providing continuous delivery of an integrated technology platform as an outsourced service for financial and non-financial institutions, which is a stand-ready performance obligation that comprises a series of distinct days of service. Our Technology Platform fees are billed based on the actual fulfillment activities to provide the technology platform, which vary from day to day and from client to client.
During the three months ended March 31, 2021, our Technology Platform fees were billed on a monthly basis for an integrated, seamless and comprehensive solution suite, which predominantly includes: virtual card product support; real time push provisioning for virtual cards; enablement of transfers from challenger bank accounts to other banks or individuals; enabling card loads and load transfers directly through ACH debits and credits; facilitating person-to-person transfers; maintenance and support for active and inactive accounts on the platform; processing of chargebacks, fraud analysis, credit bureau reporting, facilitating the ability to receive early paychecks; supporting savings as a separate balance in our system; calculating and assessing interest based on account balance tiers; providing access to our native Program, Authorization, and Events APIs, which provide alerts on all transaction types (e.g., notification of card roundups); authorization, routing and processing of payment transactions (debit, credit, online purchases); debit card production and shipment and real-time data analytics and reporting.
Other income increased by $3.9 million, or 133%, primarily due to increases of $4.4 million in brokerage-related fees, $1.3 million in payment network fees and $0.7 million in referral fees. The brokerage fees and payment network fees earned during the 2021 period were bolstered by our acquisitions of 8 Limited and Galileo in the second quarter of 2020. The increase in brokerage fees was also reflective of an increase in cryptocurrency trading volume on our platform. Payment network fees (which include interchange fees) were directly correlated with increased spending and card transactions on our platform in addition to the impact from the acquisition of Galileo. Lastly, the increase in referral fees was primarily attributable to growth in our partner relationships and related activity, as we continue to onboard new partners and help drive volume to our partners.
28
These gains were offset by a trading error loss of $2.2 million during the 2021 period related to our SoFi Invest business. Further, we had $1.0 million less equity method investment income during the 2021 period, as our Apex equity method investment was called during the period.
Noninterest Expense
The following table presents the components of our total noninterest expense for the periods indicated:
| Three Months Ended March 31, | 2021 vs 2020 % Change | |||||||||||||||||||
($ in thousands) | 2021 | 2020 | ||||||||||||||||||
Technology and product development | $ | 65,948 | $ | 40,171 | 64 | % | ||||||||||||||
Sales and marketing | 87,234 | 62,670 | 39 | % | ||||||||||||||||
Cost of operations | 57,570 | 32,657 | 76 | % | ||||||||||||||||
General and administrative | 161,697 | 49,114 | 229 | % | ||||||||||||||||
Total noninterest expense | $ | 372,449 | $ | 184,612 | 102 | % | ||||||||||||||
Total noninterest expense increased by $187.8 million, or 102%, for the three months ended March 31, 2021 compared to the three months ended March 31, 2020, due to the following:
Technology and product development expenses increased by $25.8 million, or 64%, primarily due to:
•an increase in amortization expense on intangible assets of $10.1 million, of which $7.9 million was associated with intangible assets acquired during the second quarter of 2020, and of which $2.3 million was related to the acceleration of our core banking infrastructure amortization;
•an increase in purchased and internally-developed software amortization of $1.3 million, which was reflective of increased investments in technology to support our growth;
•an increase in employee compensation and benefits of $11.6 million, inclusive of an increase in share-based compensation expense of $5.6 million, which was related to a 20% increase in technology and product personnel in support of our growth. We also had an increase in average compensation in the 2021 period; and
•an increase in software licenses and tools and subscriptions spend of $3.1 million related to headcount increases and internal technology initiatives.
Sales and marketing expenses increased by $24.6 million, or 39%, primarily due to:
•an increase in amortization expense of $8.7 million associated with the customer-related intangible assets acquired in the second quarter of 2020;
•an increase in employee compensation and benefits of $5.1 million, inclusive of an increase in share-based compensation expense of $1.3 million, which was correlated with a 66% increase in sales and marketing personnel to support our growth, partially offset by a decrease in average compensation in the 2021 period;
•SoFi Stadium related expenditures of $3.9 million, which is exclusive of depreciation and interest expense on the embedded lease portion of our SoFi Stadium agreement;
•an increase in direct customer promotional expenditures of $3.8 million, primarily related to the launch and promotion of our Financial Services segment products; and
•an increase in advertising expenditures of $3.2 million, which was attributable to an increase in online, social and television advertising spend in the 2021 period, partially offset by a decrease in direct mail marketing.
29
Cost of operations increased by $24.9 million, or 76%, primarily due to:
•an increase in loan origination and servicing expenses of $6.1 million, of which $5.4 million was related to home loans, which supported the growth in home loan origination volume period over period;
•an increase of $6.4 million in third-party fulfillment costs, which was primarily attributable to post-acquisition Galileo operations;
•an increase in employee compensation and benefits of $6.6 million, which was correlated with a 31% increase in cost of operations personnel in support of our growth in addition to an increase in average compensation in the 2021 period. A portion of this increase was also attributable to an increase in home loan commissions of $1.3 million related to home loan origination growth;
•an increase in occupancy-related costs of $0.7 million;
•an increase in software licenses and tools and subscriptions of $0.8 million related to headcount increases and internal technology initiatives; and
•an increase in brokerage-related costs of $1.5 million related to the growth of SoFi Invest and our wholly-owned subsidiary, 8 Limited, which we acquired in the second quarter of 2020.
General and administrative expenses increased by $112.6 million, or 229%, primarily due to:
•an increase in employee compensation and benefits of $17.3 million, inclusive of an increase in share-based compensation expense of $11.1 million, which was related to a 45% increase in general and administrative personnel to support our growing infrastructure and administrative needs in addition to an increase in average compensation in the 2021 period;
•an increase in the fair value of our warrant liabilities of $87.0 million, which was primarily related to an increase in the fair value of our Series H redeemable preferred stock;
•an increase in non-transaction related professional services of $4.8 million, which included accounting and legal services;
•an increase in occupancy-related expenses of $0.8 million; and
•an increase in software licenses and tools and subscriptions of $1.2 million;
•partially offset by a decrease in transaction-related expenses of $1.7 million, which largely consisted of financial advisory and professional services costs in both periods and was related to our pending purchase of Golden Pacific in the 2021 period and related to our acquisitions of Galileo and 8 Limited in the 2020 period.
Net Loss
Our net loss for the three months ended March 31, 2021 increased by $71.2 million, or 67%, compared to the three months ended March 31, 2020, primarily due to the factors discussed above, as well as the change in income taxes. The primary driver of the $1.0 million period-over-period increase in income taxes was associated with an increase in the profitability of SoFi Lending Corp, which incurs income tax expense in some state jurisdictions where separate company filing is required.
30
Summary Results by Segment
Lending Segment
In the table below, we present certain metrics related to our Lending segment:
| March 31, | 2021 vs 2020 % Change | |||||||||||||||||||
Metric | 2021 | 2020 | ||||||||||||||||||
| Total products (number) | 945,227 | 841,615 | 12 | % | ||||||||||||||||
| Origination volume ($ in thousands, during period) | ||||||||||||||||||||
| Home loans | $ | 735,604 | $ | 346,808 | 112 | % | ||||||||||||||
| Personal loans | 805,689 | 901,694 | (11) | % | ||||||||||||||||
| Student loans | 1,004,685 | 2,134,506 | (53) | % | ||||||||||||||||
| Total | $ | 2,545,978 | $ | 3,383,008 | (25) | % | ||||||||||||||
| Loans with a balance (number) | 582,069 | 636,275 | (9) | % | ||||||||||||||||
| Average loan balance ($) | ||||||||||||||||||||
| Home loans | $ | 285,654 | $ | 293,762 | (3) | % | ||||||||||||||
| Personal loans | 21,515 | 24,000 | (10) | % | ||||||||||||||||
| Student loans | 52,493 | 59,346 | (12) | % | ||||||||||||||||
The following table presents additional information on our terms for our lending products as of March 31, 2021:
| Product | Loan Size | Rates(1) | Term | |||||||||||||||||
| Student Loan Refinancing | $5,000+ (2) | Variable rate: 2.25% – 6.62% | 5 – 20 years | |||||||||||||||||
| Fixed rate: 2.99% – 7.18% | ||||||||||||||||||||
| In-School Loans | $5,000+ (2) | Variable rate: 1.84% – 12.63% | 5 – 15 years | |||||||||||||||||
| Fixed rate: 4.23% – 11.26% | ||||||||||||||||||||
| Personal Loans | $5,000 – $100,000 (2) | Fixed rate: 5.99% – 19.10% | 2 – 7 years | |||||||||||||||||
| Home Loans | $98,000 – $548,250 (Conforming 2021 Normal Cost Areas) | Fixed rate: 2.13% – 4.75% | 15 or 30 years | |||||||||||||||||
| OR | ||||||||||||||||||||
$822,375 (2) (Conforming 2021 High Cost Areas) | 15 or 30 years | |||||||||||||||||||
(1)Loan annual percentage rates presented reflect an auto-pay discount.
(2)Minimum loan size may be higher within certain states due to legal or licensing requirements.
31
In the table below, we present additional information related to our lending products:
__________________
| Three Months Ended March 31, | ||||||||||||||
| 2021 | 2020 | |||||||||||||
| Student Loans | ||||||||||||||
| Weighted average origination FICO | 774 | 773 | ||||||||||||
Weighted average interest rate earned(1) | 4.62 | % | 5.38 | % | ||||||||||
Interest income recognized ($ in thousands)(1) | $ | 32,277 | $ | 35,855 | ||||||||||
Sales of loans ($ in thousands)(2) | $ | 936,160 | $ | 2,256,059 | ||||||||||
| Time between loan origination and loan sale (days) | 50 | 30 | ||||||||||||
| Home Loans | ||||||||||||||
| Weighted average origination FICO | 762 | 759 | ||||||||||||
Weighted average interest rate earned(1) | 1.58 | % | 2.74 | % | ||||||||||
Interest income recognized ($ in thousands)(1) | $ | 731 | $ | 712 | ||||||||||
| Sales of loans ($ in thousands) | $ | 677,566 | $ | 313,042 | ||||||||||
| Time between loan origination and loan sale (days) | 13 | 11 | ||||||||||||
| Personal Loans | ||||||||||||||
| Weighted average origination FICO | 762 | 757 | ||||||||||||
Weighted average interest rate earned(1) | 10.92 | % | 10.56 | % | ||||||||||
Interest income recognized ($ in thousands)(1) | $ | 44,001 | $ | 49,549 | ||||||||||
Sales of loans ($ in thousands)(2) | $ | 779,441 | $ | 777,346 | ||||||||||
| Time between loan origination and loan sale (days) | 41 | 25 | ||||||||||||
(1)Represents annualized interest income recognized divided by our monthly average outstanding loan balance for the period.
(2)Excludes the impact of loans transferred into consolidated securitizations.
Total Products
Total products refers to the number of home loans, personal loans and student loans that have been originated through our platform since our inception through the reporting date, whether or not such loans have been paid off. See “— Key Business Metrics” for further discussion of this measure as it relates to our Lending segment.
Origination Volume
We refer to the aggregate dollar amount of loans originated through our platform in a given period as origination volume. Origination volume is an indicator of the size and health of our Lending segment and an indicator (together with the relevant loan characteristics, such as interest rate and prepayment and default expectations) of revenues and profitability. Changes in origination volume are driven by the addition of new members and existing members, the latter of which at times will either refinance into a new SoFi loan or secure an additional, concurrent loan, as well as macroeconomic factors impacting consumer spending and borrowing behavior. Since the profitability of the Lending segment is largely correlated with origination volume, management relies on origination volume trends to assess the need for external financing to support the Financial Services segment and the expense budgets for unallocated expenses.
During the three months ended March 31, 2021, home loan origination volume increased significantly relative to the 2020 period due to increased demand for home loan products following the Federal Reserve’s actions to reduce interest rates to near-zero benchmark levels amid the COVID-19 pandemic.
During the three months ended March 31, 2021, personal loan origination volume decreased relative to the 2020 period primarily due to lower consumer spending behavior during the COVID-19 pandemic, which we believe decreased the overall demand for debt consolidation loans, one of the primary stated purposes for our personal loan originations.
Demand for our student loan refinancing products decreased during the three months ended March 31, 2021 relative to the 2020 period, primarily due to the automatic suspension of principal and interest payments on federally-held student loans enacted through the CARES Act that was extended by executive action through September 30, 2021. We believe this suspension has contributed to decreased overall demand for student loan refinancing.
32
Loans with a Balance and Average Loan Balance
Loans with a balance refers to the number of loans that have a balance greater than zero dollars as of the reporting date. Loans with a balance allows management to better understand the unit economics of acquiring a loan in relation to the lifetime value of that loan. Average loan balance is defined as the total unpaid principal balance of the loans divided by loans with a balance within the respective loan product category as of the reporting date.
The home loan average balance declined modestly during the three months ended March 31, 2021 relative to the 2020 period and did not present any notable trends.
The decline in personal loan average balance during the three months ended March 31, 2021 relative to the 2020 period was driven primarily by the impact of the COVID-19 pandemic, which caused a decline in consumption demand as well as a reduction in the average size of requested personal loans.
The decline in student loan average balance during the three months ended March 31, 2021 relative to the 2020 period was due in part to the growth of in-school student loans, which have a lower average balance.
The following table presents the measure of contribution profit for the Lending segment for the periods indicated. The information is derived from our internal financial reporting used for corporate management purposes. Refer to Note 16 in the accompanying unaudited condensed consolidated financial statements included elsewhere in this Current Report on Form 8-K for more information regarding Lending segment performance.
___________________
| Three Months Ended March 31, | 2021 vs 2020 % Change | |||||||||||||||||||
($ in thousands) | 2021 | 2020 | ||||||||||||||||||
| Net revenue | ||||||||||||||||||||
| Net interest income | $ | 51,777 | $ | 45,661 | 13 | % | ||||||||||||||
| Noninterest income | 96,200 | 28,217 | 241 | % | ||||||||||||||||
| Total net revenue | 147,977 | 73,878 | 100 | % | ||||||||||||||||
Servicing rights – change in valuation inputs or assumptions(1) | 12,109 | (7,059) | (272) | % | ||||||||||||||||
Residual interests classified as debt – change in valuation inputs or assumptions(2) | 7,951 | 14,936 | (47) | % | ||||||||||||||||
Directly attributable expenses(3) | (80,351) | (77,660) | 3 | % | ||||||||||||||||
| Contribution Profit | $ | 87,686 | $ | 4,095 | n/m | |||||||||||||||
(1)Reflects changes in fair value inputs and assumptions, including market servicing costs, conditional prepayment and default rates and discount rates. This non-cash change, which is recorded within noninterest income in the accompanying Unaudited Condensed Consolidated Statements of Operations and Comprehensive Loss is unrealized during the period and, therefore, has no impact on our cash flows from operations. As such, the changes in fair value attributable to assumption changes are adjusted to provide management and financial users with better visibility into the cash flows available to finance our operations.
(2)Reflects changes in fair value inputs and assumptions, including conditional prepayment and default rates and discount rates. When third parties finance our consolidated securitizations through purchasing residual interests, we receive proceeds at the time of the securitization close and, thereafter, pass along contractual cash flows to the residual interest owner. These obligations are measured at fair value on a recurring basis, with fair value changes recorded within noninterest income in the accompanying Unaudited Condensed Consolidated Statements of Operations and Comprehensive Loss. The fair value change attributable to assumption changes has no impact on our initial financing proceeds, our future obligations to the residual interest owner (because future residual interest claims are limited to contractual securitization collateral cash flows), or the general operations of our business. As such, this non-cash change in fair value is adjusted to provide management and financial users with better visibility into the cash flows available to finance our operations.
(3)For a disaggregation of the directly attributable expenses allocated to the Lending segment in each of the periods presented, see “—Directly Attributable Expenses” below.
Three Months Ended March 31, 2021 Compared to Three Months Ended March 31, 2020
Net interest income
Net interest income in our Lending segment for the three months ended March 31, 2021 increased by $6.1 million, or 13%, compared to the three months ended March 31, 2020 due to the following:
Loan interest income decreased by $8.9 million, or 10%, primarily driven by a decline of $29.3 million in interest income from consolidated securitizations, partially offset by increases in non-securitization personal loan and student loan interest income of $16.6 million and $3.6 million, respectively. The decrease in interest income from consolidated securitizations was
33
impacted by a 50% decline in average balance, which was attributable to payment activity and partially the result of the deconsolidation of two securitizations in the first quarter of 2020. The increases in non-securitization loan interest income were primarily a function of increases in average balances for personal loans and student loans of 111% and 45%, respectively.
Securitizations interest income decreased by $2.6 million, or 37%, which was attributable to decreases in residual investment interest income of $0.8 million and asset-backed bonds of $0.8 million related to decreases in average securitization investment balances period over period, and a decrease in securitization float interest income of $1.0 million related to decreases in average securitization loan balances and a decline in interest rates period over period.
Interest expense related to securitizations and warehouses decreased by $17.7 million, or 37%, primarily due to:
•a decline in securitization debt interest expense (exclusive of debt issuance and discount amortization) of $10.4 million, which was correlated with the deconsolidation of securitizations discussed in the interest income section above. Further, our student loan securitization debt is primarily tied to one-month LIBOR, which decreased period over period;
•a decline in warehouse debt interest expense (exclusive of debt issuance amortization) of $3.6 million, which was related to decreases in one- and three-month LIBOR period over period, partially offset by a higher average warehouse debt balance outstanding period over period;
•a decline in residual interests classified as debt interest expense of $1.6 million, which was correlated with a lower balance of residual interests classified as debt during the 2021 period, a significant driver of which was the aforementioned deconsolidation of securitizations during the 2020 period; and
•a decline in debt issuance cost interest expense of $2.1 million, which was driven by the acceleration of the amortization of debt issuance costs of $1.0 million in the 2020 period upon the deconsolidation of two securitizations, and an acceleration of warehouse facility debt issuance cost amortization related to a reduction in warehouse facility capacity during the 2020 period, partially offset by interest expense from new debt issuance costs during the 2021 period.
Noninterest income
Noninterest income in our Lending segment for the three months ended March 31, 2021 increased by $68.0 million, or 241%, compared to the three months ended March 31, 2020 due to the following:
Loan origination and sales increased by $6.1 million, or 6%. We experienced a $10.8 million period-over-period increase in home loan originations and sales related income, net of hedges and related interest rate lock commitments. The increase was primarily driven by a 112% increase in home loan origination volume and gains on mortgage pipeline hedges, which was partially offset by losses on interest rate lock commitments due to a decline in our home loan origination pipeline during the 2021 period. In addition, home loan origination fees increased by $2.3 million period over period in conjunction with the increase in origination volume.
These gains were offset by a decrease of $7.0 million in aggregate personal loan and student loan origination and sales income, which was attributable to lower gain on sale execution for both personal loan and student loan sales in the 2021 period, lower origination volume, and higher combined write-offs and repurchase expense of $4.4 million. Student loan origination volume declined 53% period over period, primarily due to lower demand for our student loan refinancing products as a result of the payment deferral period on federal student loans enacted through the CARES Act in late March 2020. Personal loan origination volume declined 11% period over period, primarily due to lower demand for personal loan financing, which we believe is a result of lower consumer spending behavior during the COVID-19 pandemic.
Partially offsetting these decreases were period-over-period gains in our student loan and personal loan economic hedge positions, which are further discussed in the consolidated results of operations discussion under the section entitled “—noninterest income and net revenue” within the table presenting additional information related to loan gains and losses and overall performance.
Securitization income increased by $81.1 million, or 98%, primarily due to a reduction in securitization loan write-offs of $14.8 million, which was correlated with the deconsolidation of securitizations in the 2020 period and stronger securitization loan credit performance during the 2021 period. The decrease in securitization loan write-offs also had the impact of improving
34
our assumed future credit outlook for our securitization loans, which contributed to an aggregate increase of $62.6 million period over period in securitization loan fair market value changes.
These increases were offset by residual debt fair value increases of $13.5 million, which were correlated with underlying securitization performance and residual interest positions representing a greater percentage of securitization claims (which occurs over time as securitization loans are paid off and, accordingly, securitization debt gets paid off) period over period, of which $7.0 million was related to non-cash favorable fair value changes in residual interests classified as debt valuation assumptions and inputs.
Lastly, the aggregate period-over-period increase was driven by a positive variance in our securitization investment earnings of $17.2 million, which was due to a $5.1 million loss realized in the 2020 period related to the deconsolidation of two personal loan securitizations and the aforementioned improvement in credit outlook, which resulted in lower period-over-period bond and residual investment yields, and therefore improved fair market values for both asset classes.
Servicing income decreased by $19.2 million, or 272%, and was primarily related to fair value changes in our servicing assets that were largely attributable to an increase in servicing asset prepayment speed assumptions period over period. We experienced an increase in loan prepayments during the 2021 period, which we believe is correlated with the market interest rate declines compared to the 2020 period, and is related to the effects of the COVID-19 pandemic. We expect prepayments to continue to remain at a higher than historical level in the current low interest rate environment.
Directly attributable expenses
The directly attributable expenses allocated to the Lending segment that were used in the determination of the segment's contribution profit were as follows:
______________
| Three Months Ended March 31, | 2021 vs 2020 % Change | |||||||||||||||||||
| ($ in thousands) | 2021 | 2020 | ||||||||||||||||||
| Direct advertising | $ | 27,849 | $ | 30,607 | (9) | % | ||||||||||||||
| Compensation and benefits | 21,398 | 19,367 | 10 | % | ||||||||||||||||
| Loan origination and servicing costs | 13,992 | 7,872 | 78 | % | ||||||||||||||||
| Affiliate referrals | 6,710 | 10,196 | (34) | % | ||||||||||||||||
| Unused warehouse line fees | 3,701 | 2,350 | 57 | % | ||||||||||||||||
| Occupancy and travel | 1,138 | 2,146 | (47) | % | ||||||||||||||||
| Professional services | 1,441 | 2,106 | (32) | % | ||||||||||||||||
Other(1) | 4,122 | 3,016 | 37 | % | ||||||||||||||||
| Directly attributable expenses | $ | 80,351 | $ | 77,660 | 3 | % | ||||||||||||||
(1)Other expenses primarily include loan marketing expenses and tools and subscriptions costs.
Lending segment directly attributable expenses for the three months ended March 31, 2021 increased by $2.7 million, or 3%, compared to the three months ended March 31, 2020 primarily due to:
•an increase of $6.1 million in loan origination and servicing costs driven primarily by volume increases in our home loan product;
•an increase of $1.4 million in unused warehouse line fees correlated with an increase in committed warehouse facility capacity period over period;
•an increase of $2.0 million in allocated employee compensation and related benefits primarily driven by an overall increase in headcount;
•an increase of $1.1 million in other expenses, primarily related to a servicing receivable write-off and loan marketing expenses;
•an offsetting decrease of $1.0 million in allocated occupancy and travel expenses, primarily driven by the impacts of the COVID-19 pandemic on travel;
35
•an offsetting decrease of $3.5 million in affiliate referral expense related to lower origination volume through our affiliate channels;
•an offsetting decrease of $2.8 million in direct advertising related to a decrease in direct mail marketing, partially offset by an increase in online, social and television advertising spend; and
•an offsetting decrease of $0.7 million in professional services costs related to third party technology and product consulting.
Financial Services Segment
| Three Months Ended March 31, | 2021 vs 2020 % Change | |||||||||||||||||||
($ in thousands) | 2021 | 2020 | ||||||||||||||||||
| Net revenue | ||||||||||||||||||||
| Net interest income | $ | 229 | $ | 215 | 7 | % | ||||||||||||||
| Noninterest income | 6,234 | 1,939 | 222 | % | ||||||||||||||||
Total net revenue | 6,463 | 2,154 | 200 | % | ||||||||||||||||
Directly attributable expenses(1) | (41,982) | (29,137) | 44 | % | ||||||||||||||||
Contribution loss | $ | (35,519) | $ | (26,983) | 32 | % | ||||||||||||||
___________________
(1)For a disaggregation of the directly attributable expenses allocated to the Financial Services segment in each of the periods presented, see "—Directly Attributable Expenses" below.
Three Months Ended March 31, 2021 Compared to Three Months Ended March 31, 2020
Net interest income
Net interest income in our Financial Services segment for the three months ended March 31, 2021was relatively flat compared to the three months ended March 31, 2020 due to the offsetting effects of an increase in SoFi Money account balances and lower interest rates during the 2021 period.
Noninterest income
Noninterest income in our Financial Services segment for the three months ended March 31, 2021 increased by $4.3 million, or 222%, compared to the three months ended March 31, 2020, which was primarily due to a $4.4 million increase in brokerage-related fees, a $0.9 million increase in payment network fees, and a $0.7 million increase in affiliate referral fees. The brokerage fees and payment network fees earned during the 2021 period were bolstered by our acquisition of 8 Limited in the second quarter of 2020, by an increase in cryptocurrency trading volume on our platform and by increased member activity in both the SoFi Invest and SoFi Money products. The increase in affiliate referral fees was primarily attributable to growth in our partner relationships and related activity, as we continue to onboard new partners and help drive volume to these partners. These gains were offset by a trading error loss of $2.2 million during the 2021 period related to our SoFi Invest business.
36
Directly attributable expenses
The directly attributable expenses allocated to the Financial Services segment that were used in the determination of the segment's contribution loss were as follows:
| Three Months Ended March 31, | 2021 vs 2020 % Change | |||||||||||||||||||
| ($ in thousands) | 2021 | 2020 | ||||||||||||||||||
| Compensation and benefits | $ | 18,784 | $ | 18,695 | — | % | ||||||||||||||
| Product fulfillment | 5,043 | 2,574 | 96 | % | ||||||||||||||||
| Member incentives | 4,981 | 2,054 | 143 | % | ||||||||||||||||
| Direct advertising | 3,768 | 388 | 871 | % | ||||||||||||||||
| Occupancy and travel | 1,851 | 2,274 | (19) | % | ||||||||||||||||
| Professional services | 1,568 | 1,167 | 34 | % | ||||||||||||||||
Other(1) | 5,987 | 1,985 | 202 | % | ||||||||||||||||
| Directly attributable expenses | $ | 41,982 | $ | 29,137 | 44 | % | ||||||||||||||
___________________
(1)Other expenses primarily include tools and subscriptions, SoFi Money and SoFi Invest account write offs and marketing expenses.
Financial Services directly attributable expenses for the three months ended March 31, 2021 increased by $12.8 million, or 44%, compared to the three months ended March 31, 2020 primarily due to the following:
•an increase of $4.0 million in other expenses primarily related to tools and subscription costs, marketing and write offs of SoFi Money accounts;
•an increase of $3.4 million in direct advertising costs, such as social media and search engine advertising costs, which was primarily related to the continued promotion of, and growth in, our Financial Services products;
•an increase of $2.9 million related to direct member incentives for SoFi Money and SoFi Invest;
•an increase of $2.5 million in product fulfillment costs related to SoFi Invest and SoFi Money, which included such activities as operating our cash management sweep program, brokerage expenses and debit card fulfillment services;
•an increase of $0.4 million in professional services costs related to third party technology and product consulting for SoFi Money; and
•an offsetting decrease in occupancy and travel of $0.4 million, primarily driven by the impacts of the COVID-19 pandemic on travel.
Compensation and benefits within the Financial Services segment was relatively consistent period over period, as the costs were aligned with the segment initiatives in the respective periods.
Technology Platform Segment
In the table below, we present a metric that is exclusive to the Galileo portion of our Technology Platform segment:
| March 31, 2021 | March 31, 2020 | 2021 vs 2020 % Change | |||||||||||||||
Total accounts | 69,572,680 | — | n/m | ||||||||||||||
In our Technology Platform segment, total accounts refers to the number of open accounts at Galileo as of the reporting date, excluding SoFi accounts, as such accounts are eliminated in consolidation. We acquired Galileo on May 14, 2020. As such, no information is reported for the three months ended March 31, 2020, as it preceded our acquisition. Total accounts is a primary indicator of the amount of accounts that are dependent upon Galileo’s technology platform to use virtual card products, virtual wallets, make peer-to-peer and bank-to-bank transfers, receive early paychecks, separate savings from spending balances and rely upon real-time authorizations, all of which result in technology platform fees for the Technology Platform segment.
37
The following table presents the measure of contribution profit for the Technology Platform segment for the periods indicated. The information is derived from our internal financial reporting used for corporate management purposes. Refer to Note 16 in the accompanying unaudited condensed consolidated financial statements included elsewhere in this Current Report on Form 8-K for further details regarding Technology Platform segment performance.
| Three Months Ended March 31, | 2021 vs 2020 % Change | |||||||||||||||||||
($ in thousands) | 2021 | 2020 | ||||||||||||||||||
| Net revenue | ||||||||||||||||||||
| Net interest income (loss) | $ | (36) | $ | — | n/m | |||||||||||||||
| Noninterest income | 46,101 | 997 | n/m | |||||||||||||||||
| Total net revenue | 46,065 | 997 | n/m | |||||||||||||||||
Directly attributable expenses(1) | (30,380) | — | n/m | |||||||||||||||||
| Contribution Profit | $ | 15,685 | $ | 997 | n/m | |||||||||||||||
___________________
(1)For a disaggregation of the directly attributable expenses allocated to the Technology Platform segment in the three months ended March 31, 2021, see “—Directly Attributable Expenses” below.
Three Months Ended March 31, 2021 Compared to Three Months Ended March 31, 2020
Total net revenue of $46.1 million during the three months ended March 31, 2021 was primarily related to Technology Platform fees at Galileo, which we acquired in the second quarter of 2020. Total net revenue during the three months ended March 31, 2020 was comprised of our equity method investment income from our investment in Apex. We did not recognize any equity method investment income during the 2021 period, as our Apex equity method investment was called during the period.
Directly Attributable Expenses
The directly attributable expenses allocated to the Technology Platform segment that were used in the determination of the segment's contribution profit for the three months ended March 31, 2021 were related to the operations of Galileo and consisted of the items discussed below. There were no directly attributable expenses allocated to the Technology Platform segment during the three months ended March 31, 2020.
•$16.2 million in employee compensation and related benefits expenses;
•$7.0 million in technology platform third-party fulfillment costs;
•$2.1 million in professional services costs;
•$1.4 million in occupancy and travel expenses; and
•$3.7 million of other expenses, primarily related to tools and subscription costs, marketing expenses and data center expenses, the latter of which was associated with the operation of our technology platform-as-a-service.
38
Reconciliation of Directly Attributable Expenses
The following table reconciles directly attributable expenses allocated to our reportable segments to total noninterest expense in the accompanying Unaudited Condensed Consolidated Statements of Operations and Comprehensive Loss for the periods indicated:
___________________
| Three Months Ended March 31, | |||||||||||
| 2021 | 2020 | ||||||||||
| Reportable segments directly attributable expenses | $ | (152,713) | $ | (106,797) | |||||||
| Expenses not allocated to segments: | |||||||||||
| Stock-based compensation expense | (37,454) | (19,685) | |||||||||
| Depreciation and amortization expense | (25,977) | (4,715) | |||||||||
| Fair value changes in warrant liabilities | (89,920) | (2,879) | |||||||||
Employee-related costs(1) | (32,280) | (27,896) | |||||||||
Other corporate and unallocated expenses(2) | (34,105) | (22,640) | |||||||||
| Total noninterest expense | $ | (372,449) | $ | (184,612) | |||||||
(1)Includes compensation, benefits, recruiting, certain occupancy-related costs and various travel costs of executive management, certain technology groups and general and administrative functions that are not directly attributable to the reportable segments.
(2)Includes corporate overhead costs that are not allocated to reportable segments, such as certain tools and subscription costs, corporate marketing costs and professional services costs.
Liquidity and Capital Resources
We require substantial liquidity to fund our current operating requirements, which primarily include loan originations and the losses generated by our Financial Services segment. We expect these requirements to increase as we pursue our strategic growth goals. Historically, our Lending cash flow variability has related to loan origination volume, our available funding sources and utilization of our warehouse facilities. Additional sources of variability have related to our acquisitions of Galileo and 8 Limited. Moreover, given our continued growth initiatives, we have seen variability in financing cash flows due to the timing and extent of common stock and redeemable preferred stock raises, redemptions and additional uses of debt. During February 2021, we paid off the seller note issued in 2020 in connection with our acquisition of Galileo, inclusive of all outstanding interest payable, for a total payment of $269.9 million. Remaining operating cash flow variability is largely related to our investments in our business, such as technology and product investments and sales and marketing initiatives, as well as our operating lease facilities. Our capital expenditures have historically been immaterial relative to our operating and financing cash flows, and we expect this trend to continue for the foreseeable future.
To continue to achieve our liquidity objectives, we analyze and monitor liquidity needs and strive to maintain excess liquidity and access to diverse funding sources. We define our liquidity risk as the risk that we will not be able to:
•Originate loans at our current pace, or at all;
•Sell our loans at favorable prices, or at all;
•Meet our contractual obligations as they become due;
•Increase or extend the maturity of our revolving credit facility capacity;
•Fund continued operating losses in our business, especially if such operating losses continue at the current level for an extended period of time; or
•Make future investments in the necessary technological and operating infrastructure to support our business.
During the three months ended March 31, 2021 and 2020, we generated positive cash flows from operations. The primary driver of operating cash flows relates to our Lending segment, particularly origination volume, the holding period of our loans, loan sale execution and, to a lesser extent, the timing of loan repayments. We either fund our loan originations entirely using our own capital, through proceeds from securitization transactions, or receive an advance rate from our various warehouse facilities to finance the majority of the loan amount. Our cash flows from operations were also impacted by material net losses
39
in both the 2021 and 2020 periods. The net losses were primarily driven by our technology and product investments and sales and marketing initiatives, which benefit our Lending and Financial Services segments, the latter of which historically has not generated material net revenues. Our practice of not charging account or trading fees on the majority of our products within the Financial Services segment could result in sustained negative cash flows generated from the Financial Services segment in the short and long term. If our current net losses continue for the foreseeable future, we may need to raise additional capital in the form of equity or debt, which may not be at favorable terms when compared to previous financing transactions.
Historically, we utilized our revolving credit facility capacity, term loan financing or additional equity proceeds to fund the portion of our current net loss unrelated to our loan origination activities. Our revolving credit facility had remaining capacity of $74.0 million as of March 31, 2021, of which $6.0 million was not available for general borrowing purposes because it was utilized to secure the uncollateralized portion of certain letters of credit issued to secure certain of our operating lease obligations. As of March 31, 2021, the remaining $3.3 million of the $9.3 million letters of credit outstanding was collateralized by cash deposits with the banking institution, which were presented within restricted cash and restricted cash equivalents in the accompanying Unaudited Condensed Consolidated Balance Sheets.
Our warehouse facility and securitization debt is secured by a continuing lien on, and security interest in, the loans financed by the proceeds. The notes assumed in our acquisition of Galileo during the second quarter of 2020 are secured by the value of certain equipment. We have various affirmative and negative financial covenants, as well as non-financial covenants, related to our warehouse debt and revolving credit facility, as well as our redeemable preferred stock. We were in compliance with all covenants as of March 31, 2021.
Our operating lease obligations consist of our leases of real property from third parties under non-cancellable operating lease agreements, which primarily include the leases of office space, as well as our rights to certain suites and event space within SoFi Stadium, which commenced in the third quarter of 2020 and the latter of which we apply the short-term lease exemption practical expedient and do not capitalize the lease obligation. Our finance lease obligations consist of our rights to certain physical signage within SoFi Stadium, which commenced in the third quarter of 2020. Additionally, our securitization transactions require us to maintain a continuing financial interest in the form of securitization investments when we deconsolidate the special-purpose entity (“SPE”) or in consolidation of the SPE when we have a significant financial interest. In either instance, the continuing financial interest requires us to maintain capital in the SPE that would otherwise be available to us if we had sold loans through a different channel.
We are currently dependent on the success of our Lending segment. Our ability to access whole loan buyers and to sell our loans on favorable terms, maintain adequate warehouse capacity at favorable terms and limit our continuing financial interest in securitization-related transfers is critical to our growth strategy and our ability to have adequate liquidity to fund our balance sheet. As it relates to securitization-related transfers, there is no guarantee that we will be able to find purchasers of securitization residual interests or that we will be able to execute loan transfers at favorable price points. Therefore, we may hold securitization interests for longer than planned or be forced to liquidate at suboptimal prices. Securitization transfers are also negatively impacted during recessionary periods, wherein investors may be more risk averse.
Further, future uncertainties around the demand for our personal loans and around the student loan refinance market in general should be considered when assessing our future liquidity and solvency prospects. Through the CARES Act that was passed during 2020 in response to the COVID-19 pandemic and subsequent extensions, principal and interest payments on federally-held student loans have been suspended through September 30, 2021, which in turn has lowered and will likely continue to lower the propensity for borrowers to refinance into SoFi student loans during the suspension period. To the extent that further extensions or additional measures, such as student loan forgiveness, are implemented, it may negatively impact our future student loan origination volume. In addition, in the past we have altered our credit strategy to defend against adverse credit consequences during recessionary periods, as we did following the outbreak of COVID-19. In the future, our loan origination volume and our resulting loan balances, and any positive cash flows thereof, could be lower based on strategic decisions to tighten our credit standards. See “— Key Factors Affecting Operating Results — Industry Trends and General Economic Conditions” and “— Business Overview — COVID-19 Pandemic” for discussions of the impact of certain measures taken in response to the COVID-19 pandemic on our loan origination volumes and uncertainties that exist with respect to future operations in light of the pandemic.
Our commitments requiring the use of capital in future periods consist primarily of warehouse facility borrowings, which carry variable interest rates, operating lease obligations, and commitments arising out of our agreement for the naming and sponsorship rights to SoFi Stadium, consisting of both lease and non-lease components. The non-lease components of the agreement pertain primarily to sponsorship and advertising opportunities related to the stadium itself, as well as the surrounding performance venue and planned retail district. See Note 8 and Note 14 in the accompanying unaudited condensed consolidated
40
financial statements included elsewhere in this Current Report on Form 8-K for additional information on our warehouse debt and our lease obligations, respectively. Also see Note 14 for additional information on our SoFi Stadium arrangement, including a contingent matter associated with SoFi Stadium payments. As it relates to our securitization debt, the maturity of the notes issued by the various trusts occurs upon either the maturity of the loan collateral or full payment of the loan collateral held in the trusts, the timing of which cannot be reasonably estimated. Our own liquidity resources are not required to make any contractual payments on these borrowings, except in limited instances associated with our guarantee arrangements, as discussed below.
We have a three-year obligation to FNMA on loans that we sell to FNMA, to repurchase any originated loans that do not meet FNMA guidelines, and we are required to pay the full initial purchase price back to FNMA. In addition, we make standard representations and warranties related to other student, personal and non-FNMA home loan transfers, as well as limited credit-related repurchase guarantees on certain such transfers. If realized, any of the repurchases would require the use of cash. See Note 1 and Note 14 in the accompanying unaudited condensed consolidated financial statements included elsewhere in this Current Report on Form 8-K for further information on our guarantee obligations. We believe we have adequate liquidity to meet these obligations.
Our long-term liquidity strategy includes maintaining adequate revolving credit facility capacity and seeking additional sources of financing. Although our goal is to increase our cash flow from operations, there can be no assurance that our future operating plans will lead to improved operating cash flows.
We had unrestricted cash and cash equivalents of $351.3 million and $872.6 million as of March 31, 2021 and December 31, 2020, respectively. We believe our existing cash and cash equivalents balance, available capacity under our revolving credit facility (and expected extensions or replacements of the facility), together with additional warehouses or other financing we expect to be able to obtain at reasonable terms and cash proceeds received from the Business Combination, will be sufficient to cover net losses, meet our existing working capital and capital expenditure needs, as well as our planned growth for at least the next 12 months. Our non-securitization loans also represent a key source of liquidity for us, and should be considered in assessing our overall liquidity. We also have relationships with whole loan buyers who we believe we will be able to continue to rely on to generate near-term liquidity. Securitization markets can also generate additional liquidity, albeit to a lesser extent, as it involves accessing a much less liquid securitization residual investment market, and in certain cases we are required to maintain a minimum investment due to securitization risk retention rules.
We intend to use a portion of the net cash proceeds from the Business Combination for payment of certain transaction expenses. The remaining funds after the payment of transaction expenses are intended to be used for the repurchase of certain common stock from a shareholder for $150.0 million and a special payment to Series 1 preferred stockholders, which is expected to be $21.2 million in accordance with the Merger Agreement. The remaining net cash proceeds will be retained by the Company to help fund future strategic and capital needs, including repayment of loan warehouse facility debt.
Cash Flow and Liquidity Analysis
The following table provides a summary of cash flow data:
| Three Months Ended March 31, | ||||||||||||||
| ($ in thousands) | 2021 | 2020 | ||||||||||||
| Net cash provided by operating activities | $ | 340,051 | $ | 272,799 | ||||||||||
| Net cash provided by investing activities | 180,947 | 65,339 | ||||||||||||
| Net cash provided by (used in) financing activities | (1,145,779) | 81,902 | ||||||||||||
Cash Flows from Operating Activities
For the three months ended March 31, 2021, net cash provided by operating activities was $340.1 million, which stemmed from a net loss of $177.6 million that was positively adjusted for non-cash items of $164.8 million, and a favorable change in our operating assets net of operating liabilities of $352.8 million. The change in operating assets net of operating liabilities was primarily a result of our loan origination and sales activities. We originated loans of $2.6 billion during the period and also purchased loans of $1.2 million. These cash uses were offset by principal payments from members of $0.5 billion and proceeds from loan sales of $2.4 billion.
For the three months ended March 31, 2020, net cash provided by operating activities was $272.8 million, which stemmed from a net loss of $106.4 million that was positively adjusted for non-cash items of $58.9 million, and a favorable change in
41
operating assets net of operating liabilities of $320.2 million. The change in operating assets net of operating liabilities was primarily a result of our loan origination and sales activities. We originated loans of $3.4 billion during the period and also purchased certain loans of $35.2 million, the majority of which were related to securitization clean-up calls. These cash uses were offset by principal payments from members of $0.5 billion and proceeds from loan sales of $3.2 billion.
Cash Flows from Investing Activities
For the three months ended March 31, 2021, net cash provided by investing activities was $180.9 million, which was primarily attributable to proceeds of $107.5 million from the call on our equity method investment in Apex and proceeds of $64.2 million from our securitization investments. Additionally, Apex repaid its outstanding principal balance of $16.7 million. Lastly, we used $7.4 million for purchases of property, equipment and software.
For the three months ended March 31, 2020, net cash provided by investing activities was $65.3 million, which was primarily attributable to proceeds from our securitization investments of $71.0 million, partially offset by $5.5 million for purchases of property, equipment and software.
Cash Flows from Financing Activities
For the three months ended March 31, 2021, net cash used in financing activities was $1.1 billion. We received $1.9 billion of proceeds from debt financing activities related to our lending activities. These debt proceeds were more than offset by $2.9 billion of debt repayments, of which $2.5 billion were related to our warehouse facilities. Our payments of debt issuance costs were in the normal course of business and reflective of our recurring debt warehouse facility activity, which involves securing new warehouse facilities and extending existing warehouse facilities. We also paid taxes related to restricted stock unit (“RSU”) vesting of $26.0 million. Finally, we paid $132.9 million to repurchase redeemable preferred stock and $0.5 million to repurchase common stock during the period.
For the three months ended March 31, 2020, net cash provided by financing activities was $81.9 million. We received $3.2 billion of proceeds from debt financing activities, which were primarily attributable to our lending activities. These debt proceeds were partially offset by $3.1 billion of debt repayments, of which $2.8 billion were related to our warehouse facilities. Our payments of debt issuance costs were in the normal course of business. We also paid taxes related to RSU vesting of $4.6 million.
Borrowings
Our borrowings primarily include our loan and risk retention warehouse facilities, asset-backed securitization debt and revolving credit facility. A detailed description of each of our borrowing arrangements is included in Note 8 in the accompanying unaudited condensed consolidated financial statements included elsewhere in this Current Report on Form 8-K.
The amount of financing actually advanced on each individual loan under our loan warehouse facilities, as determined by agreed-upon advance rates, may be less than the stated advance rate depending, in part, on changes in underlying loan characteristics of the loans securing the financings. Each of our loan warehouse facilities allows the lender providing the funds to evaluate the market value of the loans that are serving as collateral for the borrowings or advances being made. As it relates to home loan warehouse facilities and risk retention warehouse facilities, if the lender determines that the value of the collateral has decreased, the lender can require us to provide additional collateral or reduce the amount outstanding with respect to those loans (e.g., initiate a margin call). Our inability or unwillingness to satisfy the request could result in the termination of the facilities and possible default under our other loan funding facilities. In addition, a large unanticipated margin call could have a material adverse effect on our liquidity.
The amount owed and outstanding on our loan warehouse facilities fluctuates significantly based on our origination volume, sales volume, the amount of time it takes us to sell our loans, and the amount of loans being self-funded with cash. We may, from time to time, use surplus cash to self-fund a portion of our loan originations and risk retention in the case of securitization transfers.
Our debt warehouse facilities and revolving credit facility also generally require us to comply with certain operating and financial covenants and the availability of funds under these lending arrangements is subject to, among other conditions, our continued compliance with these covenants. These financial covenants include, but are not limited to, maintaining: (i) a certain minimum tangible net worth, (ii) minimum cash and cash equivalents, and (iii) a maximum leverage ratio of total debt to tangible net worth. A breach of these covenants can result in an event of default under these facilities and allows the lenders to
42
pursue certain remedies. Our subsidiaries are restricted in the amount that can be distributed to SoFi only to the extent that such distributions would cause the financial covenants to not be met.
In addition, pursuant to our Series 1 redeemable preferred stock agreement, we are subject to the following financial covenants:
•Tangible net worth to total debt ratio, which excludes our warehouse, risk retention and securitization related debt;
•Tangible net worth to Series 1 redeemable preferred stock ratio requirement; and
•Minimum excess equity requirements, which measure includes redeemable preferred stock, exclusive of Series 1 redeemable preferred stock.
We were in compliance with all covenants as of March 31, 2021.
Financial Condition Summary
March 31, 2021 compared to December 31, 2020
Changes in the composition and balance of our assets and liabilities as of March 31, 2021 compared to December 31, 2020 were principally attributed to the following:
•a decrease of $624.9 million in cash and cash equivalents and restricted cash and restricted cash equivalents. See “— Cash Flow and Liquidity Analysis” for further discussion of our cash flow activity;
•a decrease of $533.3 million in gross warehouse facility debt and a decrease of $191.9 million in gross securitization debt, which decreased in line with related loan collateral repayments;
•a net decrease in loans of $392.5 million, primarily stemming from originations of $2.6 billion, offset by principal payments and sales of $2.9 billion;
•a decrease in equity method investments of $107.5 million, as Apex called our investment; and
•a decrease in related party notes receivable of $17.9 million, as Apex repaid their outstanding loans.
Critical Accounting Policies and Estimates
Our accompanying unaudited condensed consolidated financial statements included elsewhere in this Current Report on Form 8-K have been prepared in accordance with accounting principles generally accepted in the United States. In preparing our accompanying unaudited condensed consolidated financial statements, we make judgments, estimates and assumptions that affect reported amounts of assets and liabilities, as well as revenues and expenses. We base our assumptions, judgments and estimates on historical experience and various other factors that we believe to be reasonable under the circumstances. The results involve judgments about the carrying values of assets and liabilities not readily apparent from other sources. Actual results could differ materially from these estimates under different assumptions or conditions. We regularly evaluate our estimates, assumptions and judgments, particularly those that include the most difficult, subjective or complex judgments and are often about matters that are inherently uncertain. See Note 1 in the accompanying unaudited condensed consolidated financial statements included elsewhere in this Current Report on Form 8-K for a summary of our significant accounting policies. The most significant judgments, estimates and assumptions relate to the critical accounting policies, which are summarized below and discussed in detail beginning on page 275 of the Proxy Statement/Prospectus.
•Stock-based compensation: Refer to the Proxy Statement/Prospectus for the methodology and inputs used to determine the value of our common stock for historical periods. For the period subsequent to executing the Merger Agreement on January 7, 2021, we determined the value of our common stock based on the observable daily closing price of SCH’s stock (ticker symbol “IPOE”) multiplied by the exchange ratio in effect for such transaction date.
•Consolidation of variable interest entities
•Fair value
43
•Business combinations
We evaluate our critical accounting policies and estimates on an ongoing basis and update them as necessary based on changes in market conditions or factors specific to us.
Recent Accounting Standards Issued, But Not Yet Adopted
See Note 1 in the accompanying unaudited condensed consolidated financial statements included elsewhere in this Current Report on Form 8-K.
Off-Balance Sheet Arrangements
We enter into arrangements in which we originate loans, establish an SPE and transfer loans to the SPE, which has historically served as an important source of liquidity. We also retain the servicing rights of the underlying loans and hold additional interests in the SPE. When an SPE is determined not to be a VIE or when an SPE is determined to be a VIE but we are not the primary beneficiary, the SPE is not consolidated. In addition, a significant change to the pertinent rights of other parties or our pertinent rights, or a significant change to the ranges of possible financial performance outcomes used in our assessment of the variability of cash flows due to us, could impact the determination of whether or not a VIE is consolidated. VIE consolidation and deconsolidation may lead to increased volatility in our financial results and impact period-over-period comparability. See Note 1 in the accompanying unaudited condensed consolidated financial statements included elsewhere in this Current Report on Form 8-K for our VIE consolidation policy.
We established personal loan trusts and student loan trusts that were created and designed to transfer credit and interest rate risk associated with the underlying loans through the issuance of collateralized notes and residual certificates. We hold a variable interest in the trusts through our ownership of collateralized notes in the form of asset-backed bonds and residual certificates in the trusts. The residual certificates absorb variability and represent the equity ownership interest in the equity portion of the personal loan trusts and student loan trusts.
We are also the servicer for all trusts in which we hold a financial interest. Although we have the power as servicer to perform the activities that most impact the economic performance of the VIE, we do not hold a significant financial interest in the trusts and, therefore, we are not the primary beneficiary. Further, we do not provide financial support beyond our initial equity investment, and our maximum exposure to loss as a result of our involvement with nonconsolidated VIEs is limited to our investment. For a more detailed discussion of nonconsolidated VIEs, including activity in relation to the establishment of trusts, the aggregate outstanding values of variable interests and the deconsolidation of VIEs, see Note 4 in the accompanying unaudited condensed consolidated financial statements included elsewhere in this Current Report on Form 8-K.
As a component of our loan sale agreements, we make certain representations to third parties that purchased our previously held loans, which includes FNMA repurchase requirements, general representations and warranties and credit-related repurchase requirements, all of which are standard in nature and, therefore, do not constrain our ability to recognize a sale for accounting purposes. Pursuant to ASC 460, Guarantees, we establish a loan repurchase liability, which is based on historical experience and any current developments which would make it probable that we would buy back loans previously sold to third parties at the historical sales price. Our credit-related repurchase requirements are assessed for loss under ASC 326, Financial Instruments—Credit Losses. During the three months ended March 31, 2021, we made repurchases of $1.3 million associated with these arrangements. As of March 31, 2021, we accrued liabilities of $6.4 million related to our estimated repurchase obligation.
We do not engage in any other off-balance sheet financing arrangements, as defined in Item 303(a)(4)(ii) of Regulation S-K.
Quantitative and Qualitative Disclosures about Market Risk
In the normal course of business, we are subject to a variety of risks which can affect our operations and profitability. We broadly define these areas of risk as interest rate risk, market risk, credit risk and counterparty risk. Historically, substantially all of our revenue and operating expenses were denominated in U.S. dollars. As a result of our acquisitions in the second quarter of 2020, which are further discussed in Note 2 in the accompanying unaudited condensed consolidated financial statements included elsewhere in this Current Report on Form 8-K, we may in the future be subject to increasing foreign currency exchange rate risk. Foreign currency exchange rate risk is the risk that our financial position or results of operations could be positively or negatively impacted by fluctuations in exchange rates. For the periods presented in the accompanying unaudited
44
condensed consolidated financial statements, there would have been an immaterial impact on earnings if exchange rates were to have increased or decreased.
Interest Rate Risk
We are subject to interest rate risk associated with our consolidated loans, securitization investments (including residual investments and asset-backed bonds), servicing rights and variable-rate debt. Our loan portfolio consists of personal loans, student loans and home loans, which are carried at fair value on a recurring basis, and credit cards, which are measured at amortized cost. The loans with variable interest rates are exposed to interest rate volatility, which impacts the amount of interest income we recognize on our accompanying Unaudited Condensed Consolidated Statements of Operations and Comprehensive Loss. Our securitization residual investments are carried at fair value, which is subject to changes in market value by virtue of the impact of interest rates on the market yield of the residual investments. The value and earnings of our asset-backed bonds, which are associated with our personal loans and student loans, have a converse relationship to the movement of interest rates. That is, as interest rates rise, bond values and earnings fall and vice versa. Lastly, we are subject to interest rate risk on our variable-rate warehouse facilities and our revolving credit facility. Future funding activities may increase our exposure to interest rate risk, as the interest rates payable on such funding are tied to the one-month or three-month LIBOR. These arrangements will also be subject to the reference rate reform guidance, which is further discussed in Note 1 in the accompanying unaudited condensed consolidated financial statements included elsewhere in this Current Report on Form 8-K.
Interest rate risk also occurs in periods where changes in short-term interest rates result in loans being originated with terms that provide a smaller interest rate spread above the financing terms of our warehouse facilities, which can negatively impact our realized net interest income.
Credit Risk
We are subject to credit risk, which is the risk of default that results from a borrower’s inability or unwillingness to make contractually required loan payments, or declines in home loan collateral values. Generally, all loans sold into the secondary market are sold without recourse. For such loans, our credit risk is limited to repurchase obligations due to fraud or origination defects. For loans that were repurchased or not sold in the secondary market, we are subject to credit risk to the extent a borrower defaults and we are not able to fully recover the principal balance. We believe that this risk is mitigated through the implementation of stringent underwriting standards, strong fraud detection tools and technology designed to comply with applicable laws and our standards. In addition, we believe that this risk is mitigated through the quality of our loan portfolio. The weighted average origination FICO during the three months ended March 31, 2021 was 767.
Market Risk
We are exposed to the risk of loss to future earnings, values or future cash flows that may result from changes in market discount rates. We are exposed to such market risk directly through loans, servicing rights and securitization investments held on our balance sheet, all of which are measured at fair value on a recurring basis using a discounted cash flow methodology in which the discount rate represents an estimate of the required rate of return by market participants. The discount rates for our loans and securitization investments may change due to expected loan performance or changes in the expected returns of similar financial instruments available in the market. For our servicing rights, the discount rate is commensurate with the risk of the servicing asset cash flow, which varies based on the characteristics of the serviced loan portfolio.
Counterparty Risk
We are subject to risk that arises from our debt warehouse facilities and interest rate risk hedging activities. These activities generally involve an exchange of obligations with unaffiliated lenders or other companies, referred to in such transactions as “counterparties”. If a counterparty were to default, we could potentially be exposed to financial loss if such counterparty were unable to meet its obligations to us. We manage this risk by selecting only counterparties that we believe to be financially strong, spreading the risk among many such counterparties, placing contractual limits on the amount of dependence on any single counterparty, and entering into netting agreements with the counterparties as appropriate.
In accordance with Treasury Market Practices Group’s recommendation, we execute Securities Industry and Financial Markets Association trading agreements with all material trading partners. Each such agreement provides for an exchange of margin money should either party’s exposure exceed a predetermined contractual limit. Such margin requirements limit our overall counterparty exposure. The master netting agreements contain a legal right to offset amounts due to and from the same counterparty. Derivative assets in the accompanying Unaudited Condensed Consolidated Balance Sheets represent derivative
45
contracts in a gain position net of loss positions with the same counterparty and, therefore, also represent our maximum counterparty credit risk. We incurred no losses due to nonperformance by any of our counterparties during the three months ended March 31, 2021. We did not have any derivative liability positions subject to master netting arrangements as of March 31, 2021. Our derivative asset position was $7,505 as of March 31, 2021.
Also, in the case of our debt warehouse facilities, we are subject to risk if the counterparty chooses not to renew a borrowing agreement and we are unable to obtain financing to originate loans. With our debt warehouse facilities, we seek to mitigate this risk by ensuring that we have sufficient borrowing capacity with a variety of well-established counterparties to meet our funding needs. As of March 31, 2021, we had total borrowing capacity under debt warehouse facilities of $5.9 billion, of which $1.9 billion was utilized. Refer to Note 8 in the accompanying unaudited condensed consolidated financial statements included elsewhere in this Current Report on Form 8-K for a listing of our debt warehouse facilities.
Legal Proceedings
In limited instances, the Company may be subject to a variety of claims and lawsuits in the ordinary course of business. Regardless of the final outcome, defending lawsuits, claims, government investigations, and proceedings in which we are involved is costly and can impose a significant burden on management and employees, and there can be no assurances that we will receive favorable final outcomes.
Galileo Class Action Litigation. Galileo is a defendant in a putative class action, captioned as Richards, et. al v. Chime Financial, Inc., Galileo Financial Technologies and The Bancorp, Inc., Civil Action No. 4:19-cv-6864-HSG (N.D. Cal.), filed in the United States District Court for the Northern District of California in October 2019. Plaintiff asserts various claims against the defendants arising from an intermittent disruption in service experienced by certain holders of Chime Financial, Inc. (“Chime”) deposit accounts preventing them from accessing or using account funds for portions of time between October 16, 2019 and October 19, 2019. The parties have entered into a class action settlement agreement to resolve the claims in the action. The window for Plaintiff to submit claims closed in February 2021. See Note 14 to the accompanying unaudited condensed consolidated financial statements included elsewhere in this Current Report on Form 8-K for additional information on this matter.
The CFPB is also conducting investigations into whether Chime or other deposit accountholders were harmed by Galileo in connection with the intermittent service disruption covering several time periods. We may in the future be subject to additional lawsuits and disputes. We are also involved in other claims, government investigations, and proceedings arising from the ordinary course of our business. Although the results of such lawsuits, claims, government investigations and proceedings cannot be predicted with certainty, we do not believe that the final outcome of these other matters will have a material adverse effect on our business, financial condition, or results of operations.
Juarez et al v. SoFi Lending Corp. SoFi Lending Corp. and SoFi (collectively, the “SoFi Defendants”) are defendants in a putative class action, captioned as Juarez v. Social Finance, Inc. et al., Civil Action No. 4:20-cv-03386-HSG, filed against them in the United States District Court for the Northern District of California in May 2020 (the “Action”). Plaintiffs, who are non-U.S. citizens, allege that the SoFi Defendants engaged in unlawful lending discrimination in violation of 42 U.S.C. § 1981 and California Civil Code, § 51, et seq., through policies and practices making two categories of certain non-United States citizen loan applicants — i.e., United States residents who hold Deferred Access for Childhood Arrivals (“DACA”) status or who hold green cards with a validity period of less than two years — ineligible for loans or eligible only with a co-signer who is a United States citizen or lawful permanent resident. Plaintiffs further allege that the SoFi Defendants violated 15 U.S.C. § 1981, the Fair Credit Reporting Act, by accessing the credit reports of non-United States citizen loan applicants who hold green cards with a validity period of less than two years without a permissible purpose. As relief, Plaintiffs seek, on behalf of themselves and a purported class of similarly-situated non-United States citizen loan applicants, a declaratory judgment that the challenged policies and practices violate federal and state law, an injunction against future violations, actual and statutory damages, exemplary and punitive damages, and attorneys’ fees. The SoFi Defendants filed a motion to, among other things, dismiss Plaintiffs’ claims for failure to state a claim, and/or compel arbitration. By order dated April 12, 2021, the court dismissed Plaintiffs’ California Civil Code, § 51 claim without prejudice, and declined the SoFi Defendants’ motion to dismiss the remaining counts. Although there can be no assurance as to the ultimate disposition of the Action, the SoFi Defendants continue to deny liability to Plaintiffs and the putative class members, believe that they have meritorious defenses against Plaintiffs’ claims, and intend to vigorously defend themselves and oppose class certification. We cannot reasonably estimate an amount of loss or range of possible loss associated with this matter.
SoFi Wealth Consent Agreement. We and the staff of the SEC Division of Enforcement have agreed in principle to an offer of settlement, without admitting or denying the SEC’s findings, which includes, among other things, a civil penalty of $300, to
46
close a pending investigation of SoFi Wealth for alleged violations of Section 206(2) and Section 206(4) of the Investment Advisers Act and Rule 206(4)-7 thereunder by SoFi Wealth. The SEC staff’s allegations relate to actions undertaken by SoFi Wealth in April 2019 to rebalance certain holdings of unaffiliated exchange traded funds (“ETFs”) in clients’ automated investment advisory accounts with holdings of SoFi-branded ETFs which had lower operating expense ratios sponsored and managed by an affiliate of SoFi Wealth. In particular, although SoFi Wealth had disclosed to clients in its Form ADV that it could use affiliated ETFs, such as SoFi-branded ETFs, in the automated investment advisory accounts, the SEC staff alleges that SoFi Wealth also should have disclosed certain alleged conflicts of interest concerning use of the SoFi-branded ETFs: specifically that SoFi Wealth preferred to use the SoFi-branded ETFs, because SoFi expected to receive a marketing benefit from use of the SoFi-branded ETFs, and that the automated investment advisory accounts would be an important early source of assets in connection with the launch of the SoFi-branded ETFs.
The offer of settlement is subject to formal acceptance by the SEC and could change, and a final settlement cannot be assured. By its current terms, and without admitting or denying the SEC staff’s findings, SoFi Wealth would agree to the following: a censure, an order to cease-and-desist from future violations of Section 206(2), Section 206(4), and Rule 206(4)-7, a civil penalty of $300, and undertakings to review all relevant disclosure documents, to review SoFi Wealth’s compliance policies and to notify clients concerning the terms of the prospective order. The offer of settlement would not require any disgorgement to customers by SoFi Wealth. We do not believe such a resolution, if accepted by the SEC, would result in any material limitations on the ongoing business or operations of SoFi or SoFi Wealth.
In re Renren Inc. Derivative Litigation. On March 22, 2021, SoFi was named as a newly added defendant in an Amended and Supplemental Consolidated Stockholder Derivative Complaint (the “Amended Complaint”) filed in an ongoing action pending in the Supreme Court of New York, captioned In re Renren, Inc. Derivative Litigation, Index No. 653564/2018. The plaintiffs, Hen Ren Silk Road Investments LLC, Oasis Investments II Master Fund Ltd., and Jodi Arama, allege that the Chairman and Chief Executive Officer of Renren, Inc. (“Renren”), Joseph Chen, and others, breached their fiduciary duties to Renren’s shareholders in connection with a transaction in which Renren spun off its holdings of SoFi shares (as well as stock in other entities) to Oak Pacific Investments (“OPI”), an entity allegedly controlled by Mr. Chen. The Amended Complaint alleges that SoFi’s receipt of approximately 17 million of its own securities from OPI pursuant to a call option transfer during the pendency of the lawsuit constituted a fraudulent conveyance. The sole claim asserted against SoFi is that SoFi allegedly received a fraudulent conveyance pursuant to D.C.L. Section 276 (as in effect in March 2019) that should be voided and set aside pursuant to D.C.L. Sections 278 and 279 (as effective in 2019), as well as unspecified compensatory damages. The Amended Complaint seeks, among other things, an order to impose a constructive trust over the SoFi shares transferred from Renren or the proceeds thereof, voiding and setting aside the call option transfer of approximately 17 million SoFi shares as a fraudulent conveyance, and requiring the Company to pay over the value of the call option transfer. The Company intends to vigorously defend against the action and believes that any claims against it are meritless. We cannot reasonably estimate an amount of loss or range of possible loss associated with this matter.
47