Attached files
| file | filename |
|---|---|
| 8-K - FORM 8-K - Karat Packaging Inc. | tm2118298d1_8k.htm |
Exhibit 99.1

K ARAT P ACKAGING I NC . (N ASDAQ : KRT) June 2021 Investor Presentation

D ISCLAIMER Forward - Looking Statements Certain statements made in this presentation regarding Karat Packaging Inc . or its affiliates (the “Company”) regarding the Company’s expectations, beliefs, goals or prospects may constitute forward - looking statements within the meaning of the Private Securities Litigation Reform Act of 1995 . Such forward - looking statements are subject to numerous conditions, many of which are beyond the Company’s control, including those set forth in the Risk Factors section of the Company’s IPO registration statement for its initial public offering, as filed with the Securities and Exchange Commission (SEC) on April 14 , 2021 , and the Company's Quarterly Report on Form 10 - Q, as filed with the SEC on May 27 , 2021 , copies of which are available on the SEC’s website at www . sec . gov , along with other Company filings made with the SEC from time to time . Actual results could differ materially from these forward - looking statements . The Company undertakes no obligation to update any forward - looking statements, except as required by law . Non - GAAP Measures The Company uses Adjusted EBITDA to measure its financial performance . Adjusted EBITDA is a supplemental non - GAAP financial measure of operating performance and is not based on any standardized methodology prescribed by GAAP . Adjusted EBITDA should not be considered in isolation or as alternatives to net income, cash flows from operating activities or other measures determined in accordance with GAAP . Also, Adjusted EBITDA is not necessarily comparable to similarly titled measures presented by other companies . 2

K ARAT P ACKAGING : H ISTORY OF G ROWTH AND S UCCESS Founded as Lollicup USA Inc. in San Gabriel, CA to establish bubble tea stores nationwide Lollicup’s business expanded to the sale and distribution of foodservice supplies Lollicup grew to more than 60 stores from a single store in 2000 Sold the retail tea business to focus on distribution of packaging and supplies Began manufacturing products under the Karat brand in the Chino, CA facility E - Commerce website established at www.lollicupstore.com Established Karat Earth® as an eco - friendly line of foodservice products Karat Packaging Inc. incorporated with Lollicup as its wholly - owned subsidiary Rockwall, TX facility opened 2000 2004 2006 2008 2013 2014 2018 2019 2020 Branchburg, NJ facility opened 2021 Pacific Cup acquired IPO completed Consistently growing, specialty distributor of disposable foodservice products for the foodservice industry, with a mission to become the single - source provider to customers for all their disposable foodservice products and related needs 3

$46 $60 $73 $100 $122 $140 $175 $225 $296 2012 2013 2014 2015 2016 2017 2018 2019 2020 D ISTINGUISHING C HARACTERISTICS Strong Revenue Growth Competitive Strengths Key Stats 26.2% 2012 - 2020 Revenue CAGR >50,000 Customers 12.2% 2020 EBITDA margin (1) 150+ Suppliers 99% Customer Retention 6 Locations (1) EBITDA margin reflects non - GAAP financial measure. ($ in millions) ▪ One - stop shop, with broad product offerings - food and take out containers, bags, tableware, cups, lids, cutlery, straws, specialty beverage ingredients, equipment, gloves and more ▪ Focus on distribution and advanced logistics network, complemented by flexible manufacturing capabilities ▪ Karat Earth® line provides environmentally friendly options to address sustainability ▪ Customized solutions, including new product development, design, printing and logistics services ▪ Diverse and growing blue - chip customer base 4
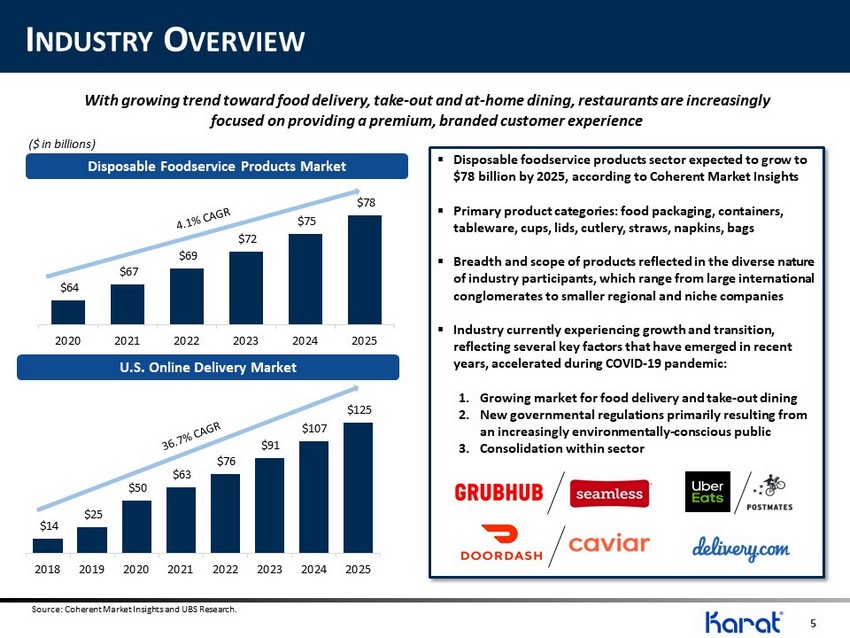
$64 $67 $69 $72 $75 $78 2020 2021 2022 2023 2024 2025 I NDUSTRY O VERVIEW $14 $25 $50 $63 $76 $91 $107 $125 2018 2019 2020 2021 2022 2023 2024 2025 Disposable Foodservice Products Market U.S. Online Delivery Market ($ in billions) With growing trend toward food delivery, take - out and at - home dining, restaurants are increasingly focused on providing a premium, branded customer experience ▪ Disposable foodservice products sector expected to grow to $78 billion by 2025, according to Coherent Market Insights ▪ Primary product categories: food packaging, containers, tableware, cups, lids, cutlery, straws, napkins, bags ▪ Breadth and scope of products reflected in the diverse nature of industry participants, which range from large international conglomerates to smaller regional and niche companies ▪ Industry currently experiencing growth and transition, reflecting several key factors that have emerged in recent years, accelerated during COVID - 19 pandemic: 1. Growing market for food delivery and take - out dining 2. New governmental regulations primarily resulting from an increasingly environmentally - conscious public 3. Consolidation within sector Source: Coherent Market Insights and UBS Research. 5

O NE - S TOP - S HOP , B ROAD P RODUCT O FFERING Recent New Products Karat Products: Wide selection of high - quality, single - use disposable products, including food and take - out containers, bags, tableware, cups, lids, cutlery and straws, which can also be custom printed Karat Earth ® Products: Sustainable, ethically - sourced product line includes food and take - out containers, bags, tableware, cups, lids, cutlery and straws, which can also be custom printed Paper Shopping Bags Compostable Hinged Containers Utensil Kits SOS Paper Bags Packaging Supplies Air Film Air Seal Equipment 100 New Take Out Box SKUs Labels Upcoming Products 6

Revenue Mix (1) Distribution Manufacturing F OCUS ON D ISTRIBUTION AND A DVANCED L OGISTICS Opened 2019 Opened July 2020 Investment in 2021 (1) Figure for 12 months ended December 31, 2020. Growing fleet of 25+ trucks and 25+ drivers resulting in efficient nationwide distribution network serving major metropolitan areas Complementary operating platform allows Karat to leverage its supplier network and manufacturing footprint to provide customers broadest product offering and customized alternatives 86% 14% Acquired in 2021 HAWAII 7

D IVERSE AND G ROWING B LUE C HIP C USTOMER B ASE Distributors (53% of LTM Revenue) Online (12% of LTM Revenue) Retail (12% of LTM Revenue) Note: % Revenue by Customer Type as of LTM 12/31/20. National Chains (23% of LTM Revenue) Fast Casual Fast Food *Key Growth Area • Grow our wallet share by supplying customers with a broader range of our foodservice disposables and related products Customer base grew 150% to more than 50,000 as of December 31, 2020, from 20,000 in 2019 *Key Growth Area • Grow online distribution channel www.lollicupstore.com by upgrading website and rolling out mobile app 8

D ISRUPTING T RADITIONAL F OODSERVICE S UPPLY C HAIN ▪ Different substrates have different manufacturers ▪ Manufacturers sell through a multi - layer distribution network before the product reaches end customer ▪ Primarily compete with manufacturers having large installed base of equipment and unable to react to changing customer needs vs. Traditional Suppliers x Broad product offering sourced globally at competitive prices x Ability to supply customers directly, eliminating multi - step supply chain x Broad offering that can “fill - the - truck” efficiently x Focus on supplying environmentally friendly products x Frequent introduction of new, high - demand products x Ability to innovate and provide customized products x National footprint to be more responsive to customers x Multiple channels to market drive economies of scale Karat Packaging growth expected to outpace industry, given: 1. Increase of sales of high - demand items, including take - out containers and bags 2. Ability to continuously augment product offering to address customer needs 3. Avoidance of product categories in decline, including Styrofoam and other materials in the process of being banned under various governmental regulations 9

G ROWTH S TRATEGY x Continue to build online distribution channel x Disrupt traditional foodservice supply chain x Grow base business with incremental revenue from existing customers x Expand with new customers via new capabilities, geographies, products, services and end markets x Execute on operational initiatives to drive margin expansion x Pursue strategic acquisitions 10
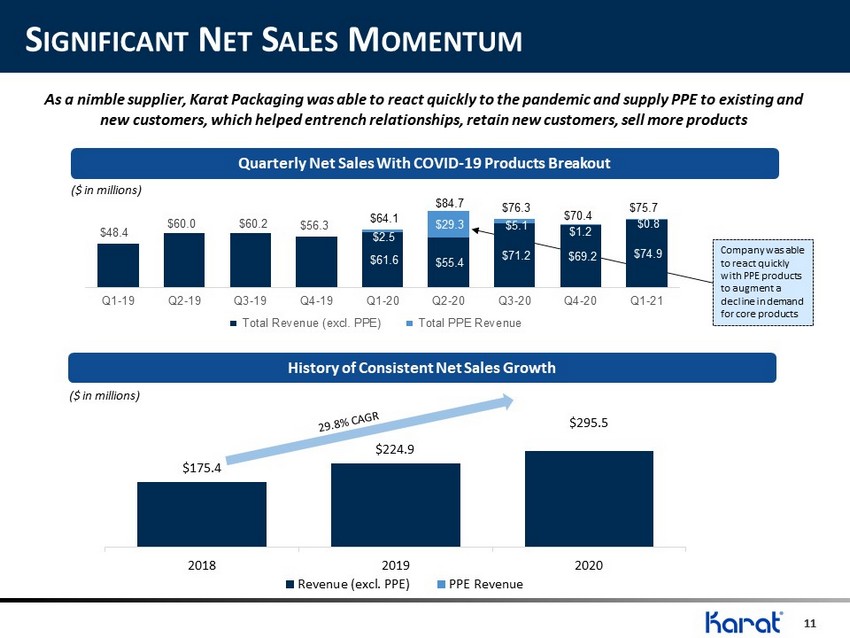
S IGNIFICANT N ET S ALES M OMENTUM Quarterly Net Sales With COVID - 19 Products Breakout As a nimble supplier, Karat Packaging was able to react quickly to the pandemic and supply PPE to existing and new customers, which helped entrench relationships, retain new customers, sell more products Company was able to react quickly with PPE products to augment a decline in demand for core products $175.4 $224.9 $295.5 2018 2019 2020 Revenue (excl. PPE) PPE Revenue History of Consistent Net Sales Growth ($ in millions) ($ in millions) $48.4 $60.0 $60.2 $56.3 $61.6 $55.4 $71.2 $69.2 $74.9 $2.5 $29.3 $5.1 $1.2 $0.8 Q1-19 Q2-19 Q3-19 Q4-19 Q1-20 Q2-20 Q3-20 Q4-20 Q1-21 Total Revenue (excl. PPE) Total PPE Revenue $64.1 $84.7 $76.3 $70.4 $75.7 11
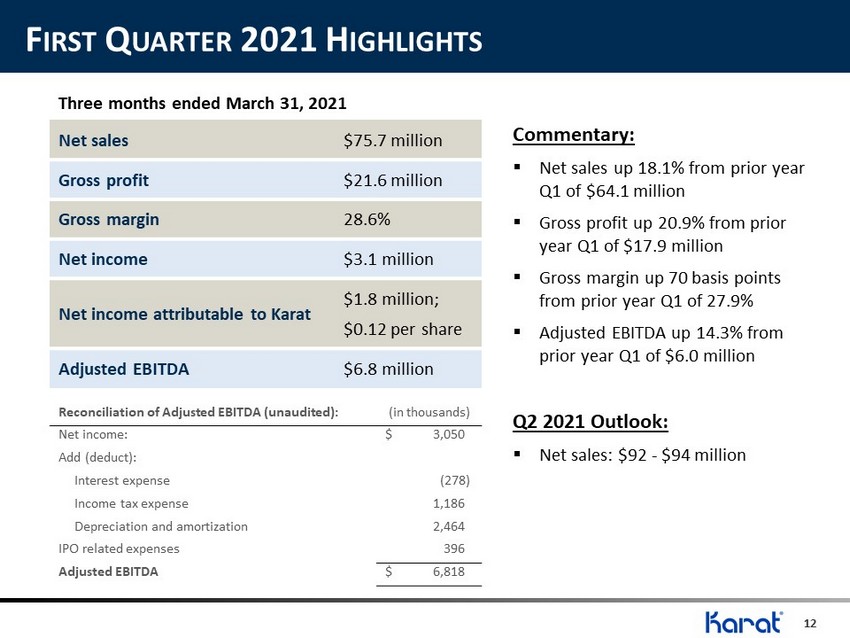
F IRST Q UARTER 2021 H IGHLIGHTS 12 Commentary: ▪ Net sales up 18.1% from prior year Q1 of $64.1 million ▪ Gross profit up 20.9% from prior year Q1 of $17.9 million ▪ Gross margin up 70 basis points from prior year Q1 of 27.9% ▪ Adjusted EBITDA up 14.3% from prior year Q1 of $6.0 million Q2 2021 Outlook: ▪ Net sales: $92 - $94 million Net sales $75.7 million Gross profit $21.6 million Gross margin 28.6% Net income $3.1 million Net income attributable to Karat $1.8 million; $0.12 per share Adjusted EBITDA $6.8 million Three months ended March 31, 2021 Reconciliation of Adjusted EBITDA (unaudited): (in thousands) Net income: $ 3,050 Add (deduct): Interest expense (278) Income tax expense 1,186 Depreciation and amortization 2,464 IPO related expenses 396 Adjusted EBITDA $ 6,818

G ROWTH O BJECTIVES Annual Revenue Growth Margin Expansion Capital Allocation ~15% revenue growth ~29 – 31% gross margin M&A and growth projects ~30% CAGR (1) ~28% gross margin (2) Capital expenditures for build - out of Rockwall and Branchburg facilities Historical 3 - 5 Year Target (1) CAGR from 2018 to 2020. (2) Gross margin average from 2018 to 2020. 13

W HY I NVEST IN K ARAT P ACKAGING ? x Building on a history of proven success x Initiatives in place to drive profitable growth from existing and new customers x Strong upside potential , long - term and near - term, as restaurant and foodservice sectors re - emerge from pandemic x Highly nimble sourcing capabilities combine with manufacturing flexibility to provide customized products to customers directly, with short lead times x Ability to continuously augment product offering to address changing customer needs 14

Q UESTIONS ?